Scotch-Irish vs Subsaharan African Disability Age 35 to 64
COMPARE
Scotch-Irish
Subsaharan African
Disability Age 35 to 64
Disability Age 35 to 64 Comparison
Scotch-Irish
Sub-Saharan Africans
13.0%
DISABILITY AGE 35 TO 64
0.1/ 100
METRIC RATING
281st/ 347
METRIC RANK
12.6%
DISABILITY AGE 35 TO 64
0.2/ 100
METRIC RATING
267th/ 347
METRIC RANK
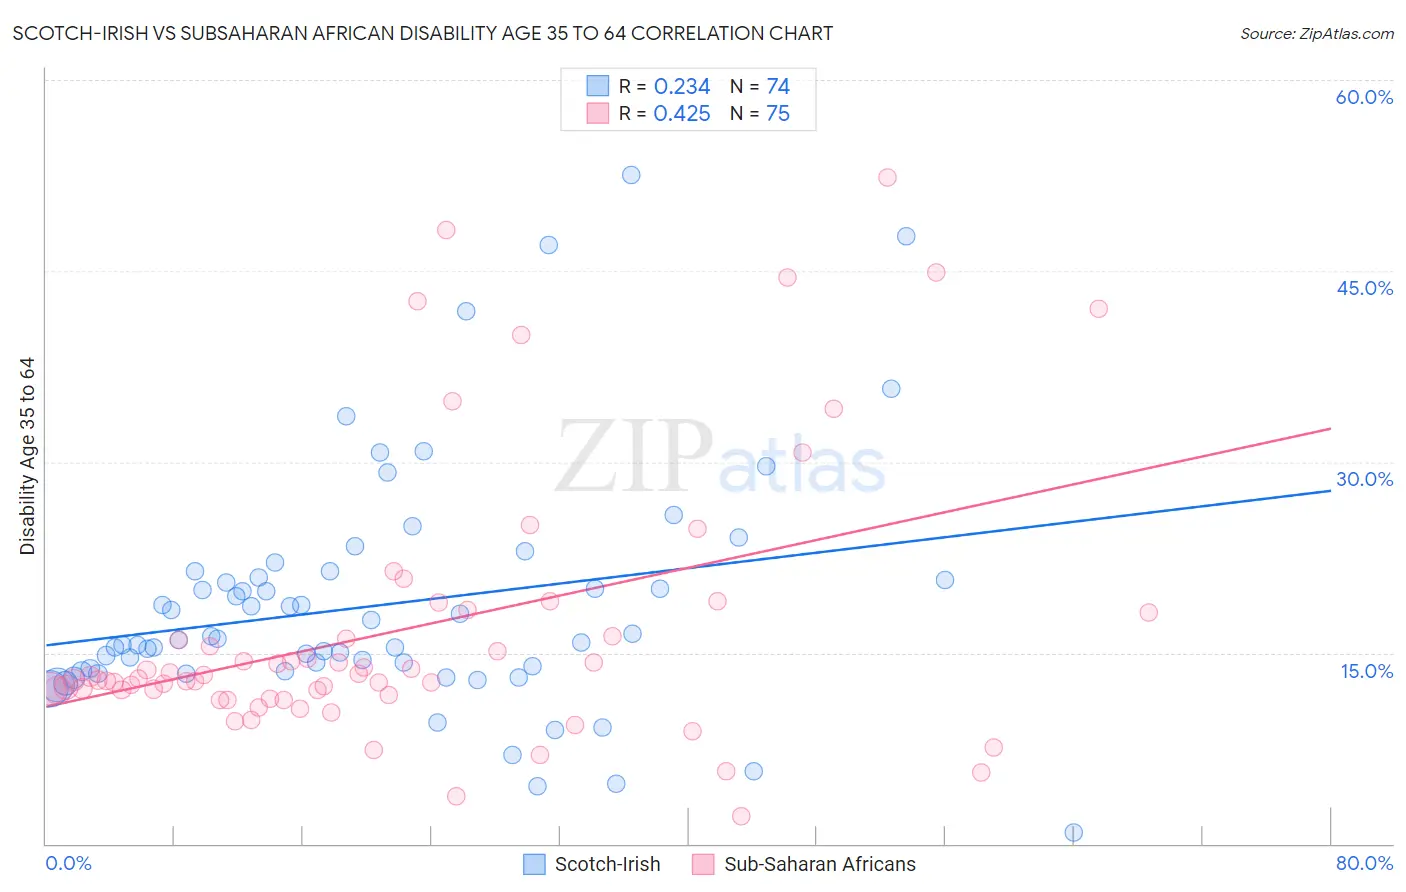
Scotch-Irish vs Subsaharan African Disability Age 35 to 64 Correlation Chart
The statistical analysis conducted on geographies consisting of 548,060,326 people shows a weak positive correlation between the proportion of Scotch-Irish and percentage of population with a disability between the ages 34 and 64 in the United States with a correlation coefficient (R) of 0.234 and weighted average of 13.0%. Similarly, the statistical analysis conducted on geographies consisting of 507,479,662 people shows a moderate positive correlation between the proportion of Sub-Saharan Africans and percentage of population with a disability between the ages 34 and 64 in the United States with a correlation coefficient (R) of 0.425 and weighted average of 12.6%, a difference of 2.5%.
Disability Age 35 to 64 Correlation Summary
| Measurement | Scotch-Irish | Subsaharan African |
| Minimum | 0.87% | 2.2% |
| Maximum | 52.5% | 52.4% |
| Range | 51.7% | 50.2% |
| Mean | 18.7% | 16.8% |
| Median | 16.1% | 12.9% |
| Interquartile 25% (IQ1) | 13.6% | 11.6% |
| Interquartile 75% (IQ3) | 20.9% | 18.2% |
| Interquartile Range (IQR) | 7.3% | 6.5% |
| Standard Deviation (Sample) | 9.4% | 10.7% |
| Standard Deviation (Population) | 9.4% | 10.7% |
Demographics Similar to Scotch-Irish and Sub-Saharan Africans by Disability Age 35 to 64
In terms of disability age 35 to 64, the demographic groups most similar to Scotch-Irish are Immigrants from Laos (13.0%, a difference of 0.090%), Liberian (12.9%, a difference of 0.20%), Immigrants from Micronesia (12.9%, a difference of 0.36%), French Canadian (12.9%, a difference of 0.39%), and Immigrants from Dominican Republic (12.9%, a difference of 0.42%). Similarly, the demographic groups most similar to Sub-Saharan Africans are White/Caucasian (12.6%, a difference of 0.16%), Immigrants from Dominica (12.7%, a difference of 0.18%), Spanish (12.7%, a difference of 0.28%), French (12.7%, a difference of 0.33%), and Marshallese (12.5%, a difference of 0.86%).
| Demographics | Rating | Rank | Disability Age 35 to 64 |
| Immigrants | Portugal | 0.4 /100 | #264 | Tragic 12.5% |
| Marshallese | 0.4 /100 | #265 | Tragic 12.5% |
| Whites/Caucasians | 0.3 /100 | #266 | Tragic 12.6% |
| Sub-Saharan Africans | 0.2 /100 | #267 | Tragic 12.6% |
| Immigrants | Dominica | 0.2 /100 | #268 | Tragic 12.7% |
| Spanish | 0.2 /100 | #269 | Tragic 12.7% |
| French | 0.2 /100 | #270 | Tragic 12.7% |
| Nepalese | 0.1 /100 | #271 | Tragic 12.8% |
| U.S. Virgin Islanders | 0.1 /100 | #272 | Tragic 12.8% |
| Pennsylvania Germans | 0.1 /100 | #273 | Tragic 12.8% |
| Celtics | 0.1 /100 | #274 | Tragic 12.9% |
| Dominicans | 0.1 /100 | #275 | Tragic 12.9% |
| Somalis | 0.1 /100 | #276 | Tragic 12.9% |
| Immigrants | Dominican Republic | 0.1 /100 | #277 | Tragic 12.9% |
| French Canadians | 0.1 /100 | #278 | Tragic 12.9% |
| Immigrants | Micronesia | 0.1 /100 | #279 | Tragic 12.9% |
| Liberians | 0.1 /100 | #280 | Tragic 12.9% |
| Scotch-Irish | 0.1 /100 | #281 | Tragic 13.0% |
| Immigrants | Laos | 0.1 /100 | #282 | Tragic 13.0% |
| Central American Indians | 0.0 /100 | #283 | Tragic 13.0% |
| Immigrants | Nonimmigrants | 0.0 /100 | #284 | Tragic 13.0% |