Scotch-Irish vs Swiss Disability Age 35 to 64
COMPARE
Scotch-Irish
Swiss
Disability Age 35 to 64
Disability Age 35 to 64 Comparison
Scotch-Irish
Swiss
13.0%
DISABILITY AGE 35 TO 64
0.1/ 100
METRIC RATING
281st/ 347
METRIC RANK
11.6%
DISABILITY AGE 35 TO 64
18.7/ 100
METRIC RATING
200th/ 347
METRIC RANK
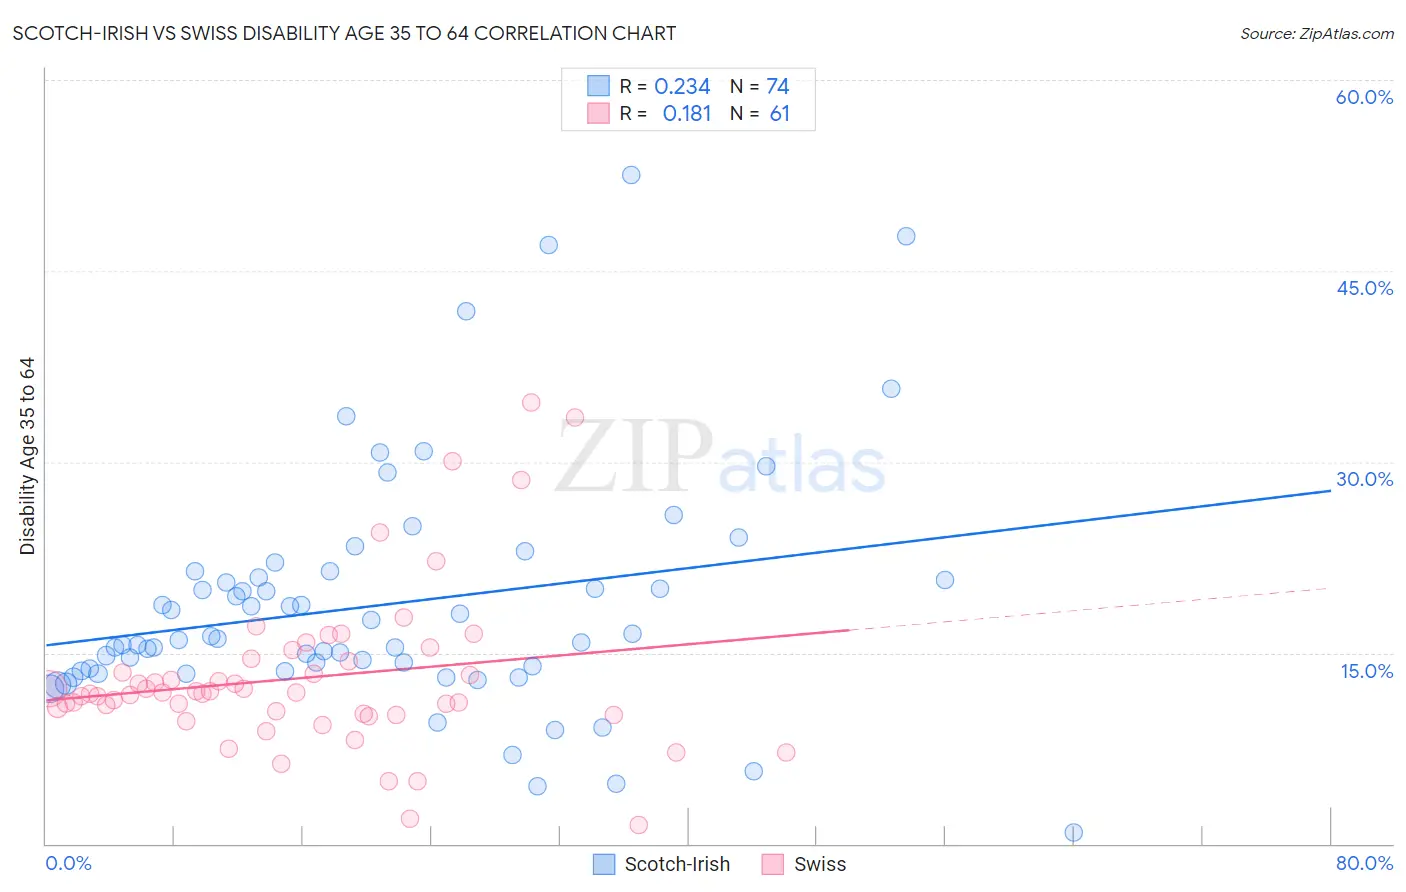
Scotch-Irish vs Swiss Disability Age 35 to 64 Correlation Chart
The statistical analysis conducted on geographies consisting of 548,060,326 people shows a weak positive correlation between the proportion of Scotch-Irish and percentage of population with a disability between the ages 34 and 64 in the United States with a correlation coefficient (R) of 0.234 and weighted average of 13.0%. Similarly, the statistical analysis conducted on geographies consisting of 464,639,334 people shows a poor positive correlation between the proportion of Swiss and percentage of population with a disability between the ages 34 and 64 in the United States with a correlation coefficient (R) of 0.181 and weighted average of 11.6%, a difference of 11.7%.
Disability Age 35 to 64 Correlation Summary
| Measurement | Scotch-Irish | Swiss |
| Minimum | 0.87% | 1.5% |
| Maximum | 52.5% | 34.6% |
| Range | 51.7% | 33.2% |
| Mean | 18.7% | 13.0% |
| Median | 16.1% | 11.8% |
| Interquartile 25% (IQ1) | 13.6% | 10.2% |
| Interquartile 75% (IQ3) | 20.9% | 14.4% |
| Interquartile Range (IQR) | 7.3% | 4.2% |
| Standard Deviation (Sample) | 9.4% | 6.4% |
| Standard Deviation (Population) | 9.4% | 6.3% |
Similar Demographics by Disability Age 35 to 64
Demographics Similar to Scotch-Irish by Disability Age 35 to 64
In terms of disability age 35 to 64, the demographic groups most similar to Scotch-Irish are Immigrants from Laos (13.0%, a difference of 0.090%), Liberian (12.9%, a difference of 0.20%), Immigrants from Micronesia (12.9%, a difference of 0.36%), French Canadian (12.9%, a difference of 0.39%), and Immigrants from Dominican Republic (12.9%, a difference of 0.42%).
| Demographics | Rating | Rank | Disability Age 35 to 64 |
| Celtics | 0.1 /100 | #274 | Tragic 12.9% |
| Dominicans | 0.1 /100 | #275 | Tragic 12.9% |
| Somalis | 0.1 /100 | #276 | Tragic 12.9% |
| Immigrants | Dominican Republic | 0.1 /100 | #277 | Tragic 12.9% |
| French Canadians | 0.1 /100 | #278 | Tragic 12.9% |
| Immigrants | Micronesia | 0.1 /100 | #279 | Tragic 12.9% |
| Liberians | 0.1 /100 | #280 | Tragic 12.9% |
| Scotch-Irish | 0.1 /100 | #281 | Tragic 13.0% |
| Immigrants | Laos | 0.1 /100 | #282 | Tragic 13.0% |
| Central American Indians | 0.0 /100 | #283 | Tragic 13.0% |
| Immigrants | Nonimmigrants | 0.0 /100 | #284 | Tragic 13.0% |
| Immigrants | Somalia | 0.0 /100 | #285 | Tragic 13.1% |
| Hmong | 0.0 /100 | #286 | Tragic 13.1% |
| Tlingit-Haida | 0.0 /100 | #287 | Tragic 13.2% |
| Fijians | 0.0 /100 | #288 | Tragic 13.2% |
Demographics Similar to Swiss by Disability Age 35 to 64
In terms of disability age 35 to 64, the demographic groups most similar to Swiss are Basque (11.6%, a difference of 0.10%), Immigrants from Kenya (11.6%, a difference of 0.13%), Immigrants from Guatemala (11.6%, a difference of 0.15%), Immigrants from Panama (11.6%, a difference of 0.21%), and British (11.6%, a difference of 0.22%).
| Demographics | Rating | Rank | Disability Age 35 to 64 |
| Immigrants | Africa | 29.0 /100 | #193 | Fair 11.5% |
| Immigrants | Latin America | 27.5 /100 | #194 | Fair 11.5% |
| Carpatho Rusyns | 25.3 /100 | #195 | Fair 11.5% |
| Iraqis | 24.2 /100 | #196 | Fair 11.5% |
| Immigrants | Iraq | 21.0 /100 | #197 | Fair 11.6% |
| Immigrants | Panama | 20.4 /100 | #198 | Fair 11.6% |
| Basques | 19.5 /100 | #199 | Poor 11.6% |
| Swiss | 18.7 /100 | #200 | Poor 11.6% |
| Immigrants | Kenya | 17.7 /100 | #201 | Poor 11.6% |
| Immigrants | Guatemala | 17.5 /100 | #202 | Poor 11.6% |
| British | 17.0 /100 | #203 | Poor 11.6% |
| Nigerians | 16.3 /100 | #204 | Poor 11.6% |
| Slavs | 15.5 /100 | #205 | Poor 11.7% |
| Native Hawaiians | 14.8 /100 | #206 | Poor 11.7% |
| Ghanaians | 14.8 /100 | #207 | Poor 11.7% |