Yuman vs Samoan Disability
COMPARE
Yuman
Samoan
Disability
Disability Comparison
Yuman
Samoans
14.6%
DISABILITY
0.0/ 100
METRIC RATING
334th/ 347
METRIC RANK
12.2%
DISABILITY
2.6/ 100
METRIC RATING
230th/ 347
METRIC RANK
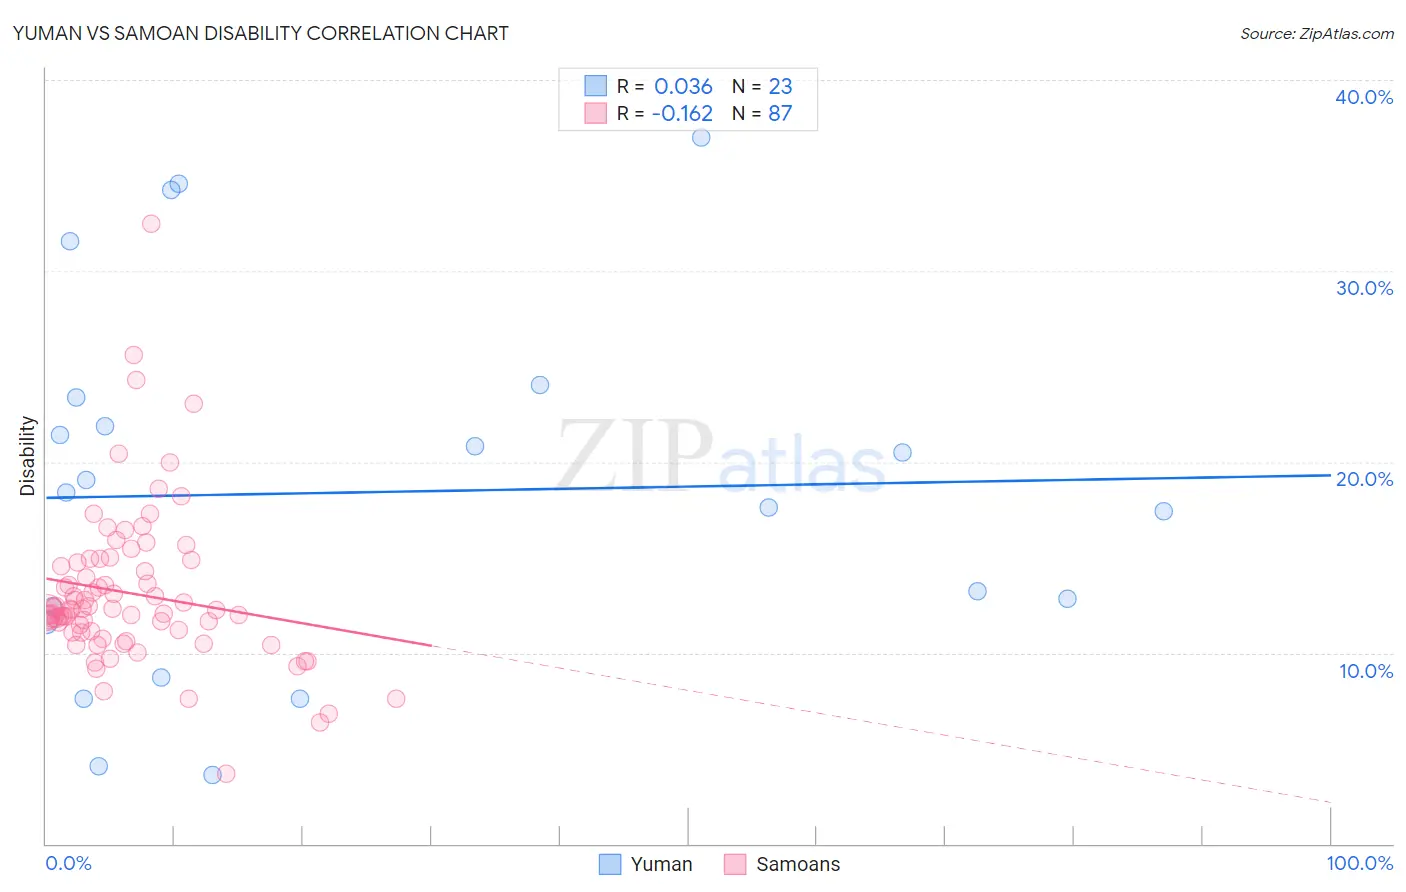
Yuman vs Samoan Disability Correlation Chart
The statistical analysis conducted on geographies consisting of 40,663,643 people shows no correlation between the proportion of Yuman and percentage of population with a disability in the United States with a correlation coefficient (R) of 0.036 and weighted average of 14.6%. Similarly, the statistical analysis conducted on geographies consisting of 225,125,318 people shows a poor negative correlation between the proportion of Samoans and percentage of population with a disability in the United States with a correlation coefficient (R) of -0.162 and weighted average of 12.2%, a difference of 20.1%.
Disability Correlation Summary
| Measurement | Yuman | Samoan |
| Minimum | 3.6% | 3.6% |
| Maximum | 37.0% | 32.5% |
| Range | 33.4% | 28.8% |
| Mean | 18.4% | 13.1% |
| Median | 18.4% | 12.3% |
| Interquartile 25% (IQ1) | 11.6% | 11.1% |
| Interquartile 75% (IQ3) | 23.4% | 14.7% |
| Interquartile Range (IQR) | 11.8% | 3.6% |
| Standard Deviation (Sample) | 9.6% | 4.1% |
| Standard Deviation (Population) | 9.4% | 4.1% |
Similar Demographics by Disability
Demographics Similar to Yuman by Disability
In terms of disability, the demographic groups most similar to Yuman are Cajun (14.6%, a difference of 0.12%), Tohono O'odham (14.8%, a difference of 1.0%), Pueblo (14.4%, a difference of 1.2%), Alaskan Athabascan (14.4%, a difference of 1.2%), and Cherokee (14.8%, a difference of 1.5%).
| Demographics | Rating | Rank | Disability |
| Ottawa | 0.0 /100 | #327 | Tragic 14.2% |
| Immigrants | Azores | 0.0 /100 | #328 | Tragic 14.2% |
| Potawatomi | 0.0 /100 | #329 | Tragic 14.2% |
| Navajo | 0.0 /100 | #330 | Tragic 14.3% |
| Alaskan Athabascans | 0.0 /100 | #331 | Tragic 14.4% |
| Pueblo | 0.0 /100 | #332 | Tragic 14.4% |
| Cajuns | 0.0 /100 | #333 | Tragic 14.6% |
| Yuman | 0.0 /100 | #334 | Tragic 14.6% |
| Tohono O'odham | 0.0 /100 | #335 | Tragic 14.8% |
| Cherokee | 0.0 /100 | #336 | Tragic 14.8% |
| Seminole | 0.0 /100 | #337 | Tragic 14.9% |
| Dutch West Indians | 0.0 /100 | #338 | Tragic 14.9% |
| Chickasaw | 0.0 /100 | #339 | Tragic 15.2% |
| Choctaw | 0.0 /100 | #340 | Tragic 15.4% |
| Lumbee | 0.0 /100 | #341 | Tragic 15.5% |
Demographics Similar to Samoans by Disability
In terms of disability, the demographic groups most similar to Samoans are Malaysian (12.2%, a difference of 0.030%), Italian (12.2%, a difference of 0.040%), Inupiat (12.2%, a difference of 0.080%), West Indian (12.2%, a difference of 0.10%), and Bahamian (12.2%, a difference of 0.13%).
| Demographics | Rating | Rank | Disability |
| Hispanics or Latinos | 3.9 /100 | #223 | Tragic 12.1% |
| Mexicans | 3.7 /100 | #224 | Tragic 12.1% |
| Senegalese | 3.5 /100 | #225 | Tragic 12.1% |
| Jamaicans | 3.3 /100 | #226 | Tragic 12.1% |
| Alsatians | 3.3 /100 | #227 | Tragic 12.1% |
| West Indians | 2.9 /100 | #228 | Tragic 12.2% |
| Inupiat | 2.8 /100 | #229 | Tragic 12.2% |
| Samoans | 2.6 /100 | #230 | Tragic 12.2% |
| Malaysians | 2.5 /100 | #231 | Tragic 12.2% |
| Italians | 2.5 /100 | #232 | Tragic 12.2% |
| Bahamians | 2.3 /100 | #233 | Tragic 12.2% |
| Japanese | 2.3 /100 | #234 | Tragic 12.2% |
| Yup'ik | 2.2 /100 | #235 | Tragic 12.2% |
| Chinese | 2.0 /100 | #236 | Tragic 12.2% |
| Immigrants | Congo | 1.9 /100 | #237 | Tragic 12.2% |