Yuman vs Arapaho Disability
COMPARE
Yuman
Arapaho
Disability
Disability Comparison
Yuman
Arapaho
14.6%
DISABILITY
0.0/ 100
METRIC RATING
334th/ 347
METRIC RANK
13.2%
DISABILITY
0.0/ 100
METRIC RATING
302nd/ 347
METRIC RANK
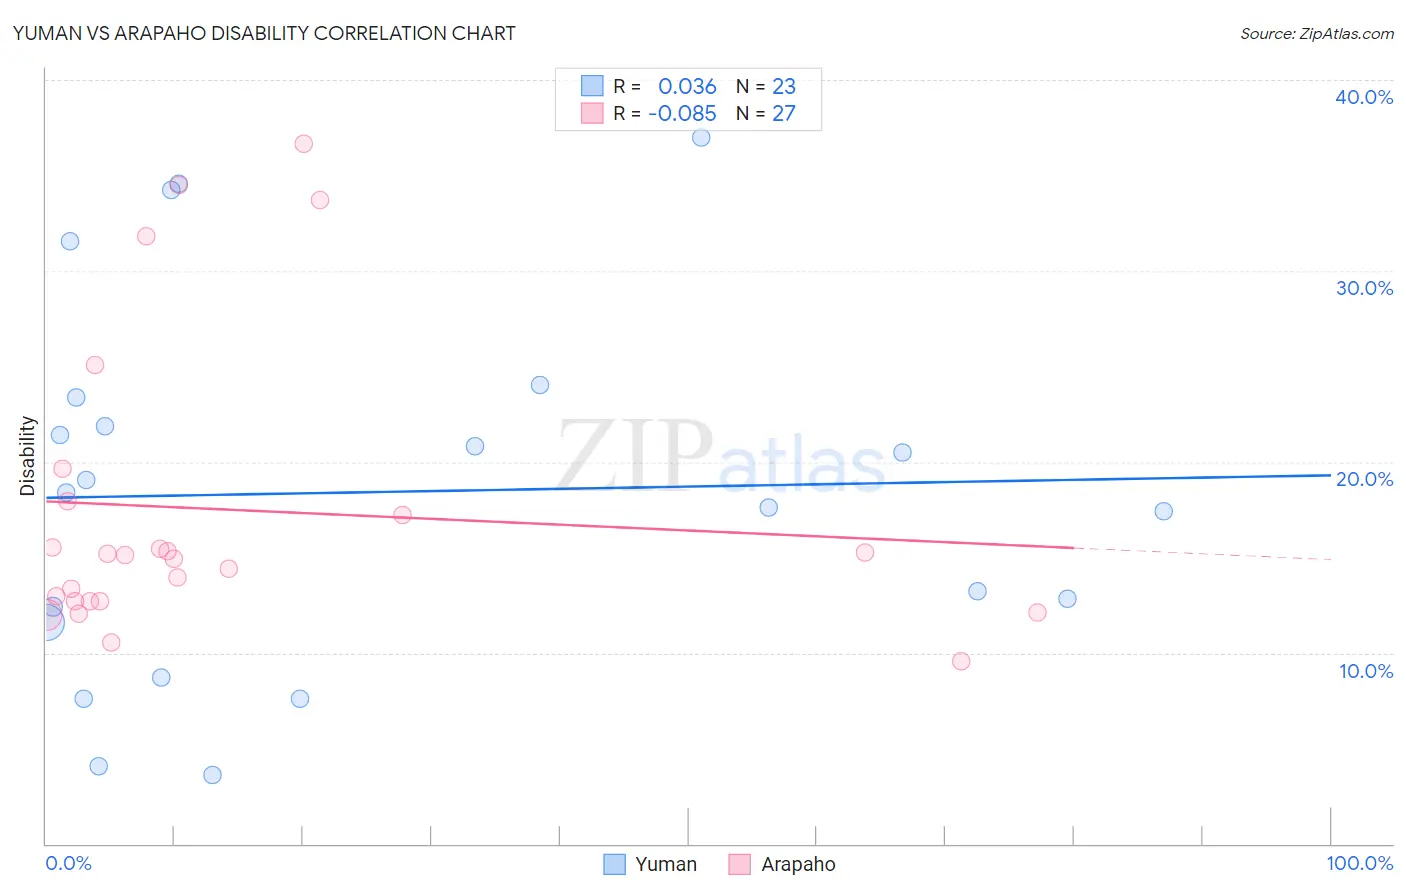
Yuman vs Arapaho Disability Correlation Chart
The statistical analysis conducted on geographies consisting of 40,663,643 people shows no correlation between the proportion of Yuman and percentage of population with a disability in the United States with a correlation coefficient (R) of 0.036 and weighted average of 14.6%. Similarly, the statistical analysis conducted on geographies consisting of 29,780,325 people shows a slight negative correlation between the proportion of Arapaho and percentage of population with a disability in the United States with a correlation coefficient (R) of -0.085 and weighted average of 13.2%, a difference of 10.6%.
Disability Correlation Summary
| Measurement | Yuman | Arapaho |
| Minimum | 3.6% | 9.5% |
| Maximum | 37.0% | 36.7% |
| Range | 33.4% | 27.1% |
| Mean | 18.4% | 17.5% |
| Median | 18.4% | 15.1% |
| Interquartile 25% (IQ1) | 11.6% | 12.7% |
| Interquartile 75% (IQ3) | 23.4% | 17.9% |
| Interquartile Range (IQR) | 11.8% | 5.2% |
| Standard Deviation (Sample) | 9.6% | 7.7% |
| Standard Deviation (Population) | 9.4% | 7.6% |
Similar Demographics by Disability
Demographics Similar to Yuman by Disability
In terms of disability, the demographic groups most similar to Yuman are Cajun (14.6%, a difference of 0.12%), Tohono O'odham (14.8%, a difference of 1.0%), Pueblo (14.4%, a difference of 1.2%), Alaskan Athabascan (14.4%, a difference of 1.2%), and Cherokee (14.8%, a difference of 1.5%).
| Demographics | Rating | Rank | Disability |
| Ottawa | 0.0 /100 | #327 | Tragic 14.2% |
| Immigrants | Azores | 0.0 /100 | #328 | Tragic 14.2% |
| Potawatomi | 0.0 /100 | #329 | Tragic 14.2% |
| Navajo | 0.0 /100 | #330 | Tragic 14.3% |
| Alaskan Athabascans | 0.0 /100 | #331 | Tragic 14.4% |
| Pueblo | 0.0 /100 | #332 | Tragic 14.4% |
| Cajuns | 0.0 /100 | #333 | Tragic 14.6% |
| Yuman | 0.0 /100 | #334 | Tragic 14.6% |
| Tohono O'odham | 0.0 /100 | #335 | Tragic 14.8% |
| Cherokee | 0.0 /100 | #336 | Tragic 14.8% |
| Seminole | 0.0 /100 | #337 | Tragic 14.9% |
| Dutch West Indians | 0.0 /100 | #338 | Tragic 14.9% |
| Chickasaw | 0.0 /100 | #339 | Tragic 15.2% |
| Choctaw | 0.0 /100 | #340 | Tragic 15.4% |
| Lumbee | 0.0 /100 | #341 | Tragic 15.5% |
Demographics Similar to Arapaho by Disability
In terms of disability, the demographic groups most similar to Arapaho are Immigrants from Micronesia (13.2%, a difference of 0.21%), Pennsylvania German (13.2%, a difference of 0.29%), French (13.2%, a difference of 0.34%), Alaska Native (13.2%, a difference of 0.36%), and Hopi (13.2%, a difference of 0.37%).
| Demographics | Rating | Rank | Disability |
| Immigrants | Nonimmigrants | 0.0 /100 | #295 | Tragic 13.2% |
| Central American Indians | 0.0 /100 | #296 | Tragic 13.2% |
| Hopi | 0.0 /100 | #297 | Tragic 13.2% |
| Alaska Natives | 0.0 /100 | #298 | Tragic 13.2% |
| French | 0.0 /100 | #299 | Tragic 13.2% |
| Pennsylvania Germans | 0.0 /100 | #300 | Tragic 13.2% |
| Immigrants | Micronesia | 0.0 /100 | #301 | Tragic 13.2% |
| Arapaho | 0.0 /100 | #302 | Tragic 13.2% |
| Scotch-Irish | 0.0 /100 | #303 | Tragic 13.3% |
| Yakama | 0.0 /100 | #304 | Tragic 13.4% |
| French Canadians | 0.0 /100 | #305 | Tragic 13.4% |
| Cape Verdeans | 0.0 /100 | #306 | Tragic 13.5% |
| Shoshone | 0.0 /100 | #307 | Tragic 13.5% |
| French American Indians | 0.0 /100 | #308 | Tragic 13.5% |
| Tlingit-Haida | 0.0 /100 | #309 | Tragic 13.5% |