Yuman vs Egyptian Disability
COMPARE
Yuman
Egyptian
Disability
Disability Comparison
Yuman
Egyptians
14.6%
DISABILITY
0.0/ 100
METRIC RATING
334th/ 347
METRIC RANK
10.6%
DISABILITY
100.0/ 100
METRIC RATING
28th/ 347
METRIC RANK
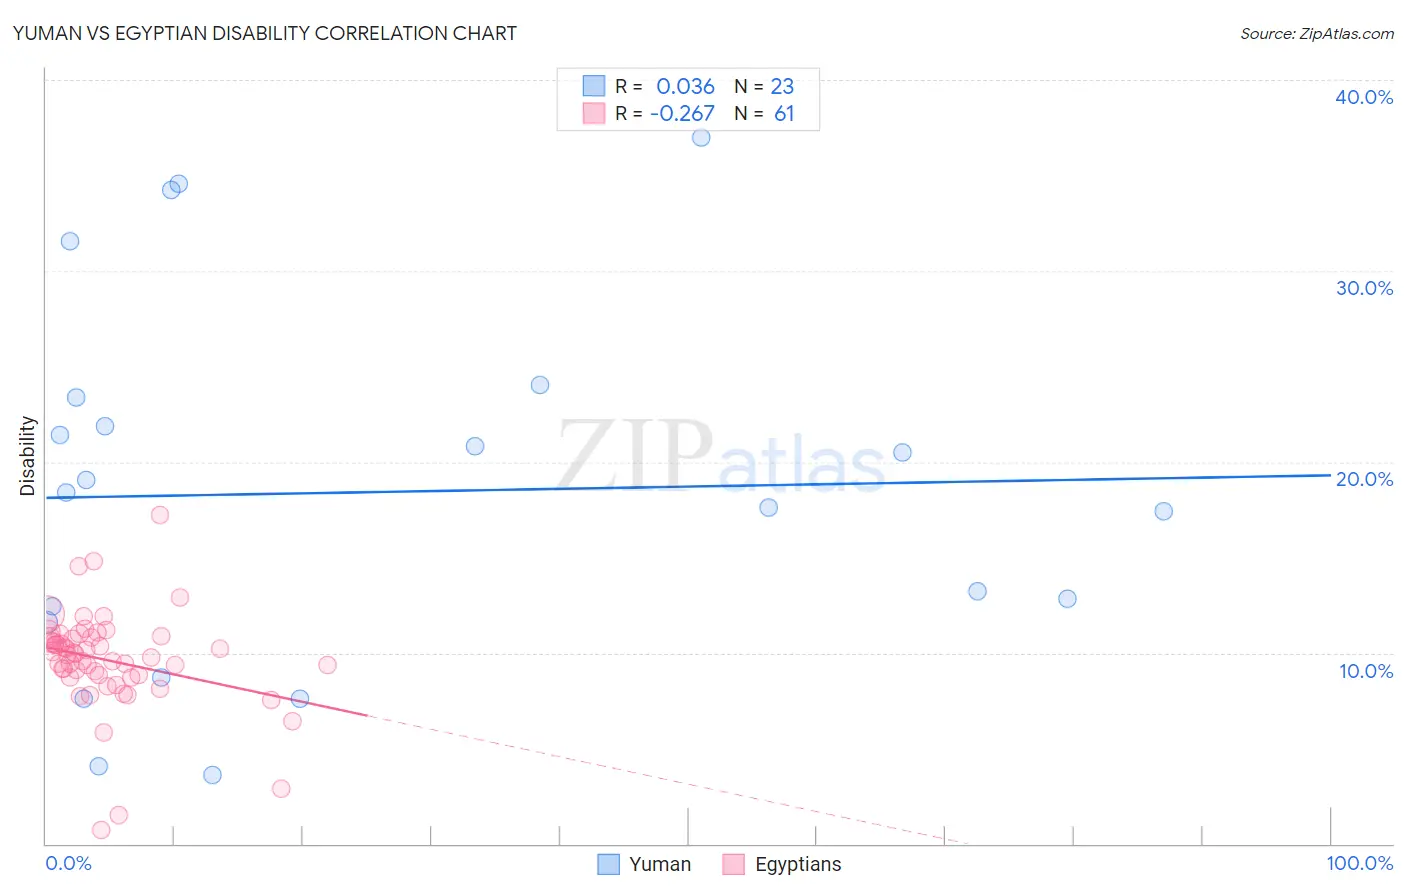
Yuman vs Egyptian Disability Correlation Chart
The statistical analysis conducted on geographies consisting of 40,663,643 people shows no correlation between the proportion of Yuman and percentage of population with a disability in the United States with a correlation coefficient (R) of 0.036 and weighted average of 14.6%. Similarly, the statistical analysis conducted on geographies consisting of 276,915,962 people shows a weak negative correlation between the proportion of Egyptians and percentage of population with a disability in the United States with a correlation coefficient (R) of -0.267 and weighted average of 10.6%, a difference of 37.9%.
Disability Correlation Summary
| Measurement | Yuman | Egyptian |
| Minimum | 3.6% | 0.75% |
| Maximum | 37.0% | 17.2% |
| Range | 33.4% | 16.5% |
| Mean | 18.4% | 9.6% |
| Median | 18.4% | 9.9% |
| Interquartile 25% (IQ1) | 11.6% | 8.8% |
| Interquartile 75% (IQ3) | 23.4% | 10.8% |
| Interquartile Range (IQR) | 11.8% | 2.0% |
| Standard Deviation (Sample) | 9.6% | 2.6% |
| Standard Deviation (Population) | 9.4% | 2.6% |
Similar Demographics by Disability
Demographics Similar to Yuman by Disability
In terms of disability, the demographic groups most similar to Yuman are Cajun (14.6%, a difference of 0.12%), Tohono O'odham (14.8%, a difference of 1.0%), Pueblo (14.4%, a difference of 1.2%), Alaskan Athabascan (14.4%, a difference of 1.2%), and Cherokee (14.8%, a difference of 1.5%).
| Demographics | Rating | Rank | Disability |
| Ottawa | 0.0 /100 | #327 | Tragic 14.2% |
| Immigrants | Azores | 0.0 /100 | #328 | Tragic 14.2% |
| Potawatomi | 0.0 /100 | #329 | Tragic 14.2% |
| Navajo | 0.0 /100 | #330 | Tragic 14.3% |
| Alaskan Athabascans | 0.0 /100 | #331 | Tragic 14.4% |
| Pueblo | 0.0 /100 | #332 | Tragic 14.4% |
| Cajuns | 0.0 /100 | #333 | Tragic 14.6% |
| Yuman | 0.0 /100 | #334 | Tragic 14.6% |
| Tohono O'odham | 0.0 /100 | #335 | Tragic 14.8% |
| Cherokee | 0.0 /100 | #336 | Tragic 14.8% |
| Seminole | 0.0 /100 | #337 | Tragic 14.9% |
| Dutch West Indians | 0.0 /100 | #338 | Tragic 14.9% |
| Chickasaw | 0.0 /100 | #339 | Tragic 15.2% |
| Choctaw | 0.0 /100 | #340 | Tragic 15.4% |
| Lumbee | 0.0 /100 | #341 | Tragic 15.5% |
Demographics Similar to Egyptians by Disability
In terms of disability, the demographic groups most similar to Egyptians are Cypriot (10.6%, a difference of 0.13%), Immigrants from Argentina (10.6%, a difference of 0.13%), Argentinean (10.6%, a difference of 0.14%), Immigrants from Malaysia (10.6%, a difference of 0.19%), and Immigrants from Turkey (10.6%, a difference of 0.28%).
| Demographics | Rating | Rank | Disability |
| Asians | 100.0 /100 | #21 | Exceptional 10.4% |
| Immigrants | Sri Lanka | 100.0 /100 | #22 | Exceptional 10.5% |
| Immigrants | Asia | 100.0 /100 | #23 | Exceptional 10.5% |
| Venezuelans | 100.0 /100 | #24 | Exceptional 10.5% |
| Immigrants | Malaysia | 100.0 /100 | #25 | Exceptional 10.6% |
| Argentineans | 100.0 /100 | #26 | Exceptional 10.6% |
| Cypriots | 100.0 /100 | #27 | Exceptional 10.6% |
| Egyptians | 100.0 /100 | #28 | Exceptional 10.6% |
| Immigrants | Argentina | 100.0 /100 | #29 | Exceptional 10.6% |
| Immigrants | Turkey | 100.0 /100 | #30 | Exceptional 10.6% |
| Immigrants | Egypt | 100.0 /100 | #31 | Exceptional 10.6% |
| Paraguayans | 100.0 /100 | #32 | Exceptional 10.6% |
| Immigrants | Kuwait | 100.0 /100 | #33 | Exceptional 10.7% |
| Immigrants | Ethiopia | 100.0 /100 | #34 | Exceptional 10.7% |
| Immigrants | Indonesia | 100.0 /100 | #35 | Exceptional 10.7% |