Yuman vs Pakistani Disability
COMPARE
Yuman
Pakistani
Disability
Disability Comparison
Yuman
Pakistanis
14.6%
DISABILITY
0.0/ 100
METRIC RATING
334th/ 347
METRIC RANK
11.7%
DISABILITY
54.7/ 100
METRIC RATING
166th/ 347
METRIC RANK
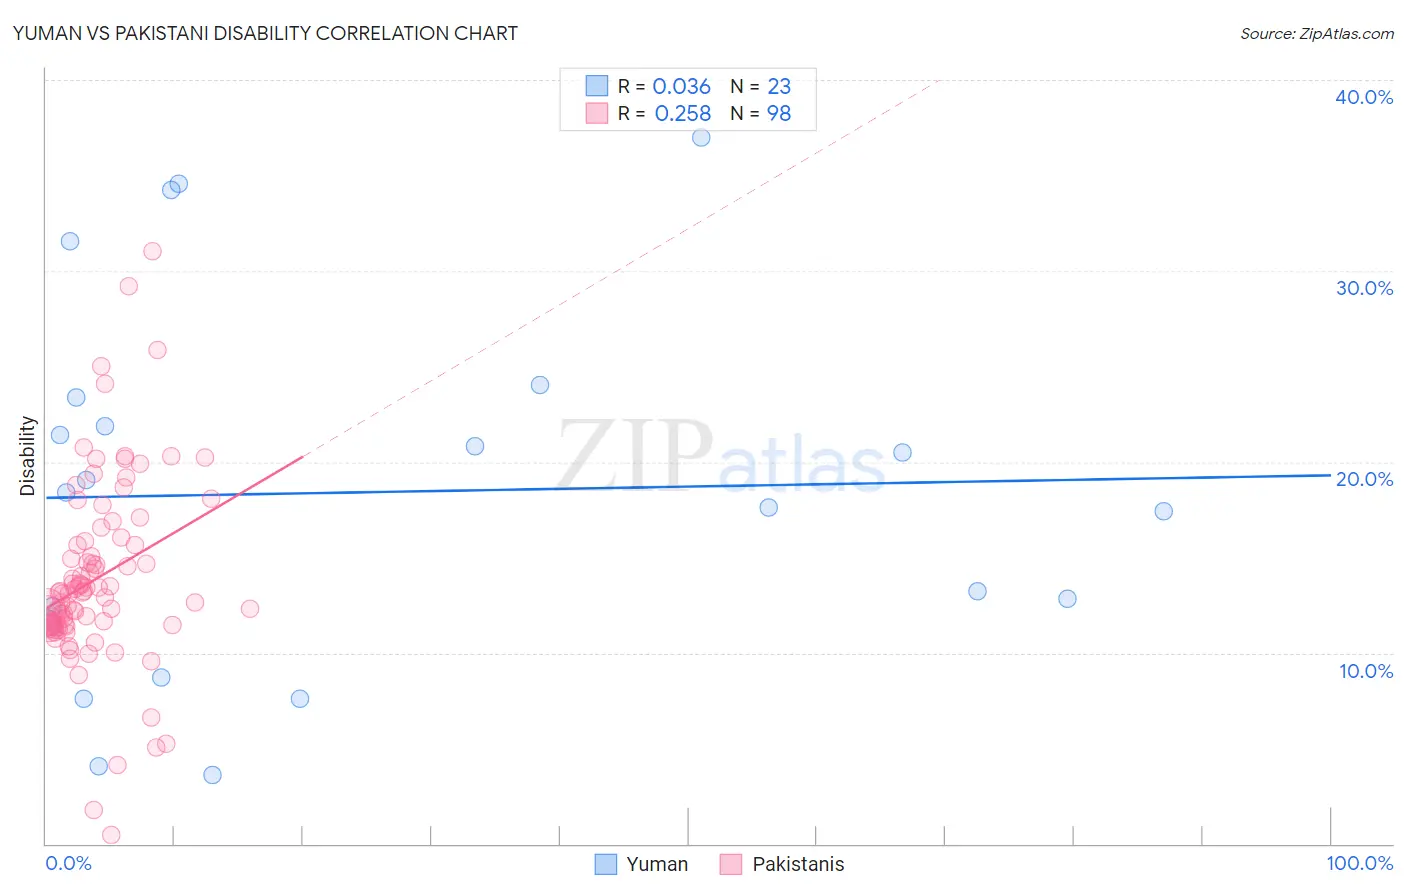
Yuman vs Pakistani Disability Correlation Chart
The statistical analysis conducted on geographies consisting of 40,663,643 people shows no correlation between the proportion of Yuman and percentage of population with a disability in the United States with a correlation coefficient (R) of 0.036 and weighted average of 14.6%. Similarly, the statistical analysis conducted on geographies consisting of 335,302,131 people shows a weak positive correlation between the proportion of Pakistanis and percentage of population with a disability in the United States with a correlation coefficient (R) of 0.258 and weighted average of 11.7%, a difference of 25.2%.
Disability Correlation Summary
| Measurement | Yuman | Pakistani |
| Minimum | 3.6% | 0.46% |
| Maximum | 37.0% | 31.1% |
| Range | 33.4% | 30.6% |
| Mean | 18.4% | 13.9% |
| Median | 18.4% | 13.1% |
| Interquartile 25% (IQ1) | 11.6% | 11.5% |
| Interquartile 75% (IQ3) | 23.4% | 15.7% |
| Interquartile Range (IQR) | 11.8% | 4.2% |
| Standard Deviation (Sample) | 9.6% | 4.9% |
| Standard Deviation (Population) | 9.4% | 4.8% |
Similar Demographics by Disability
Demographics Similar to Yuman by Disability
In terms of disability, the demographic groups most similar to Yuman are Cajun (14.6%, a difference of 0.12%), Tohono O'odham (14.8%, a difference of 1.0%), Pueblo (14.4%, a difference of 1.2%), Alaskan Athabascan (14.4%, a difference of 1.2%), and Cherokee (14.8%, a difference of 1.5%).
| Demographics | Rating | Rank | Disability |
| Ottawa | 0.0 /100 | #327 | Tragic 14.2% |
| Immigrants | Azores | 0.0 /100 | #328 | Tragic 14.2% |
| Potawatomi | 0.0 /100 | #329 | Tragic 14.2% |
| Navajo | 0.0 /100 | #330 | Tragic 14.3% |
| Alaskan Athabascans | 0.0 /100 | #331 | Tragic 14.4% |
| Pueblo | 0.0 /100 | #332 | Tragic 14.4% |
| Cajuns | 0.0 /100 | #333 | Tragic 14.6% |
| Yuman | 0.0 /100 | #334 | Tragic 14.6% |
| Tohono O'odham | 0.0 /100 | #335 | Tragic 14.8% |
| Cherokee | 0.0 /100 | #336 | Tragic 14.8% |
| Seminole | 0.0 /100 | #337 | Tragic 14.9% |
| Dutch West Indians | 0.0 /100 | #338 | Tragic 14.9% |
| Chickasaw | 0.0 /100 | #339 | Tragic 15.2% |
| Choctaw | 0.0 /100 | #340 | Tragic 15.4% |
| Lumbee | 0.0 /100 | #341 | Tragic 15.5% |
Demographics Similar to Pakistanis by Disability
In terms of disability, the demographic groups most similar to Pakistanis are Estonian (11.7%, a difference of 0.010%), Immigrants from Latin America (11.7%, a difference of 0.030%), Immigrants from Austria (11.7%, a difference of 0.060%), Immigrants from Albania (11.7%, a difference of 0.080%), and Cuban (11.7%, a difference of 0.090%).
| Demographics | Rating | Rank | Disability |
| Guatemalans | 65.1 /100 | #159 | Good 11.6% |
| Immigrants | Barbados | 64.2 /100 | #160 | Good 11.6% |
| Immigrants | Cuba | 62.8 /100 | #161 | Good 11.6% |
| Immigrants | Haiti | 59.2 /100 | #162 | Average 11.7% |
| Immigrants | Trinidad and Tobago | 58.9 /100 | #163 | Average 11.7% |
| Syrians | 58.5 /100 | #164 | Average 11.7% |
| Cubans | 56.7 /100 | #165 | Average 11.7% |
| Pakistanis | 54.7 /100 | #166 | Average 11.7% |
| Estonians | 54.4 /100 | #167 | Average 11.7% |
| Immigrants | Latin America | 54.1 /100 | #168 | Average 11.7% |
| Immigrants | Austria | 53.4 /100 | #169 | Average 11.7% |
| Immigrants | Albania | 52.8 /100 | #170 | Average 11.7% |
| Immigrants | Southern Europe | 52.8 /100 | #171 | Average 11.7% |
| Trinidadians and Tobagonians | 52.7 /100 | #172 | Average 11.7% |
| Maltese | 50.6 /100 | #173 | Average 11.7% |