Yuman vs Immigrants from South Central Asia Disability
COMPARE
Yuman
Immigrants from South Central Asia
Disability
Disability Comparison
Yuman
Immigrants from South Central Asia
14.6%
DISABILITY
0.0/ 100
METRIC RATING
334th/ 347
METRIC RANK
9.9%
DISABILITY
100.0/ 100
METRIC RATING
6th/ 347
METRIC RANK
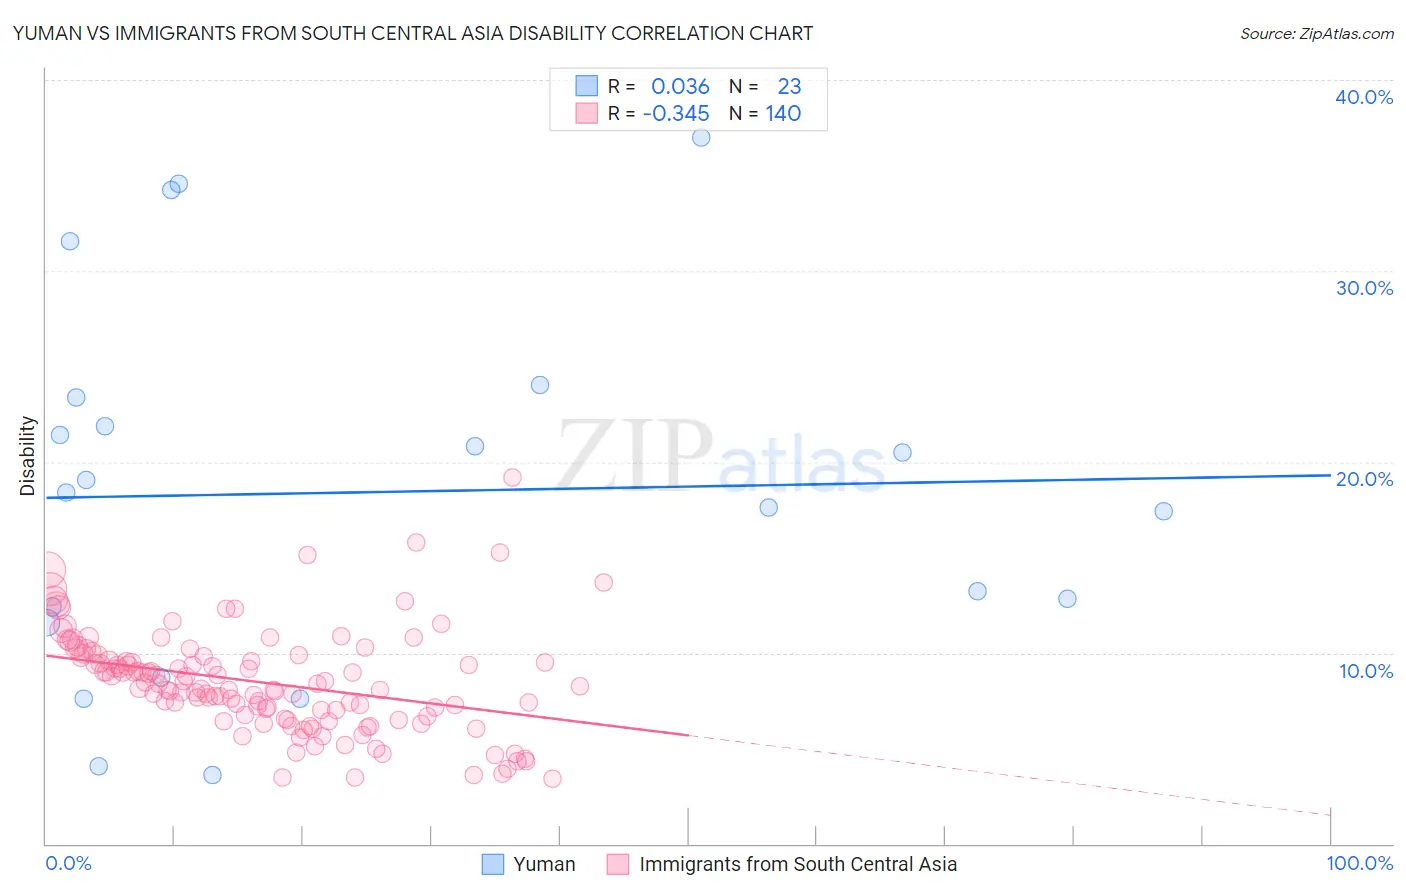
Yuman vs Immigrants from South Central Asia Disability Correlation Chart
The statistical analysis conducted on geographies consisting of 40,663,643 people shows no correlation between the proportion of Yuman and percentage of population with a disability in the United States with a correlation coefficient (R) of 0.036 and weighted average of 14.6%. Similarly, the statistical analysis conducted on geographies consisting of 473,067,496 people shows a mild negative correlation between the proportion of Immigrants from South Central Asia and percentage of population with a disability in the United States with a correlation coefficient (R) of -0.345 and weighted average of 9.9%, a difference of 46.9%.
Disability Correlation Summary
| Measurement | Yuman | Immigrants from South Central Asia |
| Minimum | 3.6% | 3.4% |
| Maximum | 37.0% | 19.2% |
| Range | 33.4% | 15.8% |
| Mean | 18.4% | 8.5% |
| Median | 18.4% | 8.3% |
| Interquartile 25% (IQ1) | 11.6% | 6.7% |
| Interquartile 75% (IQ3) | 23.4% | 9.8% |
| Interquartile Range (IQR) | 11.8% | 3.1% |
| Standard Deviation (Sample) | 9.6% | 2.7% |
| Standard Deviation (Population) | 9.4% | 2.7% |
Similar Demographics by Disability
Demographics Similar to Yuman by Disability
In terms of disability, the demographic groups most similar to Yuman are Cajun (14.6%, a difference of 0.12%), Tohono O'odham (14.8%, a difference of 1.0%), Pueblo (14.4%, a difference of 1.2%), Alaskan Athabascan (14.4%, a difference of 1.2%), and Cherokee (14.8%, a difference of 1.5%).
| Demographics | Rating | Rank | Disability |
| Ottawa | 0.0 /100 | #327 | Tragic 14.2% |
| Immigrants | Azores | 0.0 /100 | #328 | Tragic 14.2% |
| Potawatomi | 0.0 /100 | #329 | Tragic 14.2% |
| Navajo | 0.0 /100 | #330 | Tragic 14.3% |
| Alaskan Athabascans | 0.0 /100 | #331 | Tragic 14.4% |
| Pueblo | 0.0 /100 | #332 | Tragic 14.4% |
| Cajuns | 0.0 /100 | #333 | Tragic 14.6% |
| Yuman | 0.0 /100 | #334 | Tragic 14.6% |
| Tohono O'odham | 0.0 /100 | #335 | Tragic 14.8% |
| Cherokee | 0.0 /100 | #336 | Tragic 14.8% |
| Seminole | 0.0 /100 | #337 | Tragic 14.9% |
| Dutch West Indians | 0.0 /100 | #338 | Tragic 14.9% |
| Chickasaw | 0.0 /100 | #339 | Tragic 15.2% |
| Choctaw | 0.0 /100 | #340 | Tragic 15.4% |
| Lumbee | 0.0 /100 | #341 | Tragic 15.5% |
Demographics Similar to Immigrants from South Central Asia by Disability
In terms of disability, the demographic groups most similar to Immigrants from South Central Asia are Immigrants from Singapore (10.0%, a difference of 0.31%), Bolivian (10.0%, a difference of 0.54%), Immigrants from Bolivia (9.9%, a difference of 0.84%), Immigrants from Hong Kong (10.0%, a difference of 0.84%), and Immigrants from China (10.1%, a difference of 1.7%).
| Demographics | Rating | Rank | Disability |
| Immigrants | India | 100.0 /100 | #1 | Exceptional 9.5% |
| Filipinos | 100.0 /100 | #2 | Exceptional 9.6% |
| Immigrants | Taiwan | 100.0 /100 | #3 | Exceptional 9.6% |
| Thais | 100.0 /100 | #4 | Exceptional 9.7% |
| Immigrants | Bolivia | 100.0 /100 | #5 | Exceptional 9.9% |
| Immigrants | South Central Asia | 100.0 /100 | #6 | Exceptional 9.9% |
| Immigrants | Singapore | 100.0 /100 | #7 | Exceptional 10.0% |
| Bolivians | 100.0 /100 | #8 | Exceptional 10.0% |
| Immigrants | Hong Kong | 100.0 /100 | #9 | Exceptional 10.0% |
| Immigrants | China | 100.0 /100 | #10 | Exceptional 10.1% |
| Iranians | 100.0 /100 | #11 | Exceptional 10.1% |
| Immigrants | Israel | 100.0 /100 | #12 | Exceptional 10.1% |
| Immigrants | Eastern Asia | 100.0 /100 | #13 | Exceptional 10.2% |
| Immigrants | Korea | 100.0 /100 | #14 | Exceptional 10.2% |
| Okinawans | 100.0 /100 | #15 | Exceptional 10.3% |