Yuman vs Sri Lankan Disability
COMPARE
Yuman
Sri Lankan
Disability
Disability Comparison
Yuman
Sri Lankans
14.6%
DISABILITY
0.0/ 100
METRIC RATING
334th/ 347
METRIC RANK
11.0%
DISABILITY
99.5/ 100
METRIC RATING
69th/ 347
METRIC RANK
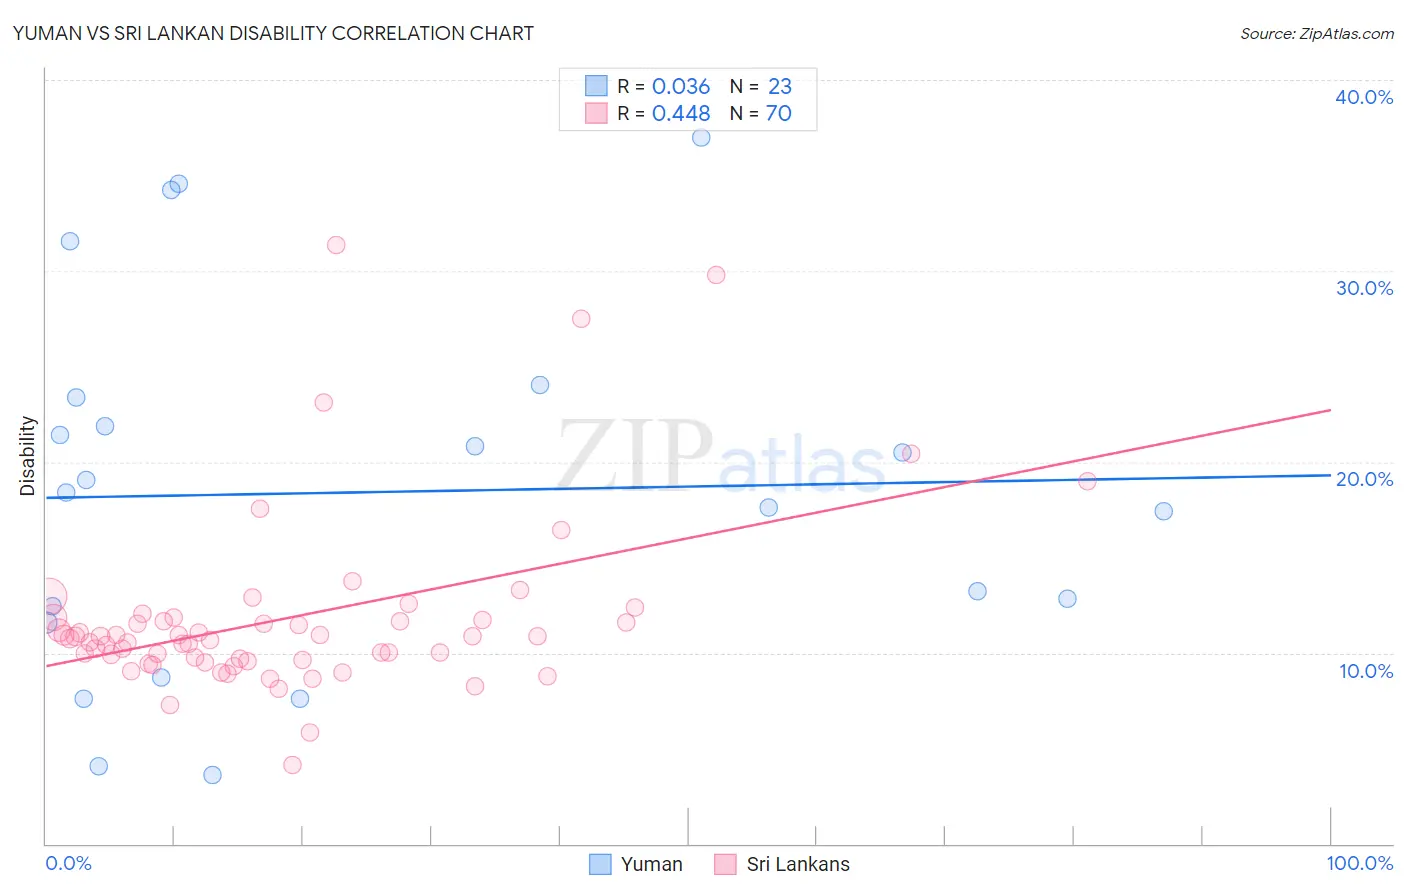
Yuman vs Sri Lankan Disability Correlation Chart
The statistical analysis conducted on geographies consisting of 40,663,643 people shows no correlation between the proportion of Yuman and percentage of population with a disability in the United States with a correlation coefficient (R) of 0.036 and weighted average of 14.6%. Similarly, the statistical analysis conducted on geographies consisting of 440,510,650 people shows a moderate positive correlation between the proportion of Sri Lankans and percentage of population with a disability in the United States with a correlation coefficient (R) of 0.448 and weighted average of 11.0%, a difference of 32.7%.
Disability Correlation Summary
| Measurement | Yuman | Sri Lankan |
| Minimum | 3.6% | 4.1% |
| Maximum | 37.0% | 31.3% |
| Range | 33.4% | 27.2% |
| Mean | 18.4% | 11.8% |
| Median | 18.4% | 10.8% |
| Interquartile 25% (IQ1) | 11.6% | 9.6% |
| Interquartile 75% (IQ3) | 23.4% | 11.7% |
| Interquartile Range (IQR) | 11.8% | 2.1% |
| Standard Deviation (Sample) | 9.6% | 4.8% |
| Standard Deviation (Population) | 9.4% | 4.7% |
Similar Demographics by Disability
Demographics Similar to Yuman by Disability
In terms of disability, the demographic groups most similar to Yuman are Cajun (14.6%, a difference of 0.12%), Tohono O'odham (14.8%, a difference of 1.0%), Pueblo (14.4%, a difference of 1.2%), Alaskan Athabascan (14.4%, a difference of 1.2%), and Cherokee (14.8%, a difference of 1.5%).
| Demographics | Rating | Rank | Disability |
| Ottawa | 0.0 /100 | #327 | Tragic 14.2% |
| Immigrants | Azores | 0.0 /100 | #328 | Tragic 14.2% |
| Potawatomi | 0.0 /100 | #329 | Tragic 14.2% |
| Navajo | 0.0 /100 | #330 | Tragic 14.3% |
| Alaskan Athabascans | 0.0 /100 | #331 | Tragic 14.4% |
| Pueblo | 0.0 /100 | #332 | Tragic 14.4% |
| Cajuns | 0.0 /100 | #333 | Tragic 14.6% |
| Yuman | 0.0 /100 | #334 | Tragic 14.6% |
| Tohono O'odham | 0.0 /100 | #335 | Tragic 14.8% |
| Cherokee | 0.0 /100 | #336 | Tragic 14.8% |
| Seminole | 0.0 /100 | #337 | Tragic 14.9% |
| Dutch West Indians | 0.0 /100 | #338 | Tragic 14.9% |
| Chickasaw | 0.0 /100 | #339 | Tragic 15.2% |
| Choctaw | 0.0 /100 | #340 | Tragic 15.4% |
| Lumbee | 0.0 /100 | #341 | Tragic 15.5% |
Demographics Similar to Sri Lankans by Disability
In terms of disability, the demographic groups most similar to Sri Lankans are Immigrants from France (11.0%, a difference of 0.080%), Immigrants from Lebanon (11.0%, a difference of 0.090%), Immigrants from Chile (11.0%, a difference of 0.18%), Immigrants from Afghanistan (11.0%, a difference of 0.21%), and Immigrants from Bangladesh (11.0%, a difference of 0.21%).
| Demographics | Rating | Rank | Disability |
| Immigrants | Northern Africa | 99.7 /100 | #62 | Exceptional 10.9% |
| Immigrants | Eritrea | 99.7 /100 | #63 | Exceptional 11.0% |
| Immigrants | Sweden | 99.6 /100 | #64 | Exceptional 11.0% |
| Bulgarians | 99.6 /100 | #65 | Exceptional 11.0% |
| Laotians | 99.6 /100 | #66 | Exceptional 11.0% |
| Colombians | 99.6 /100 | #67 | Exceptional 11.0% |
| Immigrants | Afghanistan | 99.6 /100 | #68 | Exceptional 11.0% |
| Sri Lankans | 99.5 /100 | #69 | Exceptional 11.0% |
| Immigrants | France | 99.4 /100 | #70 | Exceptional 11.0% |
| Immigrants | Lebanon | 99.4 /100 | #71 | Exceptional 11.0% |
| Immigrants | Chile | 99.4 /100 | #72 | Exceptional 11.0% |
| Immigrants | Bangladesh | 99.4 /100 | #73 | Exceptional 11.0% |
| Immigrants | Serbia | 99.4 /100 | #74 | Exceptional 11.0% |
| Immigrants | Vietnam | 99.4 /100 | #75 | Exceptional 11.0% |
| Sierra Leoneans | 99.3 /100 | #76 | Exceptional 11.0% |