Yuman vs Immigrants from Ireland Disability
COMPARE
Yuman
Immigrants from Ireland
Disability
Disability Comparison
Yuman
Immigrants from Ireland
14.6%
DISABILITY
0.0/ 100
METRIC RATING
334th/ 347
METRIC RANK
11.1%
DISABILITY
99.3/ 100
METRIC RATING
80th/ 347
METRIC RANK
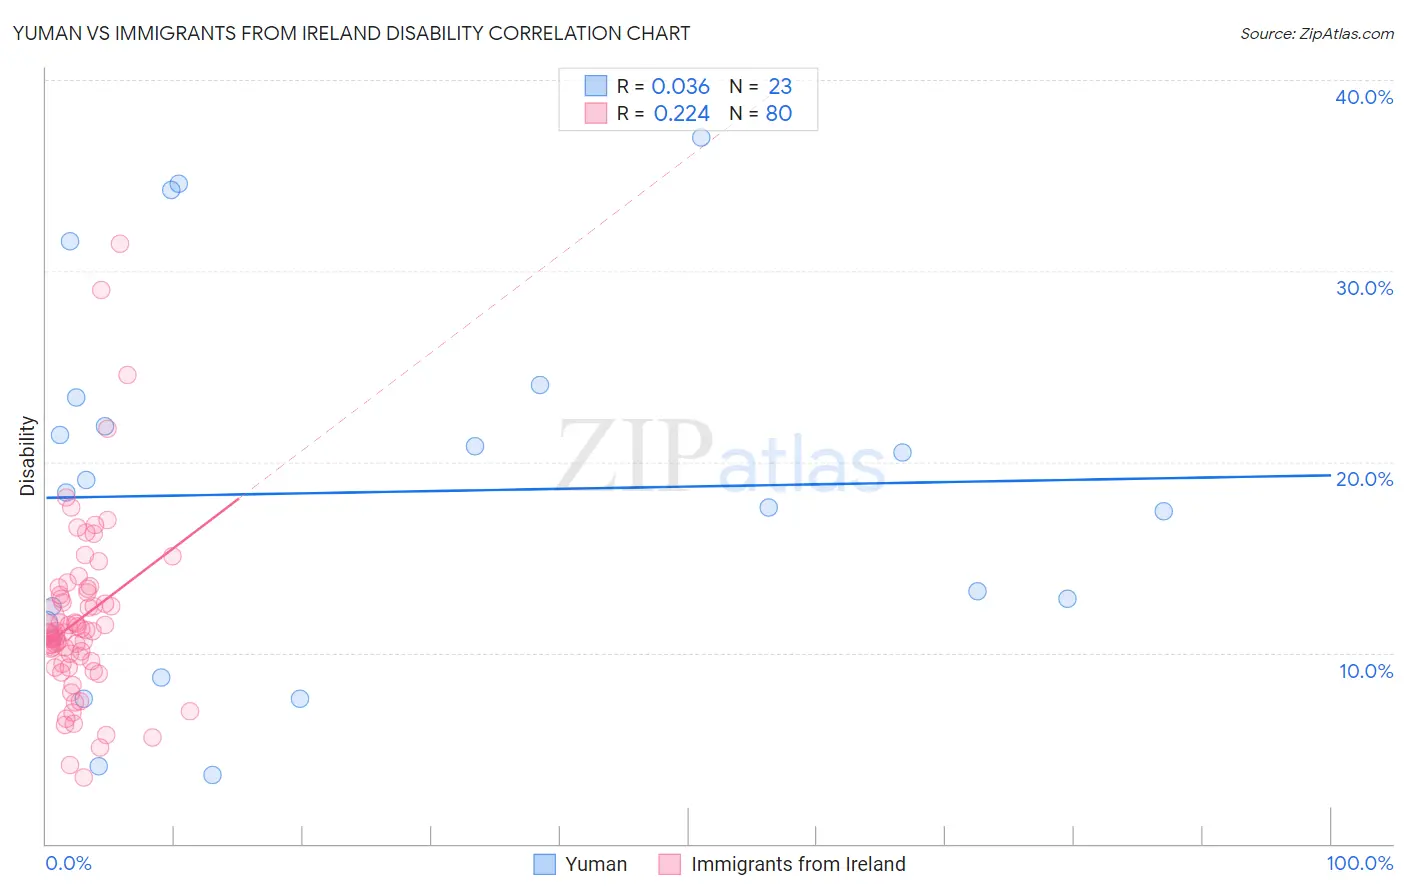
Yuman vs Immigrants from Ireland Disability Correlation Chart
The statistical analysis conducted on geographies consisting of 40,663,643 people shows no correlation between the proportion of Yuman and percentage of population with a disability in the United States with a correlation coefficient (R) of 0.036 and weighted average of 14.6%. Similarly, the statistical analysis conducted on geographies consisting of 240,775,613 people shows a weak positive correlation between the proportion of Immigrants from Ireland and percentage of population with a disability in the United States with a correlation coefficient (R) of 0.224 and weighted average of 11.1%, a difference of 32.1%.
Disability Correlation Summary
| Measurement | Yuman | Immigrants from Ireland |
| Minimum | 3.6% | 3.4% |
| Maximum | 37.0% | 31.4% |
| Range | 33.4% | 28.0% |
| Mean | 18.4% | 11.7% |
| Median | 18.4% | 11.0% |
| Interquartile 25% (IQ1) | 11.6% | 9.5% |
| Interquartile 75% (IQ3) | 23.4% | 13.1% |
| Interquartile Range (IQR) | 11.8% | 3.6% |
| Standard Deviation (Sample) | 9.6% | 4.7% |
| Standard Deviation (Population) | 9.4% | 4.6% |
Similar Demographics by Disability
Demographics Similar to Yuman by Disability
In terms of disability, the demographic groups most similar to Yuman are Cajun (14.6%, a difference of 0.12%), Tohono O'odham (14.8%, a difference of 1.0%), Pueblo (14.4%, a difference of 1.2%), Alaskan Athabascan (14.4%, a difference of 1.2%), and Cherokee (14.8%, a difference of 1.5%).
| Demographics | Rating | Rank | Disability |
| Ottawa | 0.0 /100 | #327 | Tragic 14.2% |
| Immigrants | Azores | 0.0 /100 | #328 | Tragic 14.2% |
| Potawatomi | 0.0 /100 | #329 | Tragic 14.2% |
| Navajo | 0.0 /100 | #330 | Tragic 14.3% |
| Alaskan Athabascans | 0.0 /100 | #331 | Tragic 14.4% |
| Pueblo | 0.0 /100 | #332 | Tragic 14.4% |
| Cajuns | 0.0 /100 | #333 | Tragic 14.6% |
| Yuman | 0.0 /100 | #334 | Tragic 14.6% |
| Tohono O'odham | 0.0 /100 | #335 | Tragic 14.8% |
| Cherokee | 0.0 /100 | #336 | Tragic 14.8% |
| Seminole | 0.0 /100 | #337 | Tragic 14.9% |
| Dutch West Indians | 0.0 /100 | #338 | Tragic 14.9% |
| Chickasaw | 0.0 /100 | #339 | Tragic 15.2% |
| Choctaw | 0.0 /100 | #340 | Tragic 15.4% |
| Lumbee | 0.0 /100 | #341 | Tragic 15.5% |
Demographics Similar to Immigrants from Ireland by Disability
In terms of disability, the demographic groups most similar to Immigrants from Ireland are Immigrants from Jordan (11.1%, a difference of 0.050%), Immigrants from Cameroon (11.1%, a difference of 0.080%), Sierra Leonean (11.0%, a difference of 0.12%), Immigrants from Belgium (11.0%, a difference of 0.12%), and Immigrants from Vietnam (11.0%, a difference of 0.15%).
| Demographics | Rating | Rank | Disability |
| Immigrants | Bangladesh | 99.4 /100 | #73 | Exceptional 11.0% |
| Immigrants | Serbia | 99.4 /100 | #74 | Exceptional 11.0% |
| Immigrants | Vietnam | 99.4 /100 | #75 | Exceptional 11.0% |
| Sierra Leoneans | 99.3 /100 | #76 | Exceptional 11.0% |
| Immigrants | Belgium | 99.3 /100 | #77 | Exceptional 11.0% |
| Immigrants | Cameroon | 99.3 /100 | #78 | Exceptional 11.1% |
| Immigrants | Jordan | 99.3 /100 | #79 | Exceptional 11.1% |
| Immigrants | Ireland | 99.3 /100 | #80 | Exceptional 11.1% |
| Immigrants | Poland | 99.1 /100 | #81 | Exceptional 11.1% |
| Chileans | 99.1 /100 | #82 | Exceptional 11.1% |
| Immigrants | Switzerland | 99.0 /100 | #83 | Exceptional 11.1% |
| Immigrants | Sierra Leone | 99.0 /100 | #84 | Exceptional 11.1% |
| Immigrants | Belarus | 98.9 /100 | #85 | Exceptional 11.1% |
| Immigrants | Russia | 98.9 /100 | #86 | Exceptional 11.1% |
| Palestinians | 98.9 /100 | #87 | Exceptional 11.1% |