Yuman vs Immigrants from Europe Disability
COMPARE
Yuman
Immigrants from Europe
Disability
Disability Comparison
Yuman
Immigrants from Europe
14.6%
DISABILITY
0.0/ 100
METRIC RATING
334th/ 347
METRIC RANK
11.4%
DISABILITY
90.4/ 100
METRIC RATING
128th/ 347
METRIC RANK
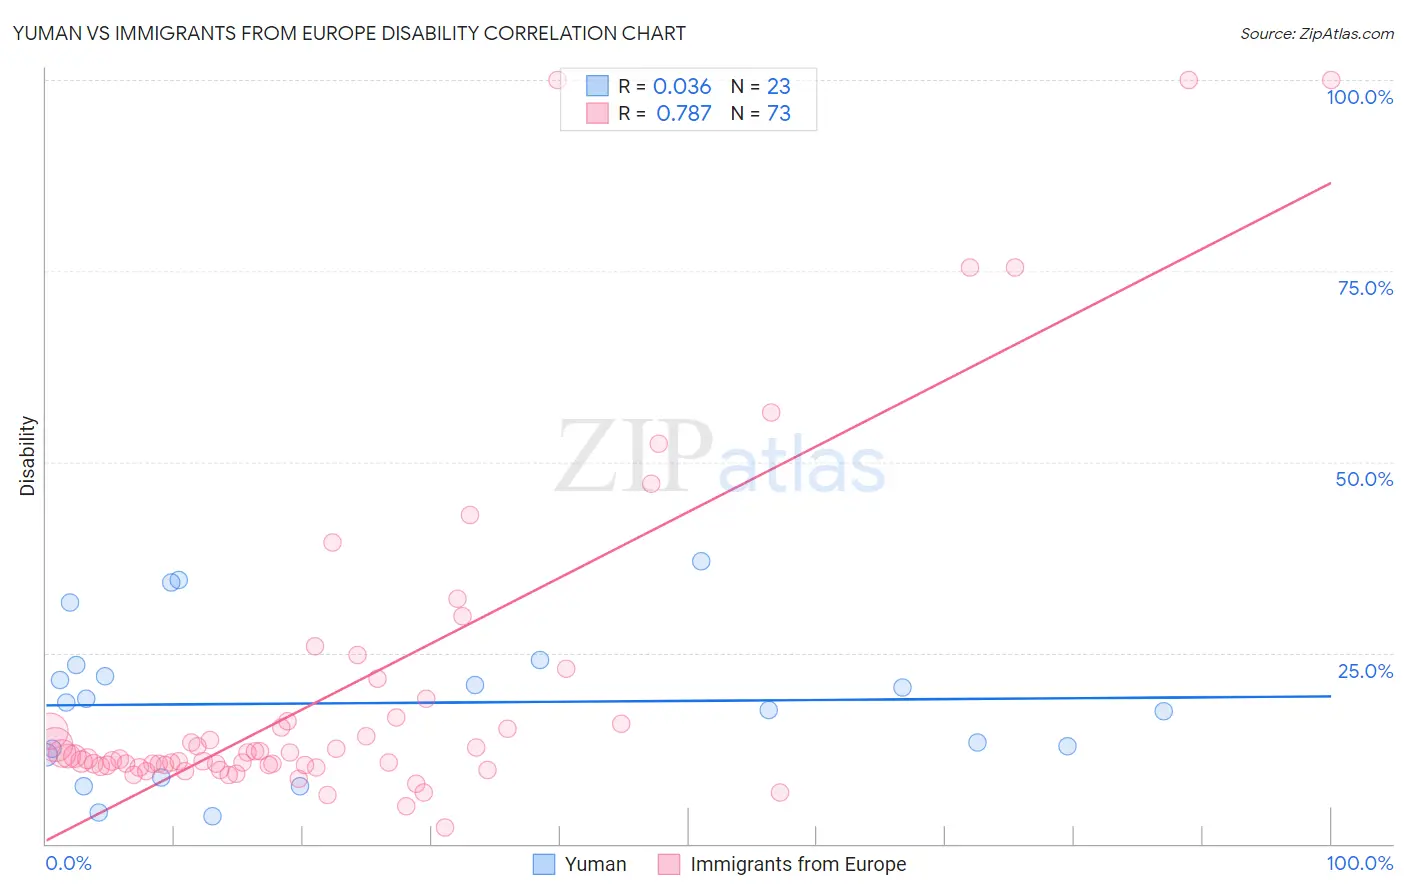
Yuman vs Immigrants from Europe Disability Correlation Chart
The statistical analysis conducted on geographies consisting of 40,663,643 people shows no correlation between the proportion of Yuman and percentage of population with a disability in the United States with a correlation coefficient (R) of 0.036 and weighted average of 14.6%. Similarly, the statistical analysis conducted on geographies consisting of 547,337,167 people shows a strong positive correlation between the proportion of Immigrants from Europe and percentage of population with a disability in the United States with a correlation coefficient (R) of 0.787 and weighted average of 11.4%, a difference of 28.1%.
Disability Correlation Summary
| Measurement | Yuman | Immigrants from Europe |
| Minimum | 3.6% | 2.1% |
| Maximum | 37.0% | 100.0% |
| Range | 33.4% | 97.9% |
| Mean | 18.4% | 20.2% |
| Median | 18.4% | 11.4% |
| Interquartile 25% (IQ1) | 11.6% | 10.2% |
| Interquartile 75% (IQ3) | 23.4% | 16.3% |
| Interquartile Range (IQR) | 11.8% | 6.0% |
| Standard Deviation (Sample) | 9.6% | 22.0% |
| Standard Deviation (Population) | 9.4% | 21.8% |
Similar Demographics by Disability
Demographics Similar to Yuman by Disability
In terms of disability, the demographic groups most similar to Yuman are Cajun (14.6%, a difference of 0.12%), Tohono O'odham (14.8%, a difference of 1.0%), Pueblo (14.4%, a difference of 1.2%), Alaskan Athabascan (14.4%, a difference of 1.2%), and Cherokee (14.8%, a difference of 1.5%).
| Demographics | Rating | Rank | Disability |
| Ottawa | 0.0 /100 | #327 | Tragic 14.2% |
| Immigrants | Azores | 0.0 /100 | #328 | Tragic 14.2% |
| Potawatomi | 0.0 /100 | #329 | Tragic 14.2% |
| Navajo | 0.0 /100 | #330 | Tragic 14.3% |
| Alaskan Athabascans | 0.0 /100 | #331 | Tragic 14.4% |
| Pueblo | 0.0 /100 | #332 | Tragic 14.4% |
| Cajuns | 0.0 /100 | #333 | Tragic 14.6% |
| Yuman | 0.0 /100 | #334 | Tragic 14.6% |
| Tohono O'odham | 0.0 /100 | #335 | Tragic 14.8% |
| Cherokee | 0.0 /100 | #336 | Tragic 14.8% |
| Seminole | 0.0 /100 | #337 | Tragic 14.9% |
| Dutch West Indians | 0.0 /100 | #338 | Tragic 14.9% |
| Chickasaw | 0.0 /100 | #339 | Tragic 15.2% |
| Choctaw | 0.0 /100 | #340 | Tragic 15.4% |
| Lumbee | 0.0 /100 | #341 | Tragic 15.5% |
Demographics Similar to Immigrants from Europe by Disability
In terms of disability, the demographic groups most similar to Immigrants from Europe are Immigrants from Italy (11.4%, a difference of 0.0%), Macedonian (11.4%, a difference of 0.010%), Immigrants from Latvia (11.4%, a difference of 0.070%), Latvian (11.4%, a difference of 0.070%), and Immigrants from Croatia (11.4%, a difference of 0.080%).
| Demographics | Rating | Rank | Disability |
| Immigrants | Costa Rica | 93.4 /100 | #121 | Exceptional 11.4% |
| Brazilians | 93.3 /100 | #122 | Exceptional 11.4% |
| South Africans | 92.3 /100 | #123 | Exceptional 11.4% |
| South American Indians | 92.2 /100 | #124 | Exceptional 11.4% |
| Costa Ricans | 91.9 /100 | #125 | Exceptional 11.4% |
| Immigrants | Latvia | 90.9 /100 | #126 | Exceptional 11.4% |
| Immigrants | Italy | 90.4 /100 | #127 | Exceptional 11.4% |
| Immigrants | Europe | 90.4 /100 | #128 | Exceptional 11.4% |
| Macedonians | 90.3 /100 | #129 | Exceptional 11.4% |
| Latvians | 89.8 /100 | #130 | Excellent 11.4% |
| Immigrants | Croatia | 89.8 /100 | #131 | Excellent 11.4% |
| Immigrants | Africa | 89.3 /100 | #132 | Excellent 11.4% |
| Arabs | 89.1 /100 | #133 | Excellent 11.4% |
| Immigrants | Guyana | 88.3 /100 | #134 | Excellent 11.4% |
| Ugandans | 87.9 /100 | #135 | Excellent 11.4% |