Yuman vs Turkish Disability
COMPARE
Yuman
Turkish
Disability
Disability Comparison
Yuman
Turks
14.6%
DISABILITY
0.0/ 100
METRIC RATING
334th/ 347
METRIC RANK
10.7%
DISABILITY
100.0/ 100
METRIC RATING
37th/ 347
METRIC RANK
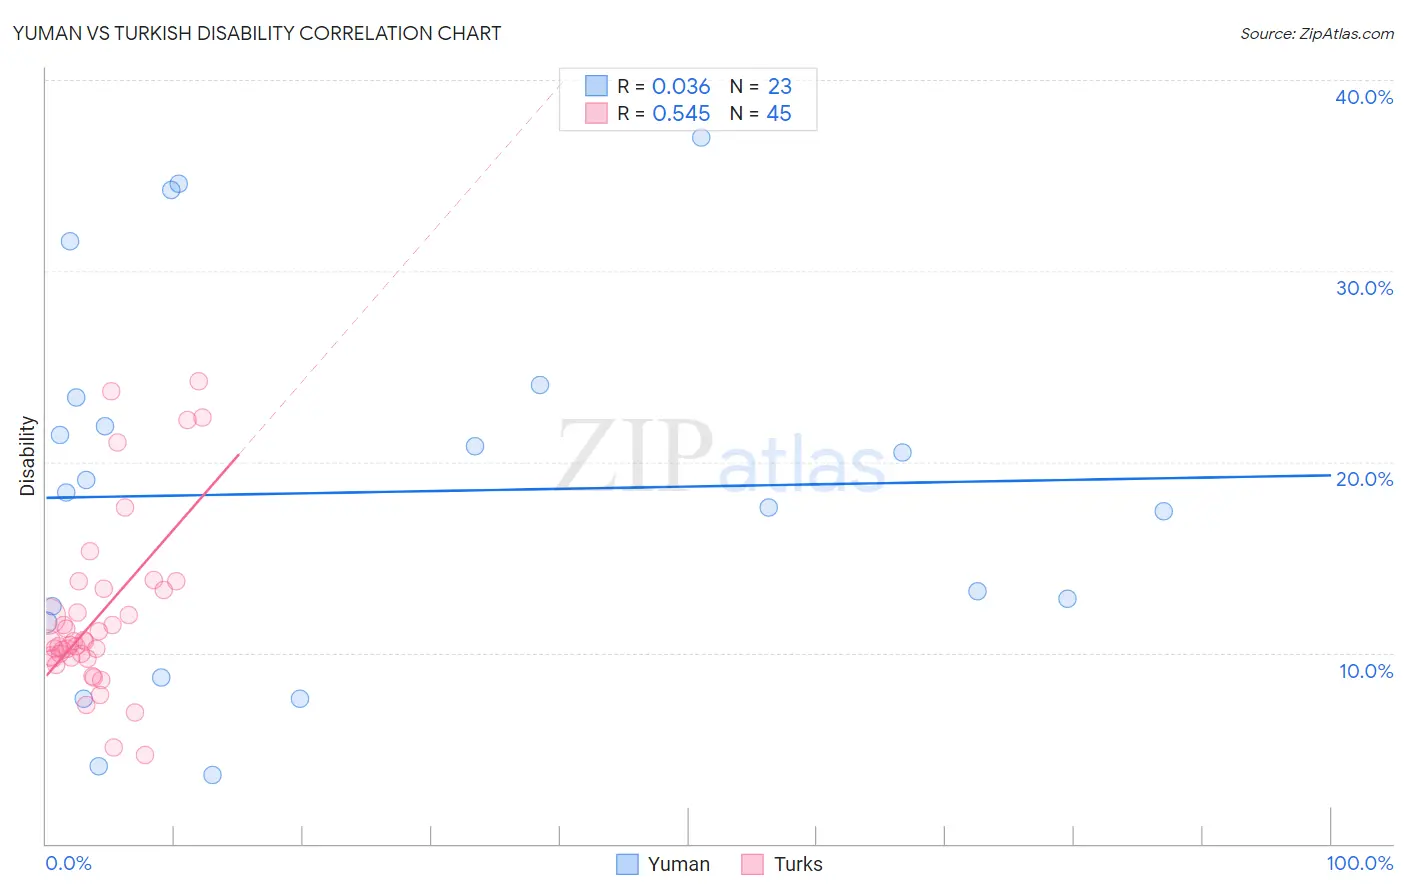
Yuman vs Turkish Disability Correlation Chart
The statistical analysis conducted on geographies consisting of 40,663,643 people shows no correlation between the proportion of Yuman and percentage of population with a disability in the United States with a correlation coefficient (R) of 0.036 and weighted average of 14.6%. Similarly, the statistical analysis conducted on geographies consisting of 271,857,414 people shows a substantial positive correlation between the proportion of Turks and percentage of population with a disability in the United States with a correlation coefficient (R) of 0.545 and weighted average of 10.7%, a difference of 36.5%.
Disability Correlation Summary
| Measurement | Yuman | Turkish |
| Minimum | 3.6% | 4.7% |
| Maximum | 37.0% | 24.3% |
| Range | 33.4% | 19.6% |
| Mean | 18.4% | 11.9% |
| Median | 18.4% | 10.6% |
| Interquartile 25% (IQ1) | 11.6% | 9.7% |
| Interquartile 75% (IQ3) | 23.4% | 13.3% |
| Interquartile Range (IQR) | 11.8% | 3.6% |
| Standard Deviation (Sample) | 9.6% | 4.5% |
| Standard Deviation (Population) | 9.4% | 4.5% |
Similar Demographics by Disability
Demographics Similar to Yuman by Disability
In terms of disability, the demographic groups most similar to Yuman are Cajun (14.6%, a difference of 0.12%), Tohono O'odham (14.8%, a difference of 1.0%), Pueblo (14.4%, a difference of 1.2%), Alaskan Athabascan (14.4%, a difference of 1.2%), and Cherokee (14.8%, a difference of 1.5%).
| Demographics | Rating | Rank | Disability |
| Ottawa | 0.0 /100 | #327 | Tragic 14.2% |
| Immigrants | Azores | 0.0 /100 | #328 | Tragic 14.2% |
| Potawatomi | 0.0 /100 | #329 | Tragic 14.2% |
| Navajo | 0.0 /100 | #330 | Tragic 14.3% |
| Alaskan Athabascans | 0.0 /100 | #331 | Tragic 14.4% |
| Pueblo | 0.0 /100 | #332 | Tragic 14.4% |
| Cajuns | 0.0 /100 | #333 | Tragic 14.6% |
| Yuman | 0.0 /100 | #334 | Tragic 14.6% |
| Tohono O'odham | 0.0 /100 | #335 | Tragic 14.8% |
| Cherokee | 0.0 /100 | #336 | Tragic 14.8% |
| Seminole | 0.0 /100 | #337 | Tragic 14.9% |
| Dutch West Indians | 0.0 /100 | #338 | Tragic 14.9% |
| Chickasaw | 0.0 /100 | #339 | Tragic 15.2% |
| Choctaw | 0.0 /100 | #340 | Tragic 15.4% |
| Lumbee | 0.0 /100 | #341 | Tragic 15.5% |
Demographics Similar to Turks by Disability
In terms of disability, the demographic groups most similar to Turks are Ethiopian (10.7%, a difference of 0.010%), Immigrants from Indonesia (10.7%, a difference of 0.070%), Immigrants from Ethiopia (10.7%, a difference of 0.080%), Immigrants from Kuwait (10.7%, a difference of 0.30%), and Afghan (10.8%, a difference of 0.44%).
| Demographics | Rating | Rank | Disability |
| Immigrants | Turkey | 100.0 /100 | #30 | Exceptional 10.6% |
| Immigrants | Egypt | 100.0 /100 | #31 | Exceptional 10.6% |
| Paraguayans | 100.0 /100 | #32 | Exceptional 10.6% |
| Immigrants | Kuwait | 100.0 /100 | #33 | Exceptional 10.7% |
| Immigrants | Ethiopia | 100.0 /100 | #34 | Exceptional 10.7% |
| Immigrants | Indonesia | 100.0 /100 | #35 | Exceptional 10.7% |
| Ethiopians | 100.0 /100 | #36 | Exceptional 10.7% |
| Turks | 100.0 /100 | #37 | Exceptional 10.7% |
| Afghans | 99.9 /100 | #38 | Exceptional 10.8% |
| Cambodians | 99.9 /100 | #39 | Exceptional 10.8% |
| Mongolians | 99.9 /100 | #40 | Exceptional 10.8% |
| Immigrants | Australia | 99.9 /100 | #41 | Exceptional 10.8% |
| Immigrants | Nepal | 99.9 /100 | #42 | Exceptional 10.8% |
| Israelis | 99.9 /100 | #43 | Exceptional 10.8% |
| Immigrants | Japan | 99.9 /100 | #44 | Exceptional 10.8% |