Yuman vs Honduran Disability
COMPARE
Yuman
Honduran
Disability
Disability Comparison
Yuman
Hondurans
14.6%
DISABILITY
0.0/ 100
METRIC RATING
334th/ 347
METRIC RANK
11.8%
DISABILITY
31.2/ 100
METRIC RATING
183rd/ 347
METRIC RANK
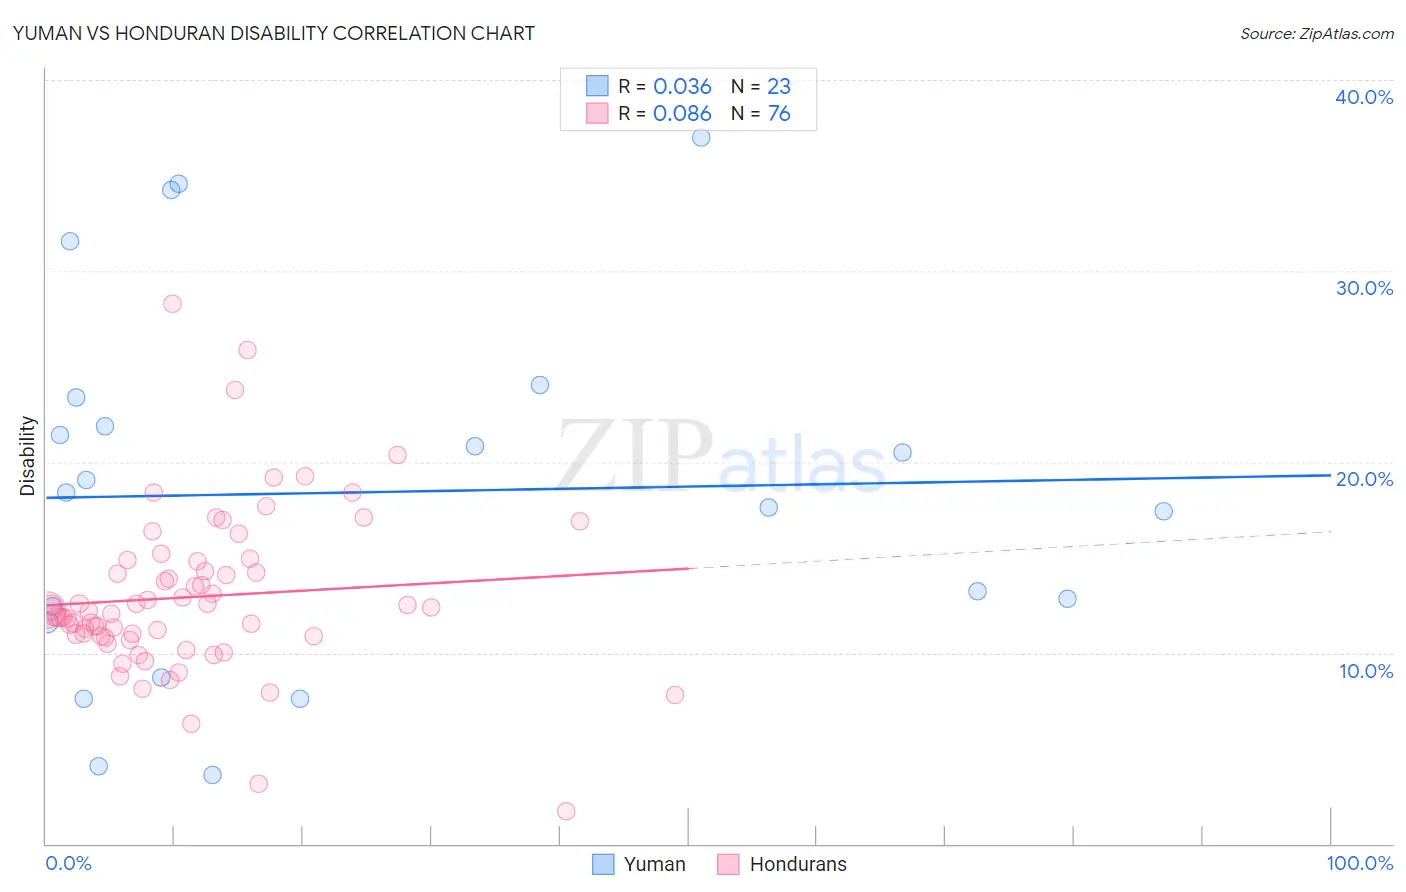
Yuman vs Honduran Disability Correlation Chart
The statistical analysis conducted on geographies consisting of 40,663,643 people shows no correlation between the proportion of Yuman and percentage of population with a disability in the United States with a correlation coefficient (R) of 0.036 and weighted average of 14.6%. Similarly, the statistical analysis conducted on geographies consisting of 357,777,033 people shows a slight positive correlation between the proportion of Hondurans and percentage of population with a disability in the United States with a correlation coefficient (R) of 0.086 and weighted average of 11.8%, a difference of 23.9%.
Disability Correlation Summary
| Measurement | Yuman | Honduran |
| Minimum | 3.6% | 1.7% |
| Maximum | 37.0% | 28.3% |
| Range | 33.4% | 26.6% |
| Mean | 18.4% | 12.9% |
| Median | 18.4% | 12.1% |
| Interquartile 25% (IQ1) | 11.6% | 10.9% |
| Interquartile 75% (IQ3) | 23.4% | 14.6% |
| Interquartile Range (IQR) | 11.8% | 3.7% |
| Standard Deviation (Sample) | 9.6% | 4.3% |
| Standard Deviation (Population) | 9.4% | 4.2% |
Similar Demographics by Disability
Demographics Similar to Yuman by Disability
In terms of disability, the demographic groups most similar to Yuman are Cajun (14.6%, a difference of 0.12%), Tohono O'odham (14.8%, a difference of 1.0%), Pueblo (14.4%, a difference of 1.2%), Alaskan Athabascan (14.4%, a difference of 1.2%), and Cherokee (14.8%, a difference of 1.5%).
| Demographics | Rating | Rank | Disability |
| Ottawa | 0.0 /100 | #327 | Tragic 14.2% |
| Immigrants | Azores | 0.0 /100 | #328 | Tragic 14.2% |
| Potawatomi | 0.0 /100 | #329 | Tragic 14.2% |
| Navajo | 0.0 /100 | #330 | Tragic 14.3% |
| Alaskan Athabascans | 0.0 /100 | #331 | Tragic 14.4% |
| Pueblo | 0.0 /100 | #332 | Tragic 14.4% |
| Cajuns | 0.0 /100 | #333 | Tragic 14.6% |
| Yuman | 0.0 /100 | #334 | Tragic 14.6% |
| Tohono O'odham | 0.0 /100 | #335 | Tragic 14.8% |
| Cherokee | 0.0 /100 | #336 | Tragic 14.8% |
| Seminole | 0.0 /100 | #337 | Tragic 14.9% |
| Dutch West Indians | 0.0 /100 | #338 | Tragic 14.9% |
| Chickasaw | 0.0 /100 | #339 | Tragic 15.2% |
| Choctaw | 0.0 /100 | #340 | Tragic 15.4% |
| Lumbee | 0.0 /100 | #341 | Tragic 15.5% |
Demographics Similar to Hondurans by Disability
In terms of disability, the demographic groups most similar to Hondurans are Iraqi (11.8%, a difference of 0.060%), Icelander (11.8%, a difference of 0.14%), Immigrants from Burma/Myanmar (11.8%, a difference of 0.14%), Immigrants from Oceania (11.8%, a difference of 0.15%), and Immigrants from Scotland (11.8%, a difference of 0.16%).
| Demographics | Rating | Rank | Disability |
| Immigrants | Western Africa | 47.5 /100 | #176 | Average 11.7% |
| Immigrants | Central America | 46.6 /100 | #177 | Average 11.7% |
| Greeks | 46.2 /100 | #178 | Average 11.7% |
| Immigrants | Armenia | 41.9 /100 | #179 | Average 11.7% |
| Immigrants | Honduras | 37.8 /100 | #180 | Fair 11.8% |
| Immigrants | Oceania | 34.3 /100 | #181 | Fair 11.8% |
| Icelanders | 34.0 /100 | #182 | Fair 11.8% |
| Hondurans | 31.2 /100 | #183 | Fair 11.8% |
| Iraqis | 30.0 /100 | #184 | Fair 11.8% |
| Immigrants | Burma/Myanmar | 28.5 /100 | #185 | Fair 11.8% |
| Immigrants | Scotland | 28.2 /100 | #186 | Fair 11.8% |
| Lebanese | 27.9 /100 | #187 | Fair 11.8% |
| Immigrants | Mexico | 23.8 /100 | #188 | Fair 11.9% |
| Immigrants | Zaire | 21.8 /100 | #189 | Fair 11.9% |
| Immigrants | West Indies | 21.1 /100 | #190 | Fair 11.9% |