Immigrants from Austria vs Samoan Disability
COMPARE
Immigrants from Austria
Samoan
Disability
Disability Comparison
Immigrants from Austria
Samoans
11.7%
DISABILITY
53.4/ 100
METRIC RATING
169th/ 347
METRIC RANK
12.2%
DISABILITY
2.6/ 100
METRIC RATING
230th/ 347
METRIC RANK
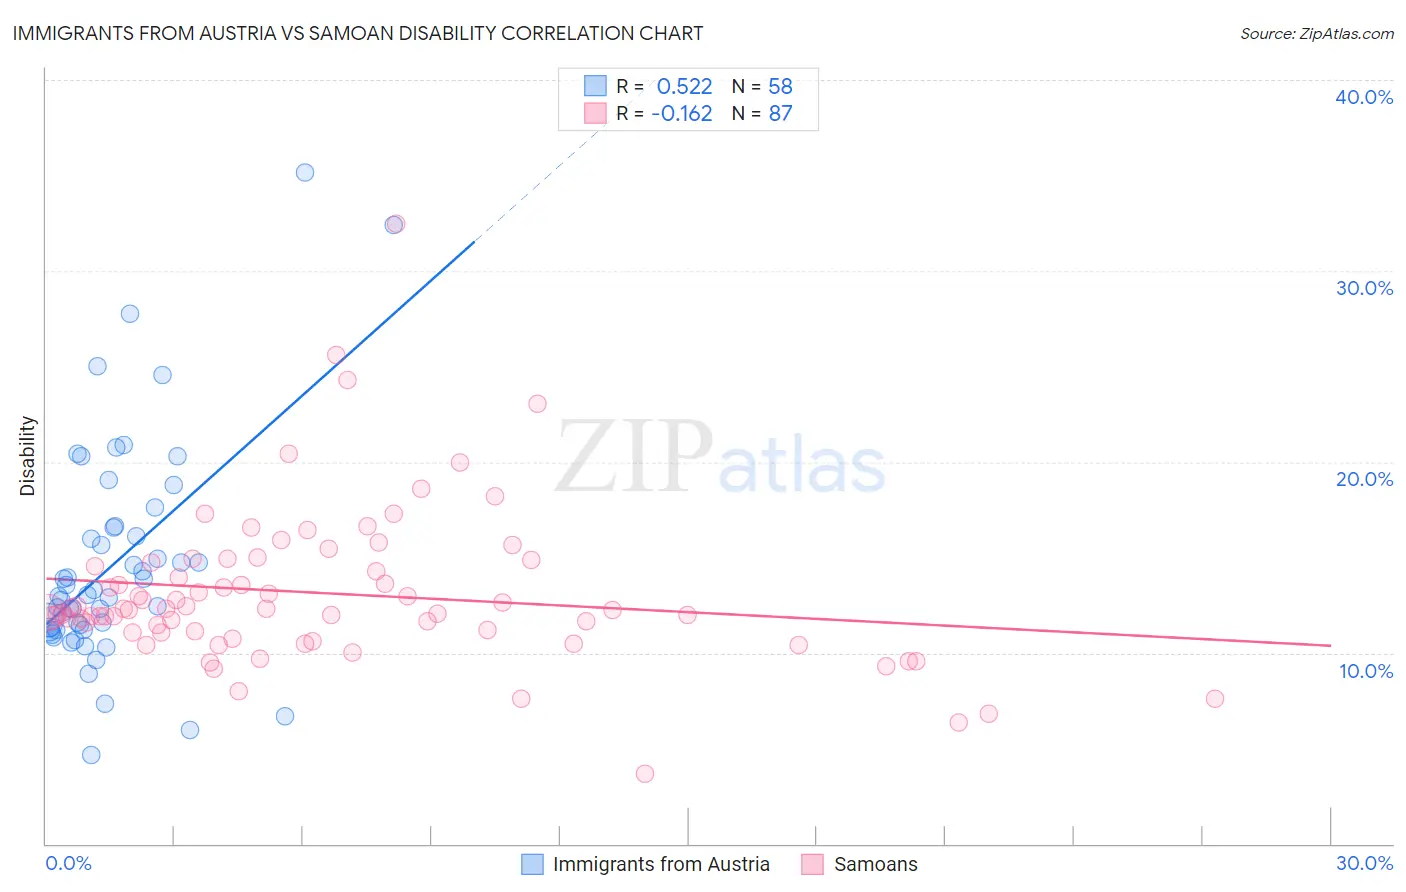
Immigrants from Austria vs Samoan Disability Correlation Chart
The statistical analysis conducted on geographies consisting of 167,973,413 people shows a substantial positive correlation between the proportion of Immigrants from Austria and percentage of population with a disability in the United States with a correlation coefficient (R) of 0.522 and weighted average of 11.7%. Similarly, the statistical analysis conducted on geographies consisting of 225,125,318 people shows a poor negative correlation between the proportion of Samoans and percentage of population with a disability in the United States with a correlation coefficient (R) of -0.162 and weighted average of 12.2%, a difference of 4.2%.
Disability Correlation Summary
| Measurement | Immigrants from Austria | Samoan |
| Minimum | 4.6% | 3.6% |
| Maximum | 35.2% | 32.5% |
| Range | 30.5% | 28.8% |
| Mean | 14.6% | 13.1% |
| Median | 13.0% | 12.3% |
| Interquartile 25% (IQ1) | 11.2% | 11.1% |
| Interquartile 75% (IQ3) | 16.5% | 14.7% |
| Interquartile Range (IQR) | 5.3% | 3.6% |
| Standard Deviation (Sample) | 5.8% | 4.1% |
| Standard Deviation (Population) | 5.8% | 4.1% |
Similar Demographics by Disability
Demographics Similar to Immigrants from Austria by Disability
In terms of disability, the demographic groups most similar to Immigrants from Austria are Immigrants from Latin America (11.7%, a difference of 0.030%), Immigrants from Albania (11.7%, a difference of 0.030%), Immigrants from Southern Europe (11.7%, a difference of 0.030%), Trinidadian and Tobagonian (11.7%, a difference of 0.030%), and Estonian (11.7%, a difference of 0.050%).
| Demographics | Rating | Rank | Disability |
| Immigrants | Haiti | 59.2 /100 | #162 | Average 11.7% |
| Immigrants | Trinidad and Tobago | 58.9 /100 | #163 | Average 11.7% |
| Syrians | 58.5 /100 | #164 | Average 11.7% |
| Cubans | 56.7 /100 | #165 | Average 11.7% |
| Pakistanis | 54.7 /100 | #166 | Average 11.7% |
| Estonians | 54.4 /100 | #167 | Average 11.7% |
| Immigrants | Latin America | 54.1 /100 | #168 | Average 11.7% |
| Immigrants | Austria | 53.4 /100 | #169 | Average 11.7% |
| Immigrants | Albania | 52.8 /100 | #170 | Average 11.7% |
| Immigrants | Southern Europe | 52.8 /100 | #171 | Average 11.7% |
| Trinidadians and Tobagonians | 52.7 /100 | #172 | Average 11.7% |
| Maltese | 50.6 /100 | #173 | Average 11.7% |
| Albanians | 50.0 /100 | #174 | Average 11.7% |
| Haitians | 48.6 /100 | #175 | Average 11.7% |
| Immigrants | Western Africa | 47.5 /100 | #176 | Average 11.7% |
Demographics Similar to Samoans by Disability
In terms of disability, the demographic groups most similar to Samoans are Malaysian (12.2%, a difference of 0.030%), Italian (12.2%, a difference of 0.040%), Inupiat (12.2%, a difference of 0.080%), West Indian (12.2%, a difference of 0.10%), and Bahamian (12.2%, a difference of 0.13%).
| Demographics | Rating | Rank | Disability |
| Hispanics or Latinos | 3.9 /100 | #223 | Tragic 12.1% |
| Mexicans | 3.7 /100 | #224 | Tragic 12.1% |
| Senegalese | 3.5 /100 | #225 | Tragic 12.1% |
| Jamaicans | 3.3 /100 | #226 | Tragic 12.1% |
| Alsatians | 3.3 /100 | #227 | Tragic 12.1% |
| West Indians | 2.9 /100 | #228 | Tragic 12.2% |
| Inupiat | 2.8 /100 | #229 | Tragic 12.2% |
| Samoans | 2.6 /100 | #230 | Tragic 12.2% |
| Malaysians | 2.5 /100 | #231 | Tragic 12.2% |
| Italians | 2.5 /100 | #232 | Tragic 12.2% |
| Bahamians | 2.3 /100 | #233 | Tragic 12.2% |
| Japanese | 2.3 /100 | #234 | Tragic 12.2% |
| Yup'ik | 2.2 /100 | #235 | Tragic 12.2% |
| Chinese | 2.0 /100 | #236 | Tragic 12.2% |
| Immigrants | Congo | 1.9 /100 | #237 | Tragic 12.2% |