Moroccan vs Samoan Disability
COMPARE
Moroccan
Samoan
Disability
Disability Comparison
Moroccans
Samoans
11.5%
DISABILITY
83.3/ 100
METRIC RATING
143rd/ 347
METRIC RANK
12.2%
DISABILITY
2.6/ 100
METRIC RATING
230th/ 347
METRIC RANK
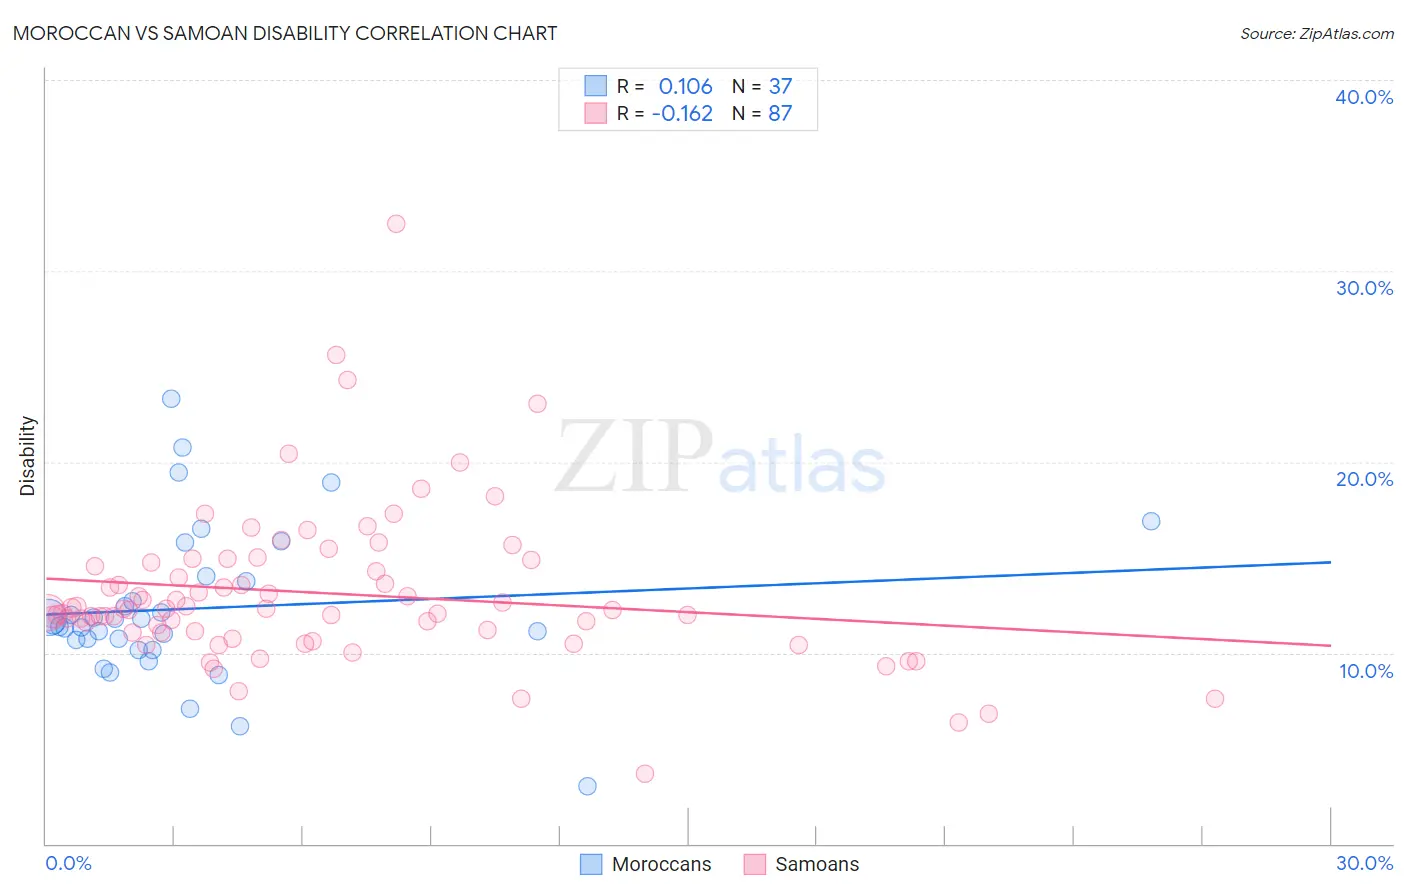
Moroccan vs Samoan Disability Correlation Chart
The statistical analysis conducted on geographies consisting of 201,799,768 people shows a poor positive correlation between the proportion of Moroccans and percentage of population with a disability in the United States with a correlation coefficient (R) of 0.106 and weighted average of 11.5%. Similarly, the statistical analysis conducted on geographies consisting of 225,125,318 people shows a poor negative correlation between the proportion of Samoans and percentage of population with a disability in the United States with a correlation coefficient (R) of -0.162 and weighted average of 12.2%, a difference of 5.9%.
Disability Correlation Summary
| Measurement | Moroccan | Samoan |
| Minimum | 3.0% | 3.6% |
| Maximum | 23.3% | 32.5% |
| Range | 20.3% | 28.8% |
| Mean | 12.3% | 13.1% |
| Median | 11.5% | 12.3% |
| Interquartile 25% (IQ1) | 10.4% | 11.1% |
| Interquartile 75% (IQ3) | 13.9% | 14.7% |
| Interquartile Range (IQR) | 3.5% | 3.6% |
| Standard Deviation (Sample) | 4.0% | 4.1% |
| Standard Deviation (Population) | 3.9% | 4.1% |
Similar Demographics by Disability
Demographics Similar to Moroccans by Disability
In terms of disability, the demographic groups most similar to Moroccans are Australian (11.5%, a difference of 0.070%), Nigerian (11.5%, a difference of 0.15%), Immigrants from Sudan (11.5%, a difference of 0.17%), Immigrants from Grenada (11.5%, a difference of 0.25%), and Russian (11.5%, a difference of 0.31%).
| Demographics | Rating | Rank | Disability |
| Immigrants | St. Vincent and the Grenadines | 87.8 /100 | #136 | Excellent 11.4% |
| Kenyans | 87.1 /100 | #137 | Excellent 11.5% |
| New Zealanders | 87.0 /100 | #138 | Excellent 11.5% |
| Ghanaians | 87.0 /100 | #139 | Excellent 11.5% |
| Russians | 86.8 /100 | #140 | Excellent 11.5% |
| Immigrants | Grenada | 86.1 /100 | #141 | Excellent 11.5% |
| Immigrants | Sudan | 85.3 /100 | #142 | Excellent 11.5% |
| Moroccans | 83.3 /100 | #143 | Excellent 11.5% |
| Australians | 82.5 /100 | #144 | Excellent 11.5% |
| Nigerians | 81.3 /100 | #145 | Excellent 11.5% |
| Immigrants | Hungary | 79.0 /100 | #146 | Good 11.5% |
| Immigrants | Ukraine | 77.6 /100 | #147 | Good 11.5% |
| Sudanese | 77.1 /100 | #148 | Good 11.5% |
| Immigrants | Norway | 73.2 /100 | #149 | Good 11.6% |
| Romanians | 72.7 /100 | #150 | Good 11.6% |
Demographics Similar to Samoans by Disability
In terms of disability, the demographic groups most similar to Samoans are Malaysian (12.2%, a difference of 0.030%), Italian (12.2%, a difference of 0.040%), Inupiat (12.2%, a difference of 0.080%), West Indian (12.2%, a difference of 0.10%), and Bahamian (12.2%, a difference of 0.13%).
| Demographics | Rating | Rank | Disability |
| Hispanics or Latinos | 3.9 /100 | #223 | Tragic 12.1% |
| Mexicans | 3.7 /100 | #224 | Tragic 12.1% |
| Senegalese | 3.5 /100 | #225 | Tragic 12.1% |
| Jamaicans | 3.3 /100 | #226 | Tragic 12.1% |
| Alsatians | 3.3 /100 | #227 | Tragic 12.1% |
| West Indians | 2.9 /100 | #228 | Tragic 12.2% |
| Inupiat | 2.8 /100 | #229 | Tragic 12.2% |
| Samoans | 2.6 /100 | #230 | Tragic 12.2% |
| Malaysians | 2.5 /100 | #231 | Tragic 12.2% |
| Italians | 2.5 /100 | #232 | Tragic 12.2% |
| Bahamians | 2.3 /100 | #233 | Tragic 12.2% |
| Japanese | 2.3 /100 | #234 | Tragic 12.2% |
| Yup'ik | 2.2 /100 | #235 | Tragic 12.2% |
| Chinese | 2.0 /100 | #236 | Tragic 12.2% |
| Immigrants | Congo | 1.9 /100 | #237 | Tragic 12.2% |