Yuman vs Japanese Disability
COMPARE
Yuman
Japanese
Disability
Disability Comparison
Yuman
Japanese
14.6%
DISABILITY
0.0/ 100
METRIC RATING
334th/ 347
METRIC RANK
12.2%
DISABILITY
2.3/ 100
METRIC RATING
234th/ 347
METRIC RANK
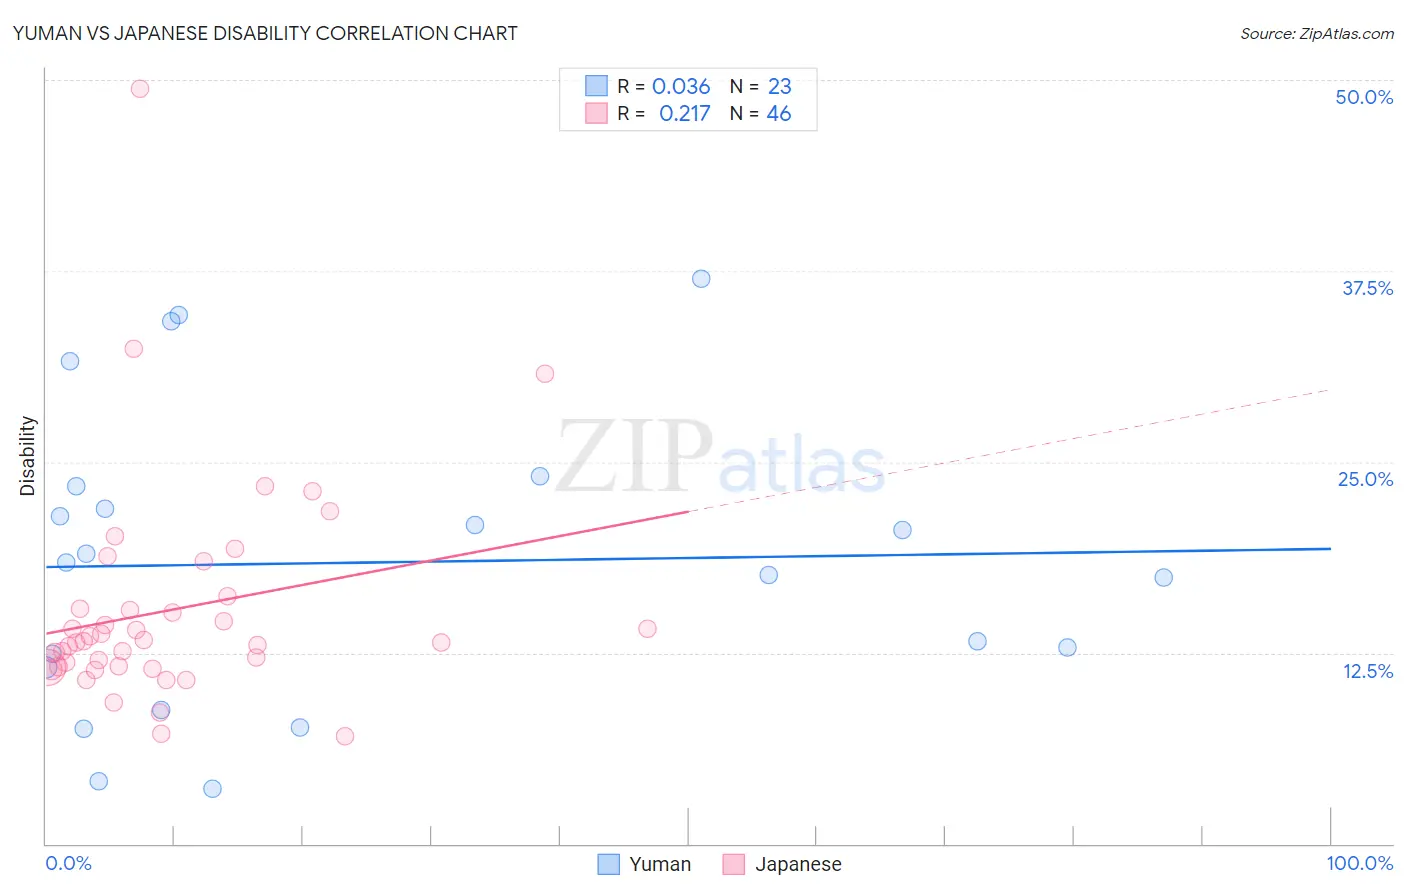
Yuman vs Japanese Disability Correlation Chart
The statistical analysis conducted on geographies consisting of 40,663,643 people shows no correlation between the proportion of Yuman and percentage of population with a disability in the United States with a correlation coefficient (R) of 0.036 and weighted average of 14.6%. Similarly, the statistical analysis conducted on geographies consisting of 249,165,535 people shows a weak positive correlation between the proportion of Japanese and percentage of population with a disability in the United States with a correlation coefficient (R) of 0.217 and weighted average of 12.2%, a difference of 20.0%.
Disability Correlation Summary
| Measurement | Yuman | Japanese |
| Minimum | 3.6% | 7.1% |
| Maximum | 37.0% | 49.5% |
| Range | 33.4% | 42.4% |
| Mean | 18.4% | 15.3% |
| Median | 18.4% | 13.2% |
| Interquartile 25% (IQ1) | 11.6% | 11.6% |
| Interquartile 75% (IQ3) | 23.4% | 15.3% |
| Interquartile Range (IQR) | 11.8% | 3.8% |
| Standard Deviation (Sample) | 9.6% | 7.3% |
| Standard Deviation (Population) | 9.4% | 7.2% |
Similar Demographics by Disability
Demographics Similar to Yuman by Disability
In terms of disability, the demographic groups most similar to Yuman are Cajun (14.6%, a difference of 0.12%), Tohono O'odham (14.8%, a difference of 1.0%), Pueblo (14.4%, a difference of 1.2%), Alaskan Athabascan (14.4%, a difference of 1.2%), and Cherokee (14.8%, a difference of 1.5%).
| Demographics | Rating | Rank | Disability |
| Ottawa | 0.0 /100 | #327 | Tragic 14.2% |
| Immigrants | Azores | 0.0 /100 | #328 | Tragic 14.2% |
| Potawatomi | 0.0 /100 | #329 | Tragic 14.2% |
| Navajo | 0.0 /100 | #330 | Tragic 14.3% |
| Alaskan Athabascans | 0.0 /100 | #331 | Tragic 14.4% |
| Pueblo | 0.0 /100 | #332 | Tragic 14.4% |
| Cajuns | 0.0 /100 | #333 | Tragic 14.6% |
| Yuman | 0.0 /100 | #334 | Tragic 14.6% |
| Tohono O'odham | 0.0 /100 | #335 | Tragic 14.8% |
| Cherokee | 0.0 /100 | #336 | Tragic 14.8% |
| Seminole | 0.0 /100 | #337 | Tragic 14.9% |
| Dutch West Indians | 0.0 /100 | #338 | Tragic 14.9% |
| Chickasaw | 0.0 /100 | #339 | Tragic 15.2% |
| Choctaw | 0.0 /100 | #340 | Tragic 15.4% |
| Lumbee | 0.0 /100 | #341 | Tragic 15.5% |
Demographics Similar to Japanese by Disability
In terms of disability, the demographic groups most similar to Japanese are Bahamian (12.2%, a difference of 0.030%), Yup'ik (12.2%, a difference of 0.040%), Italian (12.2%, a difference of 0.12%), Malaysian (12.2%, a difference of 0.13%), and Chinese (12.2%, a difference of 0.13%).
| Demographics | Rating | Rank | Disability |
| Alsatians | 3.3 /100 | #227 | Tragic 12.1% |
| West Indians | 2.9 /100 | #228 | Tragic 12.2% |
| Inupiat | 2.8 /100 | #229 | Tragic 12.2% |
| Samoans | 2.6 /100 | #230 | Tragic 12.2% |
| Malaysians | 2.5 /100 | #231 | Tragic 12.2% |
| Italians | 2.5 /100 | #232 | Tragic 12.2% |
| Bahamians | 2.3 /100 | #233 | Tragic 12.2% |
| Japanese | 2.3 /100 | #234 | Tragic 12.2% |
| Yup'ik | 2.2 /100 | #235 | Tragic 12.2% |
| Chinese | 2.0 /100 | #236 | Tragic 12.2% |
| Immigrants | Congo | 1.9 /100 | #237 | Tragic 12.2% |
| Norwegians | 1.9 /100 | #238 | Tragic 12.2% |
| Swedes | 1.8 /100 | #239 | Tragic 12.2% |
| Hungarians | 1.7 /100 | #240 | Tragic 12.2% |
| Yugoslavians | 1.7 /100 | #241 | Tragic 12.2% |