Spaniard vs Apache Disability
COMPARE
Spaniard
Apache
Disability
Disability Comparison
Spaniards
Apache
12.5%
DISABILITY
0.2/ 100
METRIC RATING
267th/ 347
METRIC RANK
13.9%
DISABILITY
0.0/ 100
METRIC RATING
320th/ 347
METRIC RANK
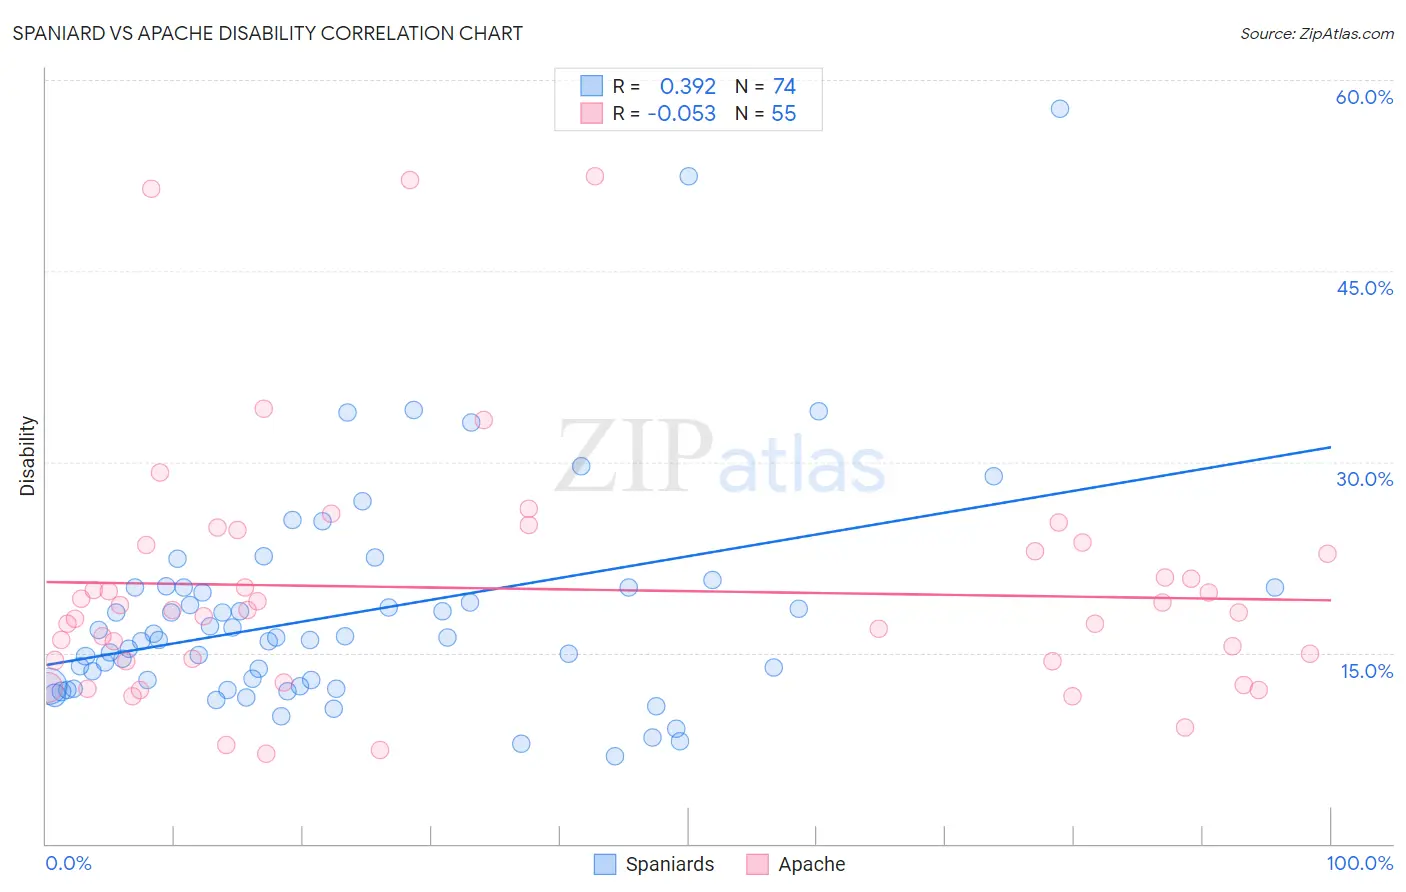
Spaniard vs Apache Disability Correlation Chart
The statistical analysis conducted on geographies consisting of 443,457,716 people shows a mild positive correlation between the proportion of Spaniards and percentage of population with a disability in the United States with a correlation coefficient (R) of 0.392 and weighted average of 12.5%. Similarly, the statistical analysis conducted on geographies consisting of 231,070,506 people shows a slight negative correlation between the proportion of Apache and percentage of population with a disability in the United States with a correlation coefficient (R) of -0.053 and weighted average of 13.9%, a difference of 10.6%.
Disability Correlation Summary
| Measurement | Spaniard | Apache |
| Minimum | 6.9% | 7.1% |
| Maximum | 57.8% | 52.4% |
| Range | 50.9% | 45.3% |
| Mean | 18.1% | 20.0% |
| Median | 16.1% | 18.3% |
| Interquartile 25% (IQ1) | 12.4% | 14.4% |
| Interquartile 75% (IQ3) | 20.1% | 23.5% |
| Interquartile Range (IQR) | 7.7% | 9.1% |
| Standard Deviation (Sample) | 8.8% | 9.7% |
| Standard Deviation (Population) | 8.7% | 9.6% |
Similar Demographics by Disability
Demographics Similar to Spaniards by Disability
In terms of disability, the demographic groups most similar to Spaniards are Czechoslovakian (12.5%, a difference of 0.070%), U.S. Virgin Islander (12.5%, a difference of 0.24%), Immigrants from Germany (12.5%, a difference of 0.26%), Bangladeshi (12.6%, a difference of 0.33%), and Hawaiian (12.5%, a difference of 0.37%).
| Demographics | Rating | Rank | Disability |
| Immigrants | Liberia | 0.4 /100 | #260 | Tragic 12.4% |
| Scandinavians | 0.4 /100 | #261 | Tragic 12.4% |
| Native Hawaiians | 0.3 /100 | #262 | Tragic 12.5% |
| Hawaiians | 0.2 /100 | #263 | Tragic 12.5% |
| Immigrants | Germany | 0.2 /100 | #264 | Tragic 12.5% |
| U.S. Virgin Islanders | 0.2 /100 | #265 | Tragic 12.5% |
| Czechoslovakians | 0.2 /100 | #266 | Tragic 12.5% |
| Spaniards | 0.2 /100 | #267 | Tragic 12.5% |
| Bangladeshis | 0.1 /100 | #268 | Tragic 12.6% |
| Immigrants | Dominican Republic | 0.1 /100 | #269 | Tragic 12.6% |
| Portuguese | 0.1 /100 | #270 | Tragic 12.6% |
| Immigrants | Yemen | 0.1 /100 | #271 | Tragic 12.6% |
| Dominicans | 0.0 /100 | #272 | Tragic 12.7% |
| Finns | 0.0 /100 | #273 | Tragic 12.7% |
| Nepalese | 0.0 /100 | #274 | Tragic 12.8% |
Demographics Similar to Apache by Disability
In terms of disability, the demographic groups most similar to Apache are Paiute (13.9%, a difference of 0.13%), Iroquois (13.8%, a difference of 0.29%), Menominee (13.8%, a difference of 0.51%), American (13.9%, a difference of 0.55%), and Pima (13.7%, a difference of 1.1%).
| Demographics | Rating | Rank | Disability |
| Cree | 0.0 /100 | #313 | Tragic 13.7% |
| Blacks/African Americans | 0.0 /100 | #314 | Tragic 13.7% |
| Puget Sound Salish | 0.0 /100 | #315 | Tragic 13.7% |
| Pima | 0.0 /100 | #316 | Tragic 13.7% |
| Immigrants | Cabo Verde | 0.0 /100 | #317 | Tragic 13.7% |
| Menominee | 0.0 /100 | #318 | Tragic 13.8% |
| Iroquois | 0.0 /100 | #319 | Tragic 13.8% |
| Apache | 0.0 /100 | #320 | Tragic 13.9% |
| Paiute | 0.0 /100 | #321 | Tragic 13.9% |
| Americans | 0.0 /100 | #322 | Tragic 13.9% |
| Comanche | 0.0 /100 | #323 | Tragic 14.1% |
| Chippewa | 0.0 /100 | #324 | Tragic 14.1% |
| Natives/Alaskans | 0.0 /100 | #325 | Tragic 14.2% |
| Osage | 0.0 /100 | #326 | Tragic 14.2% |
| Ottawa | 0.0 /100 | #327 | Tragic 14.2% |