Immigrants from Liberia vs Apache Disability
COMPARE
Immigrants from Liberia
Apache
Disability
Disability Comparison
Immigrants from Liberia
Apache
12.4%
DISABILITY
0.4/ 100
METRIC RATING
260th/ 347
METRIC RANK
13.9%
DISABILITY
0.0/ 100
METRIC RATING
320th/ 347
METRIC RANK
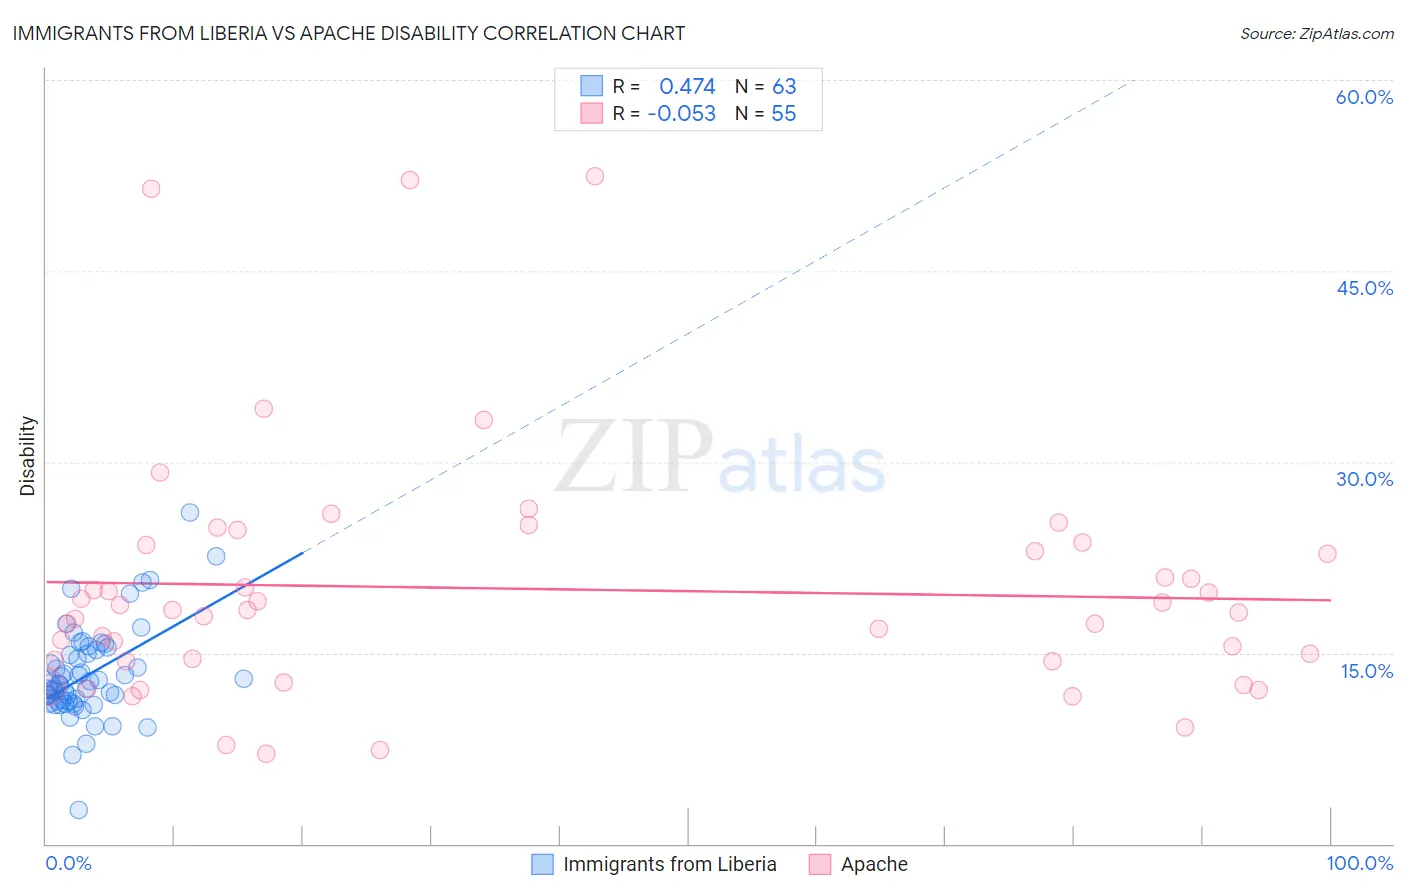
Immigrants from Liberia vs Apache Disability Correlation Chart
The statistical analysis conducted on geographies consisting of 135,259,590 people shows a moderate positive correlation between the proportion of Immigrants from Liberia and percentage of population with a disability in the United States with a correlation coefficient (R) of 0.474 and weighted average of 12.4%. Similarly, the statistical analysis conducted on geographies consisting of 231,070,506 people shows a slight negative correlation between the proportion of Apache and percentage of population with a disability in the United States with a correlation coefficient (R) of -0.053 and weighted average of 13.9%, a difference of 11.7%.
Disability Correlation Summary
| Measurement | Immigrants from Liberia | Apache |
| Minimum | 2.6% | 7.1% |
| Maximum | 26.0% | 52.4% |
| Range | 23.4% | 45.3% |
| Mean | 13.3% | 20.0% |
| Median | 12.5% | 18.3% |
| Interquartile 25% (IQ1) | 11.2% | 14.4% |
| Interquartile 75% (IQ3) | 15.2% | 23.5% |
| Interquartile Range (IQR) | 4.1% | 9.1% |
| Standard Deviation (Sample) | 3.7% | 9.7% |
| Standard Deviation (Population) | 3.7% | 9.6% |
Similar Demographics by Disability
Demographics Similar to Immigrants from Liberia by Disability
In terms of disability, the demographic groups most similar to Immigrants from Liberia are Canadian (12.4%, a difference of 0.030%), Scandinavian (12.4%, a difference of 0.070%), Slavic (12.4%, a difference of 0.090%), Immigrants from Laos (12.4%, a difference of 0.23%), and Immigrants from Dominica (12.4%, a difference of 0.32%).
| Demographics | Rating | Rank | Disability |
| Belgians | 0.8 /100 | #253 | Tragic 12.3% |
| German Russians | 0.8 /100 | #254 | Tragic 12.3% |
| Slovenes | 0.6 /100 | #255 | Tragic 12.4% |
| Immigrants | Dominica | 0.6 /100 | #256 | Tragic 12.4% |
| Immigrants | Laos | 0.5 /100 | #257 | Tragic 12.4% |
| Slavs | 0.5 /100 | #258 | Tragic 12.4% |
| Canadians | 0.4 /100 | #259 | Tragic 12.4% |
| Immigrants | Liberia | 0.4 /100 | #260 | Tragic 12.4% |
| Scandinavians | 0.4 /100 | #261 | Tragic 12.4% |
| Native Hawaiians | 0.3 /100 | #262 | Tragic 12.5% |
| Hawaiians | 0.2 /100 | #263 | Tragic 12.5% |
| Immigrants | Germany | 0.2 /100 | #264 | Tragic 12.5% |
| U.S. Virgin Islanders | 0.2 /100 | #265 | Tragic 12.5% |
| Czechoslovakians | 0.2 /100 | #266 | Tragic 12.5% |
| Spaniards | 0.2 /100 | #267 | Tragic 12.5% |
Demographics Similar to Apache by Disability
In terms of disability, the demographic groups most similar to Apache are Paiute (13.9%, a difference of 0.13%), Iroquois (13.8%, a difference of 0.29%), Menominee (13.8%, a difference of 0.51%), American (13.9%, a difference of 0.55%), and Pima (13.7%, a difference of 1.1%).
| Demographics | Rating | Rank | Disability |
| Cree | 0.0 /100 | #313 | Tragic 13.7% |
| Blacks/African Americans | 0.0 /100 | #314 | Tragic 13.7% |
| Puget Sound Salish | 0.0 /100 | #315 | Tragic 13.7% |
| Pima | 0.0 /100 | #316 | Tragic 13.7% |
| Immigrants | Cabo Verde | 0.0 /100 | #317 | Tragic 13.7% |
| Menominee | 0.0 /100 | #318 | Tragic 13.8% |
| Iroquois | 0.0 /100 | #319 | Tragic 13.8% |
| Apache | 0.0 /100 | #320 | Tragic 13.9% |
| Paiute | 0.0 /100 | #321 | Tragic 13.9% |
| Americans | 0.0 /100 | #322 | Tragic 13.9% |
| Comanche | 0.0 /100 | #323 | Tragic 14.1% |
| Chippewa | 0.0 /100 | #324 | Tragic 14.1% |
| Natives/Alaskans | 0.0 /100 | #325 | Tragic 14.2% |
| Osage | 0.0 /100 | #326 | Tragic 14.2% |
| Ottawa | 0.0 /100 | #327 | Tragic 14.2% |