Immigrants from North America vs Apache Disability
COMPARE
Immigrants from North America
Apache
Disability
Disability Comparison
Immigrants from North America
Apache
12.1%
DISABILITY
5.3/ 100
METRIC RATING
217th/ 347
METRIC RANK
13.9%
DISABILITY
0.0/ 100
METRIC RATING
320th/ 347
METRIC RANK
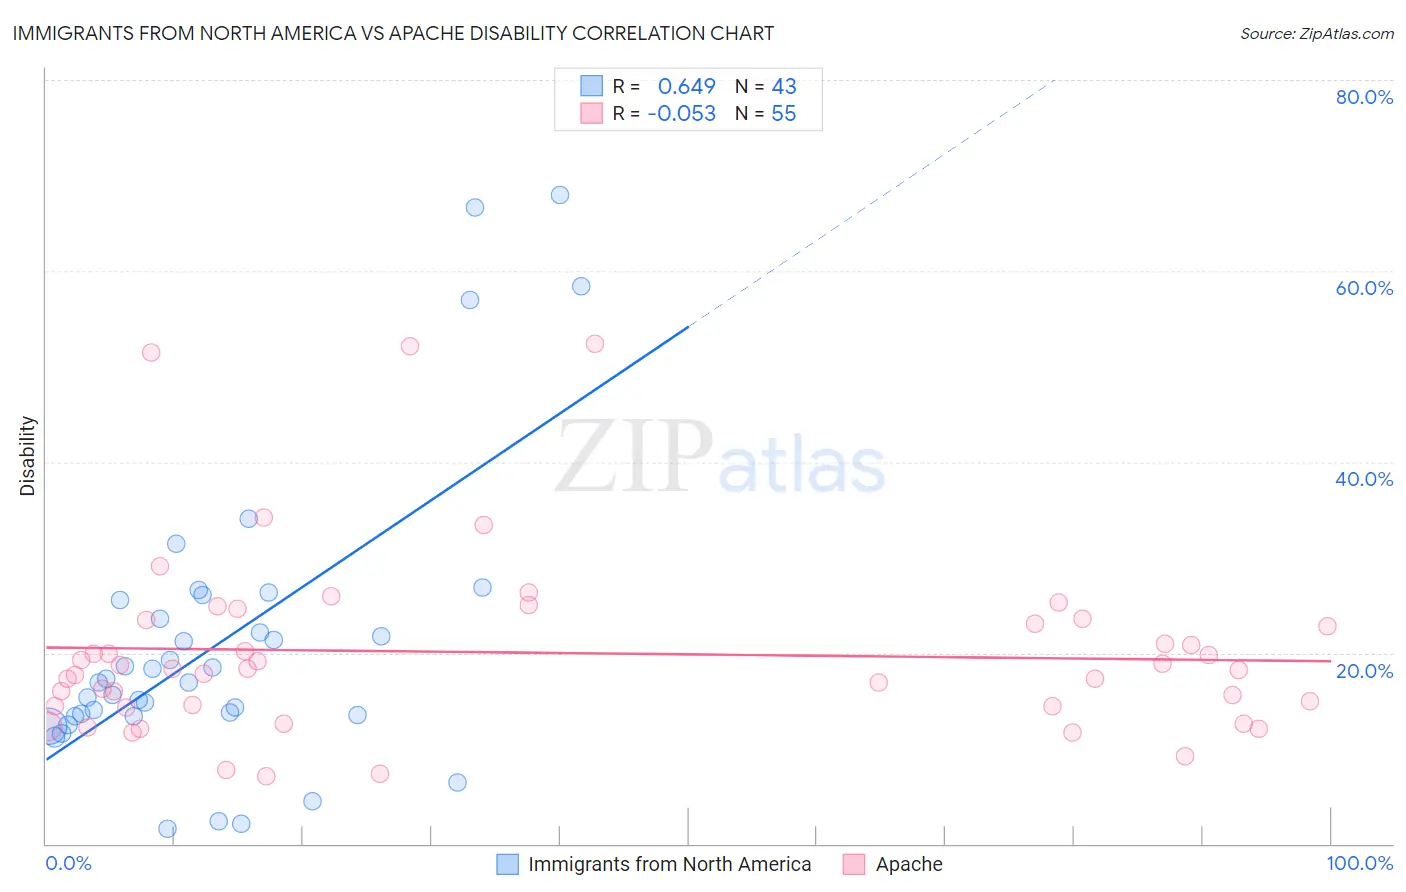
Immigrants from North America vs Apache Disability Correlation Chart
The statistical analysis conducted on geographies consisting of 462,438,985 people shows a significant positive correlation between the proportion of Immigrants from North America and percentage of population with a disability in the United States with a correlation coefficient (R) of 0.649 and weighted average of 12.1%. Similarly, the statistical analysis conducted on geographies consisting of 231,070,506 people shows a slight negative correlation between the proportion of Apache and percentage of population with a disability in the United States with a correlation coefficient (R) of -0.053 and weighted average of 13.9%, a difference of 14.7%.
Disability Correlation Summary
| Measurement | Immigrants from North America | Apache |
| Minimum | 1.6% | 7.1% |
| Maximum | 68.0% | 52.4% |
| Range | 66.4% | 45.3% |
| Mean | 21.0% | 20.0% |
| Median | 16.9% | 18.3% |
| Interquartile 25% (IQ1) | 13.3% | 14.4% |
| Interquartile 75% (IQ3) | 25.6% | 23.5% |
| Interquartile Range (IQR) | 12.2% | 9.1% |
| Standard Deviation (Sample) | 15.3% | 9.7% |
| Standard Deviation (Population) | 15.2% | 9.6% |
Similar Demographics by Disability
Demographics Similar to Immigrants from North America by Disability
In terms of disability, the demographic groups most similar to Immigrants from North America are Panamanian (12.1%, a difference of 0.010%), Immigrants from Jamaica (12.1%, a difference of 0.060%), Croatian (12.1%, a difference of 0.11%), Immigrants from Bahamas (12.1%, a difference of 0.15%), and Immigrants from Canada (12.1%, a difference of 0.16%).
| Demographics | Rating | Rank | Disability |
| Czechs | 7.9 /100 | #210 | Tragic 12.0% |
| Immigrants | Cambodia | 7.3 /100 | #211 | Tragic 12.0% |
| Austrians | 7.2 /100 | #212 | Tragic 12.0% |
| Immigrants | Iraq | 7.1 /100 | #213 | Tragic 12.0% |
| Immigrants | Somalia | 6.8 /100 | #214 | Tragic 12.0% |
| Immigrants | Canada | 6.1 /100 | #215 | Tragic 12.1% |
| Panamanians | 5.4 /100 | #216 | Tragic 12.1% |
| Immigrants | North America | 5.3 /100 | #217 | Tragic 12.1% |
| Immigrants | Jamaica | 5.0 /100 | #218 | Tragic 12.1% |
| Croatians | 4.9 /100 | #219 | Tragic 12.1% |
| Immigrants | Bahamas | 4.7 /100 | #220 | Tragic 12.1% |
| Northern Europeans | 4.2 /100 | #221 | Tragic 12.1% |
| Spanish American Indians | 4.1 /100 | #222 | Tragic 12.1% |
| Hispanics or Latinos | 3.9 /100 | #223 | Tragic 12.1% |
| Mexicans | 3.7 /100 | #224 | Tragic 12.1% |
Demographics Similar to Apache by Disability
In terms of disability, the demographic groups most similar to Apache are Paiute (13.9%, a difference of 0.13%), Iroquois (13.8%, a difference of 0.29%), Menominee (13.8%, a difference of 0.51%), American (13.9%, a difference of 0.55%), and Pima (13.7%, a difference of 1.1%).
| Demographics | Rating | Rank | Disability |
| Cree | 0.0 /100 | #313 | Tragic 13.7% |
| Blacks/African Americans | 0.0 /100 | #314 | Tragic 13.7% |
| Puget Sound Salish | 0.0 /100 | #315 | Tragic 13.7% |
| Pima | 0.0 /100 | #316 | Tragic 13.7% |
| Immigrants | Cabo Verde | 0.0 /100 | #317 | Tragic 13.7% |
| Menominee | 0.0 /100 | #318 | Tragic 13.8% |
| Iroquois | 0.0 /100 | #319 | Tragic 13.8% |
| Apache | 0.0 /100 | #320 | Tragic 13.9% |
| Paiute | 0.0 /100 | #321 | Tragic 13.9% |
| Americans | 0.0 /100 | #322 | Tragic 13.9% |
| Comanche | 0.0 /100 | #323 | Tragic 14.1% |
| Chippewa | 0.0 /100 | #324 | Tragic 14.1% |
| Natives/Alaskans | 0.0 /100 | #325 | Tragic 14.2% |
| Osage | 0.0 /100 | #326 | Tragic 14.2% |
| Ottawa | 0.0 /100 | #327 | Tragic 14.2% |