Australian vs Apache Disability
COMPARE
Australian
Apache
Disability
Disability Comparison
Australians
Apache
11.5%
DISABILITY
82.5/ 100
METRIC RATING
144th/ 347
METRIC RANK
13.9%
DISABILITY
0.0/ 100
METRIC RATING
320th/ 347
METRIC RANK
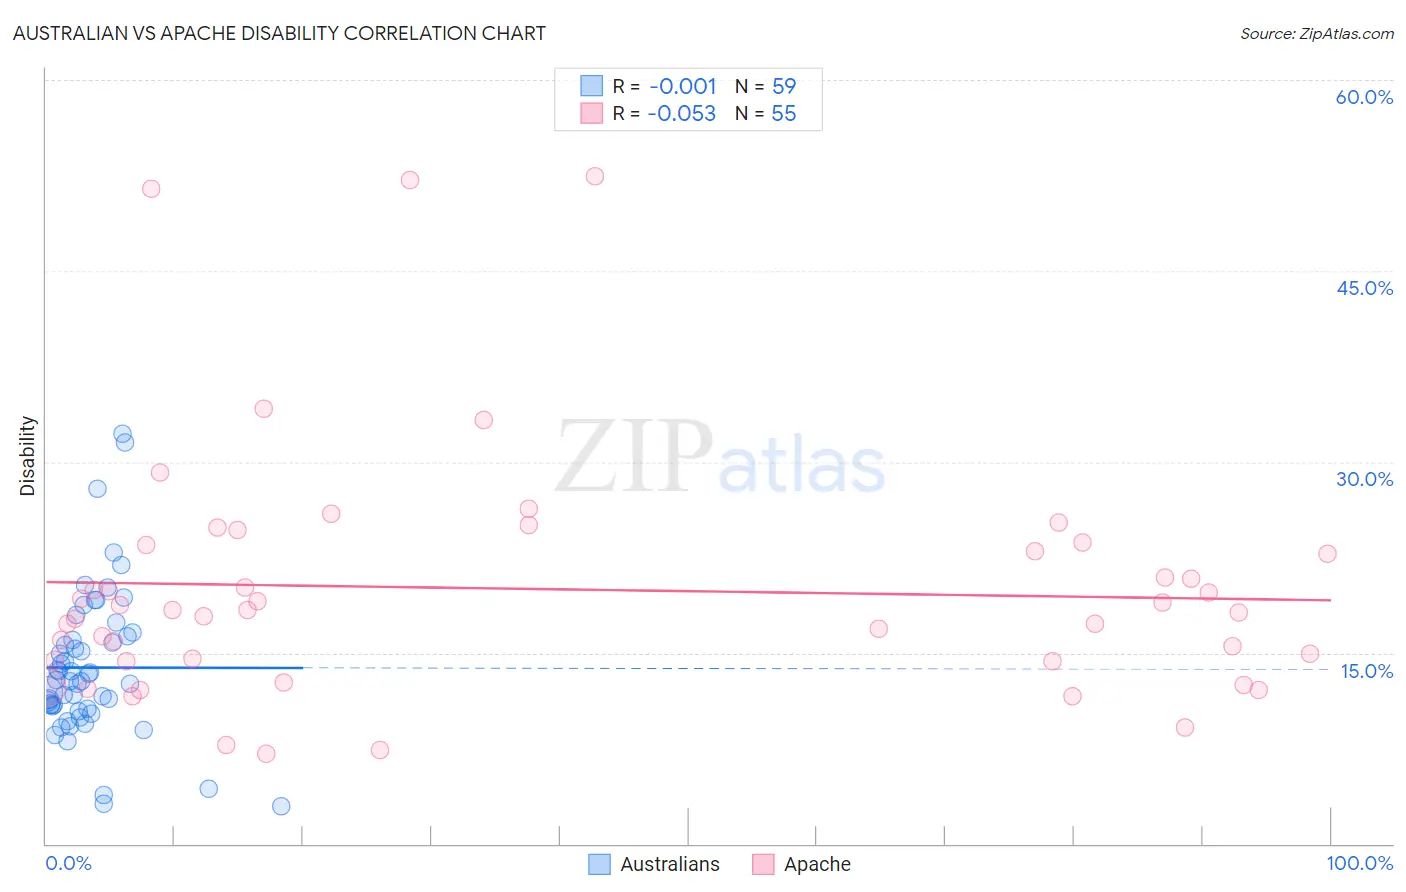
Australian vs Apache Disability Correlation Chart
The statistical analysis conducted on geographies consisting of 224,142,596 people shows no correlation between the proportion of Australians and percentage of population with a disability in the United States with a correlation coefficient (R) of -0.001 and weighted average of 11.5%. Similarly, the statistical analysis conducted on geographies consisting of 231,070,506 people shows a slight negative correlation between the proportion of Apache and percentage of population with a disability in the United States with a correlation coefficient (R) of -0.053 and weighted average of 13.9%, a difference of 20.5%.
Disability Correlation Summary
| Measurement | Australian | Apache |
| Minimum | 2.9% | 7.1% |
| Maximum | 32.3% | 52.4% |
| Range | 29.3% | 45.3% |
| Mean | 13.8% | 20.0% |
| Median | 12.8% | 18.3% |
| Interquartile 25% (IQ1) | 10.6% | 14.4% |
| Interquartile 75% (IQ3) | 16.3% | 23.5% |
| Interquartile Range (IQR) | 5.7% | 9.1% |
| Standard Deviation (Sample) | 5.8% | 9.7% |
| Standard Deviation (Population) | 5.8% | 9.6% |
Similar Demographics by Disability
Demographics Similar to Australians by Disability
In terms of disability, the demographic groups most similar to Australians are Moroccan (11.5%, a difference of 0.070%), Nigerian (11.5%, a difference of 0.090%), Immigrants from Sudan (11.5%, a difference of 0.24%), Immigrants from Hungary (11.5%, a difference of 0.25%), and Immigrants from Grenada (11.5%, a difference of 0.31%).
| Demographics | Rating | Rank | Disability |
| Kenyans | 87.1 /100 | #137 | Excellent 11.5% |
| New Zealanders | 87.0 /100 | #138 | Excellent 11.5% |
| Ghanaians | 87.0 /100 | #139 | Excellent 11.5% |
| Russians | 86.8 /100 | #140 | Excellent 11.5% |
| Immigrants | Grenada | 86.1 /100 | #141 | Excellent 11.5% |
| Immigrants | Sudan | 85.3 /100 | #142 | Excellent 11.5% |
| Moroccans | 83.3 /100 | #143 | Excellent 11.5% |
| Australians | 82.5 /100 | #144 | Excellent 11.5% |
| Nigerians | 81.3 /100 | #145 | Excellent 11.5% |
| Immigrants | Hungary | 79.0 /100 | #146 | Good 11.5% |
| Immigrants | Ukraine | 77.6 /100 | #147 | Good 11.5% |
| Sudanese | 77.1 /100 | #148 | Good 11.5% |
| Immigrants | Norway | 73.2 /100 | #149 | Good 11.6% |
| Romanians | 72.7 /100 | #150 | Good 11.6% |
| Immigrants | Kenya | 72.1 /100 | #151 | Good 11.6% |
Demographics Similar to Apache by Disability
In terms of disability, the demographic groups most similar to Apache are Paiute (13.9%, a difference of 0.13%), Iroquois (13.8%, a difference of 0.29%), Menominee (13.8%, a difference of 0.51%), American (13.9%, a difference of 0.55%), and Pima (13.7%, a difference of 1.1%).
| Demographics | Rating | Rank | Disability |
| Cree | 0.0 /100 | #313 | Tragic 13.7% |
| Blacks/African Americans | 0.0 /100 | #314 | Tragic 13.7% |
| Puget Sound Salish | 0.0 /100 | #315 | Tragic 13.7% |
| Pima | 0.0 /100 | #316 | Tragic 13.7% |
| Immigrants | Cabo Verde | 0.0 /100 | #317 | Tragic 13.7% |
| Menominee | 0.0 /100 | #318 | Tragic 13.8% |
| Iroquois | 0.0 /100 | #319 | Tragic 13.8% |
| Apache | 0.0 /100 | #320 | Tragic 13.9% |
| Paiute | 0.0 /100 | #321 | Tragic 13.9% |
| Americans | 0.0 /100 | #322 | Tragic 13.9% |
| Comanche | 0.0 /100 | #323 | Tragic 14.1% |
| Chippewa | 0.0 /100 | #324 | Tragic 14.1% |
| Natives/Alaskans | 0.0 /100 | #325 | Tragic 14.2% |
| Osage | 0.0 /100 | #326 | Tragic 14.2% |
| Ottawa | 0.0 /100 | #327 | Tragic 14.2% |