Macedonian vs Yuman Disability Age Over 75
COMPARE
Macedonian
Yuman
Disability Age Over 75
Disability Age Over 75 Comparison
Macedonians
Yuman
45.4%
DISABILITY AGE OVER 75
99.9/ 100
METRIC RATING
26th/ 347
METRIC RANK
54.4%
DISABILITY AGE OVER 75
0.0/ 100
METRIC RATING
337th/ 347
METRIC RANK
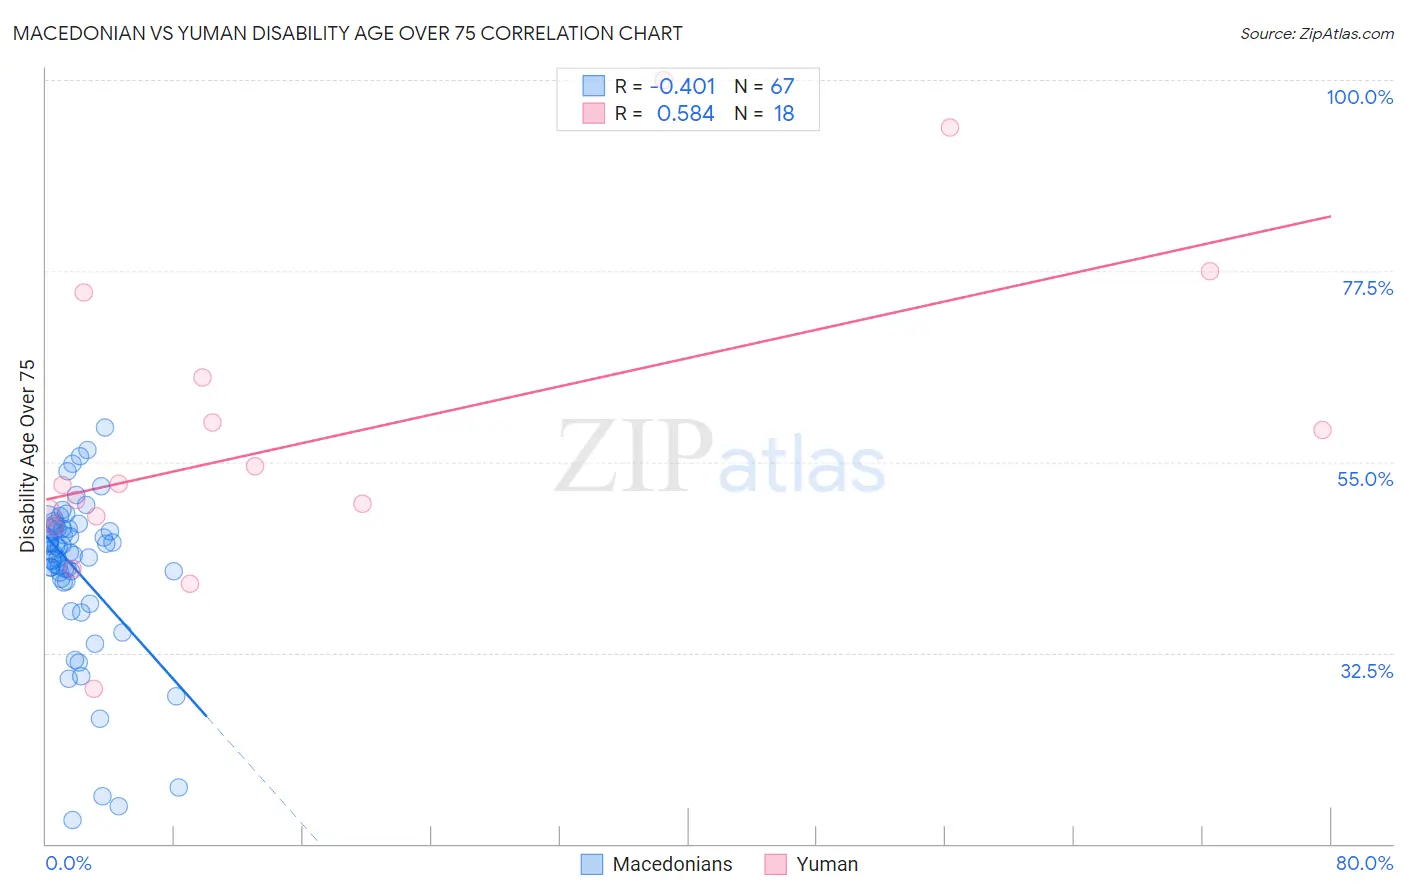
Macedonian vs Yuman Disability Age Over 75 Correlation Chart
The statistical analysis conducted on geographies consisting of 132,585,926 people shows a moderate negative correlation between the proportion of Macedonians and percentage of population with a disability over the age of 75 in the United States with a correlation coefficient (R) of -0.401 and weighted average of 45.4%. Similarly, the statistical analysis conducted on geographies consisting of 40,592,245 people shows a substantial positive correlation between the proportion of Yuman and percentage of population with a disability over the age of 75 in the United States with a correlation coefficient (R) of 0.584 and weighted average of 54.4%, a difference of 19.9%.
Disability Age Over 75 Correlation Summary
| Measurement | Macedonian | Yuman |
| Minimum | 12.8% | 28.2% |
| Maximum | 59.0% | 100.0% |
| Range | 46.2% | 71.8% |
| Mean | 42.2% | 58.1% |
| Median | 44.3% | 52.4% |
| Interquartile 25% (IQ1) | 40.9% | 48.7% |
| Interquartile 75% (IQ3) | 47.1% | 64.9% |
| Interquartile Range (IQR) | 6.2% | 16.3% |
| Standard Deviation (Sample) | 9.5% | 18.3% |
| Standard Deviation (Population) | 9.5% | 17.8% |
Similar Demographics by Disability Age Over 75
Demographics Similar to Macedonians by Disability Age Over 75
In terms of disability age over 75, the demographic groups most similar to Macedonians are Immigrants from Poland (45.4%, a difference of 0.010%), Immigrants from Bolivia (45.4%, a difference of 0.040%), Thai (45.4%, a difference of 0.040%), Polish (45.3%, a difference of 0.080%), and Filipino (45.4%, a difference of 0.080%).
| Demographics | Rating | Rank | Disability Age Over 75 |
| Immigrants | Greece | 100.0 /100 | #19 | Exceptional 45.2% |
| Immigrants | Serbia | 100.0 /100 | #20 | Exceptional 45.3% |
| Immigrants | Belgium | 100.0 /100 | #21 | Exceptional 45.3% |
| Immigrants | South Africa | 100.0 /100 | #22 | Exceptional 45.3% |
| Immigrants | Switzerland | 99.9 /100 | #23 | Exceptional 45.3% |
| Poles | 99.9 /100 | #24 | Exceptional 45.3% |
| Immigrants | Bolivia | 99.9 /100 | #25 | Exceptional 45.4% |
| Macedonians | 99.9 /100 | #26 | Exceptional 45.4% |
| Immigrants | Poland | 99.9 /100 | #27 | Exceptional 45.4% |
| Thais | 99.9 /100 | #28 | Exceptional 45.4% |
| Filipinos | 99.9 /100 | #29 | Exceptional 45.4% |
| Immigrants | Denmark | 99.9 /100 | #30 | Exceptional 45.4% |
| Immigrants | Bulgaria | 99.9 /100 | #31 | Exceptional 45.5% |
| Immigrants | Australia | 99.9 /100 | #32 | Exceptional 45.5% |
| Immigrants | Croatia | 99.9 /100 | #33 | Exceptional 45.5% |
Demographics Similar to Yuman by Disability Age Over 75
In terms of disability age over 75, the demographic groups most similar to Yuman are Immigrants from Armenia (54.3%, a difference of 0.16%), Kiowa (54.2%, a difference of 0.33%), Alaskan Athabascan (54.0%, a difference of 0.85%), Apache (53.6%, a difference of 1.5%), and Colville (55.4%, a difference of 1.8%).
| Demographics | Rating | Rank | Disability Age Over 75 |
| Puerto Ricans | 0.0 /100 | #330 | Tragic 52.9% |
| Hopi | 0.0 /100 | #331 | Tragic 52.9% |
| Natives/Alaskans | 0.0 /100 | #332 | Tragic 53.1% |
| Apache | 0.0 /100 | #333 | Tragic 53.6% |
| Alaskan Athabascans | 0.0 /100 | #334 | Tragic 54.0% |
| Kiowa | 0.0 /100 | #335 | Tragic 54.2% |
| Immigrants | Armenia | 0.0 /100 | #336 | Tragic 54.3% |
| Yuman | 0.0 /100 | #337 | Tragic 54.4% |
| Colville | 0.0 /100 | #338 | Tragic 55.4% |
| Pima | 0.0 /100 | #339 | Tragic 55.8% |
| Pueblo | 0.0 /100 | #340 | Tragic 55.9% |
| Houma | 0.0 /100 | #341 | Tragic 56.2% |
| Lumbee | 0.0 /100 | #342 | Tragic 56.2% |
| Tohono O'odham | 0.0 /100 | #343 | Tragic 56.7% |
| Navajo | 0.0 /100 | #344 | Tragic 58.3% |