Bolivian vs Yuman Disability Age Over 75
COMPARE
Bolivian
Yuman
Disability Age Over 75
Disability Age Over 75 Comparison
Bolivians
Yuman
45.2%
DISABILITY AGE OVER 75
100.0/ 100
METRIC RATING
18th/ 347
METRIC RANK
54.4%
DISABILITY AGE OVER 75
0.0/ 100
METRIC RATING
337th/ 347
METRIC RANK
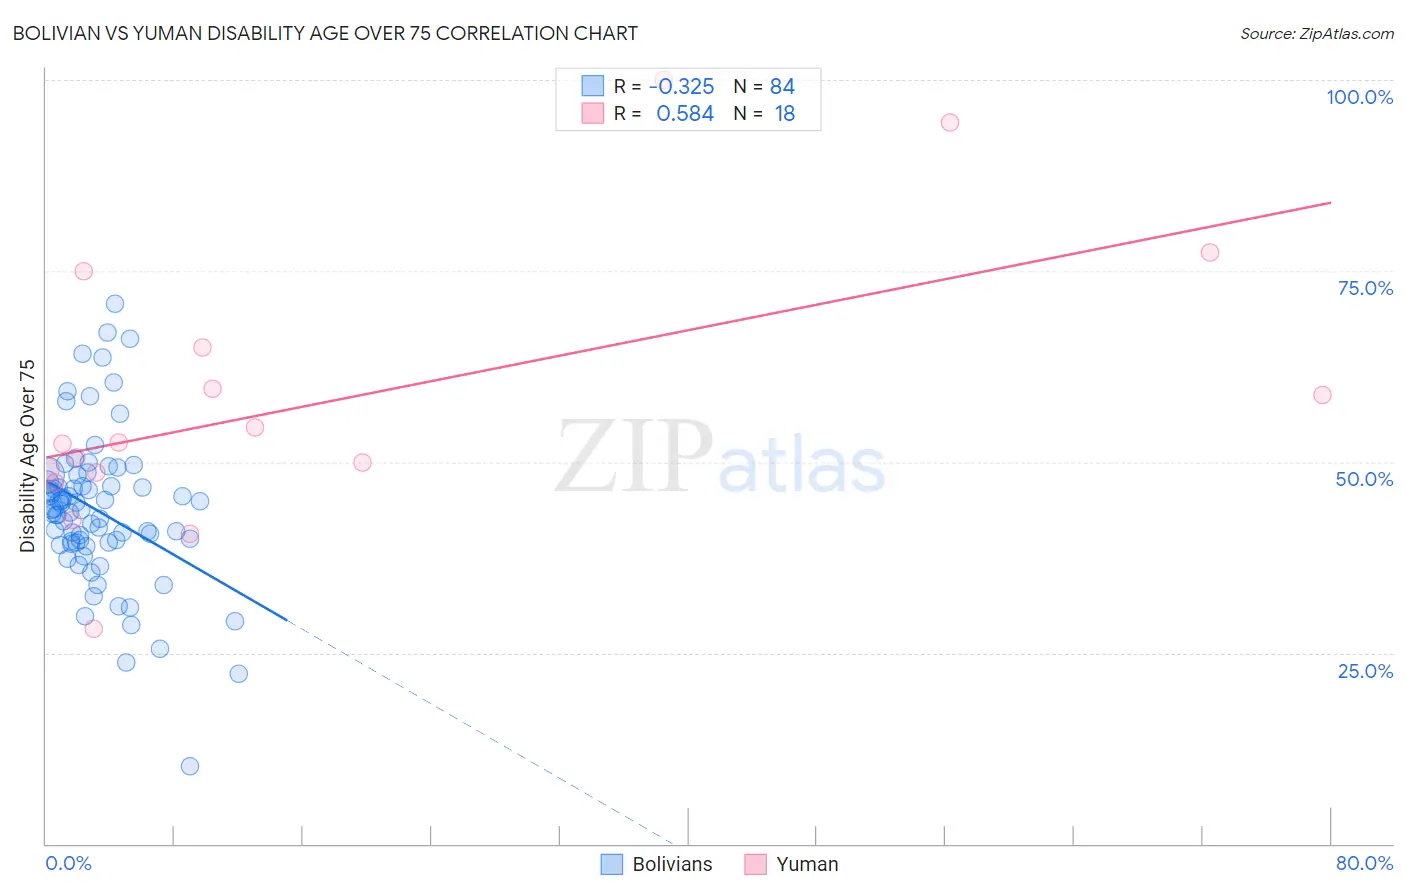
Bolivian vs Yuman Disability Age Over 75 Correlation Chart
The statistical analysis conducted on geographies consisting of 184,497,554 people shows a mild negative correlation between the proportion of Bolivians and percentage of population with a disability over the age of 75 in the United States with a correlation coefficient (R) of -0.325 and weighted average of 45.2%. Similarly, the statistical analysis conducted on geographies consisting of 40,592,245 people shows a substantial positive correlation between the proportion of Yuman and percentage of population with a disability over the age of 75 in the United States with a correlation coefficient (R) of 0.584 and weighted average of 54.4%, a difference of 20.4%.
Disability Age Over 75 Correlation Summary
| Measurement | Bolivian | Yuman |
| Minimum | 10.2% | 28.2% |
| Maximum | 70.7% | 100.0% |
| Range | 60.5% | 71.8% |
| Mean | 43.6% | 58.1% |
| Median | 43.8% | 52.4% |
| Interquartile 25% (IQ1) | 39.4% | 48.7% |
| Interquartile 75% (IQ3) | 47.1% | 64.9% |
| Interquartile Range (IQR) | 7.7% | 16.3% |
| Standard Deviation (Sample) | 10.0% | 18.3% |
| Standard Deviation (Population) | 9.9% | 17.8% |
Similar Demographics by Disability Age Over 75
Demographics Similar to Bolivians by Disability Age Over 75
In terms of disability age over 75, the demographic groups most similar to Bolivians are Immigrants from Greece (45.2%, a difference of 0.010%), Immigrants from India (45.2%, a difference of 0.030%), Immigrants from Northern Europe (45.2%, a difference of 0.040%), Immigrants from Serbia (45.3%, a difference of 0.11%), and Immigrants from Sweden (45.1%, a difference of 0.13%).
| Demographics | Rating | Rank | Disability Age Over 75 |
| Lithuanians | 100.0 /100 | #11 | Exceptional 45.1% |
| Immigrants | Czechoslovakia | 100.0 /100 | #12 | Exceptional 45.1% |
| Latvians | 100.0 /100 | #13 | Exceptional 45.1% |
| Immigrants | Scotland | 100.0 /100 | #14 | Exceptional 45.1% |
| Immigrants | Sweden | 100.0 /100 | #15 | Exceptional 45.1% |
| Immigrants | Northern Europe | 100.0 /100 | #16 | Exceptional 45.2% |
| Immigrants | India | 100.0 /100 | #17 | Exceptional 45.2% |
| Bolivians | 100.0 /100 | #18 | Exceptional 45.2% |
| Immigrants | Greece | 100.0 /100 | #19 | Exceptional 45.2% |
| Immigrants | Serbia | 100.0 /100 | #20 | Exceptional 45.3% |
| Immigrants | Belgium | 100.0 /100 | #21 | Exceptional 45.3% |
| Immigrants | South Africa | 100.0 /100 | #22 | Exceptional 45.3% |
| Immigrants | Switzerland | 99.9 /100 | #23 | Exceptional 45.3% |
| Poles | 99.9 /100 | #24 | Exceptional 45.3% |
| Immigrants | Bolivia | 99.9 /100 | #25 | Exceptional 45.4% |
Demographics Similar to Yuman by Disability Age Over 75
In terms of disability age over 75, the demographic groups most similar to Yuman are Immigrants from Armenia (54.3%, a difference of 0.16%), Kiowa (54.2%, a difference of 0.33%), Alaskan Athabascan (54.0%, a difference of 0.85%), Apache (53.6%, a difference of 1.5%), and Colville (55.4%, a difference of 1.8%).
| Demographics | Rating | Rank | Disability Age Over 75 |
| Puerto Ricans | 0.0 /100 | #330 | Tragic 52.9% |
| Hopi | 0.0 /100 | #331 | Tragic 52.9% |
| Natives/Alaskans | 0.0 /100 | #332 | Tragic 53.1% |
| Apache | 0.0 /100 | #333 | Tragic 53.6% |
| Alaskan Athabascans | 0.0 /100 | #334 | Tragic 54.0% |
| Kiowa | 0.0 /100 | #335 | Tragic 54.2% |
| Immigrants | Armenia | 0.0 /100 | #336 | Tragic 54.3% |
| Yuman | 0.0 /100 | #337 | Tragic 54.4% |
| Colville | 0.0 /100 | #338 | Tragic 55.4% |
| Pima | 0.0 /100 | #339 | Tragic 55.8% |
| Pueblo | 0.0 /100 | #340 | Tragic 55.9% |
| Houma | 0.0 /100 | #341 | Tragic 56.2% |
| Lumbee | 0.0 /100 | #342 | Tragic 56.2% |
| Tohono O'odham | 0.0 /100 | #343 | Tragic 56.7% |
| Navajo | 0.0 /100 | #344 | Tragic 58.3% |