Filipino vs Immigrants from Laos Disability Age Over 75
COMPARE
Filipino
Immigrants from Laos
Disability Age Over 75
Disability Age Over 75 Comparison
Filipinos
Immigrants from Laos
45.4%
DISABILITY AGE OVER 75
99.9/ 100
METRIC RATING
29th/ 347
METRIC RANK
49.2%
DISABILITY AGE OVER 75
0.1/ 100
METRIC RATING
278th/ 347
METRIC RANK
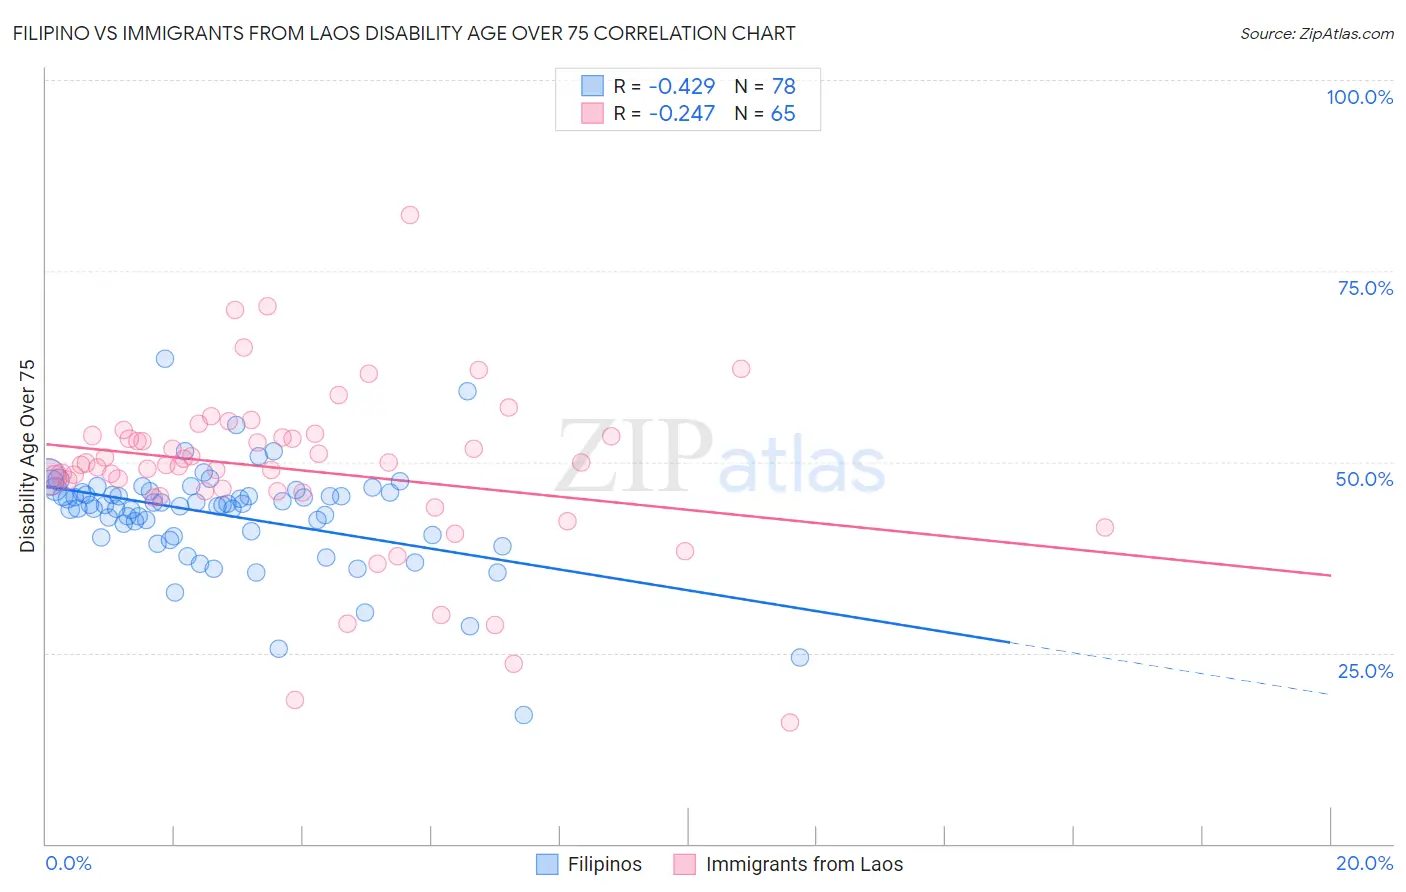
Filipino vs Immigrants from Laos Disability Age Over 75 Correlation Chart
The statistical analysis conducted on geographies consisting of 253,957,149 people shows a moderate negative correlation between the proportion of Filipinos and percentage of population with a disability over the age of 75 in the United States with a correlation coefficient (R) of -0.429 and weighted average of 45.4%. Similarly, the statistical analysis conducted on geographies consisting of 201,421,107 people shows a weak negative correlation between the proportion of Immigrants from Laos and percentage of population with a disability over the age of 75 in the United States with a correlation coefficient (R) of -0.247 and weighted average of 49.2%, a difference of 8.3%.
Disability Age Over 75 Correlation Summary
| Measurement | Filipino | Immigrants from Laos |
| Minimum | 16.9% | 15.9% |
| Maximum | 63.6% | 82.4% |
| Range | 46.6% | 66.5% |
| Mean | 43.1% | 49.0% |
| Median | 44.4% | 49.7% |
| Interquartile 25% (IQ1) | 40.4% | 46.1% |
| Interquartile 75% (IQ3) | 45.9% | 53.4% |
| Interquartile Range (IQR) | 5.5% | 7.3% |
| Standard Deviation (Sample) | 6.8% | 11.0% |
| Standard Deviation (Population) | 6.8% | 10.9% |
Similar Demographics by Disability Age Over 75
Demographics Similar to Filipinos by Disability Age Over 75
In terms of disability age over 75, the demographic groups most similar to Filipinos are Immigrants from Denmark (45.4%, a difference of 0.030%), Thai (45.4%, a difference of 0.040%), Immigrants from Poland (45.4%, a difference of 0.060%), Macedonian (45.4%, a difference of 0.080%), and Immigrants from Bulgaria (45.5%, a difference of 0.090%).
| Demographics | Rating | Rank | Disability Age Over 75 |
| Immigrants | South Africa | 100.0 /100 | #22 | Exceptional 45.3% |
| Immigrants | Switzerland | 99.9 /100 | #23 | Exceptional 45.3% |
| Poles | 99.9 /100 | #24 | Exceptional 45.3% |
| Immigrants | Bolivia | 99.9 /100 | #25 | Exceptional 45.4% |
| Macedonians | 99.9 /100 | #26 | Exceptional 45.4% |
| Immigrants | Poland | 99.9 /100 | #27 | Exceptional 45.4% |
| Thais | 99.9 /100 | #28 | Exceptional 45.4% |
| Filipinos | 99.9 /100 | #29 | Exceptional 45.4% |
| Immigrants | Denmark | 99.9 /100 | #30 | Exceptional 45.4% |
| Immigrants | Bulgaria | 99.9 /100 | #31 | Exceptional 45.5% |
| Immigrants | Australia | 99.9 /100 | #32 | Exceptional 45.5% |
| Immigrants | Croatia | 99.9 /100 | #33 | Exceptional 45.5% |
| Russians | 99.9 /100 | #34 | Exceptional 45.5% |
| Norwegians | 99.9 /100 | #35 | Exceptional 45.5% |
| Immigrants | Taiwan | 99.9 /100 | #36 | Exceptional 45.5% |
Demographics Similar to Immigrants from Laos by Disability Age Over 75
In terms of disability age over 75, the demographic groups most similar to Immigrants from Laos are Hawaiian (49.2%, a difference of 0.030%), Immigrants from Uzbekistan (49.2%, a difference of 0.060%), Immigrants from Dominica (49.1%, a difference of 0.17%), Immigrants from Guatemala (49.1%, a difference of 0.18%), and Immigrants from Iraq (49.1%, a difference of 0.26%).
| Demographics | Rating | Rank | Disability Age Over 75 |
| Fijians | 0.2 /100 | #271 | Tragic 49.0% |
| Assyrians/Chaldeans/Syriacs | 0.2 /100 | #272 | Tragic 49.1% |
| Immigrants | Iraq | 0.1 /100 | #273 | Tragic 49.1% |
| Immigrants | Guatemala | 0.1 /100 | #274 | Tragic 49.1% |
| Immigrants | Dominica | 0.1 /100 | #275 | Tragic 49.1% |
| Immigrants | Uzbekistan | 0.1 /100 | #276 | Tragic 49.2% |
| Hawaiians | 0.1 /100 | #277 | Tragic 49.2% |
| Immigrants | Laos | 0.1 /100 | #278 | Tragic 49.2% |
| Guamanians/Chamorros | 0.0 /100 | #279 | Tragic 49.4% |
| Bangladeshis | 0.0 /100 | #280 | Tragic 49.4% |
| Belizeans | 0.0 /100 | #281 | Tragic 49.4% |
| Blacks/African Americans | 0.0 /100 | #282 | Tragic 49.5% |
| Samoans | 0.0 /100 | #283 | Tragic 49.5% |
| Immigrants | Latin America | 0.0 /100 | #284 | Tragic 49.5% |
| Crow | 0.0 /100 | #285 | Tragic 49.6% |