Nigerian vs Immigrants from Laos Disability Age Over 75
COMPARE
Nigerian
Immigrants from Laos
Disability Age Over 75
Disability Age Over 75 Comparison
Nigerians
Immigrants from Laos
47.7%
DISABILITY AGE OVER 75
19.2/ 100
METRIC RATING
204th/ 347
METRIC RANK
49.2%
DISABILITY AGE OVER 75
0.1/ 100
METRIC RATING
278th/ 347
METRIC RANK
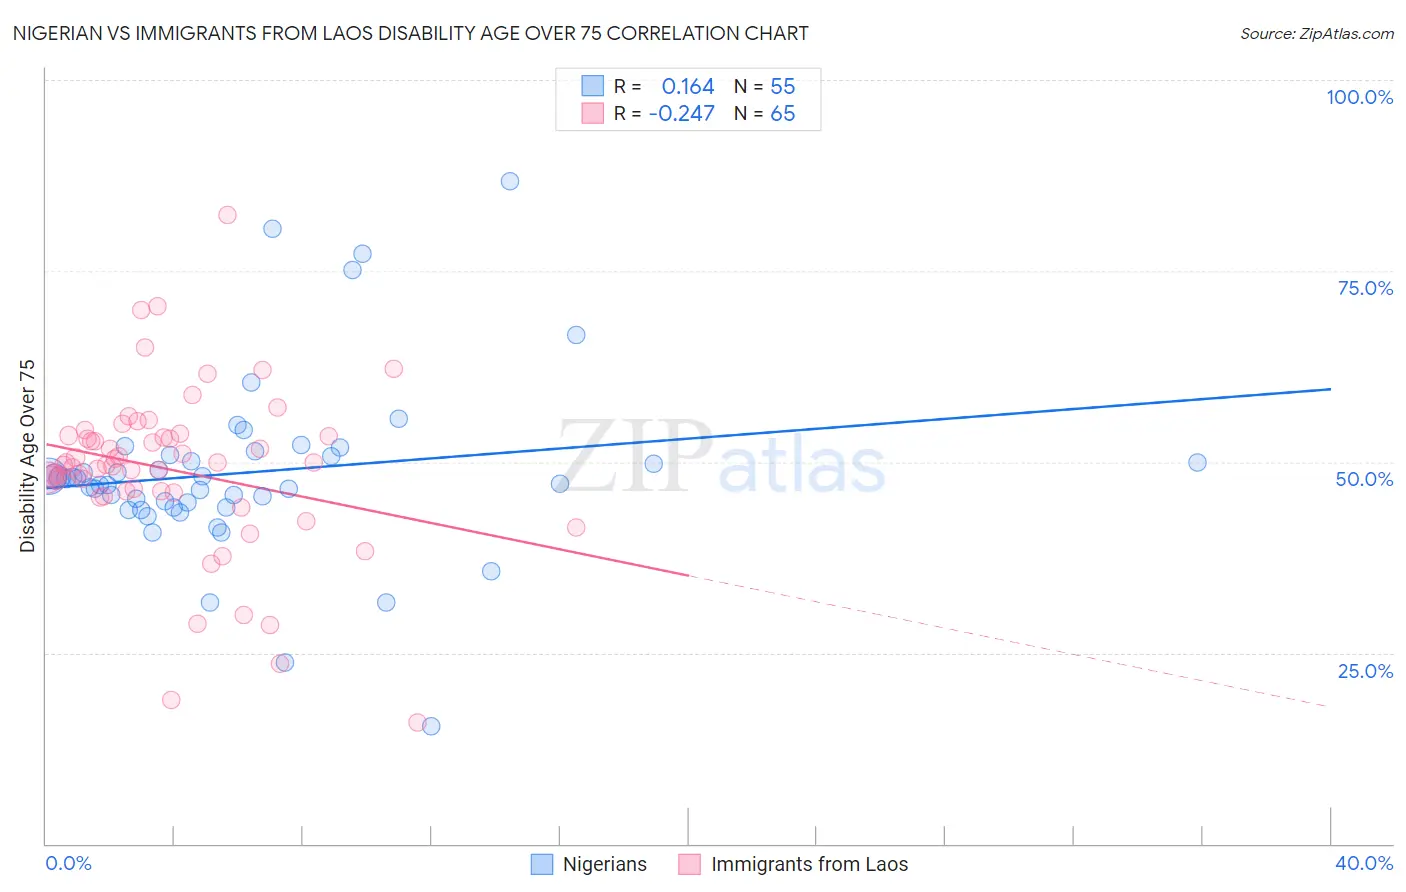
Nigerian vs Immigrants from Laos Disability Age Over 75 Correlation Chart
The statistical analysis conducted on geographies consisting of 331,999,624 people shows a poor positive correlation between the proportion of Nigerians and percentage of population with a disability over the age of 75 in the United States with a correlation coefficient (R) of 0.164 and weighted average of 47.7%. Similarly, the statistical analysis conducted on geographies consisting of 201,421,107 people shows a weak negative correlation between the proportion of Immigrants from Laos and percentage of population with a disability over the age of 75 in the United States with a correlation coefficient (R) of -0.247 and weighted average of 49.2%, a difference of 3.1%.
Disability Age Over 75 Correlation Summary
| Measurement | Nigerian | Immigrants from Laos |
| Minimum | 15.5% | 15.9% |
| Maximum | 86.8% | 82.4% |
| Range | 71.3% | 66.5% |
| Mean | 48.6% | 49.0% |
| Median | 47.8% | 49.7% |
| Interquartile 25% (IQ1) | 44.0% | 46.1% |
| Interquartile 75% (IQ3) | 50.9% | 53.4% |
| Interquartile Range (IQR) | 6.8% | 7.3% |
| Standard Deviation (Sample) | 11.8% | 11.0% |
| Standard Deviation (Population) | 11.7% | 10.9% |
Similar Demographics by Disability Age Over 75
Demographics Similar to Nigerians by Disability Age Over 75
In terms of disability age over 75, the demographic groups most similar to Nigerians are Immigrants from Ghana (47.7%, a difference of 0.010%), Jamaican (47.7%, a difference of 0.010%), Trinidadian and Tobagonian (47.7%, a difference of 0.030%), Immigrants from Bahamas (47.7%, a difference of 0.050%), and Immigrants from Cuba (47.7%, a difference of 0.060%).
| Demographics | Rating | Rank | Disability Age Over 75 |
| Pakistanis | 23.4 /100 | #197 | Fair 47.7% |
| Immigrants | Ukraine | 23.2 /100 | #198 | Fair 47.7% |
| Immigrants | Eritrea | 22.4 /100 | #199 | Fair 47.7% |
| Immigrants | Somalia | 21.4 /100 | #200 | Fair 47.7% |
| Immigrants | Cuba | 20.9 /100 | #201 | Fair 47.7% |
| Immigrants | Bahamas | 20.7 /100 | #202 | Fair 47.7% |
| Trinidadians and Tobagonians | 20.0 /100 | #203 | Fair 47.7% |
| Nigerians | 19.2 /100 | #204 | Poor 47.7% |
| Immigrants | Ghana | 19.1 /100 | #205 | Poor 47.7% |
| Jamaicans | 19.0 /100 | #206 | Poor 47.7% |
| Immigrants | Syria | 17.4 /100 | #207 | Poor 47.8% |
| Immigrants | Senegal | 16.9 /100 | #208 | Poor 47.8% |
| Immigrants | Indonesia | 14.2 /100 | #209 | Poor 47.8% |
| Vietnamese | 11.9 /100 | #210 | Poor 47.9% |
| Panamanians | 11.8 /100 | #211 | Poor 47.9% |
Demographics Similar to Immigrants from Laos by Disability Age Over 75
In terms of disability age over 75, the demographic groups most similar to Immigrants from Laos are Hawaiian (49.2%, a difference of 0.030%), Immigrants from Uzbekistan (49.2%, a difference of 0.060%), Immigrants from Dominica (49.1%, a difference of 0.17%), Immigrants from Guatemala (49.1%, a difference of 0.18%), and Immigrants from Iraq (49.1%, a difference of 0.26%).
| Demographics | Rating | Rank | Disability Age Over 75 |
| Fijians | 0.2 /100 | #271 | Tragic 49.0% |
| Assyrians/Chaldeans/Syriacs | 0.2 /100 | #272 | Tragic 49.1% |
| Immigrants | Iraq | 0.1 /100 | #273 | Tragic 49.1% |
| Immigrants | Guatemala | 0.1 /100 | #274 | Tragic 49.1% |
| Immigrants | Dominica | 0.1 /100 | #275 | Tragic 49.1% |
| Immigrants | Uzbekistan | 0.1 /100 | #276 | Tragic 49.2% |
| Hawaiians | 0.1 /100 | #277 | Tragic 49.2% |
| Immigrants | Laos | 0.1 /100 | #278 | Tragic 49.2% |
| Guamanians/Chamorros | 0.0 /100 | #279 | Tragic 49.4% |
| Bangladeshis | 0.0 /100 | #280 | Tragic 49.4% |
| Belizeans | 0.0 /100 | #281 | Tragic 49.4% |
| Blacks/African Americans | 0.0 /100 | #282 | Tragic 49.5% |
| Samoans | 0.0 /100 | #283 | Tragic 49.5% |
| Immigrants | Latin America | 0.0 /100 | #284 | Tragic 49.5% |
| Crow | 0.0 /100 | #285 | Tragic 49.6% |