Zip Codes with the Highest Percentage of Immigrants from Argentina in Pleasanton, CA
On this page
RELATED REPORTS & OPTIONS
Argentina
Population
Highest PopulationHighest Population DensityLowest Population DensityMale / Female RatioFemale / Male RatioOldest PopulationOldest Population | MaleOldest Population | FemaleYoungest PopulationYoungest Population | MaleYoungest Population | Female
Families and Households
Largest Family SizeLargest Household SizeMost Single FathersMost Single MothersFewest Single FathersFewest Single MothersSmallest Family SizeSmallest Household Size
Female Fertility
Highest Birth Rate | All WomenHighest Birth Rate | Women 35+Highest Birth Rate | Below PovertyHighest Birth Rate | Public IncomeHighest Birth Rate | In Labor ForceLowest Birth Rate | All WomenLowest Birth Rate | Women 35+Lowest Birth Rate | Below PovertyLowest Birth Rate | Public IncomeLowest Birth Rate | In Labor Force
Female Fertility (Unmarried)
Race (Community Size)
Race (Percentage)
Ancestry (Community Size)
AfghanAfricanAmericanApacheArabArgentineanAustrianBasqueBhutaneseBlackfeetBrazilianBritishBurmeseCanadianCentral AmericanChileanChippewaColombianCroatianCzechDanishDutchEastern EuropeanEgyptianEnglishEuropeanFilipinoFinnishFrenchFrench CanadianGermanGreekGuamanian / ChamorroHonduranHungarianIndian (Asian)IranianIrishItalianKoreanLaotianLatvianLebaneseLithuanianMexicanMexican American IndianNative HawaiianNicaraguanNorthern EuropeanNorwegianPakistaniPeruvianPolishPortuguesePuerto RicanRussianSalvadoranScandinavianScotch-IrishScottishSerbianSlovakSloveneSouth AmericanSpaniardSpanishSri LankanSubsaharan AfricanSwedishSwissThaiTrinidadian and TobagonianTurkishUkrainianWelshYugoslavian
Ancestry (Percentage)
AfghanAfricanAmericanApacheArabArgentineanAustrianBasqueBhutaneseBlackfeetBrazilianBritishBurmeseCanadianCentral AmericanChileanChippewaColombianCroatianCzechDanishDutchEastern EuropeanEgyptianEnglishEuropeanFilipinoFinnishFrenchFrench CanadianGermanGreekGuamanian / ChamorroHonduranHungarianIndian (Asian)IranianIrishItalianKoreanLaotianLatvianLebaneseLithuanianMexicanMexican American IndianNative HawaiianNicaraguanNorthern EuropeanNorwegianPakistaniPeruvianPolishPortuguesePuerto RicanRussianSalvadoranScandinavianScotch-IrishScottishSerbianSlovakSloveneSouth AmericanSpaniardSpanishSri LankanSubsaharan AfricanSwedishSwissThaiTrinidadian and TobagonianTurkishUkrainianWelshYugoslavian
Immigrant Origin (Total)
AfghanistanAfricaArgentinaAsiaAzoresBangladeshBelgiumBrazilCanadaCaribbeanCentral AmericaChileChinaColombiaEastern AfricaEastern AsiaEastern EuropeEgyptEl SalvadorEnglandEthiopiaEuropeFijiFranceGermanyGreeceHong KongIndiaIndonesiaIranItalyJapanKoreaLatin AmericaMalaysiaMexicoNetherlandsNorthern AfricaNorthern EuropeOceaniaPakistanPhilippinesPolandPortugalRussiaSingaporeSouth AmericaSouth Central AsiaSouth Eastern AsiaSouthern EuropeSwedenTaiwanThailandTrinidad and TobagoTurkeyUkraineVietnamWestern AsiaWestern Europe
Immigrant Origin (Percentage)
AfghanistanAfricaArgentinaAsiaAzoresBangladeshBelgiumBrazilCanadaCaribbeanCentral AmericaChileChinaColombiaEastern AfricaEastern AsiaEastern EuropeEgyptEl SalvadorEnglandEthiopiaEuropeFijiFranceGermanyGreeceHong KongIndiaIndonesiaIranItalyJapanKoreaLatin AmericaMalaysiaMexicoNetherlandsNorthern AfricaNorthern EuropeOceaniaPakistanPhilippinesPolandPortugalRussiaSingaporeSouth AmericaSouth Central AsiaSouth Eastern AsiaSouthern EuropeSwedenTaiwanThailandTrinidad and TobagoTurkeyUkraineVietnamWestern AsiaWestern Europe
Income
Highest Per Capita IncomeHighest Earnings | MaleHighest Earnings | FemaleHighest Wage/Income Gap ($)Highest Wage/Income Gap (%)Highest Inequality / Gini IndexLowest Per Capita IncomeLowest Earnings | MaleLowest Earnings | FemaleLowest Wage/Income Gap ($)Lowest Wage/Income Gap (%)Lowest Inequality / Gini Index
Income (Families)
Highest Family IncomeLowest Family IncomeFamily Income | $0-10kFamily Income | $100k+Family Income | $200k+
Income (Households)
Highest Household IncomeLowest Household IncomeHousehold Income | $0-10kHousehold Income | $200k+Household Income | $100k+
Poverty
Highest PovertyHighest Poverty | MaleHighest Poverty | FemaleHighest Poverty | Female 18-24Highest Poverty | Female 25-34Highest Poverty | Child 0-5Highest Poverty | Child 0-16Highest Poverty | Boys 0-16Highest Poverty | Girls 0-16Highest Poverty | Seniors 65+Highest Poverty | Seniors 75+ Lowest PovertyLowest Poverty | MaleLowest Poverty | FemaleLowest Poverty | Child 0-5Lowest Poverty | Child 0-16Lowest Poverty | Boys 0-16Lowest Poverty | Girls 0-16Lowest Poverty | Seniors 65+Lowest Poverty | Seniors 75+
Poverty (Families)
Highest Family PovertyHighest Poverty | Married CoupleHighest Poverty | Single MaleHighest Poverty | Single FemaleHighest Poverty | Single FatherHighest Poverty | Single MotherLowest Family PovertyLowest Poverty | Married CoupleLowest Poverty | Single MaleLowest Poverty | Single FemaleLowest Poverty | Single FatherLowest Poverty | Single Mother
Unemployment
Highest UnemploymentHighest Unemployment | MaleHighest Unemployment | FemaleHighest Unemployment | Youth < 25Highest Unemployment | Senior > 65Lowest UnemploymentLowest Unemployment | MaleLowest Unemployment | FemaleLowest Unemployment | Youth < 25Lowest Unemployment | Senior > 65
Employment Occupations
Architecture & EngineeringArts, Media & EntertainmentBusiness & FinancialCleaning & MaintenanceCommunity & Social Service Computer & MathematicsComputer, Engineering & ScienceConstruction & ExtractionEducation Instruction & LibraryEducation, Arts & MediaFirefighting & PreventionFood Preparation & ServingHealth Diagnosing & TreatingHealth TechnologistsHealthcare SupportInstallation, Maintenance & RepairLaw EnforcementLegal Services & SupportLife, Physical & Social ScienceManagementMaterial MovingOffice & AdministrationPersonal Care and ServiceProductionSales & RelatedSecurity & ProtectionTransportation
Employment Industries
Accommodation & Food ServicesAdministrative & Support ServicesAgriculture, Fishing & HuntingArts, Entertainment & RecreationConstructionEducational ServicesEnterprise ManagementFinance & InsuranceHealth Care & Social AssistanceInformation & TechnologyManufacturingProfessional & Scientific ServicesPublic AdministrationReal Estate, Rental & LeasingRetail TradeTransportation & WarehousingUtilitiesWholesale Trade
Employer Class
Private Company EmployeesSelf-Employed / IncorporatedSelf-Employed / Not IncorporatedNot-for-profit OrganizationsLocal Government EmployeesState Government EmployeesFederal Government Employees
Commute Time
Longest CommuteLongest Commute | MaleLongest Commute | FemaleShortest CommuteShortest Commute | MaleShortest Commute | Female
Commute Means
School Enrollment
In Private SchoolNursery / PreschoolKindergartenElementary SchoolMiddle SchoolHigh SchoolCollegeUniversity
Education by Degree Field
Computers and MathematicsBio, Nature & AgriculturalPhysical and Health SciencesPsychologySocial SciencesEngineeringMultidisciplinary StudiesScience and EngineeringBusinessEducationLiterature and LanguagesLiberal Arts and HistoryVisual and Performing ArtsCommunicationsArts and Humanities
Occupancy
Finances
Highest Median Housing CostsHighest Property PricesHighest Owner Housing CostsHighest Renter Housing CostsHighest Housing Costs / IncomeLowest Median Housing CostsLowest Property PricesLowest Owner Housing CostsLowest Renter Housing CostsLowest Housing Costs / Income
Physical Characteristics
Pleasanton
States
AlabamaAlaskaArizonaArkansasCaliforniaColoradoConnecticutDelawareDistrict Of ColumbiaFloridaGeorgiaHawaiiIdahoIllinoisIndianaIowaKansasKentuckyLouisianaMaineMarylandMassachusettsMichiganMinnesotaMississippiMissouriMontanaNebraskaNevadaNew HampshireNew JerseyNew MexicoNew YorkNorth CarolinaNorth DakotaOhioOklahomaOregonPennsylvaniaPuerto RicoRhode IslandSouth CarolinaSouth DakotaTennesseeTexasUtahVermontVirginiaWashingtonWest VirginiaWisconsinWyoming
California Cities
AlhambraAnaheimArcadiaBakersfieldBerkeleyBeverly HillsBuena ParkBurbankCamarilloCanyon CountryCarlsbadCarsonChicoChinoChula VistaConcordCoronaCosta MesaCulver CityDanvilleDavisDowneyEl MonteEncinoFairfieldFontanaFremontFresnoFullertonGarden GroveGardenaGlendaleGlendoraHaywardHesperiaHuntington BeachIndioIrvineLa MesaLa PuenteLake ElsinoreLakewoodLancasterLodiLong BeachLos AltosLos AngelesMission ViejoModestoMoreno ValleyMountain ViewNapaNewport BeachNorth HollywoodNorthridgeOaklandOceansideOntarioOrangeOxnardPalm DesertPalm SpringsPalmdalePalo AltoPasadenaPetalumaPleasantonPomonaRancho CucamongaRedondo BeachRedwood CityRiversideRosevilleSacramentoSan BernardinoSan ClementeSan DiegoSan FranciscoSan GabrielSan JoseSan MateoSan PedroSan RafaelSan RamonSanta AnaSanta BarbaraSanta ClaraSanta ClaritaSanta CruzSanta MariaSanta MonicaSanta RosaSherman OaksSimi ValleyStocktonSunnyvaleTemeculaThousand OaksTorranceTracyTustinUplandVacavilleValenciaVan NuysVenturaVisaliaVistaWalnut CreekWest CovinaWhittierWoodland HillsYorba Linda
Compare Zip Codes
Comparison Subject
Compare StatesCompare CitiesCompare Zip Codes
Map of Zip Codes with the Highest Percentage of Immigrants from Argentina in Pleasanton
0.027%
0.071%
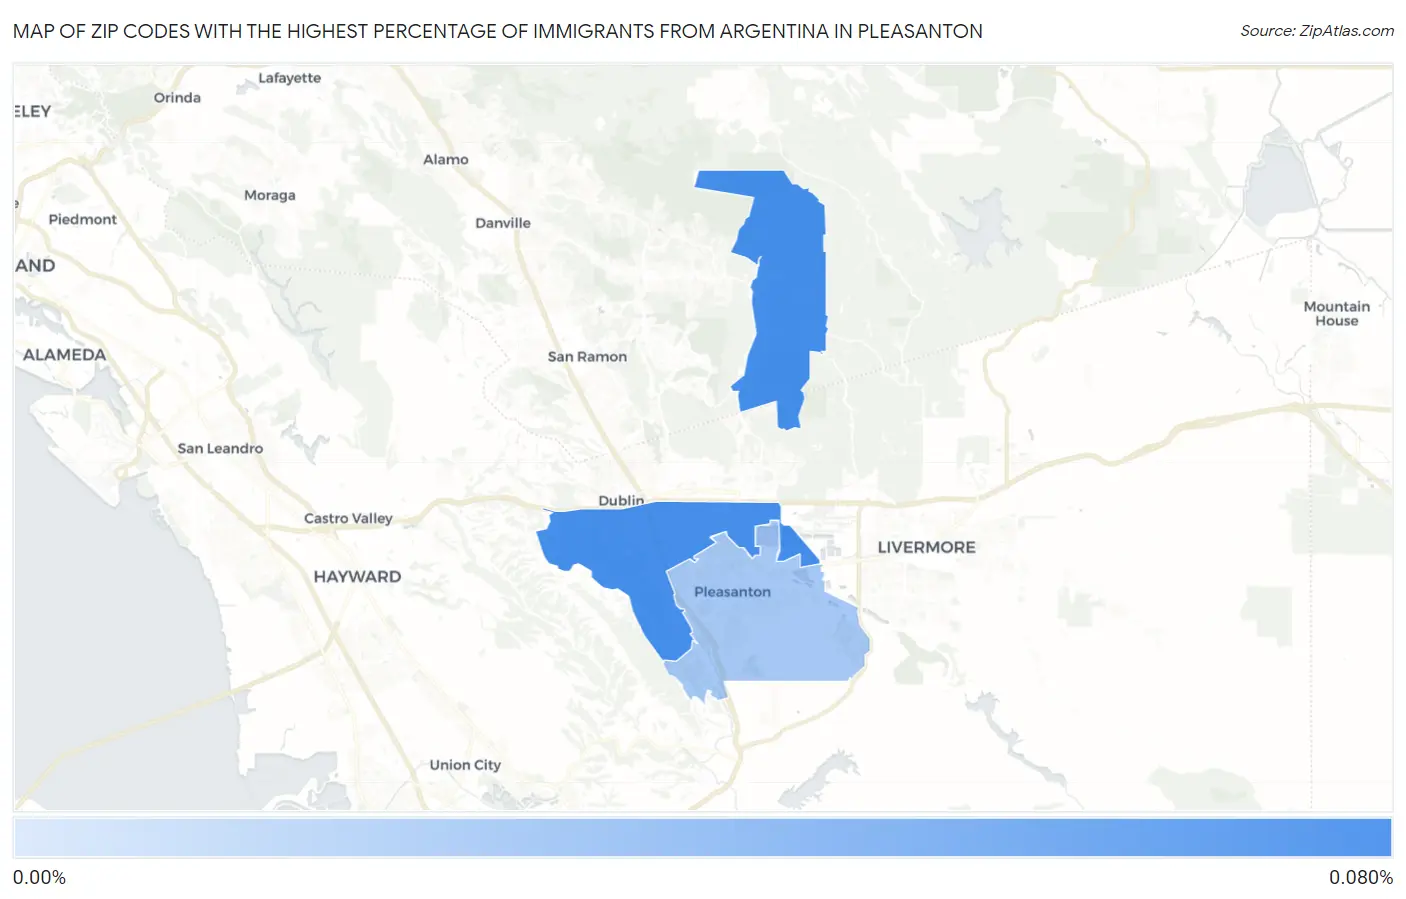
Zip Codes with the Highest Percentage of Immigrants from Argentina in Pleasanton, CA
| Zip Code | Argentina | vs State | vs National | |
| 1. | 94588 | 0.071% | 0.086%(-0.015)#-1 | 0.060%(+0.011)#0 |
| 2. | 94566 | 0.027% | 0.086%(-0.060)#0 | 0.060%(-0.034)#1 |
1
Common Questions
What are the Top Zip Codes with the Highest Percentage of Immigrants from Argentina in Pleasanton, CA?
Top Zip Codes with the Highest Percentage of Immigrants from Argentina in Pleasanton, CA are:
What zip code has the Highest Percentage of Immigrants from Argentina in Pleasanton, CA?
94588 has the Highest Percentage of Immigrants from Argentina in Pleasanton, CA with 0.071%.
What is the Percentage of Immigrants from Argentina in Pleasanton, CA?
Percentage of Immigrants from Argentina in Pleasanton is 0.047%.
What is the Percentage of Immigrants from Argentina in California?
Percentage of Immigrants from Argentina in California is 0.086%.
What is the Percentage of Immigrants from Argentina in the United States?
Percentage of Immigrants from Argentina in the United States is 0.060%.