Zip Codes with the Highest Percentage of Households Heated by Bottled Gas / Liquid Propane in Castro Valley, CA
RELATED REPORTS & OPTIONS
Bottled Gas / LP Heating
Castro Valley
Compare Zip Codes
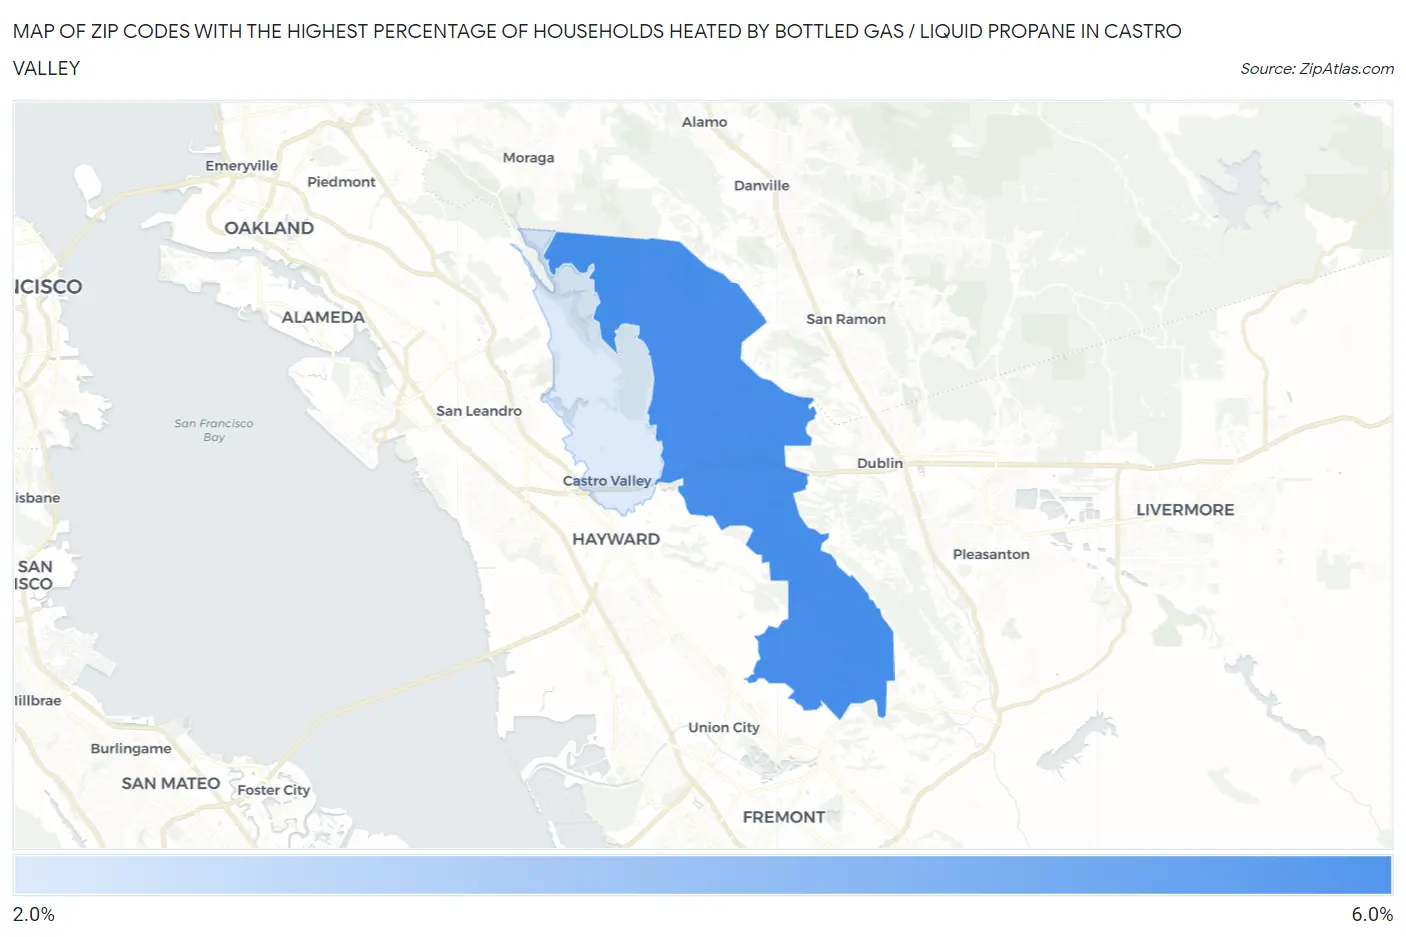
Map of Zip Codes with the Highest Percentage of Households Heated by Bottled Gas / Liquid Propane in Castro Valley
2.1%
5.3%
Zip Codes with the Highest Percentage of Households Heated by Bottled Gas / Liquid Propane in Castro Valley, CA
| Zip Code | Bottled Gas / LP Heating | vs State | vs National | |
| 1. | 94552 | 5.3% | 3.5%(+1.80)#597 | 4.9%(+0.400)#18,225 |
| 2. | 94546 | 2.1% | 3.5%(-1.40)#887 | 4.9%(-2.80)#22,825 |
1
Common Questions
What are the Top Zip Codes with the Highest Percentage of Households Heated by Bottled Gas / Liquid Propane in Castro Valley, CA?
Top Zip Codes with the Highest Percentage of Households Heated by Bottled Gas / Liquid Propane in Castro Valley, CA are:
What zip code has the Highest Percentage of Households Heated by Bottled Gas / Liquid Propane in Castro Valley, CA?
94552 has the Highest Percentage of Households Heated by Bottled Gas / Liquid Propane in Castro Valley, CA with 5.3%.
What is the Percentage of Households Heated by Bottled Gas / Liquid Propane in Castro Valley, CA?
Percentage of Households Heated by Bottled Gas / Liquid Propane in Castro Valley is 2.3%.
What is the Percentage of Households Heated by Bottled Gas / Liquid Propane in California?
Percentage of Households Heated by Bottled Gas / Liquid Propane in California is 3.5%.
What is the Percentage of Households Heated by Bottled Gas / Liquid Propane in the United States?
Percentage of Households Heated by Bottled Gas / Liquid Propane in the United States is 4.9%.