Despard, WV Map & Demographics
Despard Map
Despard Overview
$18,092
PER CAPITA INCOME
$65,023
AVG FAMILY INCOME
$27,614
AVG HOUSEHOLD INCOME
0.37
INEQUALITY / GINI INDEX
983
TOTAL POPULATION
525
MALE POPULATION
458
FEMALE POPULATION
114.63
MALES / 100 FEMALES
87.24
FEMALES / 100 MALES
33.9
MEDIAN AGE
2.9
AVG FAMILY SIZE
2.1
AVG HOUSEHOLD SIZE
420
LABOR FORCE [ PEOPLE ]
51.9%
PERCENT IN LABOR FORCE
26.4%
UNEMPLOYMENT RATE
Income in Despard
Income Overview in Despard
Per Capita Income in Despard is $18,092, while median incomes of families and households are $65,023 and $27,614 respectively.
| Characteristic | Number | Measure |
| Per Capita Income | 983 | $18,092 |
| Median Family Income | 221 | $65,023 |
| Mean Family Income | 221 | $55,016 |
| Median Household Income | 465 | $27,614 |
| Mean Household Income | 465 | $39,483 |
| Income Deficit | 221 | $0 |
| Wage / Income Gap (%) | 983 | 0.00% |
| Wage / Income Gap ($) | 983 | 100.00¢ per $1 |
| Gini / Inequality Index | 983 | 0.37 |
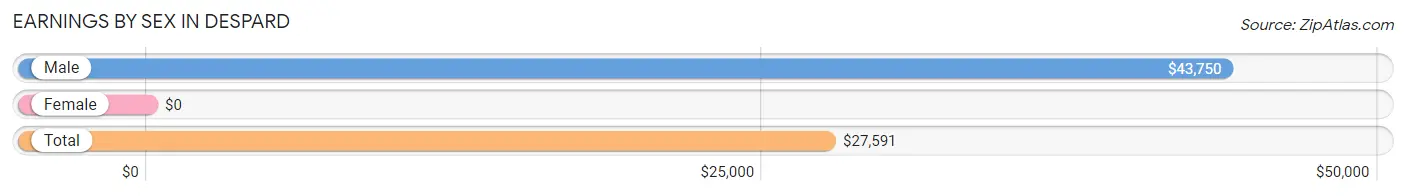
Earnings by Sex in Despard
| Sex | Number | Average Earnings |
| Male | 159 (50.8%) | $43,750 |
| Female | 154 (49.2%) | $0 |
| Total | 313 (100.0%) | $27,591 |
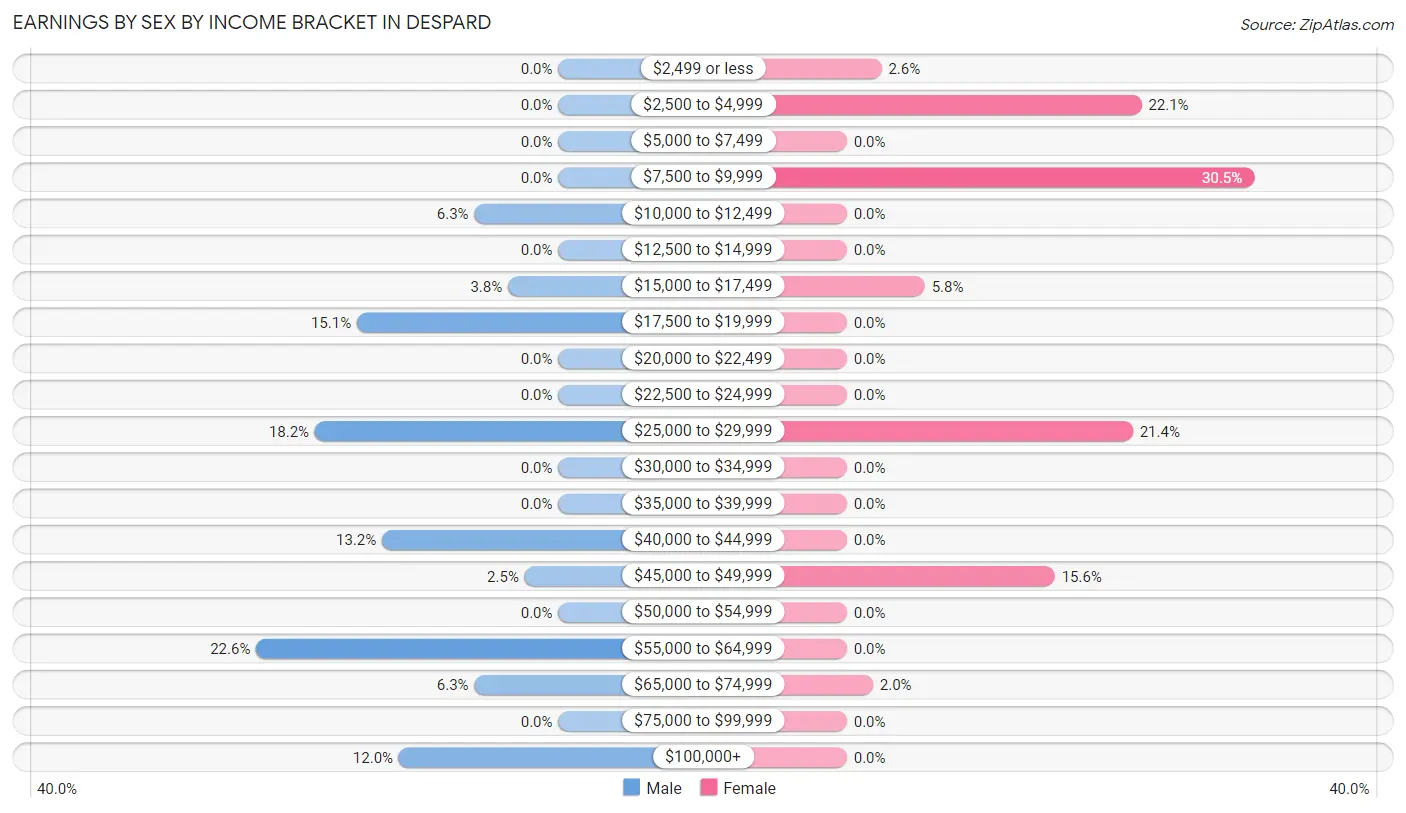
Earnings by Sex by Income Bracket in Despard
The most common earnings brackets in Despard are $55,000 to $64,999 for men (36 | 22.6%) and $7,500 to $9,999 for women (47 | 30.5%).
| Income | Male | Female |
| $2,499 or less | 0 (0.0%) | 4 (2.6%) |
| $2,500 to $4,999 | 0 (0.0%) | 34 (22.1%) |
| $5,000 to $7,499 | 0 (0.0%) | 0 (0.0%) |
| $7,500 to $9,999 | 0 (0.0%) | 47 (30.5%) |
| $10,000 to $12,499 | 10 (6.3%) | 0 (0.0%) |
| $12,500 to $14,999 | 0 (0.0%) | 0 (0.0%) |
| $15,000 to $17,499 | 6 (3.8%) | 9 (5.8%) |
| $17,500 to $19,999 | 24 (15.1%) | 0 (0.0%) |
| $20,000 to $22,499 | 0 (0.0%) | 0 (0.0%) |
| $22,500 to $24,999 | 0 (0.0%) | 0 (0.0%) |
| $25,000 to $29,999 | 29 (18.2%) | 33 (21.4%) |
| $30,000 to $34,999 | 0 (0.0%) | 0 (0.0%) |
| $35,000 to $39,999 | 0 (0.0%) | 0 (0.0%) |
| $40,000 to $44,999 | 21 (13.2%) | 0 (0.0%) |
| $45,000 to $49,999 | 4 (2.5%) | 24 (15.6%) |
| $50,000 to $54,999 | 0 (0.0%) | 0 (0.0%) |
| $55,000 to $64,999 | 36 (22.6%) | 0 (0.0%) |
| $65,000 to $74,999 | 10 (6.3%) | 3 (1.9%) |
| $75,000 to $99,999 | 0 (0.0%) | 0 (0.0%) |
| $100,000+ | 19 (11.9%) | 0 (0.0%) |
| Total | 159 (100.0%) | 154 (100.0%) |
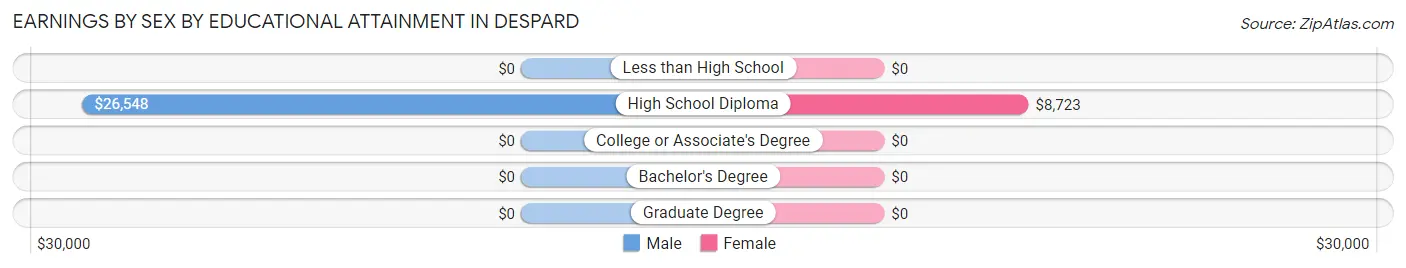
Earnings by Sex by Educational Attainment in Despard
| Educational Attainment | Male Income | Female Income |
| Less than High School | - | - |
| High School Diploma | $26,548 | $8,723 |
| College or Associate's Degree | - | - |
| Bachelor's Degree | - | - |
| Graduate Degree | - | - |
| Total | $44,107 | $0 |
Family Income in Despard
Family Income Brackets in Despard
According to the Despard family income data, there are 117 families falling into the $50,000 to $74,999 income range, which is the most common income bracket and makes up 52.9% of all families.
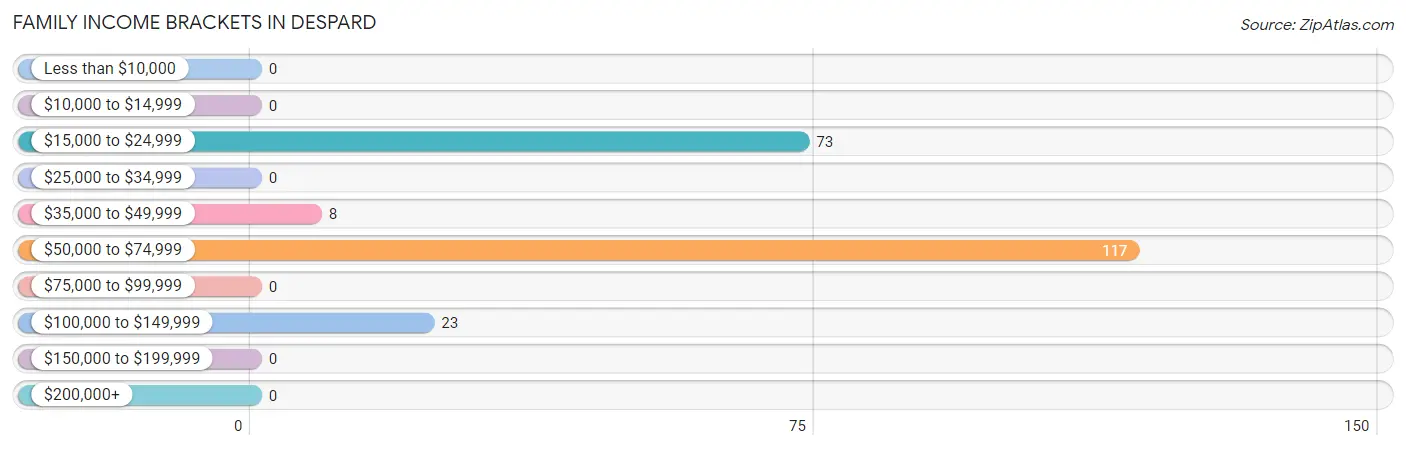
| Income Bracket | # Families | % Families |
| Less than $10,000 | 0 | 0.0% |
| $10,000 to $14,999 | 0 | 0.0% |
| $15,000 to $24,999 | 73 | 33.0% |
| $25,000 to $34,999 | 0 | 0.0% |
| $35,000 to $49,999 | 8 | 3.6% |
| $50,000 to $74,999 | 117 | 52.9% |
| $75,000 to $99,999 | 0 | 0.0% |
| $100,000 to $149,999 | 23 | 10.4% |
| $150,000 to $199,999 | 0 | 0.0% |
| $200,000+ | 0 | 0.0% |
Family Income by Famaliy Size in Despard
3-person families (76 | 34.4%) account for the highest median family income in Despard with $73,603 per family, while 3-person families (76 | 34.4%) have the highest median income of $24,534 per family member.
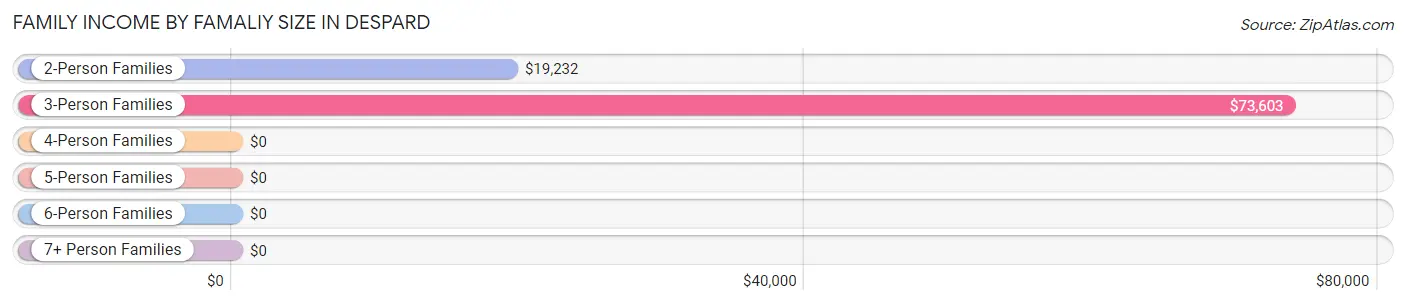
| Income Bracket | # Families | Median Income |
| 2-Person Families | 101 (45.7%) | $19,232 |
| 3-Person Families | 76 (34.4%) | $73,603 |
| 4-Person Families | 36 (16.3%) | $0 |
| 5-Person Families | 8 (3.6%) | $0 |
| 6-Person Families | 0 (0.0%) | $0 |
| 7+ Person Families | 0 (0.0%) | $0 |
| Total | 221 (100.0%) | $65,023 |
Family Income by Number of Earners in Despard
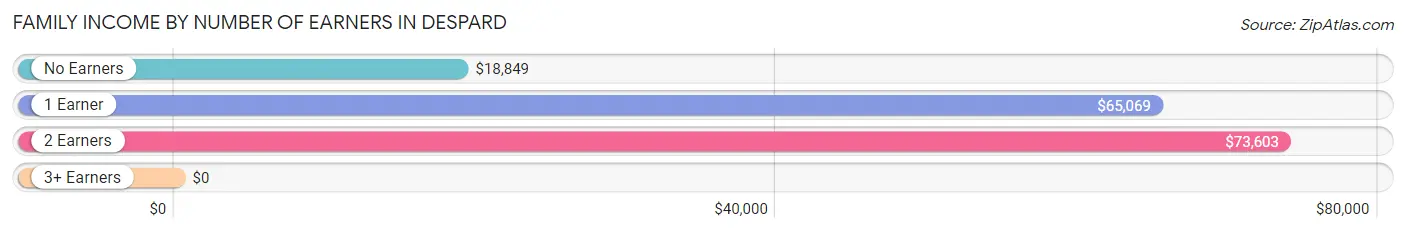
| Number of Earners | # Families | Median Income |
| No Earners | 63 (28.5%) | $18,849 |
| 1 Earner | 108 (48.9%) | $65,069 |
| 2 Earners | 46 (20.8%) | $73,603 |
| 3+ Earners | 4 (1.8%) | $0 |
| Total | 221 (100.0%) | $65,023 |
Household Income in Despard
Household Income Brackets in Despard
With 157 households falling in the category, the $15,000 to $24,999 income range is the most frequent in Despard, accounting for 33.8% of all households.
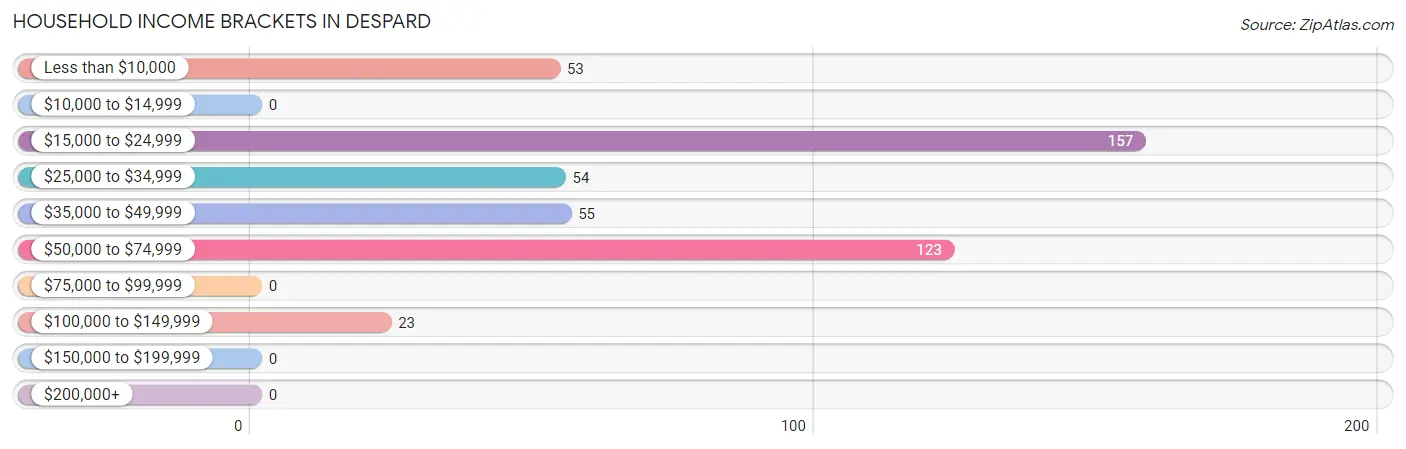
| Income Bracket | # Households | % Households |
| Less than $10,000 | 53 | 11.4% |
| $10,000 to $14,999 | 0 | 0.0% |
| $15,000 to $24,999 | 157 | 33.8% |
| $25,000 to $34,999 | 54 | 11.6% |
| $35,000 to $49,999 | 55 | 11.8% |
| $50,000 to $74,999 | 123 | 26.5% |
| $75,000 to $99,999 | 0 | 0.0% |
| $100,000 to $149,999 | 23 | 4.9% |
| $150,000 to $199,999 | 0 | 0.0% |
| $200,000+ | 0 | 0.0% |
Household Income by Householder Age in Despard
The median household income in Despard is $27,614, with the highest median household income of $45,547 found in the 65+ years age bracket for the primary householder. A total of 136 households (29.2%) fall into this category. Meanwhile, the 15 to 24 years age bracket for the primary householder has the lowest median household income of $0, with 96 households (20.6%) in this group.
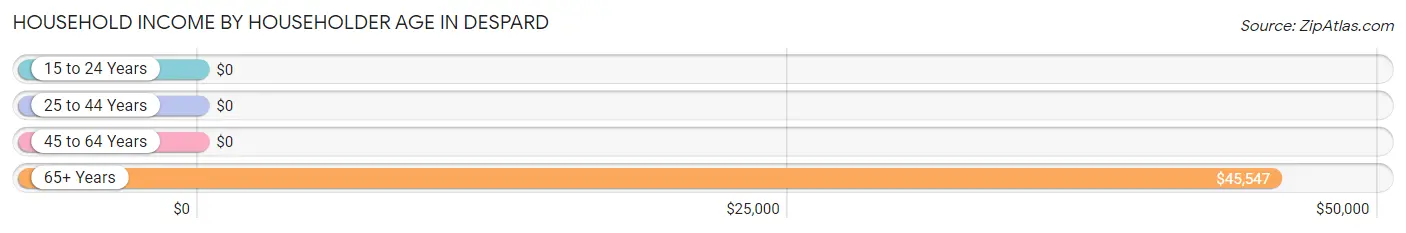
| Income Bracket | # Households | Median Income |
| 15 to 24 Years | 96 (20.6%) | $0 |
| 25 to 44 Years | 117 (25.2%) | $0 |
| 45 to 64 Years | 116 (24.9%) | $0 |
| 65+ Years | 136 (29.2%) | $45,547 |
| Total | 465 (100.0%) | $27,614 |
Poverty in Despard
Income Below Poverty by Sex and Age in Despard
With 21.7% poverty level for males and 34.9% for females among the residents of Despard, 5 year old males and 35 to 44 year old females are the most vulnerable to poverty, with 22 males (100.0%) and 25 females (100.0%) in their respective age groups living below the poverty level.
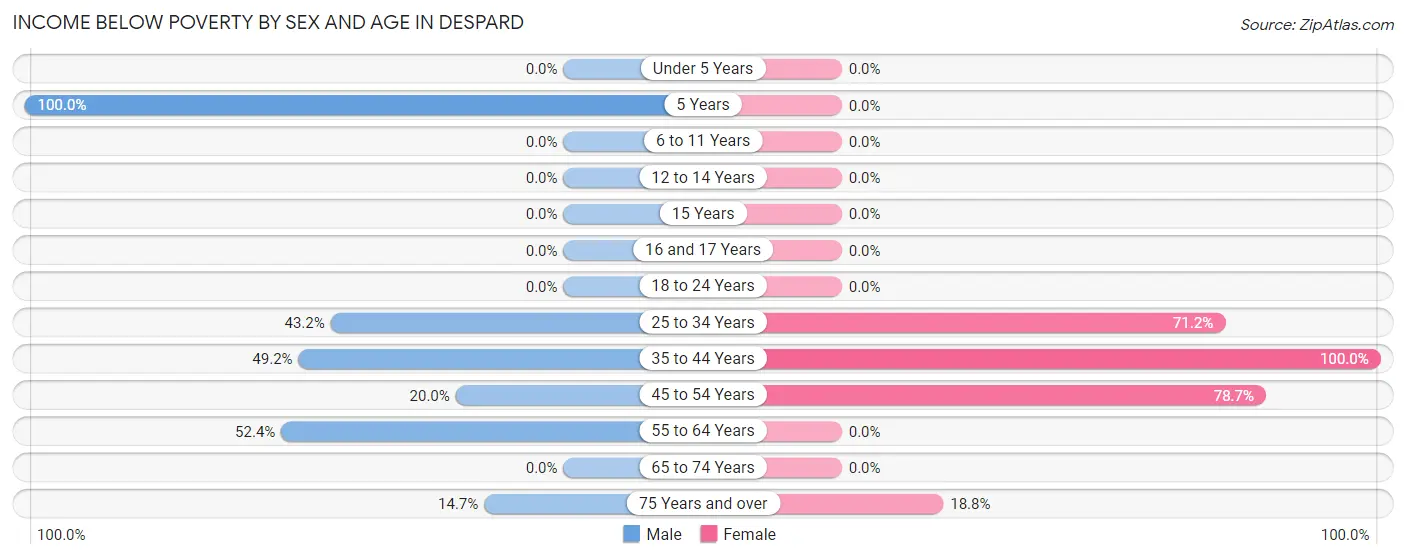
| Age Bracket | Male | Female |
| Under 5 Years | 0 (0.0%) | 0 (0.0%) |
| 5 Years | 22 (100.0%) | 0 (0.0%) |
| 6 to 11 Years | 0 (0.0%) | 0 (0.0%) |
| 12 to 14 Years | 0 (0.0%) | 0 (0.0%) |
| 15 Years | 0 (0.0%) | 0 (0.0%) |
| 16 and 17 Years | 0 (0.0%) | 0 (0.0%) |
| 18 to 24 Years | 0 (0.0%) | 0 (0.0%) |
| 25 to 34 Years | 35 (43.2%) | 74 (71.2%) |
| 35 to 44 Years | 30 (49.2%) | 25 (100.0%) |
| 45 to 54 Years | 11 (20.0%) | 48 (78.7%) |
| 55 to 64 Years | 11 (52.4%) | 0 (0.0%) |
| 65 to 74 Years | 0 (0.0%) | 0 (0.0%) |
| 75 Years and over | 5 (14.7%) | 13 (18.8%) |
| Total | 114 (21.7%) | 160 (34.9%) |
Income Above Poverty by Sex and Age in Despard
According to the poverty statistics in Despard, males aged under 5 years and females aged under 5 years are the age groups that are most secure financially, with 100.0% of males and 100.0% of females in these age groups living above the poverty line.
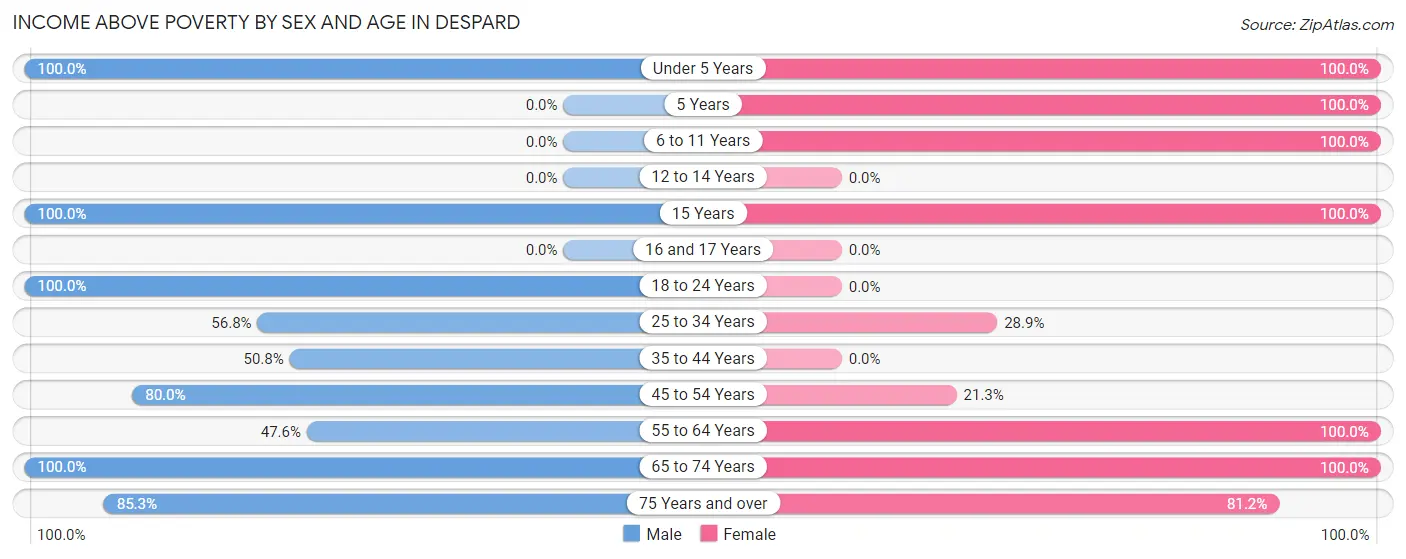
| Age Bracket | Male | Female |
| Under 5 Years | 36 (100.0%) | 58 (100.0%) |
| 5 Years | 0 (0.0%) | 10 (100.0%) |
| 6 to 11 Years | 0 (0.0%) | 10 (100.0%) |
| 12 to 14 Years | 0 (0.0%) | 0 (0.0%) |
| 15 Years | 35 (100.0%) | 3 (100.0%) |
| 16 and 17 Years | 0 (0.0%) | 0 (0.0%) |
| 18 to 24 Years | 139 (100.0%) | 0 (0.0%) |
| 25 to 34 Years | 46 (56.8%) | 30 (28.8%) |
| 35 to 44 Years | 31 (50.8%) | 0 (0.0%) |
| 45 to 54 Years | 44 (80.0%) | 13 (21.3%) |
| 55 to 64 Years | 10 (47.6%) | 47 (100.0%) |
| 65 to 74 Years | 41 (100.0%) | 71 (100.0%) |
| 75 Years and over | 29 (85.3%) | 56 (81.2%) |
| Total | 411 (78.3%) | 298 (65.1%) |
Income Below Poverty Among Married-Couple Families in Despard
The poverty statistics for married-couple families in Despard show that 6.9% or 11 of the total 159 families live below the poverty line. Families with no children have the highest poverty rate of 17.7%, comprising of 11 families. On the other hand, families with 1 or 2 children have the lowest poverty rate of 0.0%, which includes 0 families.
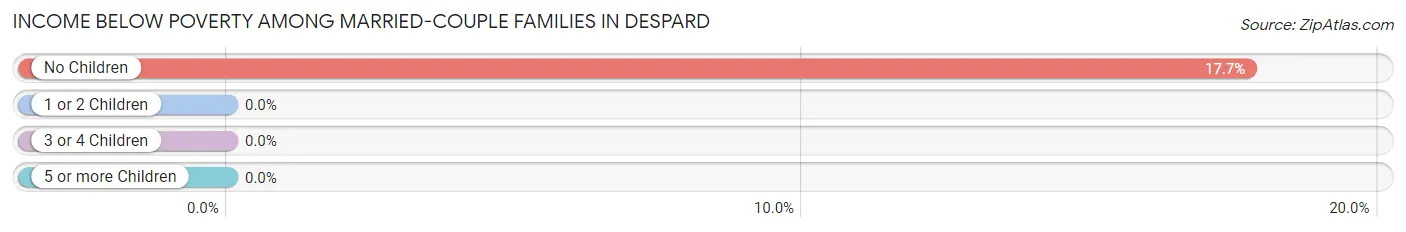
| Children | Above Poverty | Below Poverty |
| No Children | 51 (82.3%) | 11 (17.7%) |
| 1 or 2 Children | 89 (100.0%) | 0 (0.0%) |
| 3 or 4 Children | 8 (100.0%) | 0 (0.0%) |
| 5 or more Children | 0 (0.0%) | 0 (0.0%) |
| Total | 148 (93.1%) | 11 (6.9%) |
Income Below Poverty Among Single-Parent Households in Despard
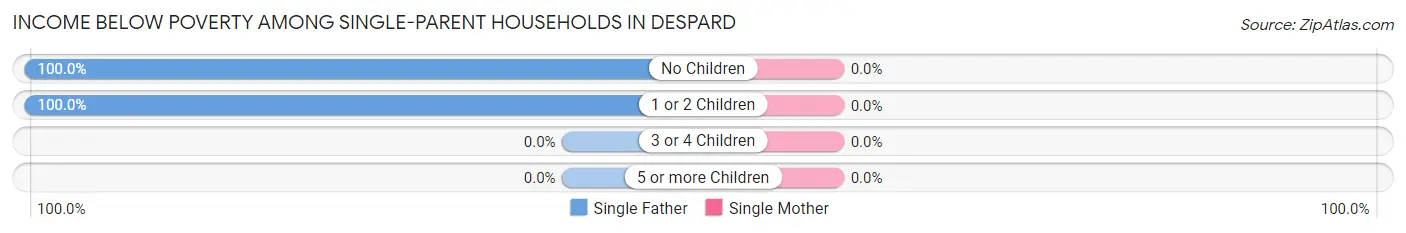
| Children | Single Father | Single Mother |
| No Children | 16 (100.0%) | 0 (0.0%) |
| 1 or 2 Children | 24 (100.0%) | 0 (0.0%) |
| 3 or 4 Children | 0 (0.0%) | 0 (0.0%) |
| 5 or more Children | 0 (0.0%) | 0 (0.0%) |
| Total | 40 (100.0%) | 0 (0.0%) |
Income Below Poverty Among Married-Couple vs Single-Parent Households in Despard
The poverty data for Despard shows that 11 of the married-couple family households (6.9%) and 40 of the single-parent households (64.5%) are living below the poverty level. Within the married-couple family households, those with no children have the highest poverty rate, with 11 households (17.7%) falling below the poverty line. Among the single-parent households, those with 1 or 2 children have the highest poverty rate, with 24 household (100.0%) living below poverty.
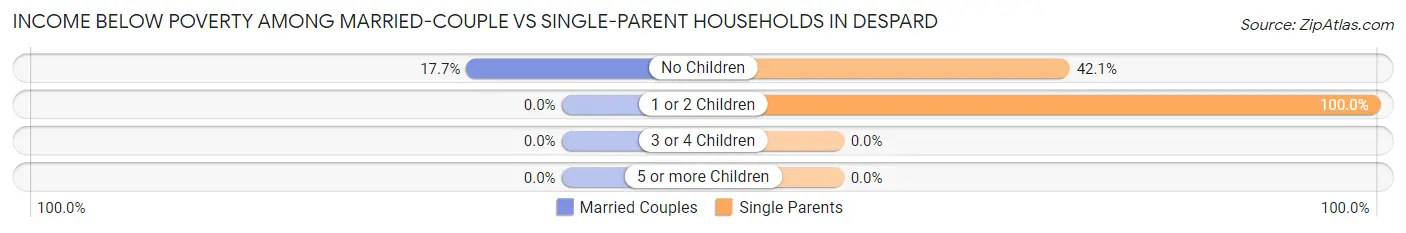
| Children | Married-Couple Families | Single-Parent Households |
| No Children | 11 (17.7%) | 16 (42.1%) |
| 1 or 2 Children | 0 (0.0%) | 24 (100.0%) |
| 3 or 4 Children | 0 (0.0%) | 0 (0.0%) |
| 5 or more Children | 0 (0.0%) | 0 (0.0%) |
| Total | 11 (6.9%) | 40 (64.5%) |
Race in Despard
The most populous races in Despard are White / Caucasian (949 | 96.5%), and Two or more Races (34 | 3.5%).
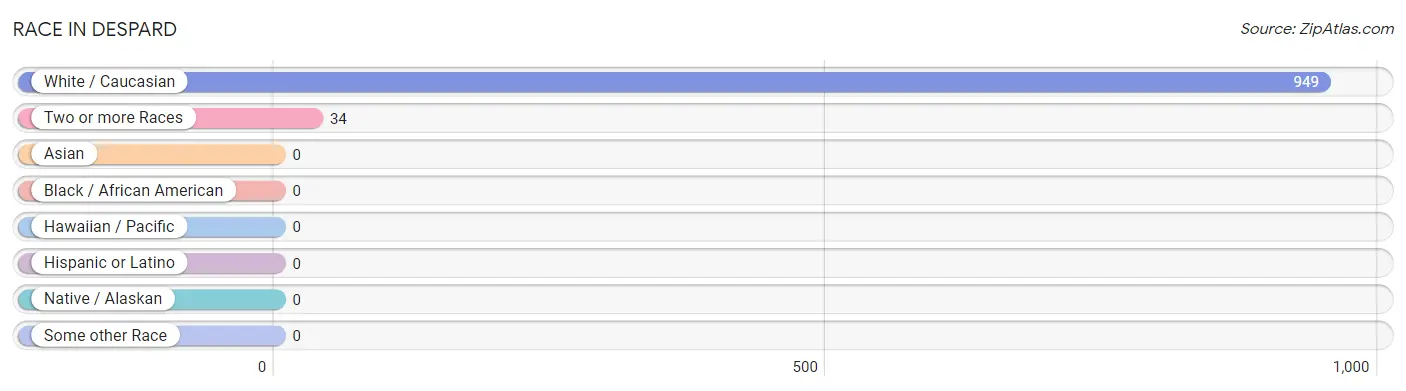
| Race | # Population | % Population |
| Asian | 0 | 0.0% |
| Black / African American | 0 | 0.0% |
| Hawaiian / Pacific | 0 | 0.0% |
| Hispanic or Latino | 0 | 0.0% |
| Native / Alaskan | 0 | 0.0% |
| White / Caucasian | 949 | 96.5% |
| Two or more Races | 34 | 3.5% |
| Some other Race | 0 | 0.0% |
| Total | 983 | 100.0% |
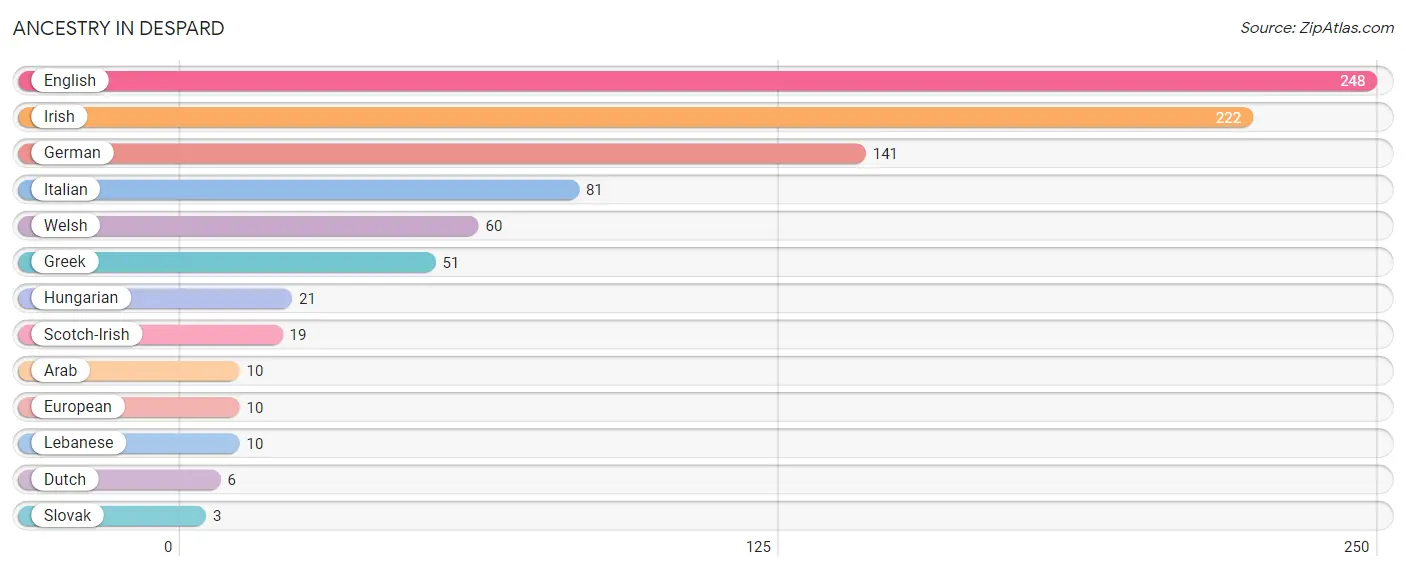
Ancestry in Despard
The most populous ancestries reported in Despard are English (248 | 25.2%), Irish (222 | 22.6%), German (141 | 14.3%), Italian (81 | 8.2%), and Welsh (60 | 6.1%), together accounting for 76.5% of all Despard residents.
| Ancestry | # Population | % Population |
| Arab | 10 | 1.0% |
| Dutch | 6 | 0.6% |
| English | 248 | 25.2% |
| European | 10 | 1.0% |
| German | 141 | 14.3% |
| Greek | 51 | 5.2% |
| Hungarian | 21 | 2.1% |
| Irish | 222 | 22.6% |
| Italian | 81 | 8.2% |
| Lebanese | 10 | 1.0% |
| Scotch-Irish | 19 | 1.9% |
| Slovak | 3 | 0.3% |
| Welsh | 60 | 6.1% | View All 13 Rows |
Immigrants in Despard

| Immigration Origin | # Population | % Population | View All 0 Rows |
Sex and Age in Despard
Sex and Age in Despard
The most populous age groups in Despard are 20 to 24 Years (139 | 26.5%) for men and Under 5 Years (58 | 12.7%) for women.
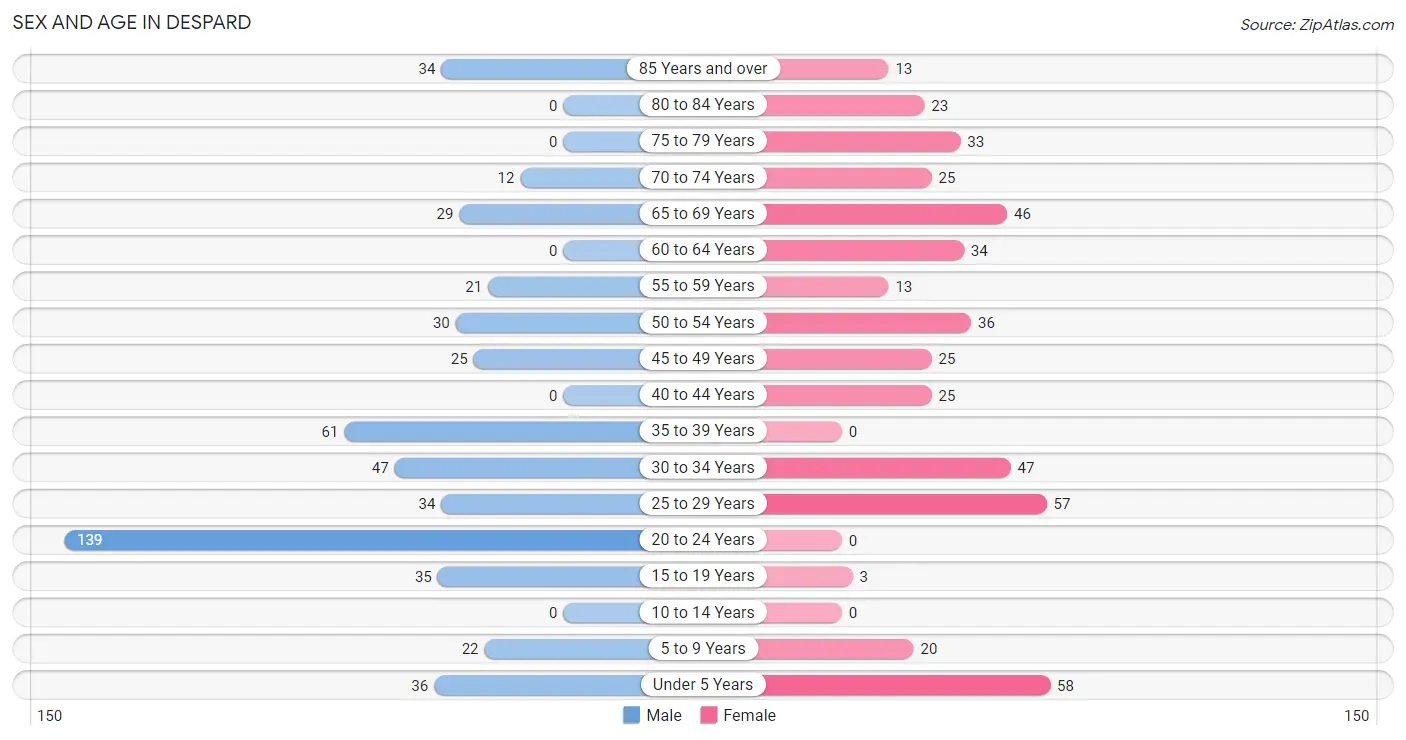
| Age Bracket | Male | Female |
| Under 5 Years | 36 (6.9%) | 58 (12.7%) |
| 5 to 9 Years | 22 (4.2%) | 20 (4.4%) |
| 10 to 14 Years | 0 (0.0%) | 0 (0.0%) |
| 15 to 19 Years | 35 (6.7%) | 3 (0.7%) |
| 20 to 24 Years | 139 (26.5%) | 0 (0.0%) |
| 25 to 29 Years | 34 (6.5%) | 57 (12.4%) |
| 30 to 34 Years | 47 (8.9%) | 47 (10.3%) |
| 35 to 39 Years | 61 (11.6%) | 0 (0.0%) |
| 40 to 44 Years | 0 (0.0%) | 25 (5.5%) |
| 45 to 49 Years | 25 (4.8%) | 25 (5.5%) |
| 50 to 54 Years | 30 (5.7%) | 36 (7.9%) |
| 55 to 59 Years | 21 (4.0%) | 13 (2.8%) |
| 60 to 64 Years | 0 (0.0%) | 34 (7.4%) |
| 65 to 69 Years | 29 (5.5%) | 46 (10.0%) |
| 70 to 74 Years | 12 (2.3%) | 25 (5.5%) |
| 75 to 79 Years | 0 (0.0%) | 33 (7.2%) |
| 80 to 84 Years | 0 (0.0%) | 23 (5.0%) |
| 85 Years and over | 34 (6.5%) | 13 (2.8%) |
| Total | 525 (100.0%) | 458 (100.0%) |
Families and Households in Despard
Median Family Size in Despard
The median family size in Despard is 2.88 persons per family, with married-couple families (159 | 72.0%) accounting for the largest median family size of 3.03 persons per family. On the other hand, single male/father families (40 | 18.1%) represent the smallest median family size with 2.40 persons per family.
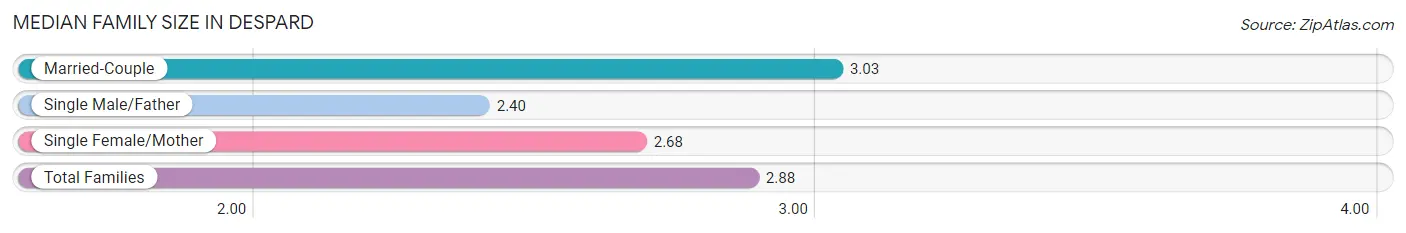
| Family Type | # Families | Family Size |
| Married-Couple | 159 (72.0%) | 3.03 |
| Single Male/Father | 40 (18.1%) | 2.40 |
| Single Female/Mother | 22 (10.0%) | 2.68 |
| Total Families | 221 (100.0%) | 2.88 |
Median Household Size in Despard
The median household size in Despard is 2.11 persons per household, with single female/mother households (22 | 4.7%) accounting for the largest median household size of 4.05 persons per household. non-family households (244 | 52.5%) represent the smallest median household size with 1.19 persons per household.
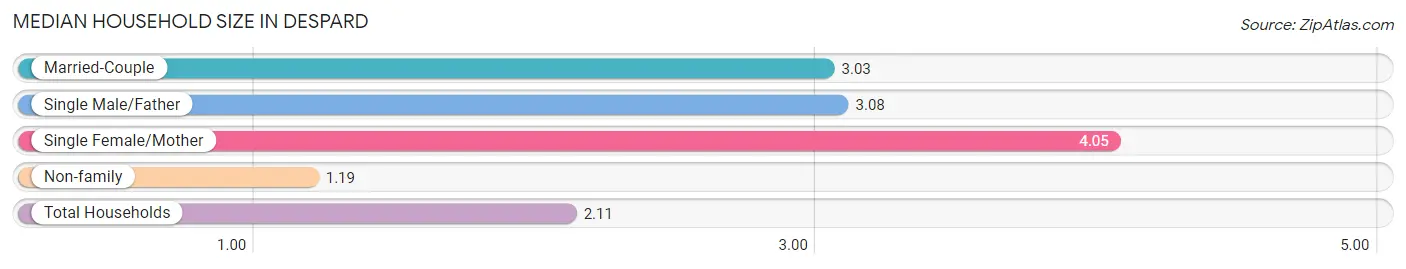
| Household Type | # Households | Household Size |
| Married-Couple | 159 (34.2%) | 3.03 |
| Single Male/Father | 40 (8.6%) | 3.08 |
| Single Female/Mother | 22 (4.7%) | 4.05 |
| Non-family | 244 (52.5%) | 1.19 |
| Total Households | 465 (100.0%) | 2.11 |
Household Size by Marriage Status in Despard
Out of a total of 465 households in Despard, 221 (47.5%) are family households, while 244 (52.5%) are nonfamily households. The most numerous type of family households are 3-person households, comprising 122, and the most common type of nonfamily households are 1-person households, comprising 199.
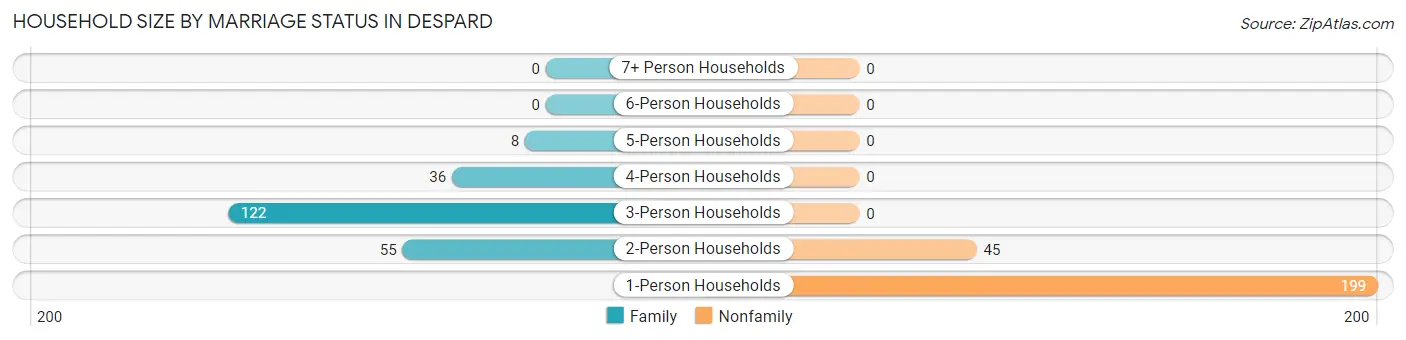
| Household Size | Family Households | Nonfamily Households |
| 1-Person Households | - | 199 (42.8%) |
| 2-Person Households | 55 (11.8%) | 45 (9.7%) |
| 3-Person Households | 122 (26.2%) | 0 (0.0%) |
| 4-Person Households | 36 (7.7%) | 0 (0.0%) |
| 5-Person Households | 8 (1.7%) | 0 (0.0%) |
| 6-Person Households | 0 (0.0%) | 0 (0.0%) |
| 7+ Person Households | 0 (0.0%) | 0 (0.0%) |
| Total | 221 (47.5%) | 244 (52.5%) |
Female Fertility in Despard
Fertility by Age in Despard
Average fertility rate in Despard is 196.0 births per 1,000 women. Women in the age bracket of 15 to 19 years have the highest fertility rate with 1,000.0 births per 1,000 women. Women in the age bracket of 20 to 34 years acount for 90.9% of all women with births.
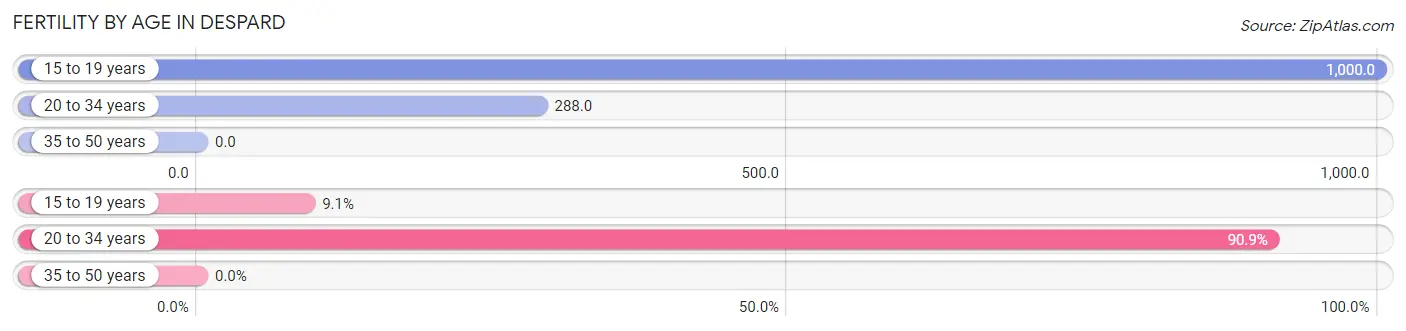
| Age Bracket | Women with Births | Births / 1,000 Women |
| 15 to 19 years | 3 (9.1%) | 1,000.0 |
| 20 to 34 years | 30 (90.9%) | 288.0 |
| 35 to 50 years | 0 (0.0%) | 0.0 |
| Total | 33 (100.0%) | 196.0 |
Fertility by Age by Marriage Status in Despard
90.9% of women with births (33) in Despard are married. The highest percentage of unmarried women with births falls into 15 to 19 years age bracket with 100.0% of them unmarried at the time of birth, while the lowest percentage of unmarried women with births belong to 20 to 34 years age bracket with 0.0% of them unmarried.
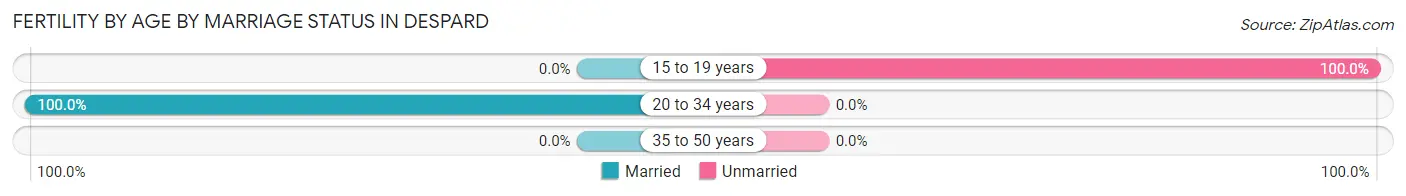
| Age Bracket | Married | Unmarried |
| 15 to 19 years | 0 (0.0%) | 3 (100.0%) |
| 20 to 34 years | 30 (100.0%) | 0 (0.0%) |
| 35 to 50 years | 0 (0.0%) | 0 (0.0%) |
| Total | 30 (90.9%) | 3 (9.1%) |
Fertility by Education in Despard
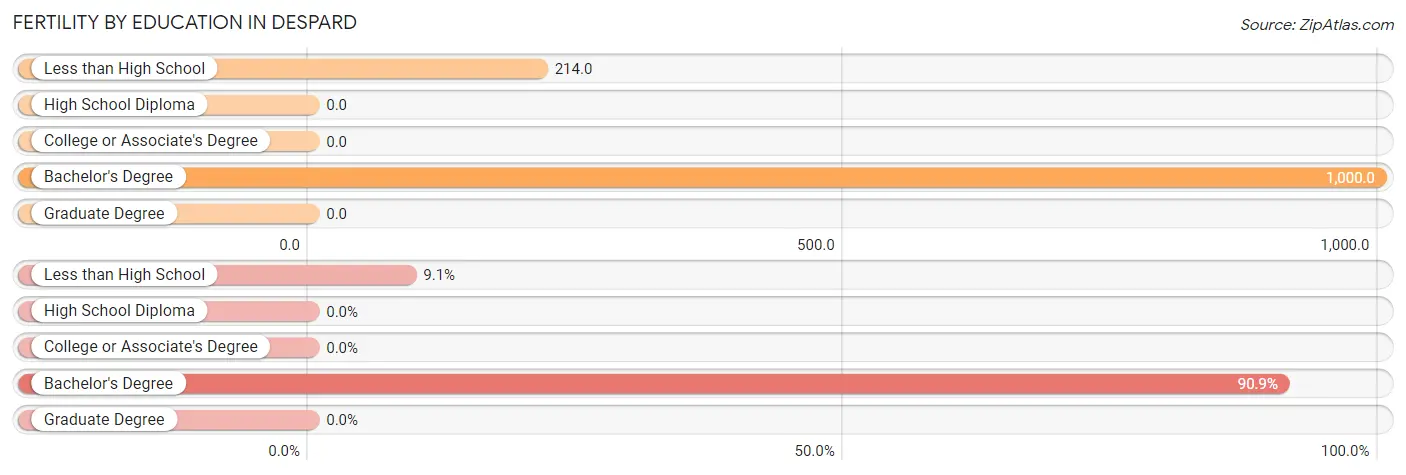
| Educational Attainment | Women with Births | Births / 1,000 Women |
| Less than High School | 3 (9.1%) | 214.0 |
| High School Diploma | 0 (0.0%) | 0.0 |
| College or Associate's Degree | 0 (0.0%) | 0.0 |
| Bachelor's Degree | 30 (90.9%) | 1,000.0 |
| Graduate Degree | 0 (0.0%) | 0.0 |
| Total | 33 (100.0%) | 196.0 |
Fertility by Education by Marriage Status in Despard
9.1% of women with births in Despard are unmarried. Women with the educational attainment of bachelor's degree are most likely to be married with 100.0% of them married at childbirth, while women with the educational attainment of less than high school are least likely to be married with 100.0% of them unmarried at childbirth.
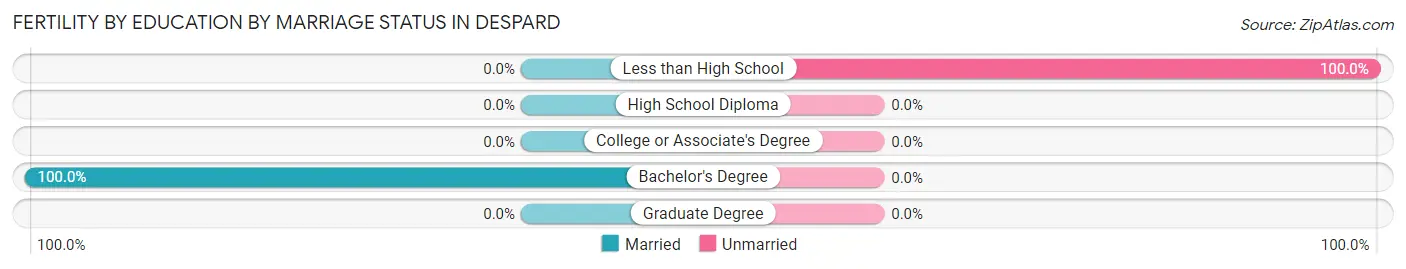
| Educational Attainment | Married | Unmarried |
| Less than High School | 0 (0.0%) | 3 (100.0%) |
| High School Diploma | 0 (0.0%) | 0 (0.0%) |
| College or Associate's Degree | 0 (0.0%) | 0 (0.0%) |
| Bachelor's Degree | 30 (100.0%) | 0 (0.0%) |
| Graduate Degree | 0 (0.0%) | 0 (0.0%) |
| Total | 30 (90.9%) | 3 (9.1%) |
Employment Characteristics in Despard
Employment by Class of Employer in Despard
Among the 309 employed individuals in Despard, private company employees (290 | 93.9%), unpaid family workers (10 | 3.2%), and not-for-profit organizations (9 | 2.9%) make up the most common classes of employment.
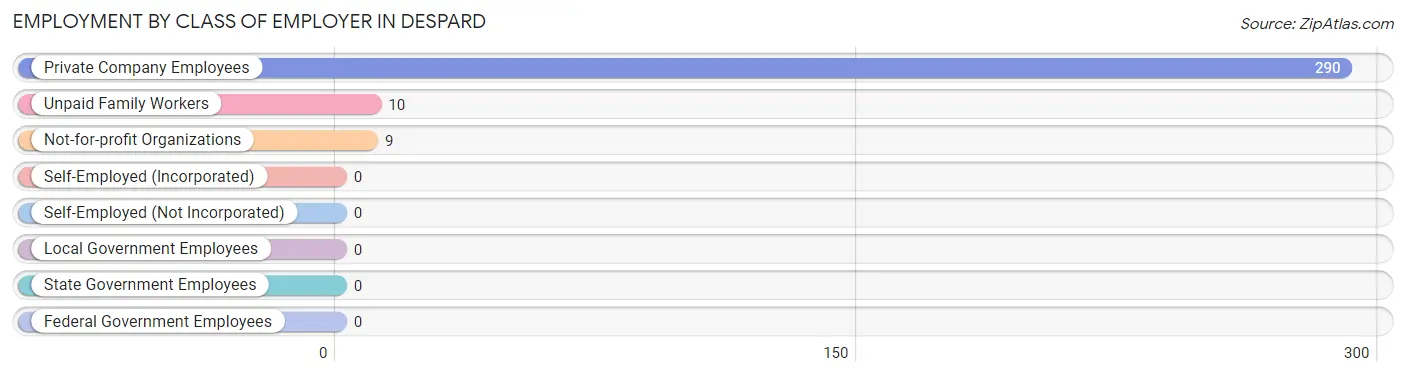
| Employer Class | # Employees | % Employees |
| Private Company Employees | 290 | 93.9% |
| Self-Employed (Incorporated) | 0 | 0.0% |
| Self-Employed (Not Incorporated) | 0 | 0.0% |
| Not-for-profit Organizations | 9 | 2.9% |
| Local Government Employees | 0 | 0.0% |
| State Government Employees | 0 | 0.0% |
| Federal Government Employees | 0 | 0.0% |
| Unpaid Family Workers | 10 | 3.2% |
| Total | 309 | 100.0% |
Employment Status by Age in Despard
According to the labor force statistics for Despard, out of the total population over 16 years of age (809), 51.9% or 420 individuals are in the labor force, with 26.4% or 111 of them unemployed. The age group with the highest labor force participation rate is 30 to 34 years, with 100.0% or 94 individuals in the labor force. Within the labor force, the 20 to 24 years age range has the highest percentage of unemployed individuals, with 94.1% or 96 of them being unemployed.
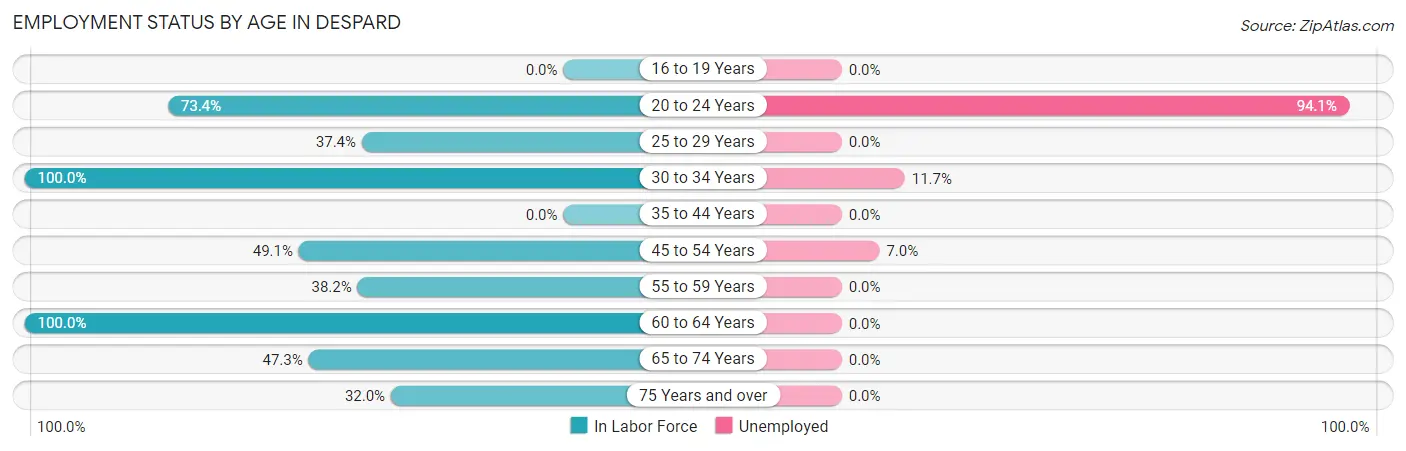
| Age Bracket | In Labor Force | Unemployed |
| 16 to 19 Years | 0 (0.0%) | 0 (0.0%) |
| 20 to 24 Years | 102 (73.4%) | 96 (94.1%) |
| 25 to 29 Years | 34 (37.4%) | 0 (0.0%) |
| 30 to 34 Years | 94 (100.0%) | 11 (11.7%) |
| 35 to 44 Years | 0 (0.0%) | 0 (0.0%) |
| 45 to 54 Years | 57 (49.1%) | 4 (7.0%) |
| 55 to 59 Years | 13 (38.2%) | 0 (0.0%) |
| 60 to 64 Years | 34 (100.0%) | 0 (0.0%) |
| 65 to 74 Years | 53 (47.3%) | 0 (0.0%) |
| 75 Years and over | 33 (32.0%) | 0 (0.0%) |
| Total | 420 (51.9%) | 111 (26.4%) |
Employment Status by Educational Attainment in Despard
According to labor force statistics for Despard, 51.0% of individuals (232) out of the total population between 25 and 64 years of age (455) are in the labor force, with 6.5% or 15 of them being unemployed. The group with the highest labor force participation rate are those with the educational attainment of high school diploma, with 60.1% or 155 individuals in the labor force. Within the labor force, individuals with college / associate degree education have the highest percentage of unemployment, with 68.2% or 15 of them being unemployed.
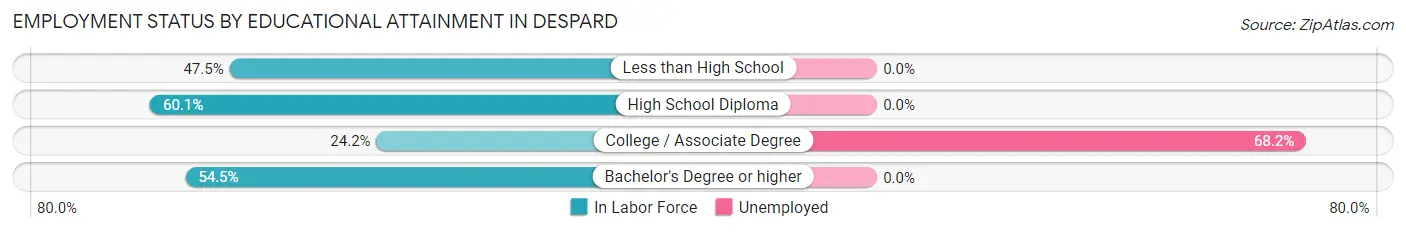
| Educational Attainment | In Labor Force | Unemployed |
| Less than High School | 19 (47.5%) | 0 (0.0%) |
| High School Diploma | 155 (60.1%) | 0 (0.0%) |
| College / Associate Degree | 22 (24.2%) | 62 (68.2%) |
| Bachelor's Degree or higher | 36 (54.5%) | 0 (0.0%) |
| Total | 232 (51.0%) | 30 (6.5%) |
Employment Occupations by Sex in Despard
Management, Business, Science and Arts Occupations
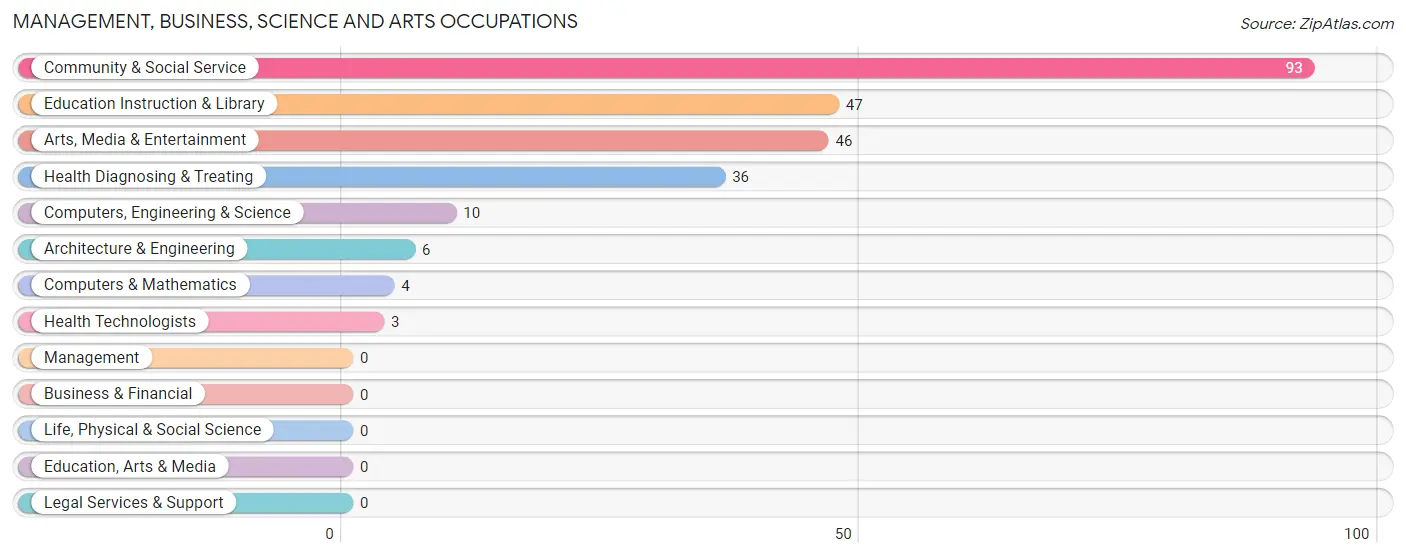
The most common Management, Business, Science and Arts occupations in Despard are Community & Social Service (93 | 30.1%), Education Instruction & Library (47 | 15.2%), Arts, Media & Entertainment (46 | 14.9%), Health Diagnosing & Treating (36 | 11.7%), and Computers, Engineering & Science (10 | 3.2%).
Management, Business, Science and Arts Occupations by Sex
Within the Management, Business, Science and Arts occupations in Despard, the most male-oriented occupations are Computers, Engineering & Science (100.0%), Computers & Mathematics (100.0%), and Architecture & Engineering (100.0%), while the most female-oriented occupations are Education Instruction & Library (100.0%), Health Diagnosing & Treating (100.0%), and Health Technologists (100.0%).
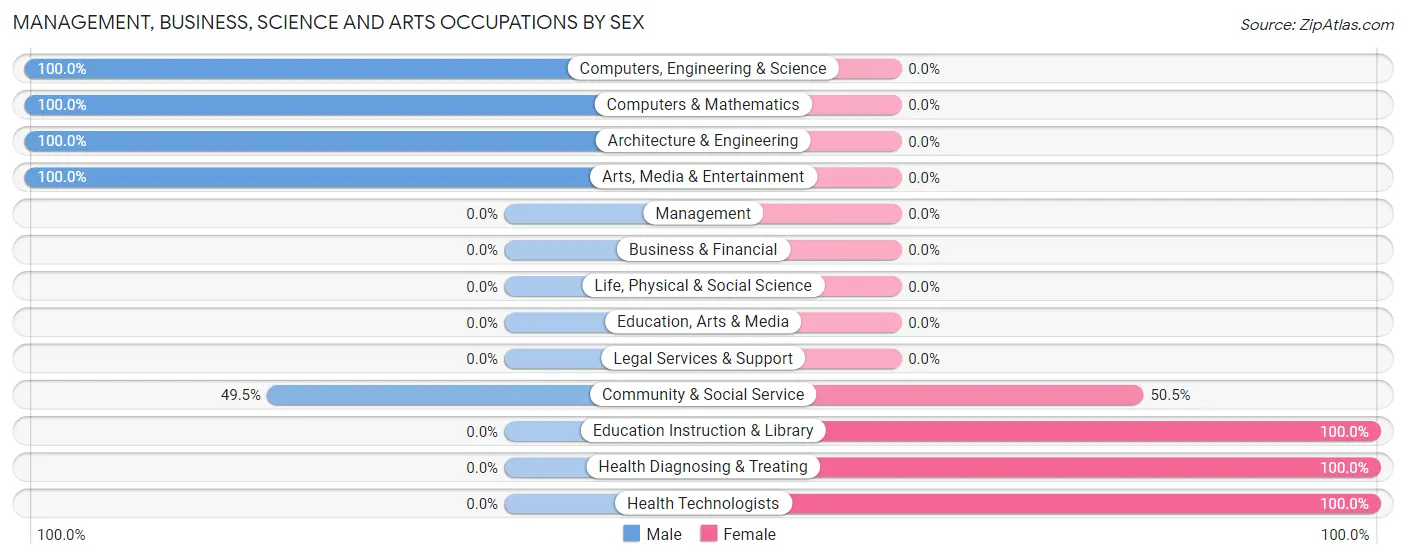
| Occupation | Male | Female |
| Management | 0 (0.0%) | 0 (0.0%) |
| Business & Financial | 0 (0.0%) | 0 (0.0%) |
| Computers, Engineering & Science | 10 (100.0%) | 0 (0.0%) |
| Computers & Mathematics | 4 (100.0%) | 0 (0.0%) |
| Architecture & Engineering | 6 (100.0%) | 0 (0.0%) |
| Life, Physical & Social Science | 0 (0.0%) | 0 (0.0%) |
| Community & Social Service | 46 (49.5%) | 47 (50.5%) |
| Education, Arts & Media | 0 (0.0%) | 0 (0.0%) |
| Legal Services & Support | 0 (0.0%) | 0 (0.0%) |
| Education Instruction & Library | 0 (0.0%) | 47 (100.0%) |
| Arts, Media & Entertainment | 46 (100.0%) | 0 (0.0%) |
| Health Diagnosing & Treating | 0 (0.0%) | 36 (100.0%) |
| Health Technologists | 0 (0.0%) | 3 (100.0%) |
| Total (Category) | 56 (40.3%) | 83 (59.7%) |
| Total (Overall) | 159 (51.5%) | 150 (48.5%) |
Services Occupations
The most common Services occupations in Despard are , and Healthcare Support (43 | 13.9%).
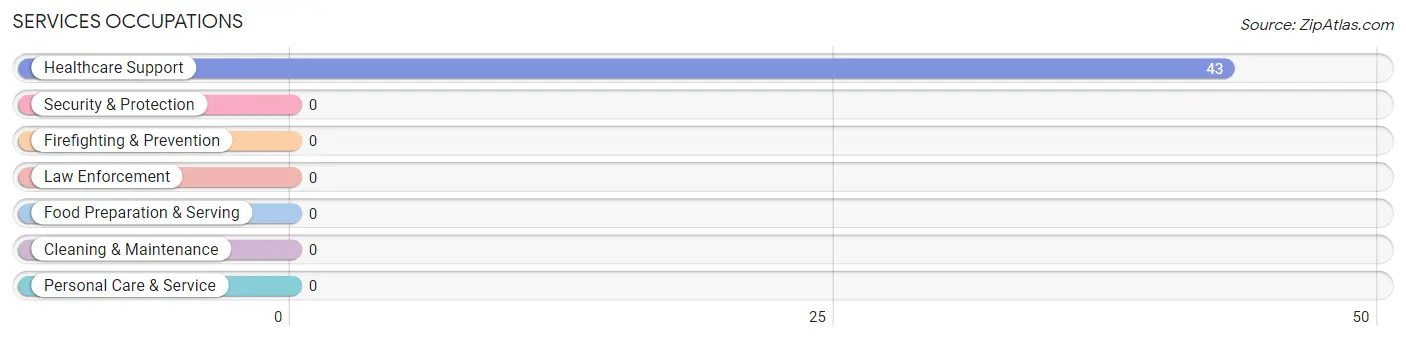
Services Occupations by Sex
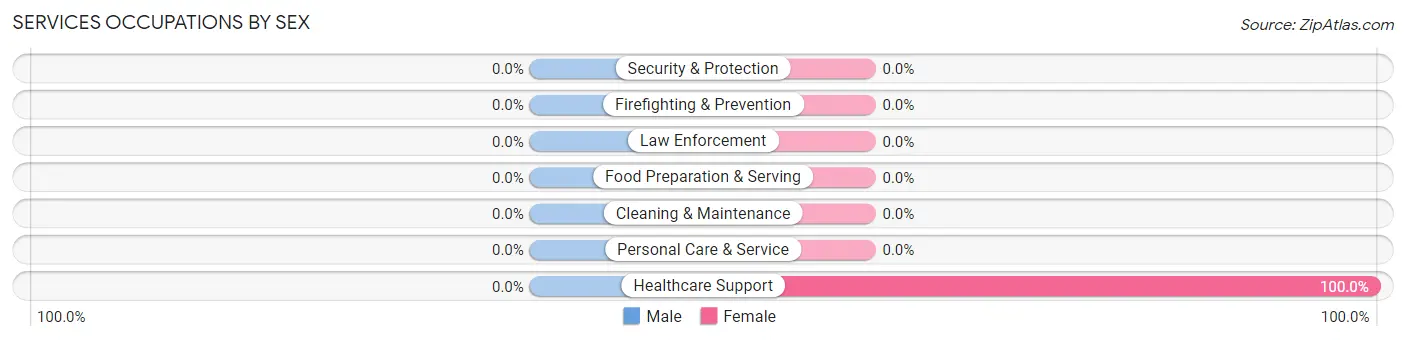
| Occupation | Male | Female |
| Healthcare Support | 0 (0.0%) | 43 (100.0%) |
| Security & Protection | 0 (0.0%) | 0 (0.0%) |
| Firefighting & Prevention | 0 (0.0%) | 0 (0.0%) |
| Law Enforcement | 0 (0.0%) | 0 (0.0%) |
| Food Preparation & Serving | 0 (0.0%) | 0 (0.0%) |
| Cleaning & Maintenance | 0 (0.0%) | 0 (0.0%) |
| Personal Care & Service | 0 (0.0%) | 0 (0.0%) |
| Total (Category) | 0 (0.0%) | 43 (100.0%) |
| Total (Overall) | 159 (51.5%) | 150 (48.5%) |
Sales and Office Occupations
The most common Sales and Office occupations in Despard are , and Sales & Related (32 | 10.4%).
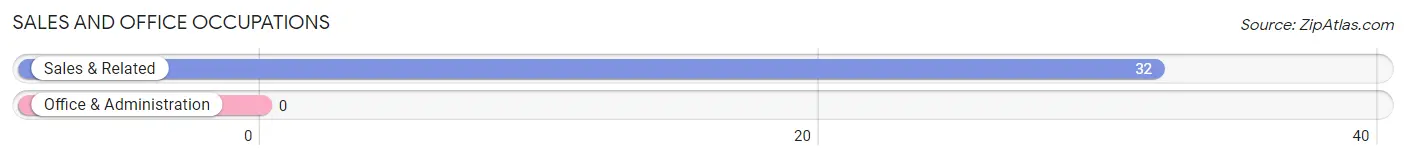
Sales and Office Occupations by Sex
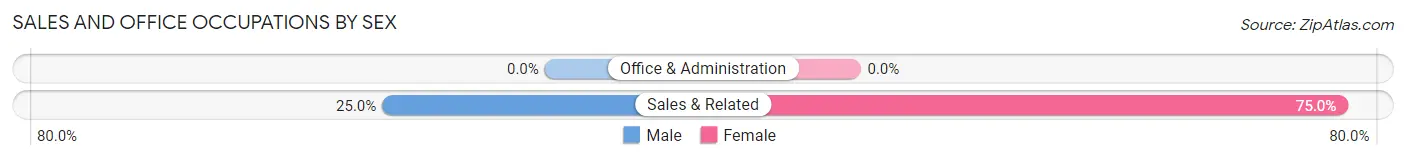
| Occupation | Male | Female |
| Sales & Related | 8 (25.0%) | 24 (75.0%) |
| Office & Administration | 0 (0.0%) | 0 (0.0%) |
| Total (Category) | 8 (25.0%) | 24 (75.0%) |
| Total (Overall) | 159 (51.5%) | 150 (48.5%) |
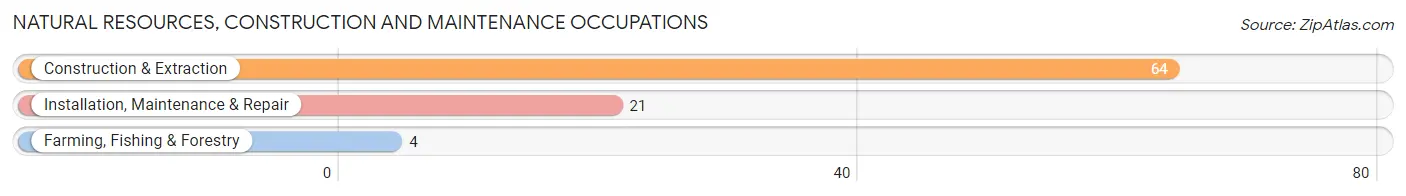
Natural Resources, Construction and Maintenance Occupations
The most common Natural Resources, Construction and Maintenance occupations in Despard are Construction & Extraction (64 | 20.7%), Installation, Maintenance & Repair (21 | 6.8%), and Farming, Fishing & Forestry (4 | 1.3%).
Natural Resources, Construction and Maintenance Occupations by Sex
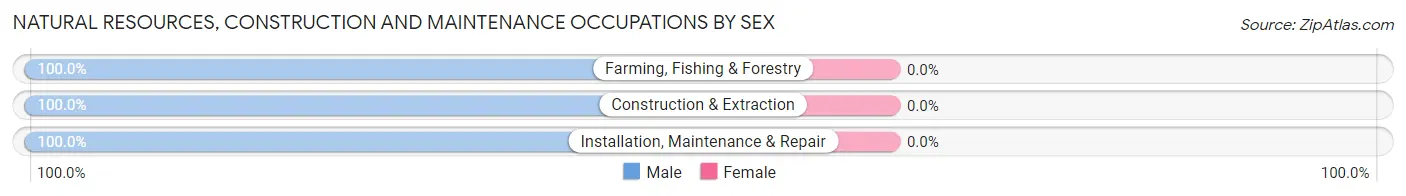
| Occupation | Male | Female |
| Farming, Fishing & Forestry | 4 (100.0%) | 0 (0.0%) |
| Construction & Extraction | 64 (100.0%) | 0 (0.0%) |
| Installation, Maintenance & Repair | 21 (100.0%) | 0 (0.0%) |
| Total (Category) | 89 (100.0%) | 0 (0.0%) |
| Total (Overall) | 159 (51.5%) | 150 (48.5%) |
Production, Transportation and Moving Occupations
The most common Production, Transportation and Moving occupations in Despard are , and Material Moving (6 | 1.9%).
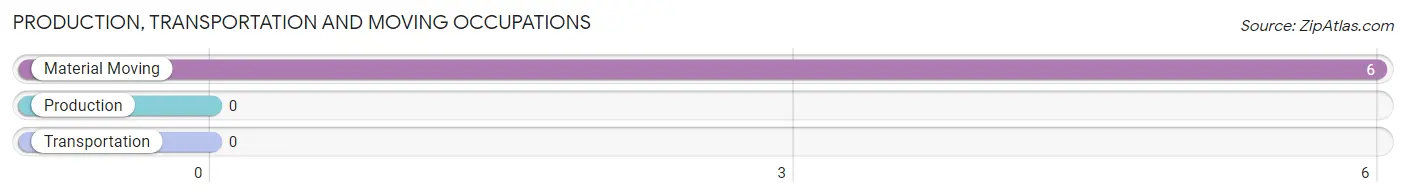
Production, Transportation and Moving Occupations by Sex
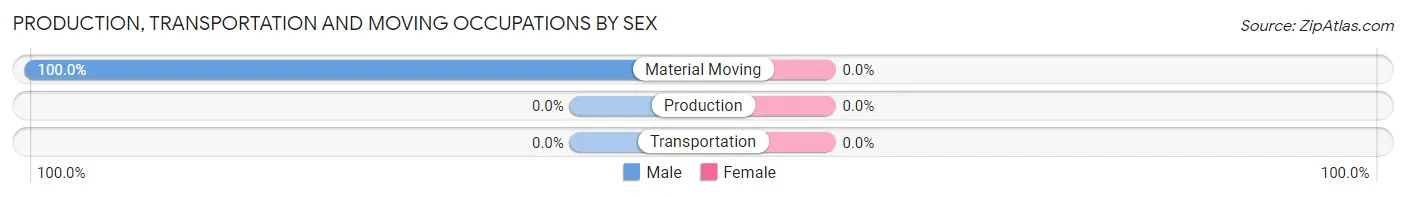
| Occupation | Male | Female |
| Production | 0 (0.0%) | 0 (0.0%) |
| Transportation | 0 (0.0%) | 0 (0.0%) |
| Material Moving | 6 (100.0%) | 0 (0.0%) |
| Total (Category) | 6 (100.0%) | 0 (0.0%) |
| Total (Overall) | 159 (51.5%) | 150 (48.5%) |
Employment Industries by Sex in Despard
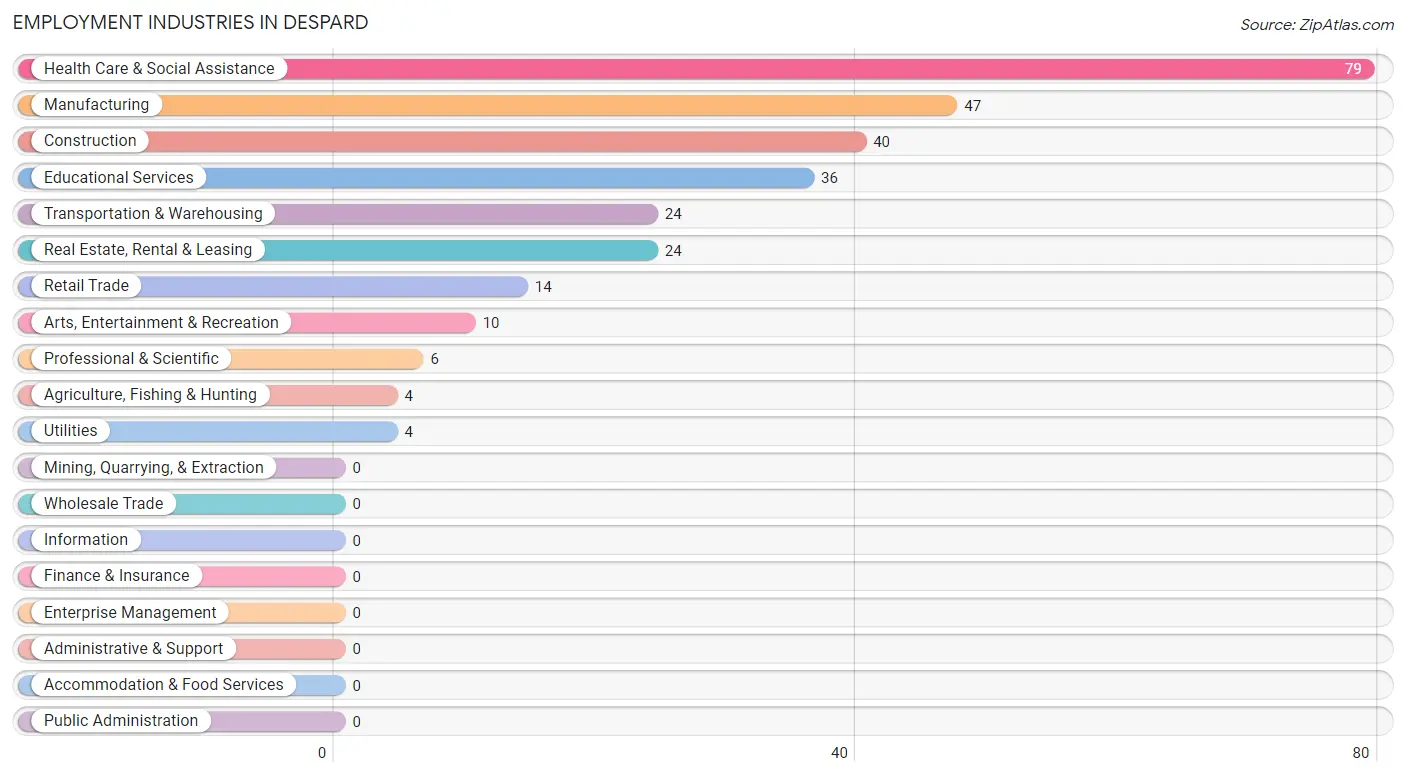
Employment Industries in Despard
The major employment industries in Despard include Health Care & Social Assistance (79 | 25.6%), Manufacturing (47 | 15.2%), Construction (40 | 12.9%), Educational Services (36 | 11.7%), and Transportation & Warehousing (24 | 7.8%).
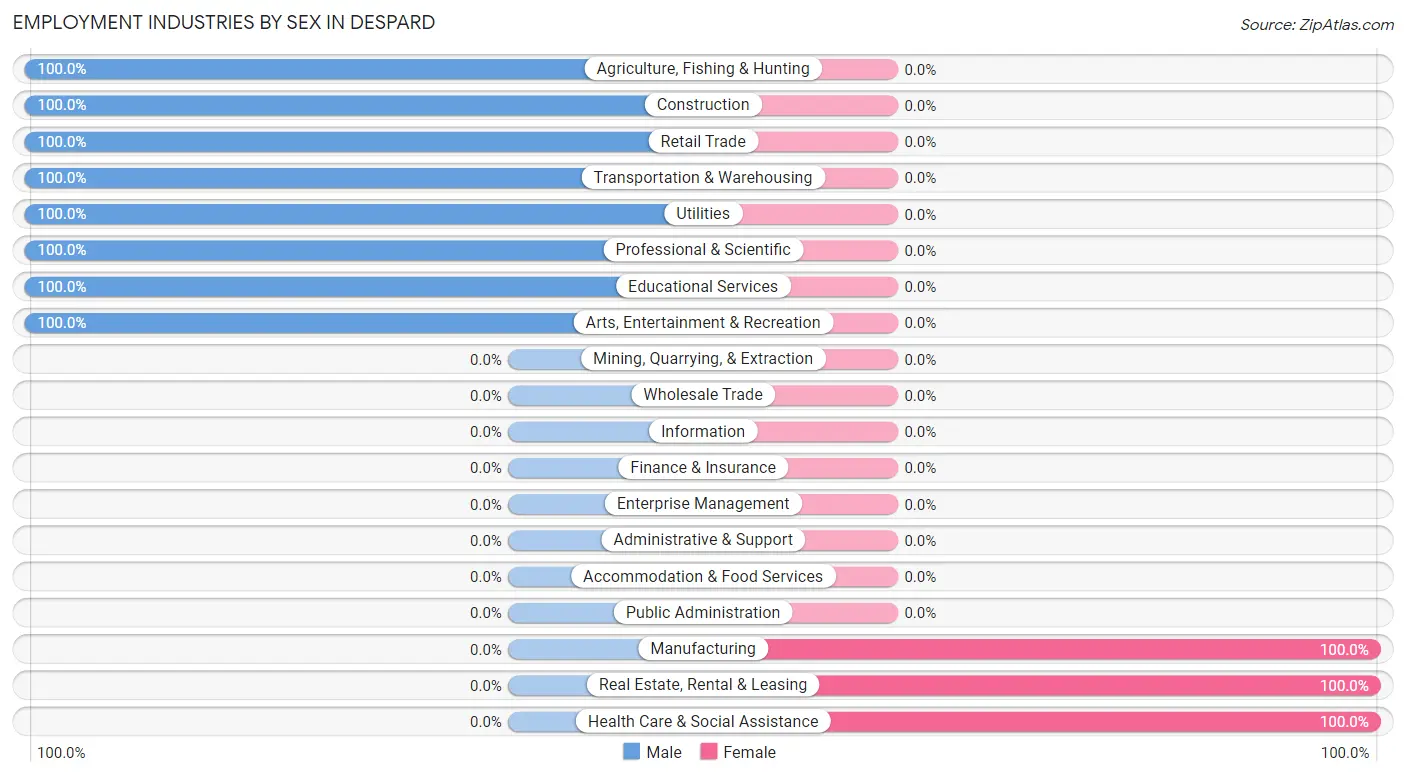
Employment Industries by Sex in Despard
The Despard industries that see more men than women are Agriculture, Fishing & Hunting (100.0%), Construction (100.0%), and Retail Trade (100.0%), whereas the industries that tend to have a higher number of women are Manufacturing (100.0%), Real Estate, Rental & Leasing (100.0%), and Health Care & Social Assistance (100.0%).
| Industry | Male | Female |
| Agriculture, Fishing & Hunting | 4 (100.0%) | 0 (0.0%) |
| Mining, Quarrying, & Extraction | 0 (0.0%) | 0 (0.0%) |
| Construction | 40 (100.0%) | 0 (0.0%) |
| Manufacturing | 0 (0.0%) | 47 (100.0%) |
| Wholesale Trade | 0 (0.0%) | 0 (0.0%) |
| Retail Trade | 14 (100.0%) | 0 (0.0%) |
| Transportation & Warehousing | 24 (100.0%) | 0 (0.0%) |
| Utilities | 4 (100.0%) | 0 (0.0%) |
| Information | 0 (0.0%) | 0 (0.0%) |
| Finance & Insurance | 0 (0.0%) | 0 (0.0%) |
| Real Estate, Rental & Leasing | 0 (0.0%) | 24 (100.0%) |
| Professional & Scientific | 6 (100.0%) | 0 (0.0%) |
| Enterprise Management | 0 (0.0%) | 0 (0.0%) |
| Administrative & Support | 0 (0.0%) | 0 (0.0%) |
| Educational Services | 36 (100.0%) | 0 (0.0%) |
| Health Care & Social Assistance | 0 (0.0%) | 79 (100.0%) |
| Arts, Entertainment & Recreation | 10 (100.0%) | 0 (0.0%) |
| Accommodation & Food Services | 0 (0.0%) | 0 (0.0%) |
| Public Administration | 0 (0.0%) | 0 (0.0%) |
| Total | 159 (51.5%) | 150 (48.5%) |
Education in Despard
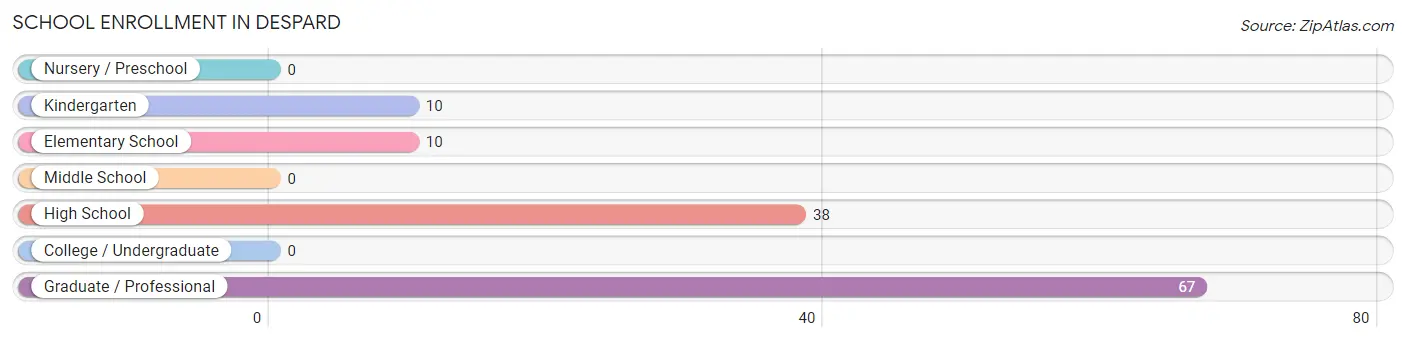
School Enrollment in Despard
The most common levels of schooling among the 125 students in Despard are graduate / professional (67 | 53.6%), high school (38 | 30.4%), and kindergarten (10 | 8.0%).
| School Level | # Students | % Students |
| Nursery / Preschool | 0 | 0.0% |
| Kindergarten | 10 | 8.0% |
| Elementary School | 10 | 8.0% |
| Middle School | 0 | 0.0% |
| High School | 38 | 30.4% |
| College / Undergraduate | 0 | 0.0% |
| Graduate / Professional | 67 | 53.6% |
| Total | 125 | 100.0% |
School Enrollment by Age by Funding Source in Despard
Out of a total of 125 students who are enrolled in schools in Despard, 71 (56.8%) attend a private institution, while the remaining 54 (43.2%) are enrolled in public schools. The age group of 25 to 34 year olds has the highest likelihood of being enrolled in private schools, with 36 (100.0% in the age bracket) enrolled. Conversely, the age group of 5 to 9 year old has the lowest likelihood of being enrolled in a private school, with 20 (100.0% in the age bracket) attending a public institution.
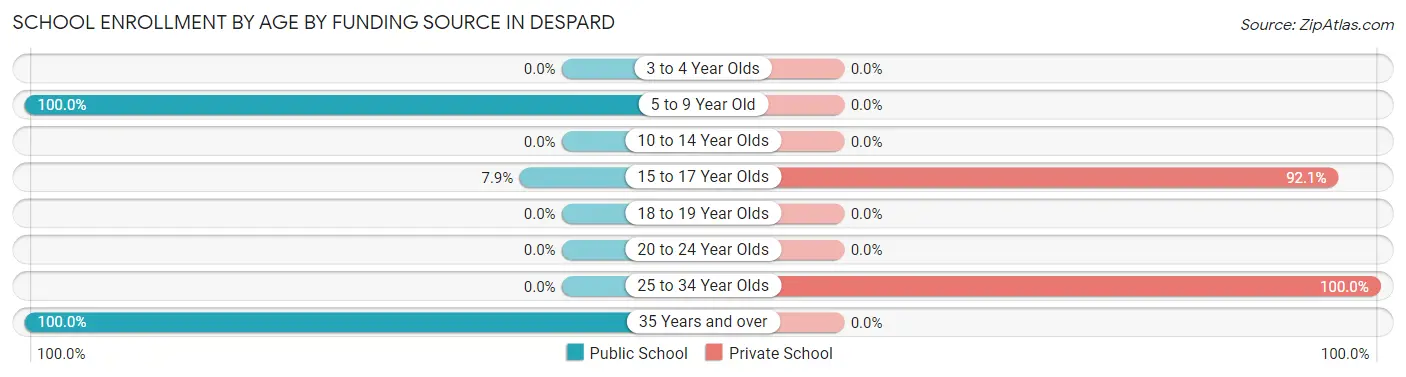
| Age Bracket | Public School | Private School |
| 3 to 4 Year Olds | 0 (0.0%) | 0 (0.0%) |
| 5 to 9 Year Old | 20 (100.0%) | 0 (0.0%) |
| 10 to 14 Year Olds | 0 (0.0%) | 0 (0.0%) |
| 15 to 17 Year Olds | 3 (7.9%) | 35 (92.1%) |
| 18 to 19 Year Olds | 0 (0.0%) | 0 (0.0%) |
| 20 to 24 Year Olds | 0 (0.0%) | 0 (0.0%) |
| 25 to 34 Year Olds | 0 (0.0%) | 36 (100.0%) |
| 35 Years and over | 31 (100.0%) | 0 (0.0%) |
| Total | 54 (43.2%) | 71 (56.8%) |
Educational Attainment by Field of Study in Despard
Visual & performing arts (36 | 54.5%), and arts & humanities (30 | 45.5%) are the most common fields of study among 66 individuals in Despard who have obtained a bachelor's degree or higher.
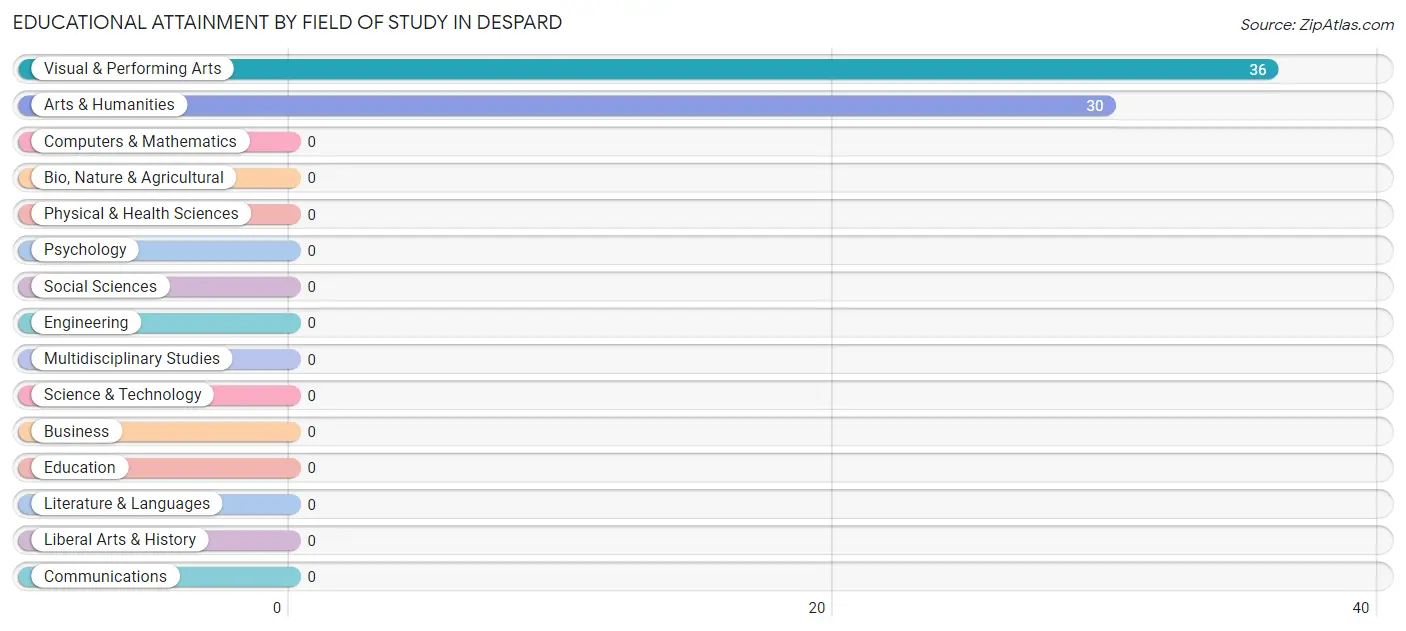
| Field of Study | # Graduates | % Graduates |
| Computers & Mathematics | 0 | 0.0% |
| Bio, Nature & Agricultural | 0 | 0.0% |
| Physical & Health Sciences | 0 | 0.0% |
| Psychology | 0 | 0.0% |
| Social Sciences | 0 | 0.0% |
| Engineering | 0 | 0.0% |
| Multidisciplinary Studies | 0 | 0.0% |
| Science & Technology | 0 | 0.0% |
| Business | 0 | 0.0% |
| Education | 0 | 0.0% |
| Literature & Languages | 0 | 0.0% |
| Liberal Arts & History | 0 | 0.0% |
| Visual & Performing Arts | 36 | 54.5% |
| Communications | 0 | 0.0% |
| Arts & Humanities | 30 | 45.5% |
| Total | 66 | 100.0% |
Transportation & Commute in Despard
Vehicle Availability by Sex in Despard
The most prevalent vehicle ownership categories in Despard are males with 2 vehicles (120, accounting for 75.5%) and females with 2 vehicles (70, making up 80.0%).
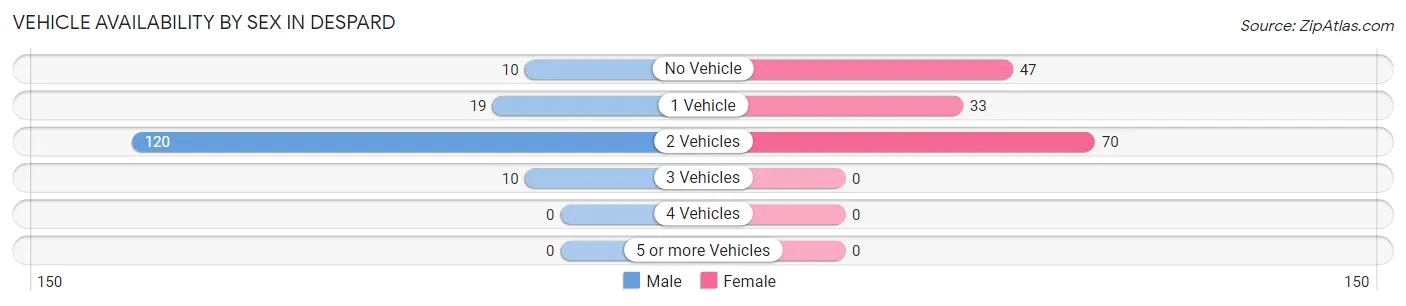
| Vehicles Available | Male | Female |
| No Vehicle | 10 (6.3%) | 47 (31.3%) |
| 1 Vehicle | 19 (11.9%) | 33 (22.0%) |
| 2 Vehicles | 120 (75.5%) | 70 (46.7%) |
| 3 Vehicles | 10 (6.3%) | 0 (0.0%) |
| 4 Vehicles | 0 (0.0%) | 0 (0.0%) |
| 5 or more Vehicles | 0 (0.0%) | 0 (0.0%) |
| Total | 159 (100.0%) | 150 (100.0%) |
Commute Time in Despard
The most frequently occuring commute durations in Despard are 15 to 19 minutes (77 commuters, 27.0%), 20 to 24 minutes (63 commuters, 22.1%), and 5 to 9 minutes (59 commuters, 20.7%).
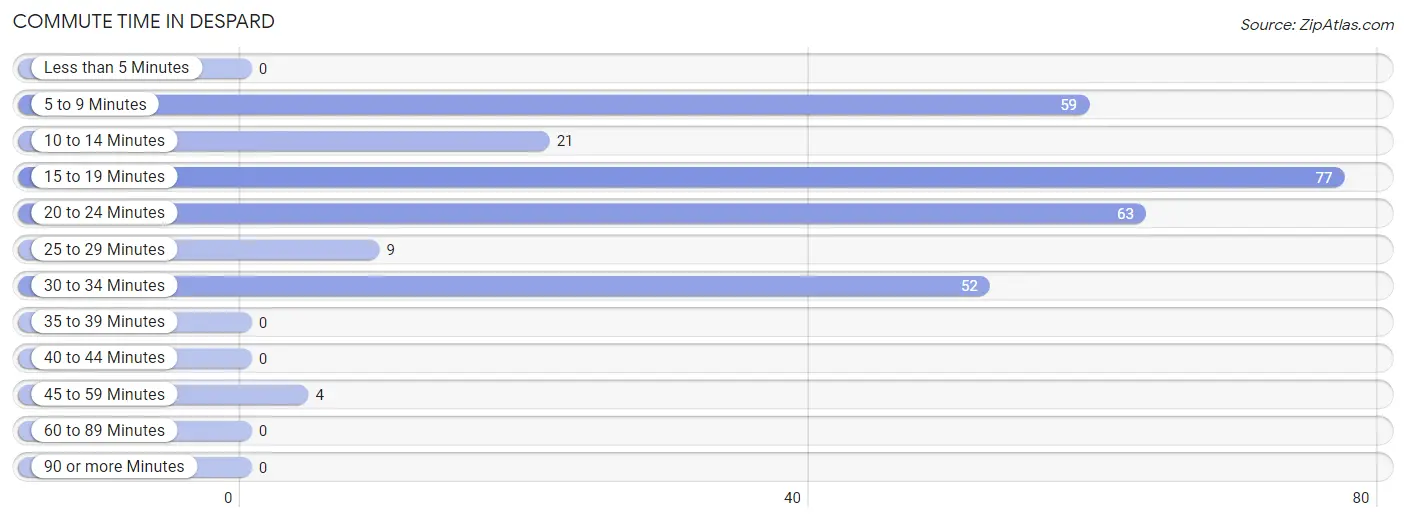
| Commute Time | # Commuters | % Commuters |
| Less than 5 Minutes | 0 | 0.0% |
| 5 to 9 Minutes | 59 | 20.7% |
| 10 to 14 Minutes | 21 | 7.4% |
| 15 to 19 Minutes | 77 | 27.0% |
| 20 to 24 Minutes | 63 | 22.1% |
| 25 to 29 Minutes | 9 | 3.2% |
| 30 to 34 Minutes | 52 | 18.2% |
| 35 to 39 Minutes | 0 | 0.0% |
| 40 to 44 Minutes | 0 | 0.0% |
| 45 to 59 Minutes | 4 | 1.4% |
| 60 to 89 Minutes | 0 | 0.0% |
| 90 or more Minutes | 0 | 0.0% |
Commute Time by Sex in Despard
The most common commute times in Despard are 20 to 24 minutes (60 commuters, 37.7%) for males and 15 to 19 minutes (47 commuters, 37.3%) for females.
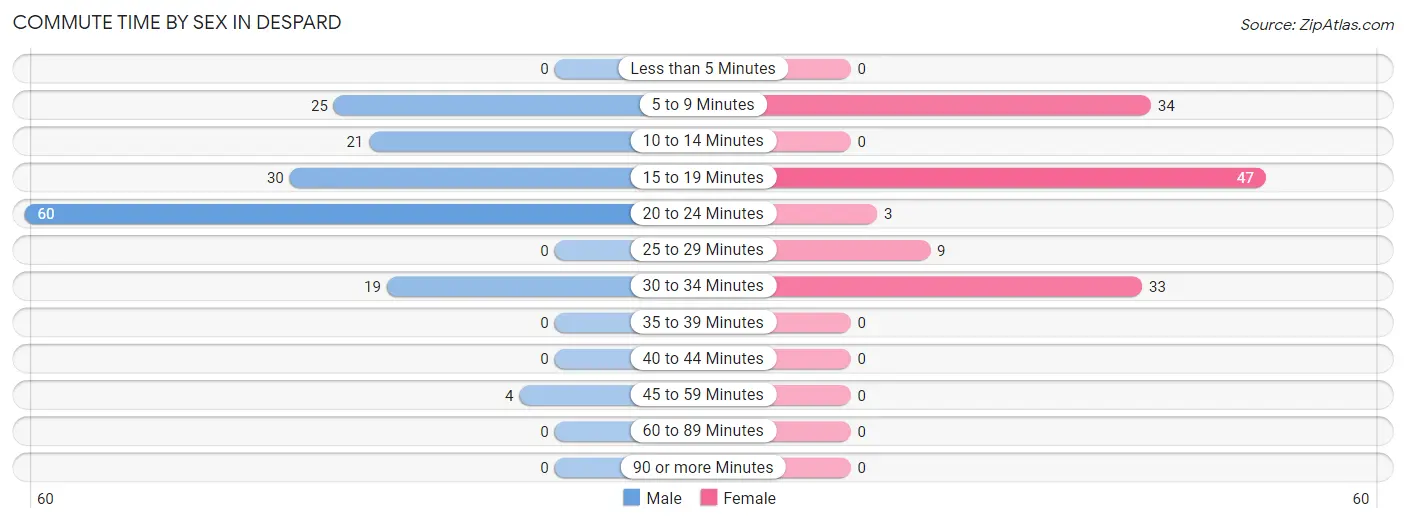
| Commute Time | Male | Female |
| Less than 5 Minutes | 0 (0.0%) | 0 (0.0%) |
| 5 to 9 Minutes | 25 (15.7%) | 34 (27.0%) |
| 10 to 14 Minutes | 21 (13.2%) | 0 (0.0%) |
| 15 to 19 Minutes | 30 (18.9%) | 47 (37.3%) |
| 20 to 24 Minutes | 60 (37.7%) | 3 (2.4%) |
| 25 to 29 Minutes | 0 (0.0%) | 9 (7.1%) |
| 30 to 34 Minutes | 19 (11.9%) | 33 (26.2%) |
| 35 to 39 Minutes | 0 (0.0%) | 0 (0.0%) |
| 40 to 44 Minutes | 0 (0.0%) | 0 (0.0%) |
| 45 to 59 Minutes | 4 (2.5%) | 0 (0.0%) |
| 60 to 89 Minutes | 0 (0.0%) | 0 (0.0%) |
| 90 or more Minutes | 0 (0.0%) | 0 (0.0%) |
Time of Departure to Work by Sex in Despard
The most frequent times of departure to work in Despard are 7:30 AM to 7:59 AM (36, 22.6%) for males and 8:00 AM to 8:29 AM (67, 53.2%) for females.
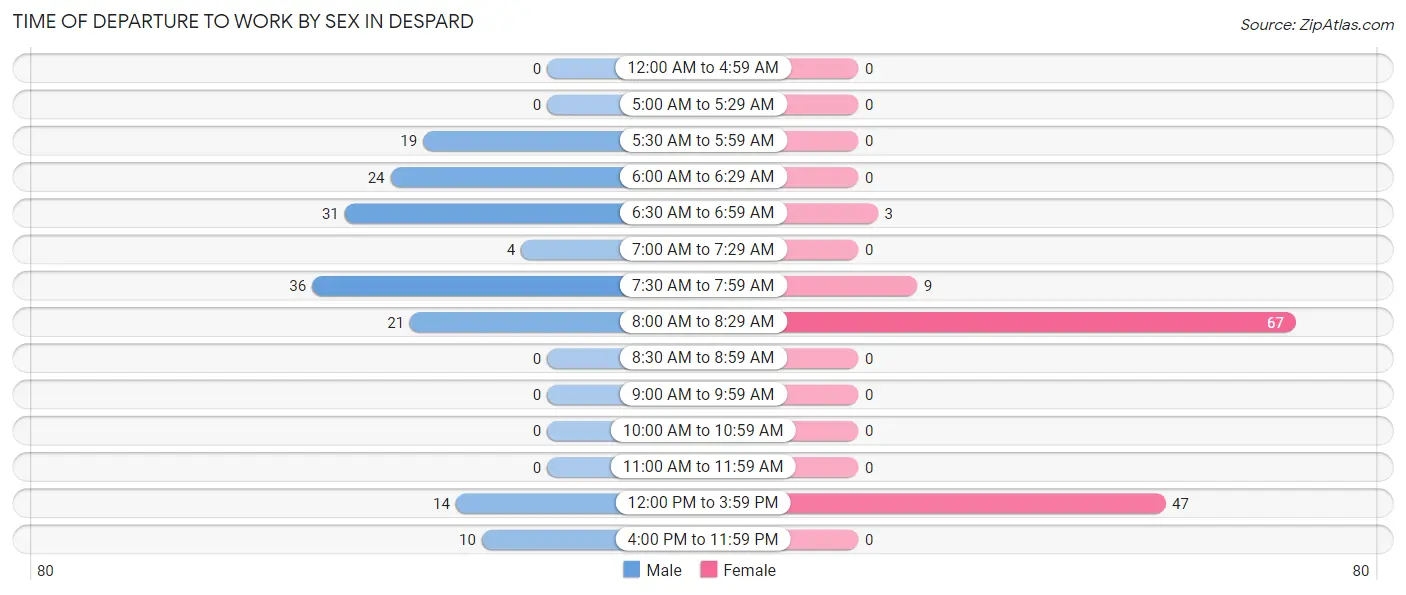
| Time of Departure | Male | Female |
| 12:00 AM to 4:59 AM | 0 (0.0%) | 0 (0.0%) |
| 5:00 AM to 5:29 AM | 0 (0.0%) | 0 (0.0%) |
| 5:30 AM to 5:59 AM | 19 (11.9%) | 0 (0.0%) |
| 6:00 AM to 6:29 AM | 24 (15.1%) | 0 (0.0%) |
| 6:30 AM to 6:59 AM | 31 (19.5%) | 3 (2.4%) |
| 7:00 AM to 7:29 AM | 4 (2.5%) | 0 (0.0%) |
| 7:30 AM to 7:59 AM | 36 (22.6%) | 9 (7.1%) |
| 8:00 AM to 8:29 AM | 21 (13.2%) | 67 (53.2%) |
| 8:30 AM to 8:59 AM | 0 (0.0%) | 0 (0.0%) |
| 9:00 AM to 9:59 AM | 0 (0.0%) | 0 (0.0%) |
| 10:00 AM to 10:59 AM | 0 (0.0%) | 0 (0.0%) |
| 11:00 AM to 11:59 AM | 0 (0.0%) | 0 (0.0%) |
| 12:00 PM to 3:59 PM | 14 (8.8%) | 47 (37.3%) |
| 4:00 PM to 11:59 PM | 10 (6.3%) | 0 (0.0%) |
| Total | 159 (100.0%) | 126 (100.0%) |
Housing Occupancy in Despard
Occupancy by Ownership in Despard
Of the total 465 dwellings in Despard, owner-occupied units account for 241 (51.8%), while renter-occupied units make up 224 (48.2%).
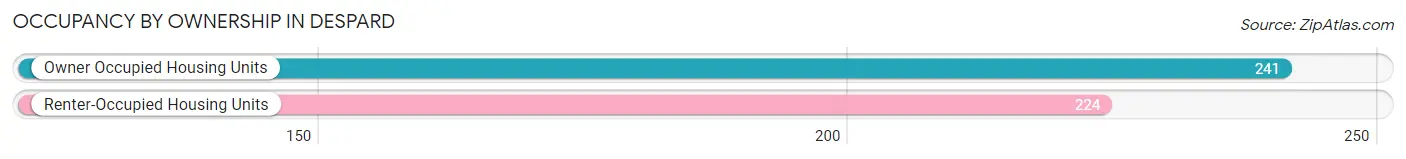
| Occupancy | # Housing Units | % Housing Units |
| Owner Occupied Housing Units | 241 | 51.8% |
| Renter-Occupied Housing Units | 224 | 48.2% |
| Total Occupied Housing Units | 465 | 100.0% |
Occupancy by Household Size in Despard
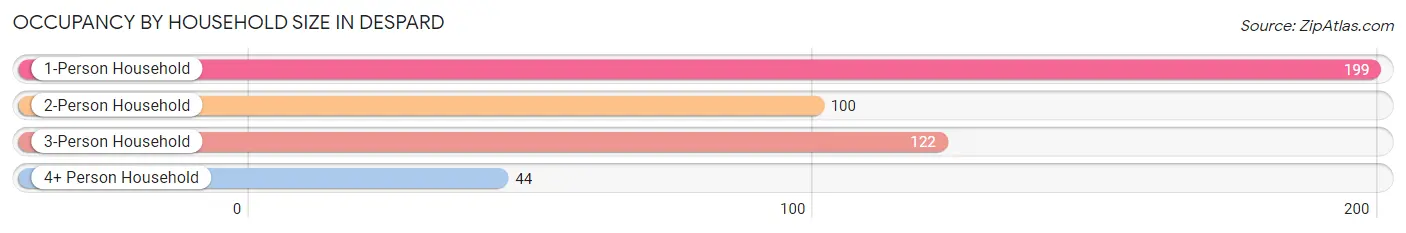
| Household Size | # Housing Units | % Housing Units |
| 1-Person Household | 199 | 42.8% |
| 2-Person Household | 100 | 21.5% |
| 3-Person Household | 122 | 26.2% |
| 4+ Person Household | 44 | 9.5% |
| Total Housing Units | 465 | 100.0% |
Occupancy by Ownership by Household Size in Despard
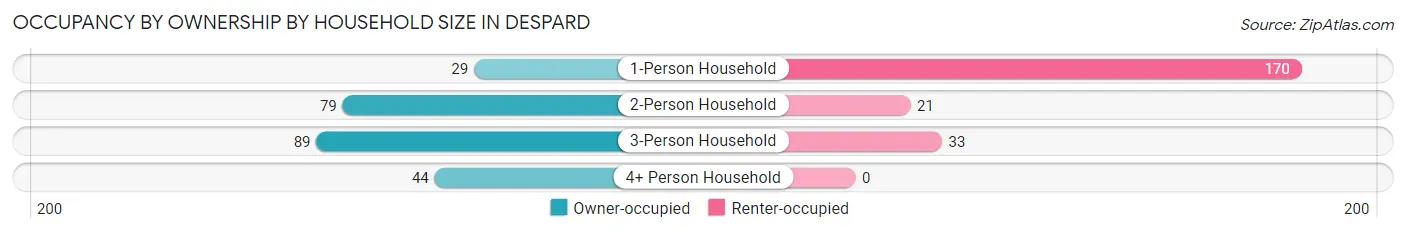
| Household Size | Owner-occupied | Renter-occupied |
| 1-Person Household | 29 (14.6%) | 170 (85.4%) |
| 2-Person Household | 79 (79.0%) | 21 (21.0%) |
| 3-Person Household | 89 (73.0%) | 33 (27.1%) |
| 4+ Person Household | 44 (100.0%) | 0 (0.0%) |
| Total Housing Units | 241 (51.8%) | 224 (48.2%) |
Occupancy by Educational Attainment in Despard
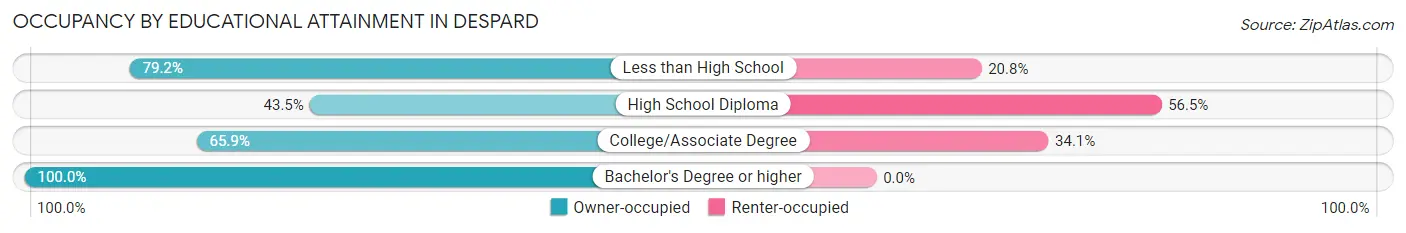
| Household Size | Owner-occupied | Renter-occupied |
| Less than High School | 19 (79.2%) | 5 (20.8%) |
| High School Diploma | 157 (43.5%) | 204 (56.5%) |
| College/Associate Degree | 29 (65.9%) | 15 (34.1%) |
| Bachelor's Degree or higher | 36 (100.0%) | 0 (0.0%) |
Occupancy by Age of Householder in Despard
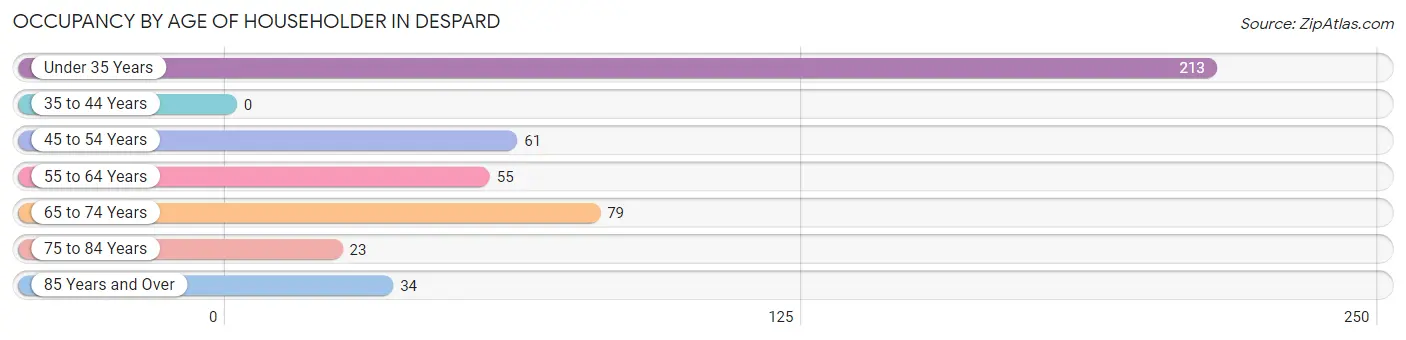
| Age Bracket | # Households | % Households |
| Under 35 Years | 213 | 45.8% |
| 35 to 44 Years | 0 | 0.0% |
| 45 to 54 Years | 61 | 13.1% |
| 55 to 64 Years | 55 | 11.8% |
| 65 to 74 Years | 79 | 17.0% |
| 75 to 84 Years | 23 | 5.0% |
| 85 Years and Over | 34 | 7.3% |
| Total | 465 | 100.0% |
Housing Finances in Despard
Median Income by Occupancy in Despard
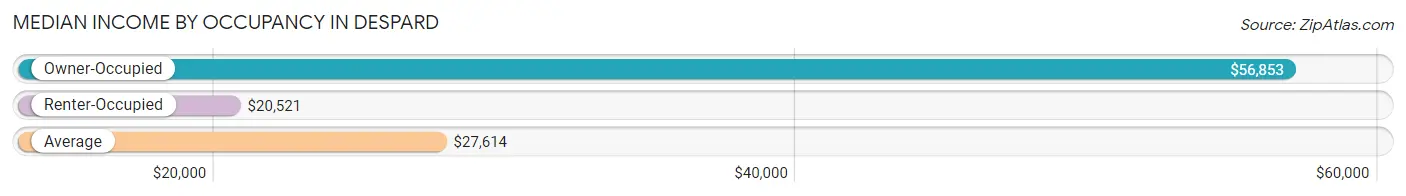
| Occupancy Type | # Households | Median Income |
| Owner-Occupied | 241 (51.8%) | $56,853 |
| Renter-Occupied | 224 (48.2%) | $20,521 |
| Average | 465 (100.0%) | $27,614 |
Occupancy by Householder Income Bracket in Despard
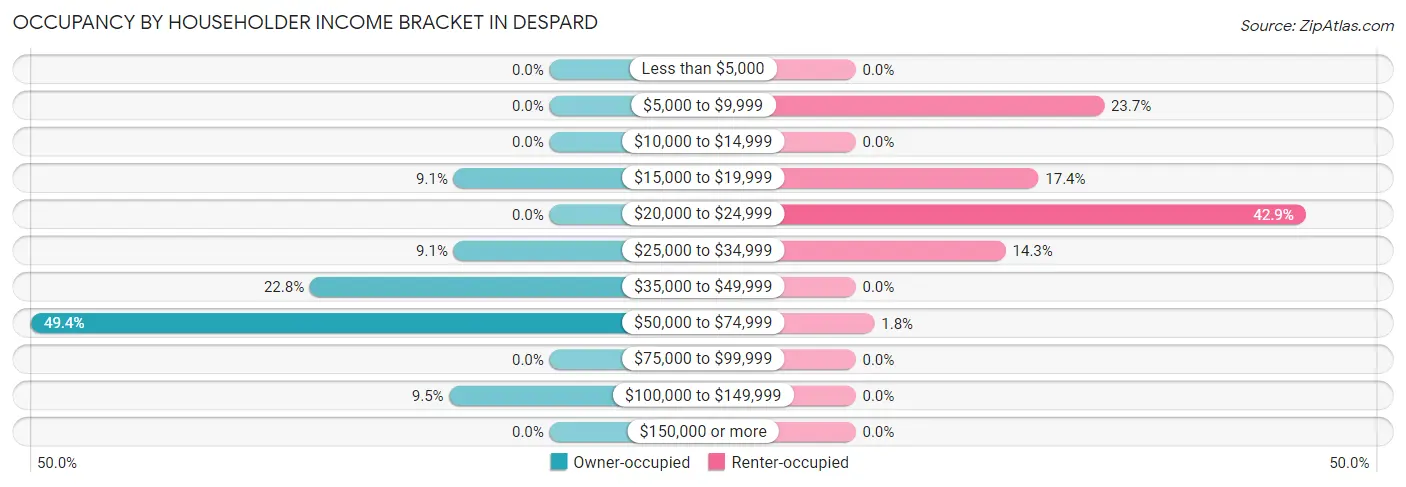
| Income Bracket | Owner-occupied | Renter-occupied |
| Less than $5,000 | 0 (0.0%) | 0 (0.0%) |
| $5,000 to $9,999 | 0 (0.0%) | 53 (23.7%) |
| $10,000 to $14,999 | 0 (0.0%) | 0 (0.0%) |
| $15,000 to $19,999 | 22 (9.1%) | 39 (17.4%) |
| $20,000 to $24,999 | 0 (0.0%) | 96 (42.9%) |
| $25,000 to $34,999 | 22 (9.1%) | 32 (14.3%) |
| $35,000 to $49,999 | 55 (22.8%) | 0 (0.0%) |
| $50,000 to $74,999 | 119 (49.4%) | 4 (1.8%) |
| $75,000 to $99,999 | 0 (0.0%) | 0 (0.0%) |
| $100,000 to $149,999 | 23 (9.5%) | 0 (0.0%) |
| $150,000 or more | 0 (0.0%) | 0 (0.0%) |
| Total | 241 (100.0%) | 224 (100.0%) |
Monthly Housing Cost Tiers in Despard
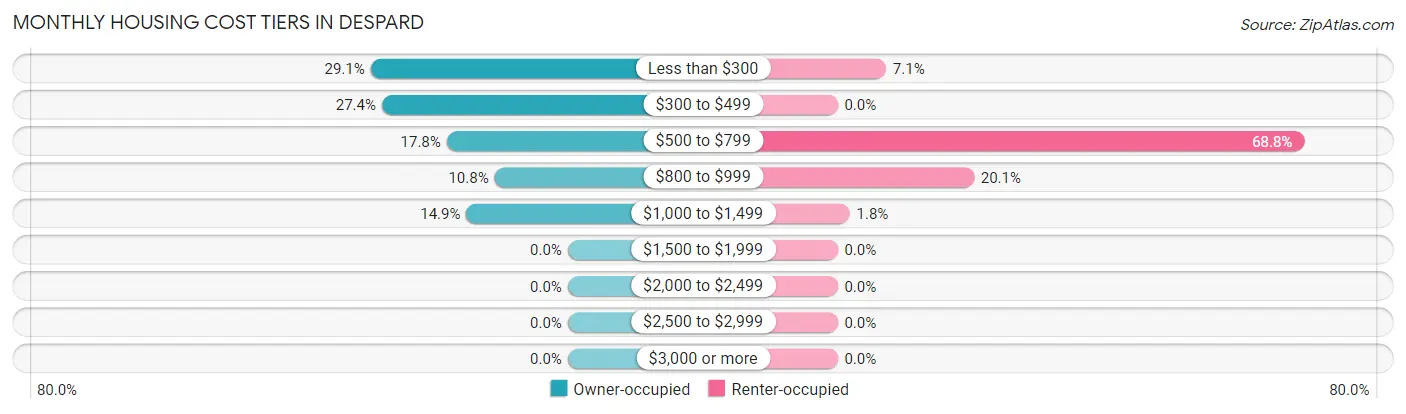
| Monthly Cost | Owner-occupied | Renter-occupied |
| Less than $300 | 70 (29.0%) | 16 (7.1%) |
| $300 to $499 | 66 (27.4%) | 0 (0.0%) |
| $500 to $799 | 43 (17.8%) | 154 (68.8%) |
| $800 to $999 | 26 (10.8%) | 45 (20.1%) |
| $1,000 to $1,499 | 36 (14.9%) | 4 (1.8%) |
| $1,500 to $1,999 | 0 (0.0%) | 0 (0.0%) |
| $2,000 to $2,499 | 0 (0.0%) | 0 (0.0%) |
| $2,500 to $2,999 | 0 (0.0%) | 0 (0.0%) |
| $3,000 or more | 0 (0.0%) | 0 (0.0%) |
| Total | 241 (100.0%) | 224 (100.0%) |
Physical Housing Characteristics in Despard
Housing Structures in Despard
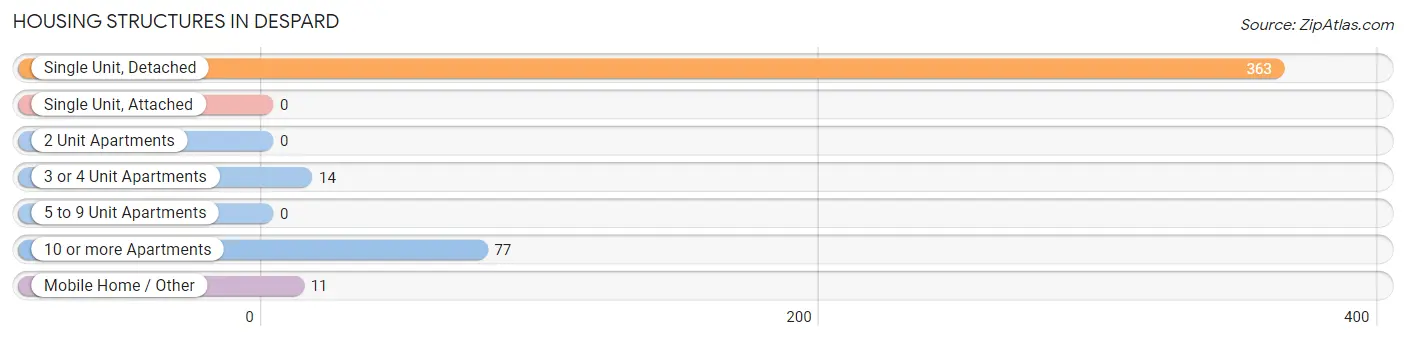
| Structure Type | # Housing Units | % Housing Units |
| Single Unit, Detached | 363 | 78.1% |
| Single Unit, Attached | 0 | 0.0% |
| 2 Unit Apartments | 0 | 0.0% |
| 3 or 4 Unit Apartments | 14 | 3.0% |
| 5 to 9 Unit Apartments | 0 | 0.0% |
| 10 or more Apartments | 77 | 16.6% |
| Mobile Home / Other | 11 | 2.4% |
| Total | 465 | 100.0% |
Housing Structures by Occupancy in Despard
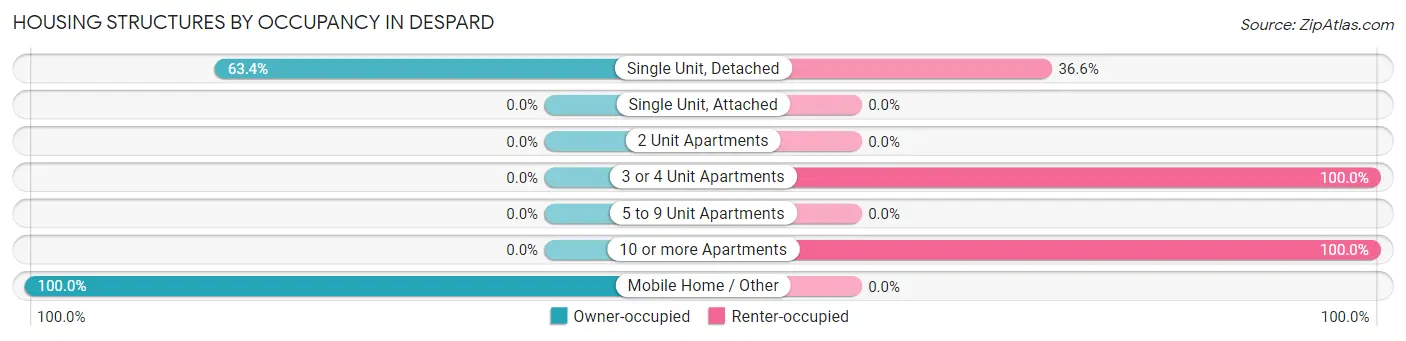
| Structure Type | Owner-occupied | Renter-occupied |
| Single Unit, Detached | 230 (63.4%) | 133 (36.6%) |
| Single Unit, Attached | 0 (0.0%) | 0 (0.0%) |
| 2 Unit Apartments | 0 (0.0%) | 0 (0.0%) |
| 3 or 4 Unit Apartments | 0 (0.0%) | 14 (100.0%) |
| 5 to 9 Unit Apartments | 0 (0.0%) | 0 (0.0%) |
| 10 or more Apartments | 0 (0.0%) | 77 (100.0%) |
| Mobile Home / Other | 11 (100.0%) | 0 (0.0%) |
| Total | 241 (51.8%) | 224 (48.2%) |
Housing Structures by Number of Rooms in Despard
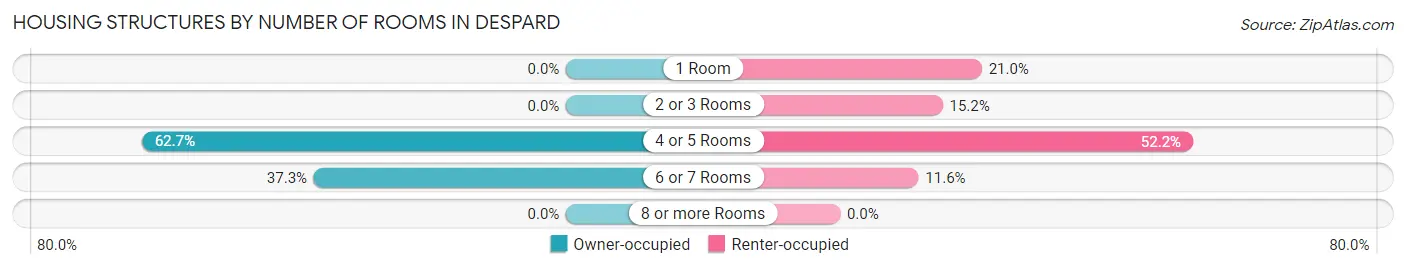
| Number of Rooms | Owner-occupied | Renter-occupied |
| 1 Room | 0 (0.0%) | 47 (21.0%) |
| 2 or 3 Rooms | 0 (0.0%) | 34 (15.2%) |
| 4 or 5 Rooms | 151 (62.7%) | 117 (52.2%) |
| 6 or 7 Rooms | 90 (37.3%) | 26 (11.6%) |
| 8 or more Rooms | 0 (0.0%) | 0 (0.0%) |
| Total | 241 (100.0%) | 224 (100.0%) |
Housing Structure by Heating Type in Despard
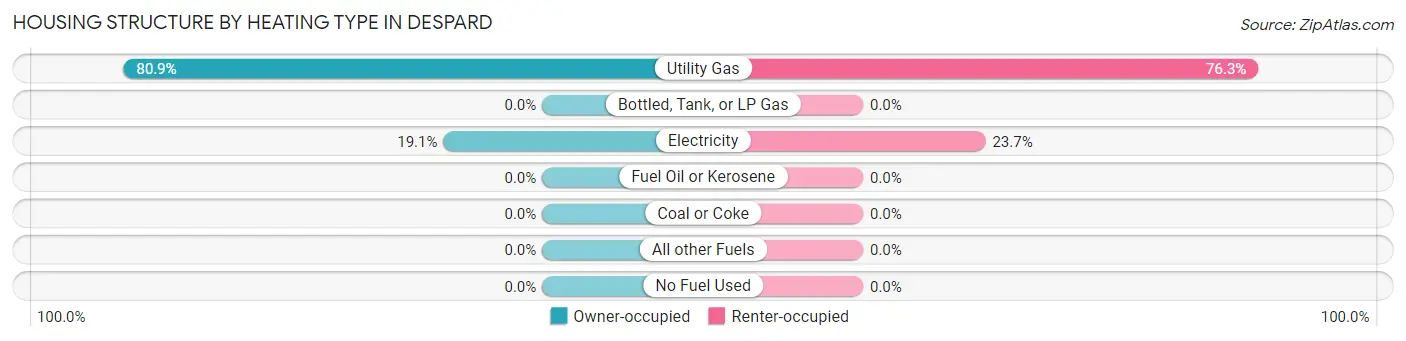
| Heating Type | Owner-occupied | Renter-occupied |
| Utility Gas | 195 (80.9%) | 171 (76.3%) |
| Bottled, Tank, or LP Gas | 0 (0.0%) | 0 (0.0%) |
| Electricity | 46 (19.1%) | 53 (23.7%) |
| Fuel Oil or Kerosene | 0 (0.0%) | 0 (0.0%) |
| Coal or Coke | 0 (0.0%) | 0 (0.0%) |
| All other Fuels | 0 (0.0%) | 0 (0.0%) |
| No Fuel Used | 0 (0.0%) | 0 (0.0%) |
| Total | 241 (100.0%) | 224 (100.0%) |
Household Vehicle Usage in Despard
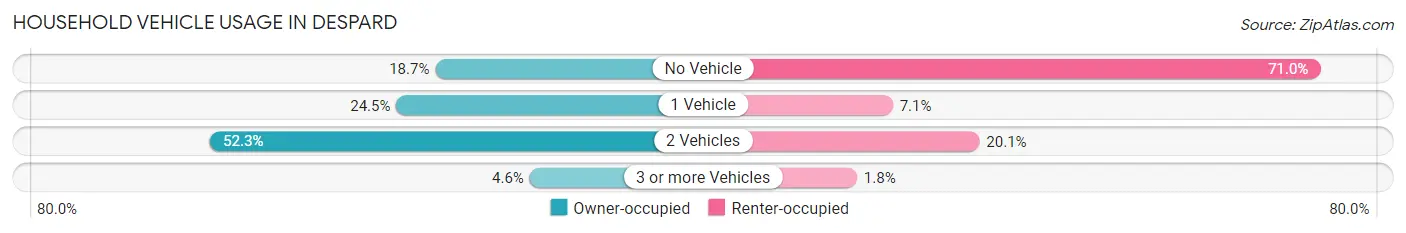
| Vehicles per Household | Owner-occupied | Renter-occupied |
| No Vehicle | 45 (18.7%) | 159 (71.0%) |
| 1 Vehicle | 59 (24.5%) | 16 (7.1%) |
| 2 Vehicles | 126 (52.3%) | 45 (20.1%) |
| 3 or more Vehicles | 11 (4.6%) | 4 (1.8%) |
| Total | 241 (100.0%) | 224 (100.0%) |
Real Estate & Mortgages in Despard
Real Estate and Mortgage Overview in Despard
| Characteristic | Without Mortgage | With Mortgage |
| Housing Units | 147 | 94 |
| Median Property Value | $75,400 | $117,000 |
| Median Household Income | $57,457 | $0 |
| Monthly Housing Costs | $305 | $0 |
| Real Estate Taxes | $333 | $0 |
Property Value by Mortgage Status in Despard
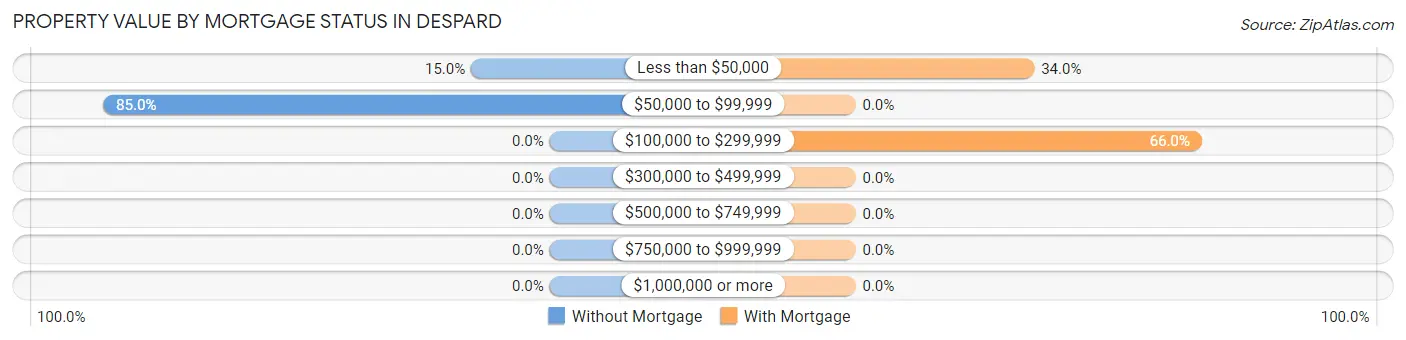
| Property Value | Without Mortgage | With Mortgage |
| Less than $50,000 | 22 (15.0%) | 32 (34.0%) |
| $50,000 to $99,999 | 125 (85.0%) | 0 (0.0%) |
| $100,000 to $299,999 | 0 (0.0%) | 62 (66.0%) |
| $300,000 to $499,999 | 0 (0.0%) | 0 (0.0%) |
| $500,000 to $749,999 | 0 (0.0%) | 0 (0.0%) |
| $750,000 to $999,999 | 0 (0.0%) | 0 (0.0%) |
| $1,000,000 or more | 0 (0.0%) | 0 (0.0%) |
| Total | 147 (100.0%) | 94 (100.0%) |
Household Income by Mortgage Status in Despard
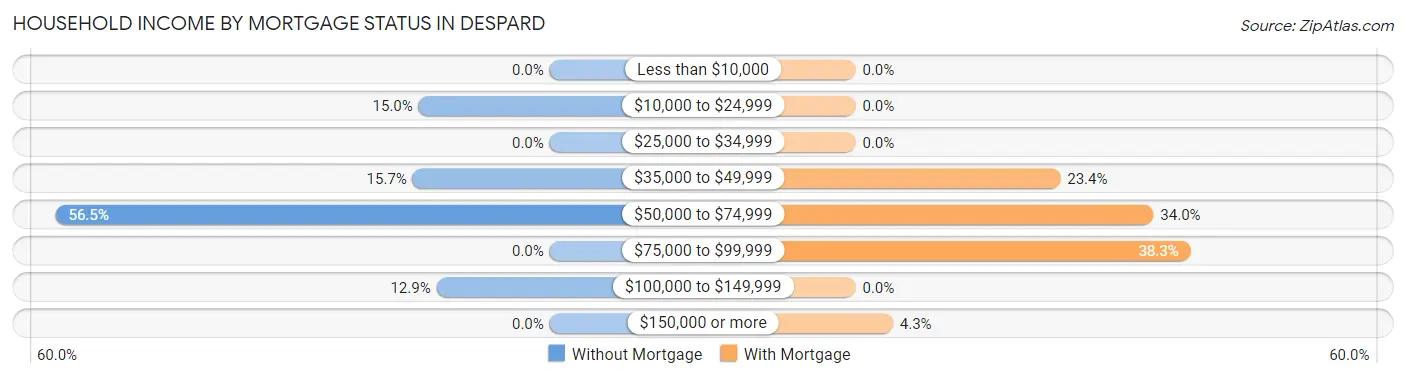
| Household Income | Without Mortgage | With Mortgage |
| Less than $10,000 | 0 (0.0%) | 0 (0.0%) |
| $10,000 to $24,999 | 22 (15.0%) | 0 (0.0%) |
| $25,000 to $34,999 | 0 (0.0%) | 0 (0.0%) |
| $35,000 to $49,999 | 23 (15.7%) | 22 (23.4%) |
| $50,000 to $74,999 | 83 (56.5%) | 32 (34.0%) |
| $75,000 to $99,999 | 0 (0.0%) | 36 (38.3%) |
| $100,000 to $149,999 | 19 (12.9%) | 0 (0.0%) |
| $150,000 or more | 0 (0.0%) | 4 (4.3%) |
| Total | 147 (100.0%) | 94 (100.0%) |
Property Value to Household Income Ratio in Despard
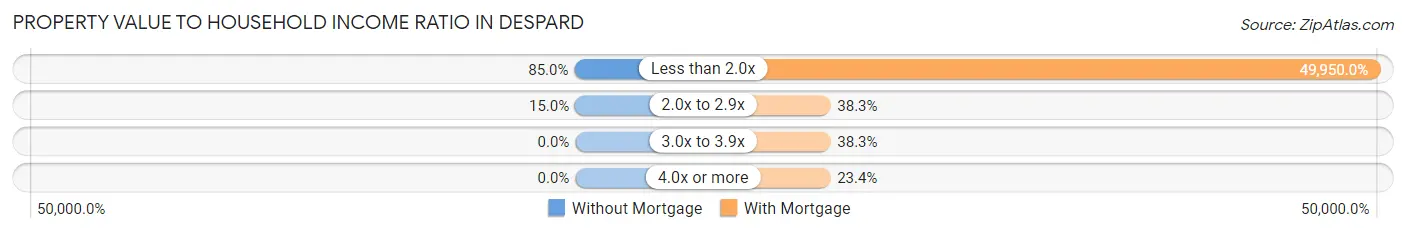
| Value-to-Income Ratio | Without Mortgage | With Mortgage |
| Less than 2.0x | 125 (85.0%) | 46,953 (49,950.0%) |
| 2.0x to 2.9x | 22 (15.0%) | 36 (38.3%) |
| 3.0x to 3.9x | 0 (0.0%) | 36 (38.3%) |
| 4.0x or more | 0 (0.0%) | 22 (23.4%) |
| Total | 147 (100.0%) | 94 (100.0%) |
Real Estate Taxes by Mortgage Status in Despard
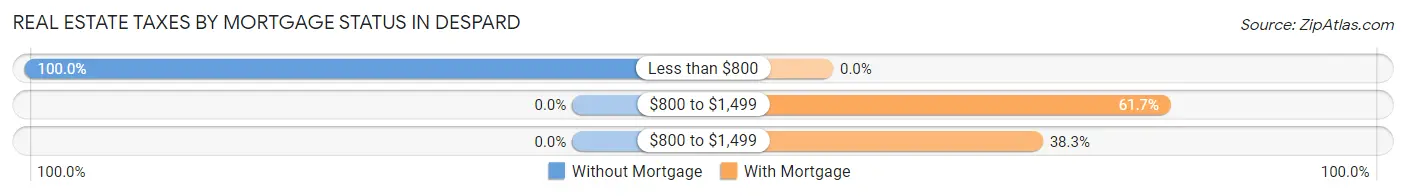
| Property Taxes | Without Mortgage | With Mortgage |
| Less than $800 | 147 (100.0%) | 0 (0.0%) |
| $800 to $1,499 | 0 (0.0%) | 58 (61.7%) |
| $800 to $1,499 | 0 (0.0%) | 36 (38.3%) |
| Total | 147 (100.0%) | 94 (100.0%) |
Health & Disability in Despard
Health Insurance Coverage by Age in Despard
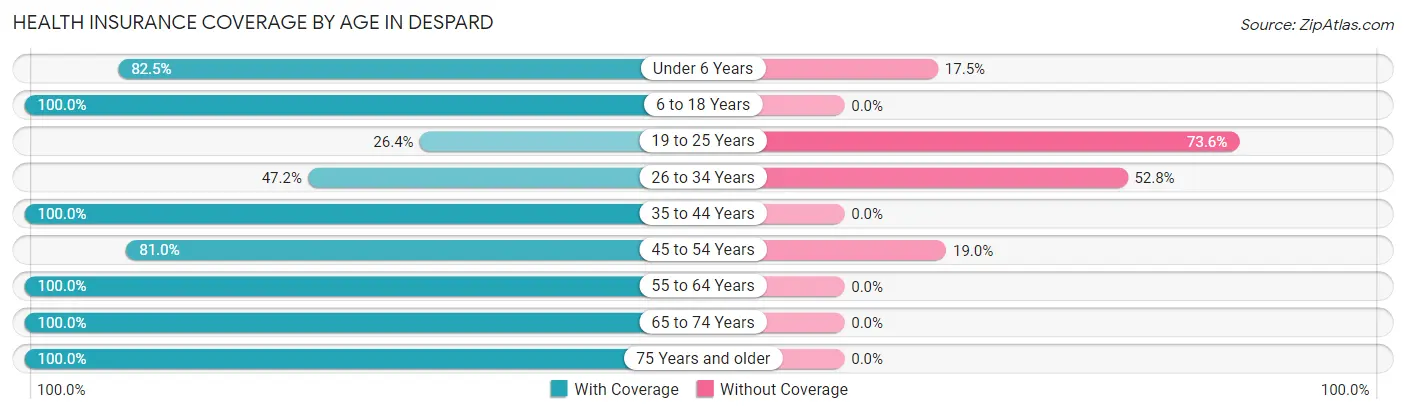
| Age Bracket | With Coverage | Without Coverage |
| Under 6 Years | 104 (82.5%) | 22 (17.5%) |
| 6 to 18 Years | 48 (100.0%) | 0 (0.0%) |
| 19 to 25 Years | 43 (26.4%) | 120 (73.6%) |
| 26 to 34 Years | 76 (47.2%) | 85 (52.8%) |
| 35 to 44 Years | 86 (100.0%) | 0 (0.0%) |
| 45 to 54 Years | 94 (81.0%) | 22 (19.0%) |
| 55 to 64 Years | 68 (100.0%) | 0 (0.0%) |
| 65 to 74 Years | 112 (100.0%) | 0 (0.0%) |
| 75 Years and older | 103 (100.0%) | 0 (0.0%) |
| Total | 734 (74.7%) | 249 (25.3%) |
Health Insurance Coverage by Citizenship Status in Despard
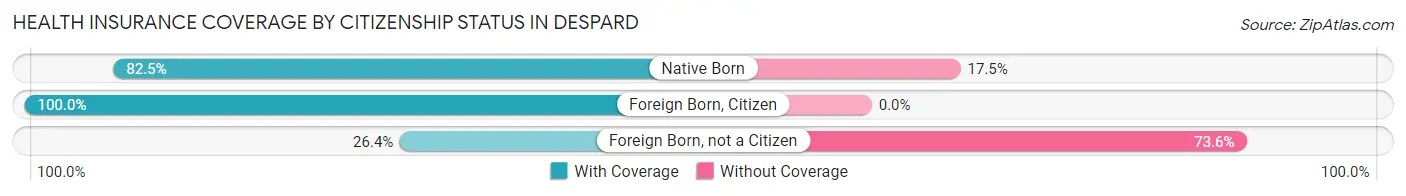
| Citizenship Status | With Coverage | Without Coverage |
| Native Born | 104 (82.5%) | 22 (17.5%) |
| Foreign Born, Citizen | 48 (100.0%) | 0 (0.0%) |
| Foreign Born, not a Citizen | 43 (26.4%) | 120 (73.6%) |
Health Insurance Coverage by Household Income in Despard
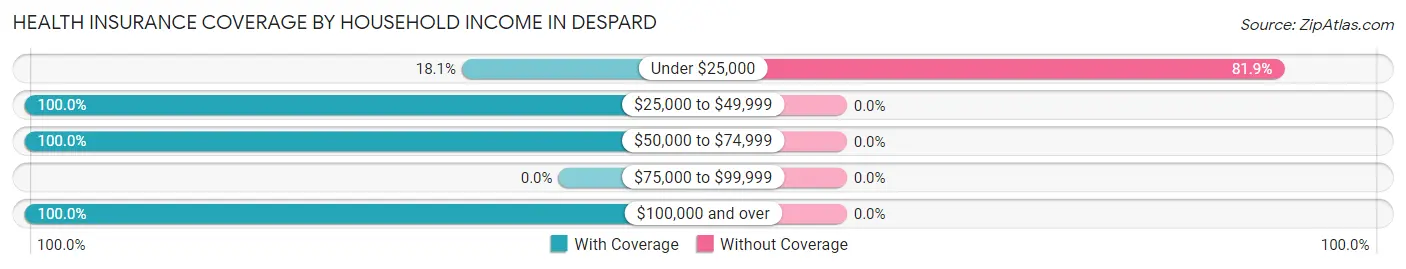
| Household Income | With Coverage | Without Coverage |
| Under $25,000 | 55 (18.1%) | 249 (81.9%) |
| $25,000 to $49,999 | 263 (100.0%) | 0 (0.0%) |
| $50,000 to $74,999 | 377 (100.0%) | 0 (0.0%) |
| $75,000 to $99,999 | 0 (0.0%) | 0 (0.0%) |
| $100,000 and over | 39 (100.0%) | 0 (0.0%) |
Public vs Private Health Insurance Coverage by Age in Despard
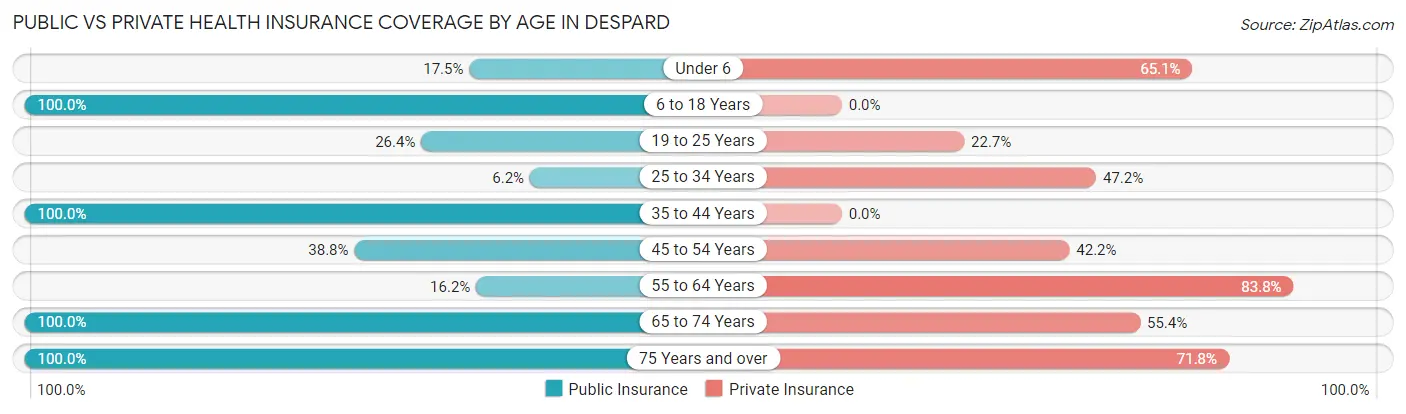
| Age Bracket | Public Insurance | Private Insurance |
| Under 6 | 22 (17.5%) | 82 (65.1%) |
| 6 to 18 Years | 48 (100.0%) | 0 (0.0%) |
| 19 to 25 Years | 43 (26.4%) | 37 (22.7%) |
| 25 to 34 Years | 10 (6.2%) | 76 (47.2%) |
| 35 to 44 Years | 86 (100.0%) | 0 (0.0%) |
| 45 to 54 Years | 45 (38.8%) | 49 (42.2%) |
| 55 to 64 Years | 11 (16.2%) | 57 (83.8%) |
| 65 to 74 Years | 112 (100.0%) | 62 (55.4%) |
| 75 Years and over | 103 (100.0%) | 74 (71.8%) |
| Total | 480 (48.8%) | 437 (44.5%) |
Disability Status by Sex by Age in Despard
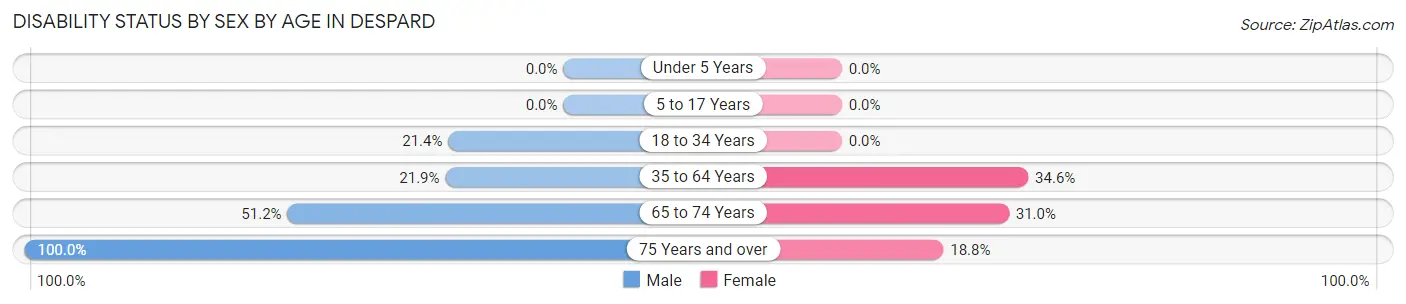
| Age Bracket | Male | Female |
| Under 5 Years | 0 (0.0%) | 0 (0.0%) |
| 5 to 17 Years | 0 (0.0%) | 0 (0.0%) |
| 18 to 34 Years | 47 (21.4%) | 0 (0.0%) |
| 35 to 64 Years | 30 (21.9%) | 46 (34.6%) |
| 65 to 74 Years | 21 (51.2%) | 22 (31.0%) |
| 75 Years and over | 34 (100.0%) | 13 (18.8%) |
Disability Class by Sex by Age in Despard
Disability Class: Hearing Difficulty
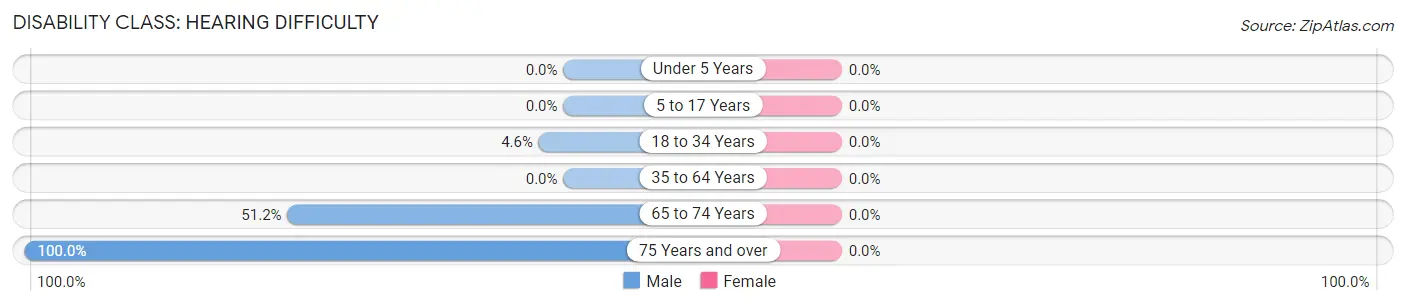
| Age Bracket | Male | Female |
| Under 5 Years | 0 (0.0%) | 0 (0.0%) |
| 5 to 17 Years | 0 (0.0%) | 0 (0.0%) |
| 18 to 34 Years | 10 (4.5%) | 0 (0.0%) |
| 35 to 64 Years | 0 (0.0%) | 0 (0.0%) |
| 65 to 74 Years | 21 (51.2%) | 0 (0.0%) |
| 75 Years and over | 34 (100.0%) | 0 (0.0%) |
Disability Class: Vision Difficulty
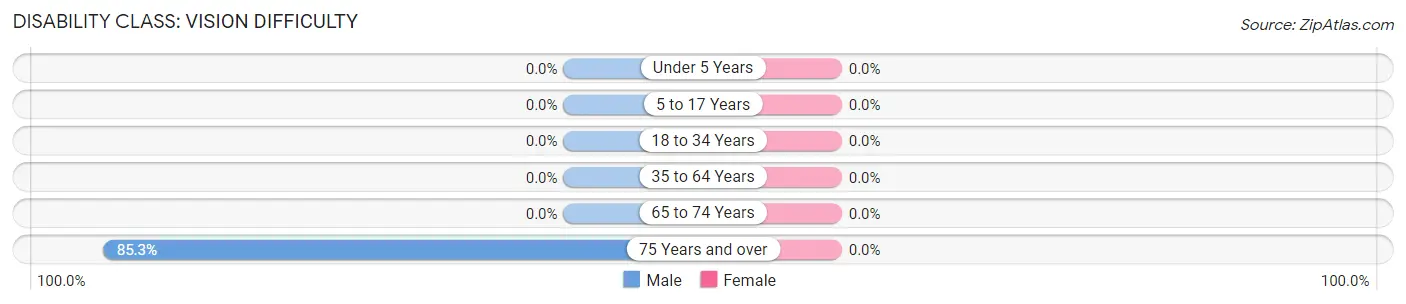
| Age Bracket | Male | Female |
| Under 5 Years | 0 (0.0%) | 0 (0.0%) |
| 5 to 17 Years | 0 (0.0%) | 0 (0.0%) |
| 18 to 34 Years | 0 (0.0%) | 0 (0.0%) |
| 35 to 64 Years | 0 (0.0%) | 0 (0.0%) |
| 65 to 74 Years | 0 (0.0%) | 0 (0.0%) |
| 75 Years and over | 29 (85.3%) | 0 (0.0%) |
Disability Class: Cognitive Difficulty
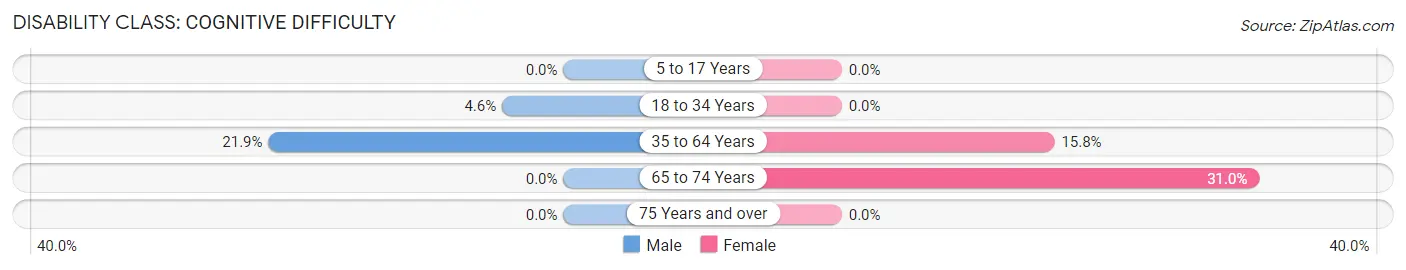
| Age Bracket | Male | Female |
| 5 to 17 Years | 0 (0.0%) | 0 (0.0%) |
| 18 to 34 Years | 10 (4.5%) | 0 (0.0%) |
| 35 to 64 Years | 30 (21.9%) | 21 (15.8%) |
| 65 to 74 Years | 0 (0.0%) | 22 (31.0%) |
| 75 Years and over | 0 (0.0%) | 0 (0.0%) |
Disability Class: Ambulatory Difficulty
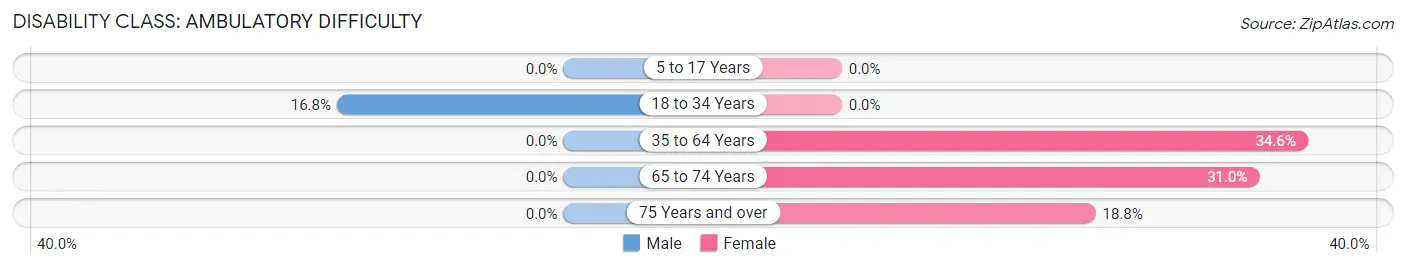
| Age Bracket | Male | Female |
| 5 to 17 Years | 0 (0.0%) | 0 (0.0%) |
| 18 to 34 Years | 37 (16.8%) | 0 (0.0%) |
| 35 to 64 Years | 0 (0.0%) | 46 (34.6%) |
| 65 to 74 Years | 0 (0.0%) | 22 (31.0%) |
| 75 Years and over | 0 (0.0%) | 13 (18.8%) |
Disability Class: Self-Care Difficulty
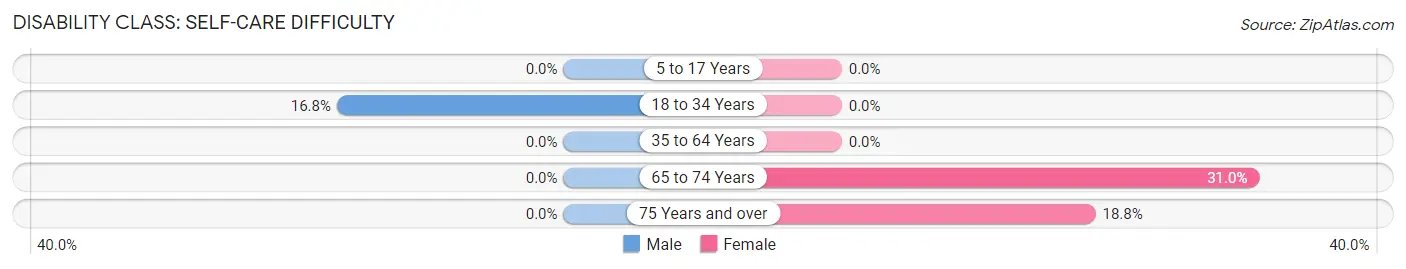
| Age Bracket | Male | Female |
| 5 to 17 Years | 0 (0.0%) | 0 (0.0%) |
| 18 to 34 Years | 37 (16.8%) | 0 (0.0%) |
| 35 to 64 Years | 0 (0.0%) | 0 (0.0%) |
| 65 to 74 Years | 0 (0.0%) | 22 (31.0%) |
| 75 Years and over | 0 (0.0%) | 13 (18.8%) |
Technology Access in Despard
Computing Device Access in Despard
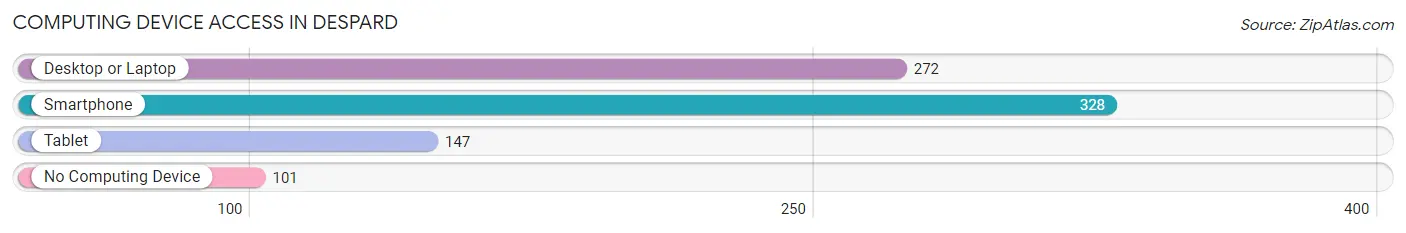
| Device Type | # Households | % Households |
| Desktop or Laptop | 272 | 58.5% |
| Smartphone | 328 | 70.5% |
| Tablet | 147 | 31.6% |
| No Computing Device | 101 | 21.7% |
| Total | 465 | 100.0% |
Internet Access in Despard
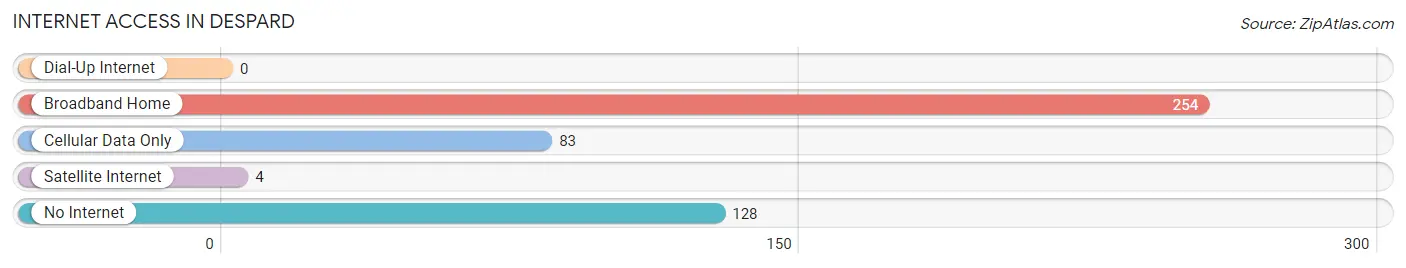
| Internet Type | # Households | % Households |
| Dial-Up Internet | 0 | 0.0% |
| Broadband Home | 254 | 54.6% |
| Cellular Data Only | 83 | 17.8% |
| Satellite Internet | 4 | 0.9% |
| No Internet | 128 | 27.5% |
| Total | 465 | 100.0% |
Despard Summary
Despard is a small unincorporated community located in the eastern part of Mason County, West Virginia. It is situated along the Ohio River, approximately five miles south of Point Pleasant. The community was established in the late 19th century and has a population of approximately 200 people.
History
Despard was founded in the late 19th century by a group of settlers from the nearby town of Point Pleasant. The town was named after the Despard family, who were among the first settlers in the area. The Despard family owned a large tract of land in the area and the town was built around their homestead.
The town was originally a farming community, but in the early 20th century, the economy shifted to coal mining. The coal industry provided jobs for many of the town's residents and helped to sustain the local economy.
In the 1950s, the town began to decline as the coal industry began to decline. Many of the town's residents moved away in search of better economic opportunities. By the late 20th century, the town had become a small, rural community.
Geography
Despard is located in the eastern part of Mason County, West Virginia. It is situated along the Ohio River, approximately five miles south of Point Pleasant. The town is located in a rural area and is surrounded by farmland and wooded areas.
The climate in Despard is humid and subtropical, with hot summers and mild winters. The average annual temperature is around 60 degrees Fahrenheit. The average annual precipitation is around 40 inches.
Economy
The economy of Despard is largely based on agriculture and tourism. The town is home to several small farms, which produce a variety of crops, including corn, soybeans, and hay. The town also has several small businesses, including a gas station, a convenience store, and a restaurant.
Tourism is an important part of the local economy. The town is located near several popular tourist attractions, including the Point Pleasant River Museum and the Tu-Endie-Wei State Park. The town also hosts several annual festivals, including the Despard Days Festival and the Despard Music Festival.
Demographics
As of the 2010 census, the population of Despard was approximately 200 people. The racial makeup of the town was 97.5% White, 0.5% African American, 0.5% Native American, and 1.5% from other races. The median household income was $30,000, and the median home value was $90,000.
The town is served by the Mason County School District. The town has one elementary school, one middle school, and one high school. The town also has a public library and a post office.
Conclusion
Despard is a small unincorporated community located in the eastern part of Mason County, West Virginia. It was founded in the late 19th century and has a population of approximately 200 people. The town is situated along the Ohio River and is surrounded by farmland and wooded areas. The economy of Despard is largely based on agriculture and tourism. The town is home to several small businesses and hosts several annual festivals. The population of Despard is predominantly White, with a small percentage of African American, Native American, and other races. The town is served by the Mason County School District and has a public library and a post office.
Common Questions
What is Per Capita Income in Despard?
Per Capita income in Despard is $18,092.
What is the Median Family Income in Despard?
Median Family Income in Despard is $65,023.
What is the Median Household income in Despard?
Median Household Income in Despard is $27,614.
What is Inequality or Gini Index in Despard?
Inequality or Gini Index in Despard is 0.37.
What is the Total Population of Despard?
Total Population of Despard is 983.
What is the Total Male Population of Despard?
Total Male Population of Despard is 525.
What is the Total Female Population of Despard?
Total Female Population of Despard is 458.
What is the Ratio of Males per 100 Females in Despard?
There are 114.63 Males per 100 Females in Despard.
What is the Ratio of Females per 100 Males in Despard?
There are 87.24 Females per 100 Males in Despard.
What is the Median Population Age in Despard?
Median Population Age in Despard is 33.9 Years.
What is the Average Family Size in Despard
Average Family Size in Despard is 2.9 People.
What is the Average Household Size in Despard
Average Household Size in Despard is 2.1 People.
How Large is the Labor Force in Despard?
There are 420 People in the Labor Forcein in Despard.
What is the Percentage of People in the Labor Force in Despard?
51.9% of People are in the Labor Force in Despard.
What is the Unemployment Rate in Despard?
Unemployment Rate in Despard is 26.4%.