West Hamlin, WV Map & Demographics
West Hamlin Map
West Hamlin Overview
$26,607
PER CAPITA INCOME
$63,750
AVG FAMILY INCOME
$36,354
AVG HOUSEHOLD INCOME
52.8%
WAGE / INCOME GAP [ % ]
47.2¢/ $1
WAGE / INCOME GAP [ $ ]
0.47
INEQUALITY / GINI INDEX
553
TOTAL POPULATION
248
MALE POPULATION
305
FEMALE POPULATION
81.31
MALES / 100 FEMALES
122.98
FEMALES / 100 MALES
58.1
MEDIAN AGE
3.1
AVG FAMILY SIZE
2.3
AVG HOUSEHOLD SIZE
180
LABOR FORCE [ PEOPLE ]
34.8%
PERCENT IN LABOR FORCE
5.6%
UNEMPLOYMENT RATE
West Hamlin Zip Codes
West Hamlin Area Codes
Income in West Hamlin
Income Overview in West Hamlin
Per Capita Income in West Hamlin is $26,607, while median incomes of families and households are $63,750 and $36,354 respectively.
| Characteristic | Number | Measure |
| Per Capita Income | 553 | $26,607 |
| Median Family Income | 125 | $63,750 |
| Mean Family Income | 125 | $69,558 |
| Median Household Income | 241 | $36,354 |
| Mean Household Income | 241 | $51,249 |
| Income Deficit | 125 | $0 |
| Wage / Income Gap (%) | 553 | 52.77% |
| Wage / Income Gap ($) | 553 | 47.23¢ per $1 |
| Gini / Inequality Index | 553 | 0.47 |
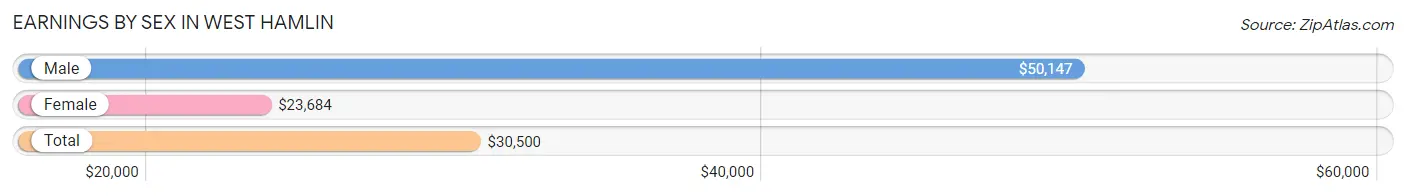
Earnings by Sex in West Hamlin
Average Earnings in West Hamlin are $30,500, $50,147 for men and $23,684 for women, a difference of 52.8%.
| Sex | Number | Average Earnings |
| Male | 102 (54.8%) | $50,147 |
| Female | 84 (45.2%) | $23,684 |
| Total | 186 (100.0%) | $30,500 |
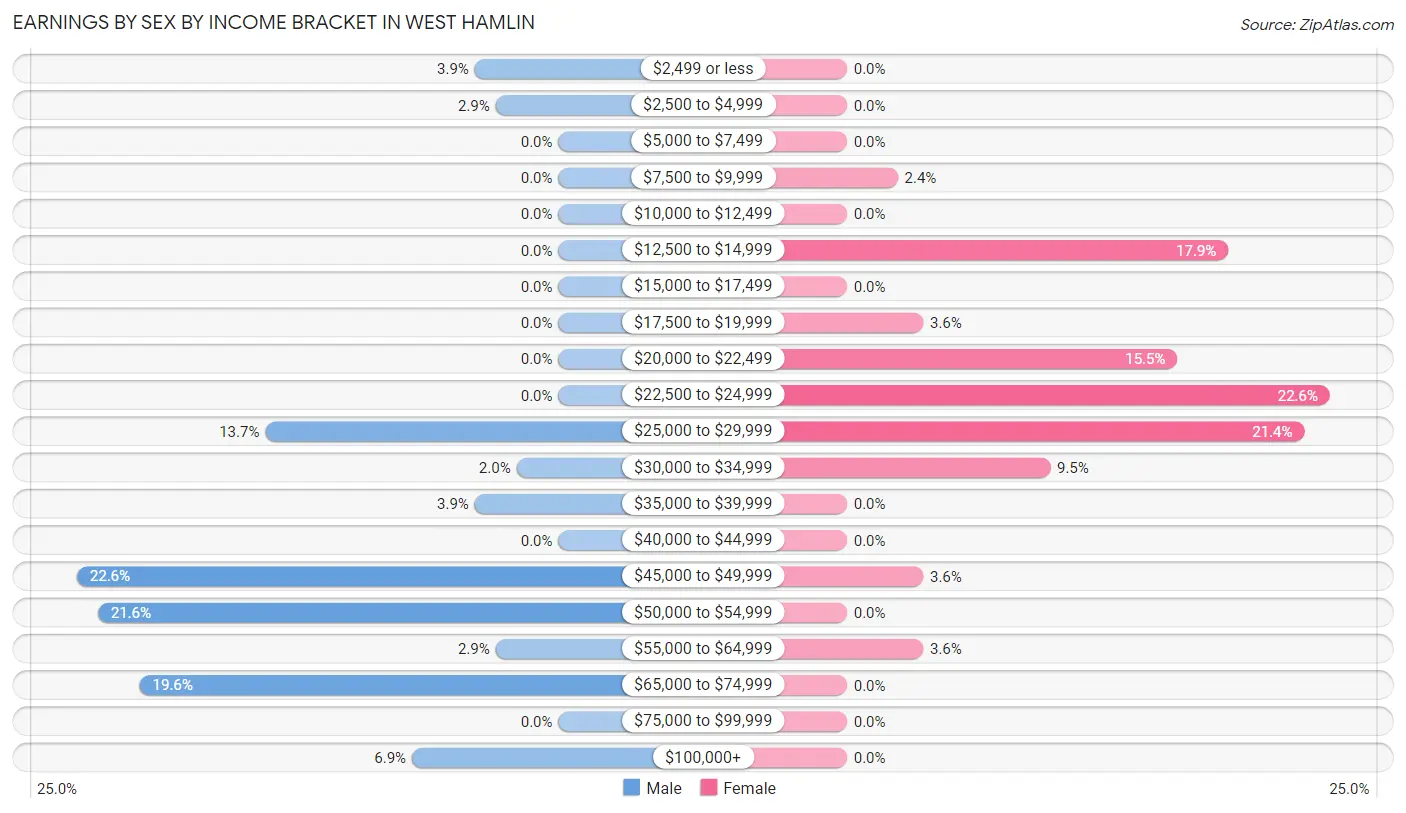
Earnings by Sex by Income Bracket in West Hamlin
The most common earnings brackets in West Hamlin are $45,000 to $49,999 for men (23 | 22.6%) and $22,500 to $24,999 for women (19 | 22.6%).
| Income | Male | Female |
| $2,499 or less | 4 (3.9%) | 0 (0.0%) |
| $2,500 to $4,999 | 3 (2.9%) | 0 (0.0%) |
| $5,000 to $7,499 | 0 (0.0%) | 0 (0.0%) |
| $7,500 to $9,999 | 0 (0.0%) | 2 (2.4%) |
| $10,000 to $12,499 | 0 (0.0%) | 0 (0.0%) |
| $12,500 to $14,999 | 0 (0.0%) | 15 (17.9%) |
| $15,000 to $17,499 | 0 (0.0%) | 0 (0.0%) |
| $17,500 to $19,999 | 0 (0.0%) | 3 (3.6%) |
| $20,000 to $22,499 | 0 (0.0%) | 13 (15.5%) |
| $22,500 to $24,999 | 0 (0.0%) | 19 (22.6%) |
| $25,000 to $29,999 | 14 (13.7%) | 18 (21.4%) |
| $30,000 to $34,999 | 2 (2.0%) | 8 (9.5%) |
| $35,000 to $39,999 | 4 (3.9%) | 0 (0.0%) |
| $40,000 to $44,999 | 0 (0.0%) | 0 (0.0%) |
| $45,000 to $49,999 | 23 (22.6%) | 3 (3.6%) |
| $50,000 to $54,999 | 22 (21.6%) | 0 (0.0%) |
| $55,000 to $64,999 | 3 (2.9%) | 3 (3.6%) |
| $65,000 to $74,999 | 20 (19.6%) | 0 (0.0%) |
| $75,000 to $99,999 | 0 (0.0%) | 0 (0.0%) |
| $100,000+ | 7 (6.9%) | 0 (0.0%) |
| Total | 102 (100.0%) | 84 (100.0%) |
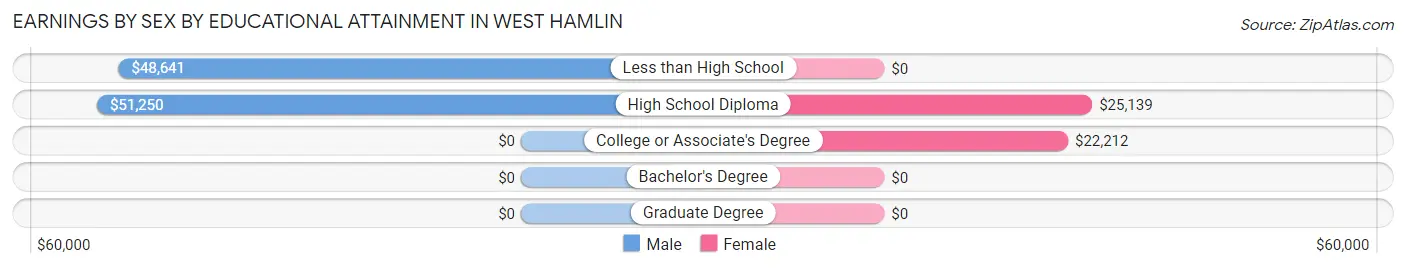
Earnings by Sex by Educational Attainment in West Hamlin
Average earnings in West Hamlin are $50,147 for men and $23,684 for women, a difference of 52.8%. Men with an educational attainment of high school diploma enjoy the highest average annual earnings of $51,250, while those with less than high school education earn the least with $48,641. Women with an educational attainment of high school diploma earn the most with the average annual earnings of $25,139, while those with college or associate's degree education have the smallest earnings of $22,212.
| Educational Attainment | Male Income | Female Income |
| Less than High School | $48,641 | $0 |
| High School Diploma | $51,250 | $25,139 |
| College or Associate's Degree | - | - |
| Bachelor's Degree | - | - |
| Graduate Degree | - | - |
| Total | $50,147 | $23,684 |
Family Income in West Hamlin
Family Income Brackets in West Hamlin
According to the West Hamlin family income data, there are 36 families falling into the $75,000 to $99,999 income range, which is the most common income bracket and makes up 28.8% of all families.
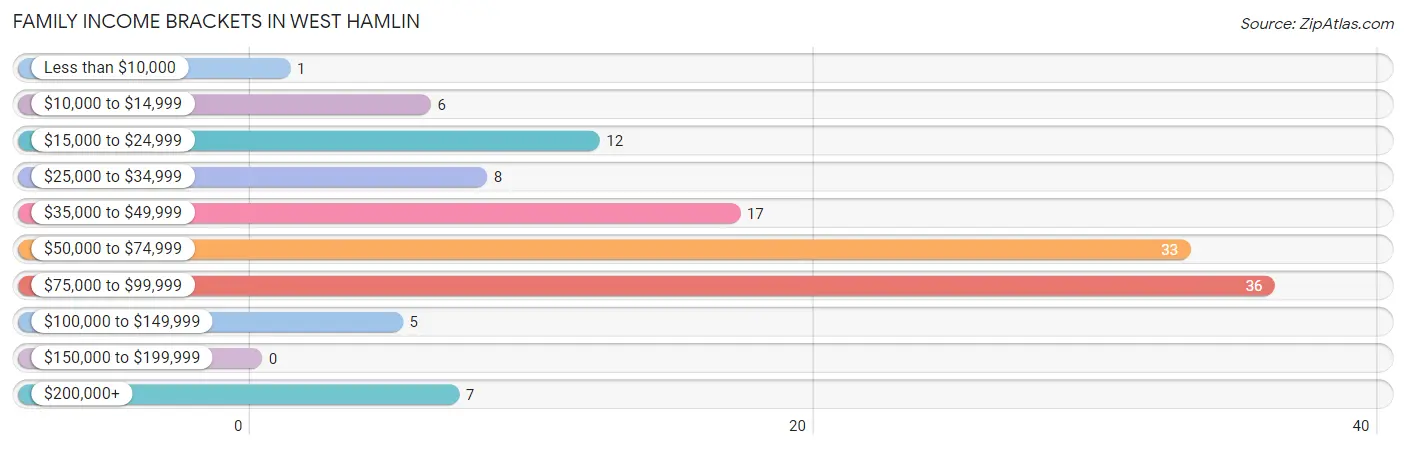
| Income Bracket | # Families | % Families |
| Less than $10,000 | 1 | 0.8% |
| $10,000 to $14,999 | 6 | 4.8% |
| $15,000 to $24,999 | 12 | 9.6% |
| $25,000 to $34,999 | 8 | 6.4% |
| $35,000 to $49,999 | 17 | 13.6% |
| $50,000 to $74,999 | 33 | 26.4% |
| $75,000 to $99,999 | 36 | 28.8% |
| $100,000 to $149,999 | 5 | 4.0% |
| $150,000 to $199,999 | 0 | 0.0% |
| $200,000+ | 7 | 5.6% |
Family Income by Famaliy Size in West Hamlin
2-person families (95 | 76.0%) account for the highest median family income in West Hamlin with $73,229 per family, while 2-person families (95 | 76.0%) have the highest median income of $36,614 per family member.
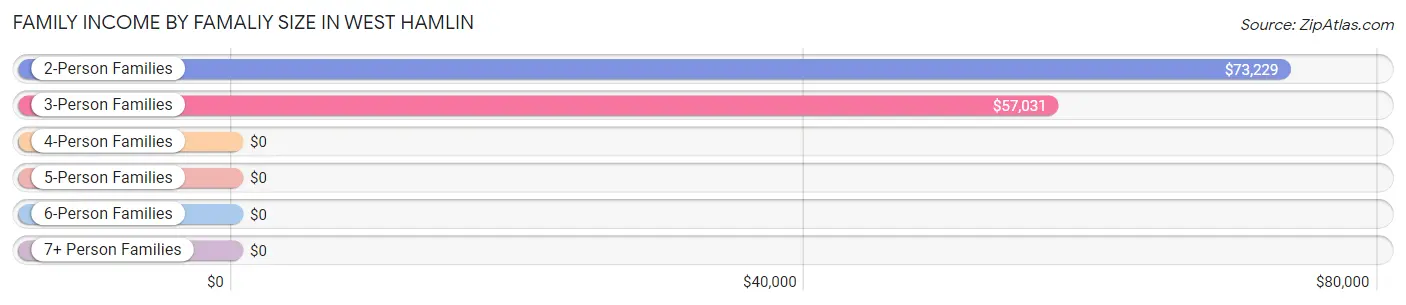
| Income Bracket | # Families | Median Income |
| 2-Person Families | 95 (76.0%) | $73,229 |
| 3-Person Families | 17 (13.6%) | $57,031 |
| 4-Person Families | 4 (3.2%) | $0 |
| 5-Person Families | 9 (7.2%) | $0 |
| 6-Person Families | 0 (0.0%) | $0 |
| 7+ Person Families | 0 (0.0%) | $0 |
| Total | 125 (100.0%) | $63,750 |
Family Income by Number of Earners in West Hamlin
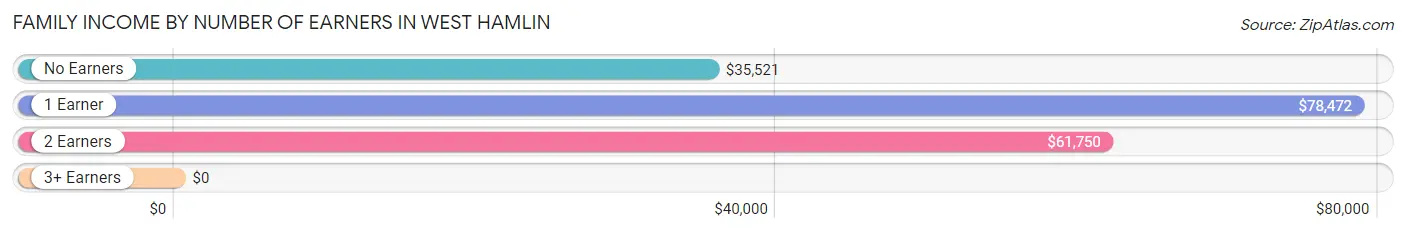
| Number of Earners | # Families | Median Income |
| No Earners | 37 (29.6%) | $35,521 |
| 1 Earner | 77 (61.6%) | $78,472 |
| 2 Earners | 11 (8.8%) | $61,750 |
| 3+ Earners | 0 (0.0%) | $0 |
| Total | 125 (100.0%) | $63,750 |
Household Income in West Hamlin
Household Income Brackets in West Hamlin
With 52 households falling in the category, the $15,000 to $24,999 income range is the most frequent in West Hamlin, accounting for 21.6% of all households.
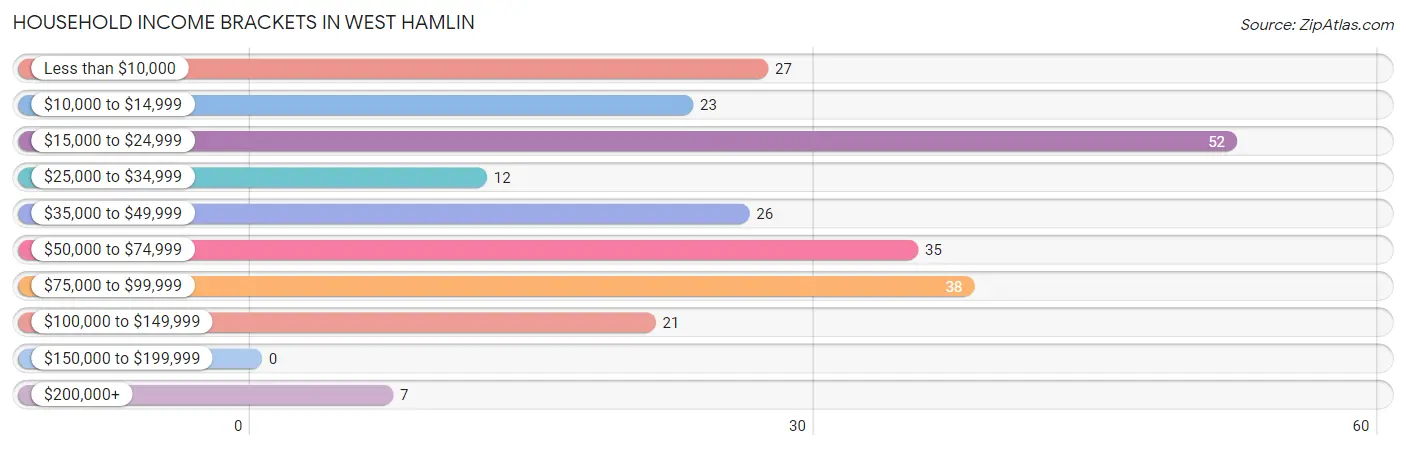
| Income Bracket | # Households | % Households |
| Less than $10,000 | 27 | 11.2% |
| $10,000 to $14,999 | 23 | 9.5% |
| $15,000 to $24,999 | 52 | 21.6% |
| $25,000 to $34,999 | 12 | 5.0% |
| $35,000 to $49,999 | 26 | 10.8% |
| $50,000 to $74,999 | 35 | 14.5% |
| $75,000 to $99,999 | 38 | 15.8% |
| $100,000 to $149,999 | 21 | 8.7% |
| $150,000 to $199,999 | 0 | 0.0% |
| $200,000+ | 7 | 2.9% |
Household Income by Householder Age in West Hamlin
The median household income in West Hamlin is $36,354, with the highest median household income of $62,250 found in the 25 to 44 years age bracket for the primary householder. A total of 25 households (10.4%) fall into this category.
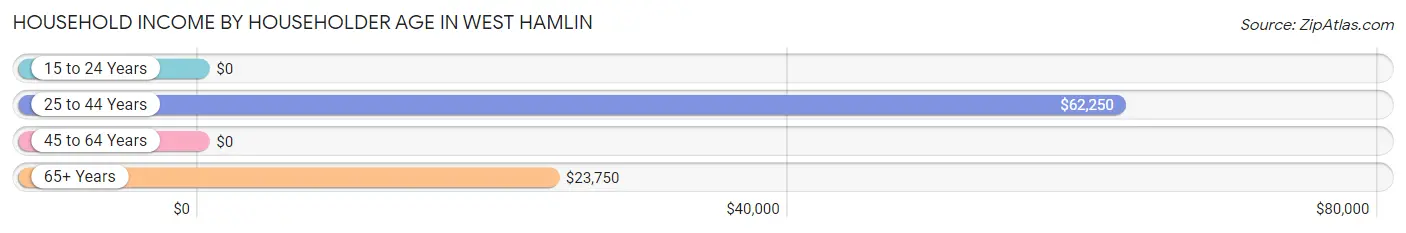
| Income Bracket | # Households | Median Income |
| 15 to 24 Years | 0 (0.0%) | $0 |
| 25 to 44 Years | 25 (10.4%) | $62,250 |
| 45 to 64 Years | 57 (23.6%) | $0 |
| 65+ Years | 159 (66.0%) | $23,750 |
| Total | 241 (100.0%) | $36,354 |
Poverty in West Hamlin
Income Below Poverty by Sex and Age in West Hamlin
With 18.1% poverty level for males and 16.7% for females among the residents of West Hamlin, 35 to 44 year old males and under 5 year old females are the most vulnerable to poverty, with 5 males (71.4%) and 3 females (50.0%) in their respective age groups living below the poverty level.
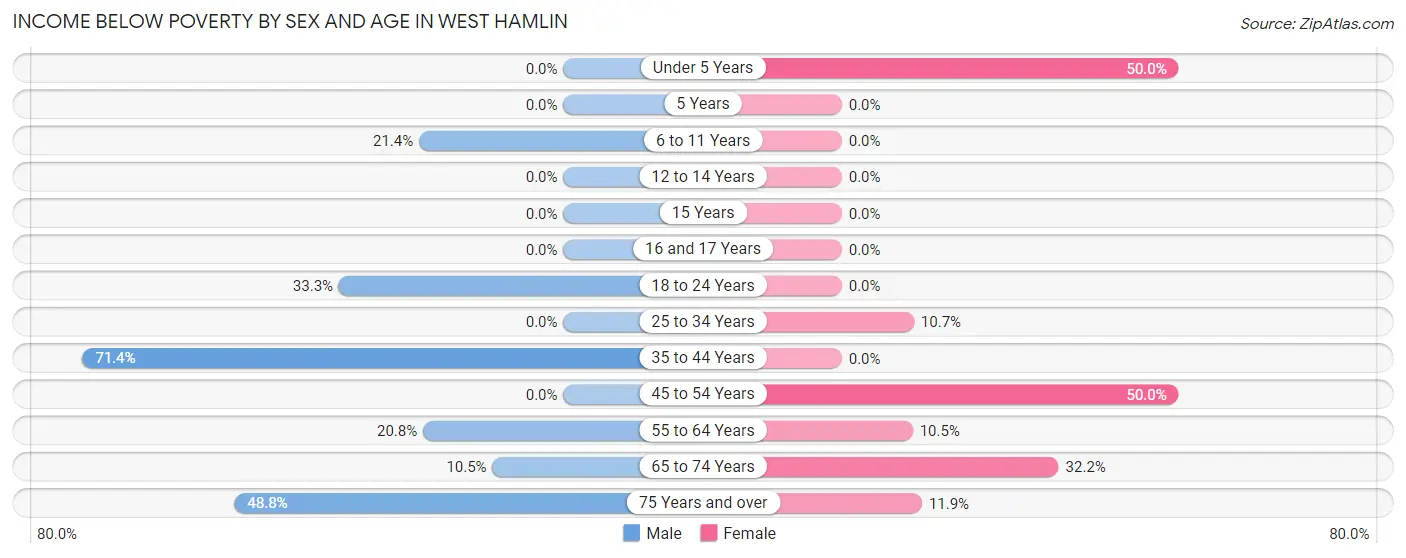
| Age Bracket | Male | Female |
| Under 5 Years | 0 (0.0%) | 3 (50.0%) |
| 5 Years | 0 (0.0%) | 0 (0.0%) |
| 6 to 11 Years | 3 (21.4%) | 0 (0.0%) |
| 12 to 14 Years | 0 (0.0%) | 0 (0.0%) |
| 15 Years | 0 (0.0%) | 0 (0.0%) |
| 16 and 17 Years | 0 (0.0%) | 0 (0.0%) |
| 18 to 24 Years | 5 (33.3%) | 0 (0.0%) |
| 25 to 34 Years | 0 (0.0%) | 3 (10.7%) |
| 35 to 44 Years | 5 (71.4%) | 0 (0.0%) |
| 45 to 54 Years | 0 (0.0%) | 13 (50.0%) |
| 55 to 64 Years | 5 (20.8%) | 8 (10.5%) |
| 65 to 74 Years | 6 (10.5%) | 19 (32.2%) |
| 75 Years and over | 21 (48.8%) | 5 (11.9%) |
| Total | 45 (18.1%) | 51 (16.7%) |
Income Above Poverty by Sex and Age in West Hamlin
According to the poverty statistics in West Hamlin, males aged 25 to 34 years and females aged 6 to 11 years are the age groups that are most secure financially, with 100.0% of males and 100.0% of females in these age groups living above the poverty line.
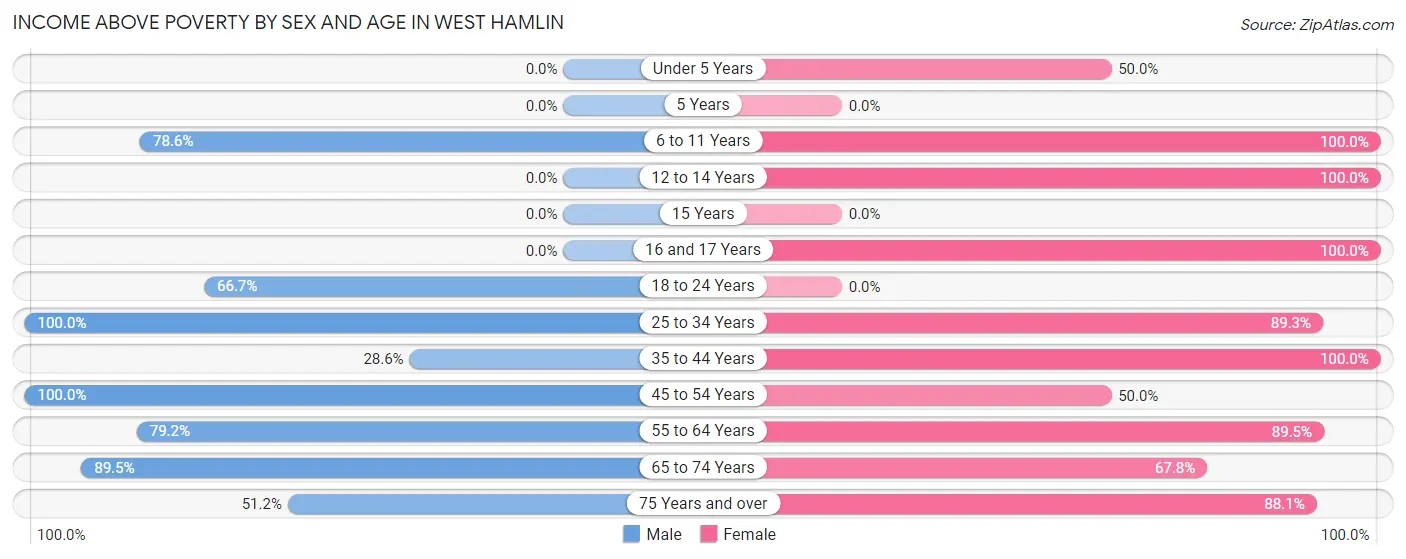
| Age Bracket | Male | Female |
| Under 5 Years | 0 (0.0%) | 3 (50.0%) |
| 5 Years | 0 (0.0%) | 0 (0.0%) |
| 6 to 11 Years | 11 (78.6%) | 10 (100.0%) |
| 12 to 14 Years | 0 (0.0%) | 6 (100.0%) |
| 15 Years | 0 (0.0%) | 0 (0.0%) |
| 16 and 17 Years | 0 (0.0%) | 2 (100.0%) |
| 18 to 24 Years | 10 (66.7%) | 0 (0.0%) |
| 25 to 34 Years | 21 (100.0%) | 25 (89.3%) |
| 35 to 44 Years | 2 (28.6%) | 50 (100.0%) |
| 45 to 54 Years | 67 (100.0%) | 13 (50.0%) |
| 55 to 64 Years | 19 (79.2%) | 68 (89.5%) |
| 65 to 74 Years | 51 (89.5%) | 40 (67.8%) |
| 75 Years and over | 22 (51.2%) | 37 (88.1%) |
| Total | 203 (81.9%) | 254 (83.3%) |
Income Below Poverty Among Married-Couple Families in West Hamlin
The poverty statistics for married-couple families in West Hamlin show that 9.1% or 9 of the total 99 families live below the poverty line. Families with 1 or 2 children have the highest poverty rate of 14.3%, comprising of 3 families. On the other hand, families with no children have the lowest poverty rate of 7.7%, which includes 6 families.
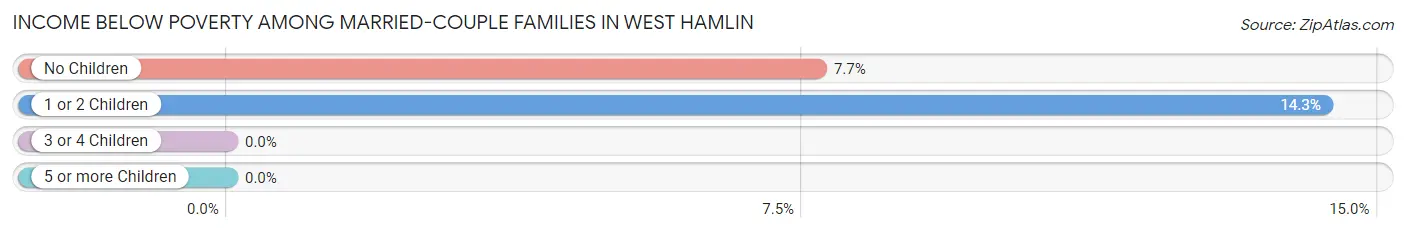
| Children | Above Poverty | Below Poverty |
| No Children | 72 (92.3%) | 6 (7.7%) |
| 1 or 2 Children | 18 (85.7%) | 3 (14.3%) |
| 3 or 4 Children | 0 (0.0%) | 0 (0.0%) |
| 5 or more Children | 0 (0.0%) | 0 (0.0%) |
| Total | 90 (90.9%) | 9 (9.1%) |
Income Below Poverty Among Single-Parent Households in West Hamlin
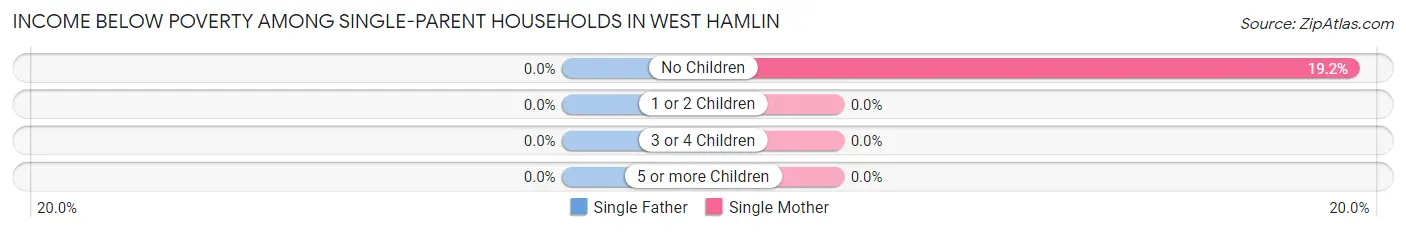
| Children | Single Father | Single Mother |
| No Children | 0 (0.0%) | 5 (19.2%) |
| 1 or 2 Children | 0 (0.0%) | 0 (0.0%) |
| 3 or 4 Children | 0 (0.0%) | 0 (0.0%) |
| 5 or more Children | 0 (0.0%) | 0 (0.0%) |
| Total | 0 (0.0%) | 5 (19.2%) |
Income Below Poverty Among Married-Couple vs Single-Parent Households in West Hamlin
The poverty data for West Hamlin shows that 9 of the married-couple family households (9.1%) and 5 of the single-parent households (19.2%) are living below the poverty level. Within the married-couple family households, those with 1 or 2 children have the highest poverty rate, with 3 households (14.3%) falling below the poverty line. Among the single-parent households, those with no children have the highest poverty rate, with 5 household (19.2%) living below poverty.
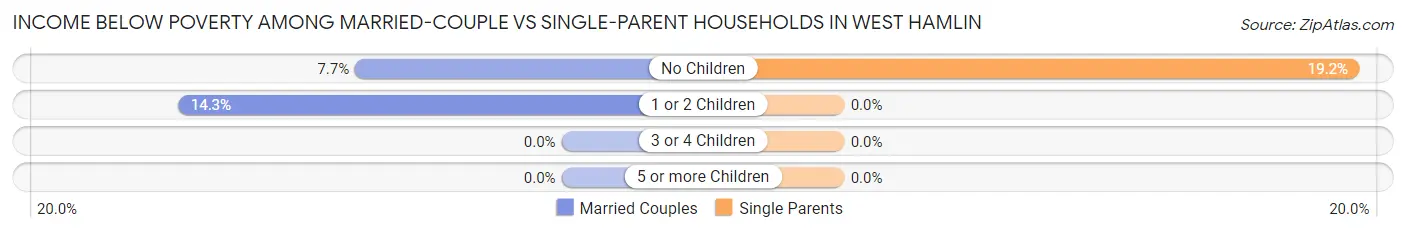
| Children | Married-Couple Families | Single-Parent Households |
| No Children | 6 (7.7%) | 5 (19.2%) |
| 1 or 2 Children | 3 (14.3%) | 0 (0.0%) |
| 3 or 4 Children | 0 (0.0%) | 0 (0.0%) |
| 5 or more Children | 0 (0.0%) | 0 (0.0%) |
| Total | 9 (9.1%) | 5 (19.2%) |
Race in West Hamlin
The most populous races in West Hamlin are White / Caucasian (541 | 97.8%), Two or more Races (12 | 2.2%), and Hispanic or Latino (7 | 1.3%).
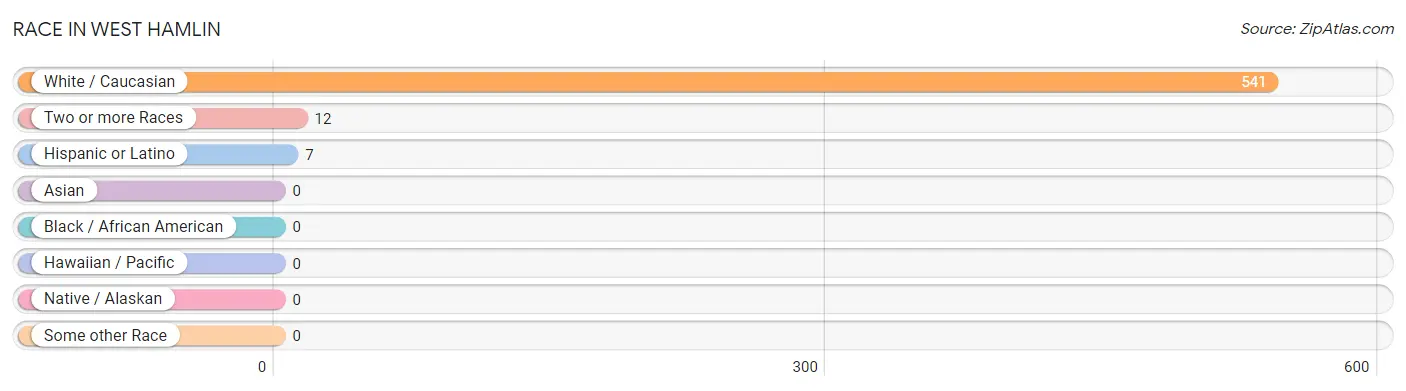
| Race | # Population | % Population |
| Asian | 0 | 0.0% |
| Black / African American | 0 | 0.0% |
| Hawaiian / Pacific | 0 | 0.0% |
| Hispanic or Latino | 7 | 1.3% |
| Native / Alaskan | 0 | 0.0% |
| White / Caucasian | 541 | 97.8% |
| Two or more Races | 12 | 2.2% |
| Some other Race | 0 | 0.0% |
| Total | 553 | 100.0% |
Ancestry in West Hamlin
The most populous ancestries reported in West Hamlin are Irish (56 | 10.1%), American (50 | 9.0%), English (49 | 8.9%), German (40 | 7.2%), and Polish (7 | 1.3%), together accounting for 36.5% of all West Hamlin residents.
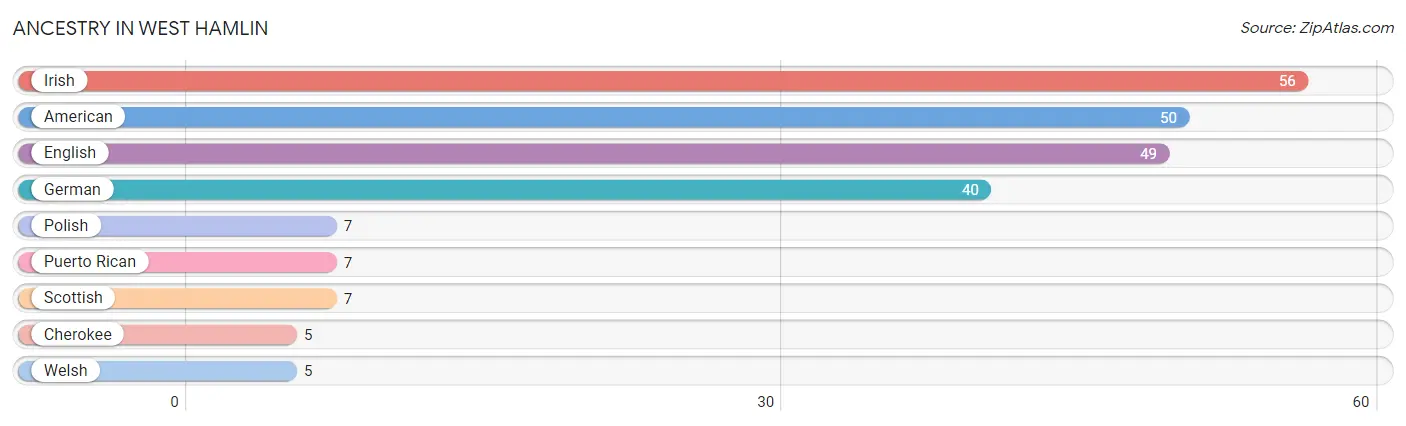
| Ancestry | # Population | % Population |
| American | 50 | 9.0% |
| Cherokee | 5 | 0.9% |
| English | 49 | 8.9% |
| German | 40 | 7.2% |
| Irish | 56 | 10.1% |
| Polish | 7 | 1.3% |
| Puerto Rican | 7 | 1.3% |
| Scottish | 7 | 1.3% |
| Welsh | 5 | 0.9% | View All 9 Rows |
Immigrants in West Hamlin
The most numerous immigrant groups reported in West Hamlin came from Europe (5 | 0.9%), and Northern Europe (5 | 0.9%), together accounting for 1.8% of all West Hamlin residents.
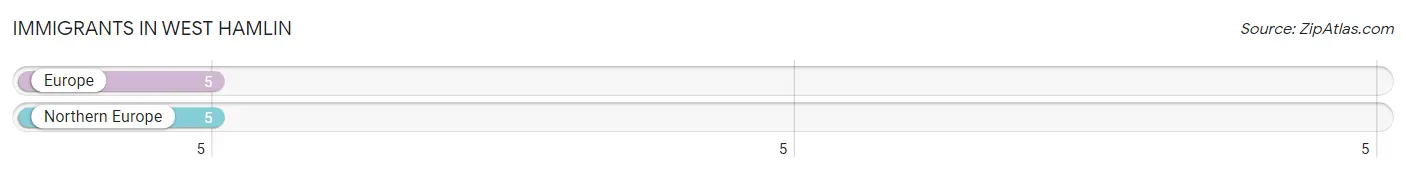
| Immigration Origin | # Population | % Population |
| Europe | 5 | 0.9% |
| Northern Europe | 5 | 0.9% | View All 2 Rows |
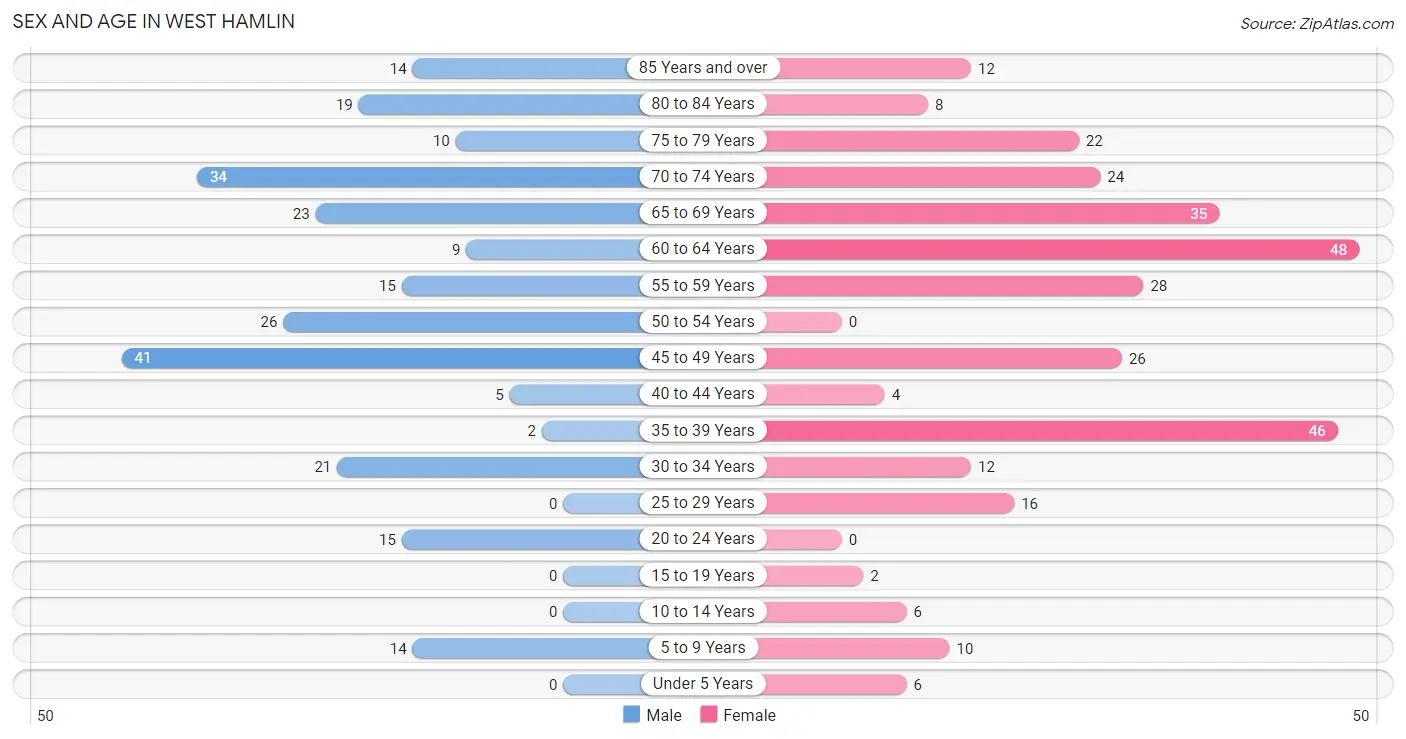
Sex and Age in West Hamlin
Sex and Age in West Hamlin
The most populous age groups in West Hamlin are 45 to 49 Years (41 | 16.5%) for men and 60 to 64 Years (48 | 15.7%) for women.
| Age Bracket | Male | Female |
| Under 5 Years | 0 (0.0%) | 6 (2.0%) |
| 5 to 9 Years | 14 (5.7%) | 10 (3.3%) |
| 10 to 14 Years | 0 (0.0%) | 6 (2.0%) |
| 15 to 19 Years | 0 (0.0%) | 2 (0.7%) |
| 20 to 24 Years | 15 (6.0%) | 0 (0.0%) |
| 25 to 29 Years | 0 (0.0%) | 16 (5.2%) |
| 30 to 34 Years | 21 (8.5%) | 12 (3.9%) |
| 35 to 39 Years | 2 (0.8%) | 46 (15.1%) |
| 40 to 44 Years | 5 (2.0%) | 4 (1.3%) |
| 45 to 49 Years | 41 (16.5%) | 26 (8.5%) |
| 50 to 54 Years | 26 (10.5%) | 0 (0.0%) |
| 55 to 59 Years | 15 (6.0%) | 28 (9.2%) |
| 60 to 64 Years | 9 (3.6%) | 48 (15.7%) |
| 65 to 69 Years | 23 (9.3%) | 35 (11.5%) |
| 70 to 74 Years | 34 (13.7%) | 24 (7.9%) |
| 75 to 79 Years | 10 (4.0%) | 22 (7.2%) |
| 80 to 84 Years | 19 (7.7%) | 8 (2.6%) |
| 85 Years and over | 14 (5.7%) | 12 (3.9%) |
| Total | 248 (100.0%) | 305 (100.0%) |
Families and Households in West Hamlin
Median Family Size in West Hamlin
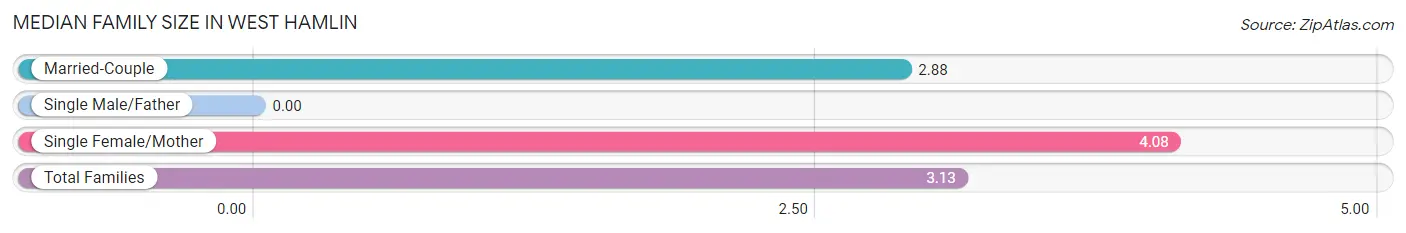
| Family Type | # Families | Family Size |
| Married-Couple | 99 (79.2%) | 2.88 |
| Single Male/Father | 0 (0.0%) | - |
| Single Female/Mother | 26 (20.8%) | 4.08 |
| Total Families | 125 (100.0%) | 3.13 |
Median Household Size in West Hamlin
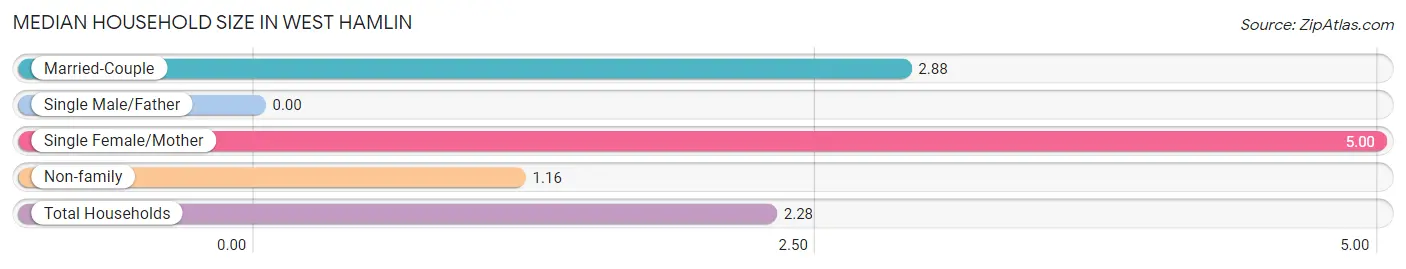
| Household Type | # Households | Household Size |
| Married-Couple | 99 (41.1%) | 2.88 |
| Single Male/Father | 0 (0.0%) | - |
| Single Female/Mother | 26 (10.8%) | 5.00 |
| Non-family | 116 (48.1%) | 1.16 |
| Total Households | 241 (100.0%) | 2.28 |
Household Size by Marriage Status in West Hamlin
Out of a total of 241 households in West Hamlin, 125 (51.9%) are family households, while 116 (48.1%) are nonfamily households. The most numerous type of family households are 2-person households, comprising 87, and the most common type of nonfamily households are 1-person households, comprising 112.
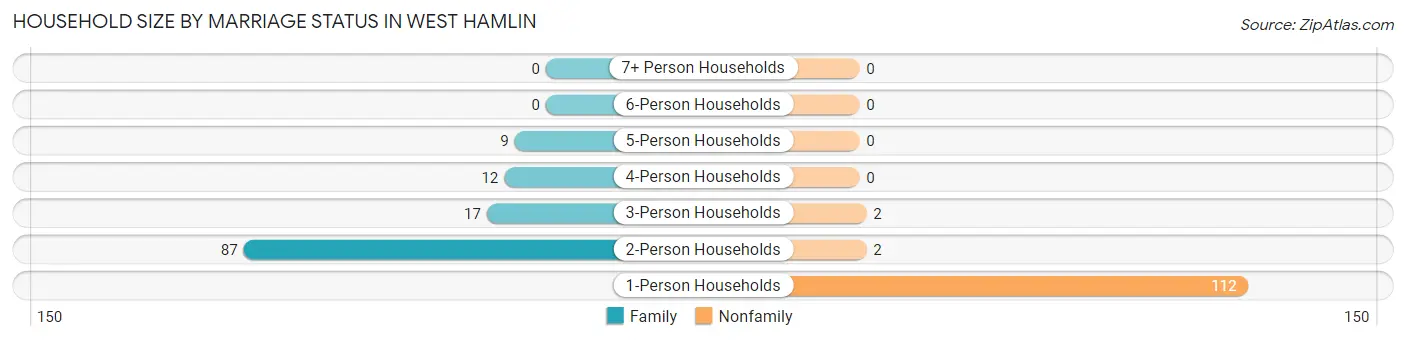
| Household Size | Family Households | Nonfamily Households |
| 1-Person Households | - | 112 (46.5%) |
| 2-Person Households | 87 (36.1%) | 2 (0.8%) |
| 3-Person Households | 17 (7.0%) | 2 (0.8%) |
| 4-Person Households | 12 (5.0%) | 0 (0.0%) |
| 5-Person Households | 9 (3.7%) | 0 (0.0%) |
| 6-Person Households | 0 (0.0%) | 0 (0.0%) |
| 7+ Person Households | 0 (0.0%) | 0 (0.0%) |
| Total | 125 (51.9%) | 116 (48.1%) |
Female Fertility in West Hamlin
Fertility by Age in West Hamlin
| Age Bracket | Women with Births | Births / 1,000 Women |
| 15 to 19 years | 0 (0.0%) | 0.0 |
| 20 to 34 years | 0 (0.0%) | 0.0 |
| 35 to 50 years | 0 (0.0%) | 0.0 |
| Total | 0 (0.0%) | 0.0 |
Fertility by Age by Marriage Status in West Hamlin
| Age Bracket | Married | Unmarried |
| 15 to 19 years | 0 (0.0%) | 0 (0.0%) |
| 20 to 34 years | 0 (0.0%) | 0 (0.0%) |
| 35 to 50 years | 0 (0.0%) | 0 (0.0%) |
| Total | 0 (0.0%) | 0 (0.0%) |
Fertility by Education in West Hamlin
| Educational Attainment | Women with Births | Births / 1,000 Women |
| Less than High School | 0 (0.0%) | 0.0 |
| High School Diploma | 0 (0.0%) | 0.0 |
| College or Associate's Degree | 0 (0.0%) | 0.0 |
| Bachelor's Degree | 0 (0.0%) | 0.0 |
| Graduate Degree | 0 (0.0%) | 0.0 |
| Total | 0 (0.0%) | 0.0 |
Fertility by Education by Marriage Status in West Hamlin
| Educational Attainment | Married | Unmarried |
| Less than High School | 0 (0.0%) | 0 (0.0%) |
| High School Diploma | 0 (0.0%) | 0 (0.0%) |
| College or Associate's Degree | 0 (0.0%) | 0 (0.0%) |
| Bachelor's Degree | 0 (0.0%) | 0 (0.0%) |
| Graduate Degree | 0 (0.0%) | 0 (0.0%) |
| Total | 0 (0.0%) | 0 (0.0%) |
Employment Characteristics in West Hamlin
Employment by Class of Employer in West Hamlin
Among the 167 employed individuals in West Hamlin, private company employees (107 | 64.1%), state government employees (36 | 21.6%), and local government employees (9 | 5.4%) make up the most common classes of employment.
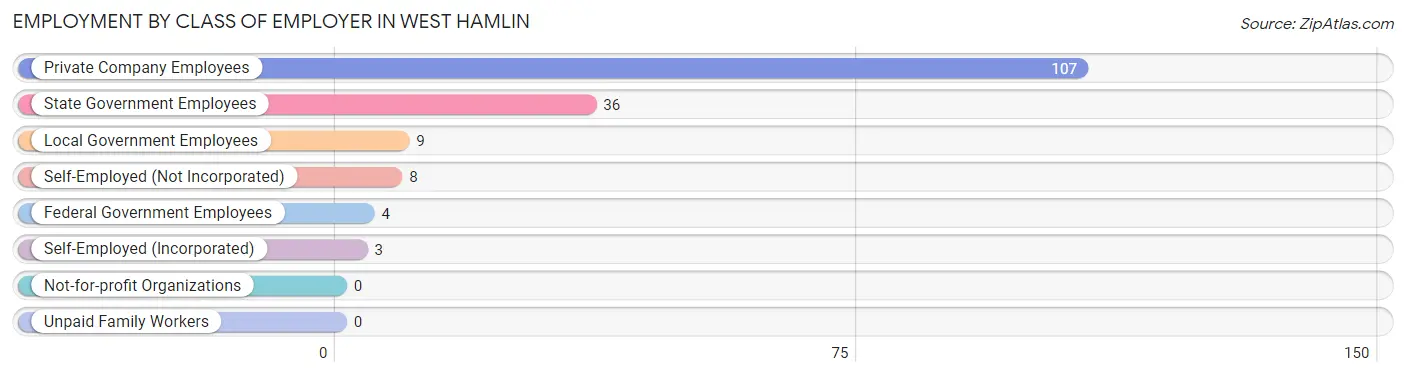
| Employer Class | # Employees | % Employees |
| Private Company Employees | 107 | 64.1% |
| Self-Employed (Incorporated) | 3 | 1.8% |
| Self-Employed (Not Incorporated) | 8 | 4.8% |
| Not-for-profit Organizations | 0 | 0.0% |
| Local Government Employees | 9 | 5.4% |
| State Government Employees | 36 | 21.6% |
| Federal Government Employees | 4 | 2.4% |
| Unpaid Family Workers | 0 | 0.0% |
| Total | 167 | 100.0% |
Employment Status by Age in West Hamlin
According to the labor force statistics for West Hamlin, out of the total population over 16 years of age (517), 34.8% or 180 individuals are in the labor force, with 5.6% or 10 of them unemployed. The age group with the highest labor force participation rate is 25 to 29 years, with 100.0% or 16 individuals in the labor force. Within the labor force, the 20 to 24 years age range has the highest percentage of unemployed individuals, with 100.0% or 5 of them being unemployed.
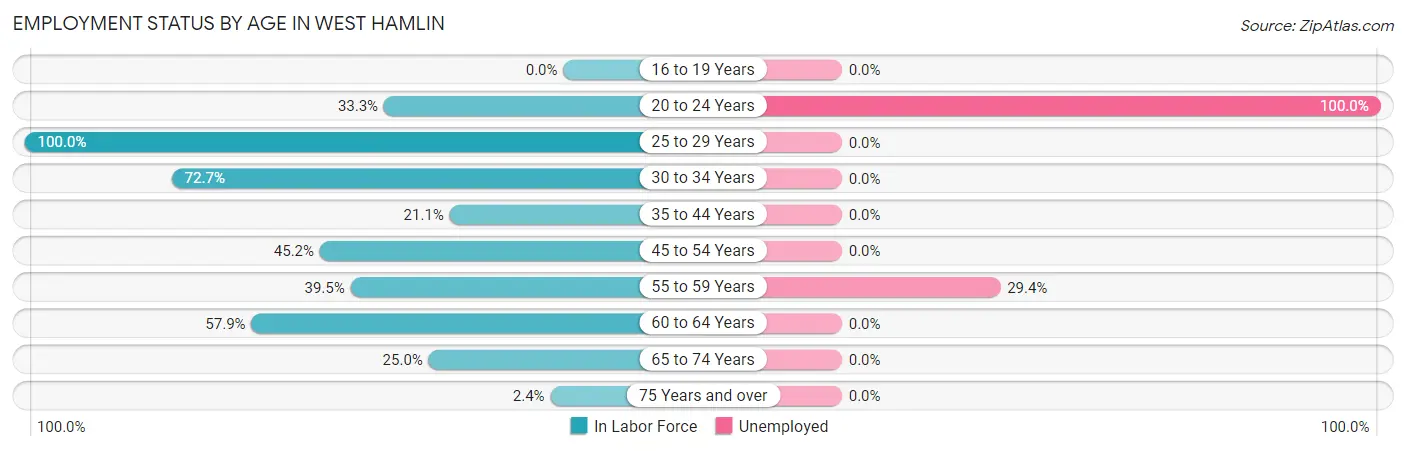
| Age Bracket | In Labor Force | Unemployed |
| 16 to 19 Years | 0 (0.0%) | 0 (0.0%) |
| 20 to 24 Years | 5 (33.3%) | 5 (100.0%) |
| 25 to 29 Years | 16 (100.0%) | 0 (0.0%) |
| 30 to 34 Years | 24 (72.7%) | 0 (0.0%) |
| 35 to 44 Years | 12 (21.1%) | 0 (0.0%) |
| 45 to 54 Years | 42 (45.2%) | 0 (0.0%) |
| 55 to 59 Years | 17 (39.5%) | 5 (29.4%) |
| 60 to 64 Years | 33 (57.9%) | 0 (0.0%) |
| 65 to 74 Years | 29 (25.0%) | 0 (0.0%) |
| 75 Years and over | 2 (2.4%) | 0 (0.0%) |
| Total | 180 (34.8%) | 10 (5.6%) |
Employment Status by Educational Attainment in West Hamlin
According to labor force statistics for West Hamlin, 48.2% of individuals (144) out of the total population between 25 and 64 years of age (299) are in the labor force, with 3.5% or 5 of them being unemployed. The group with the highest labor force participation rate are those with the educational attainment of less than high school, with 60.9% or 28 individuals in the labor force. Within the labor force, individuals with high school diploma education have the highest percentage of unemployment, with 5.8% or 5 of them being unemployed.
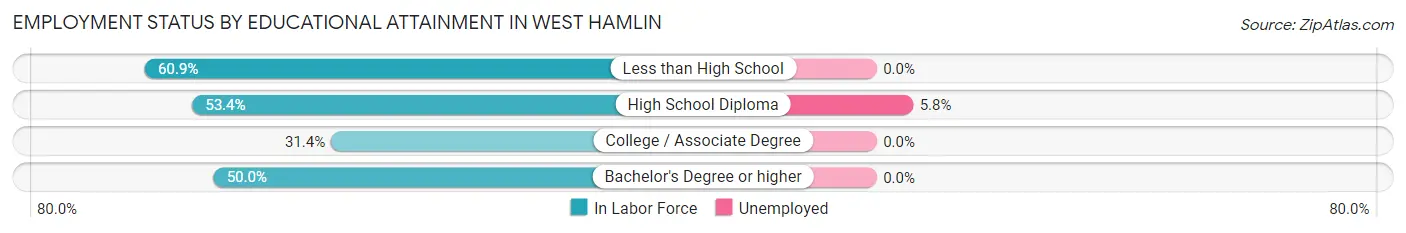
| Educational Attainment | In Labor Force | Unemployed |
| Less than High School | 28 (60.9%) | 0 (0.0%) |
| High School Diploma | 86 (53.4%) | 9 (5.8%) |
| College / Associate Degree | 27 (31.4%) | 0 (0.0%) |
| Bachelor's Degree or higher | 3 (50.0%) | 0 (0.0%) |
| Total | 144 (48.2%) | 10 (3.5%) |
Employment Occupations by Sex in West Hamlin
Management, Business, Science and Arts Occupations
The most common Management, Business, Science and Arts occupations in West Hamlin are Management (15 | 8.8%), Community & Social Service (5 | 2.9%), Education Instruction & Library (5 | 2.9%), Health Diagnosing & Treating (3 | 1.8%), and Health Technologists (3 | 1.8%).
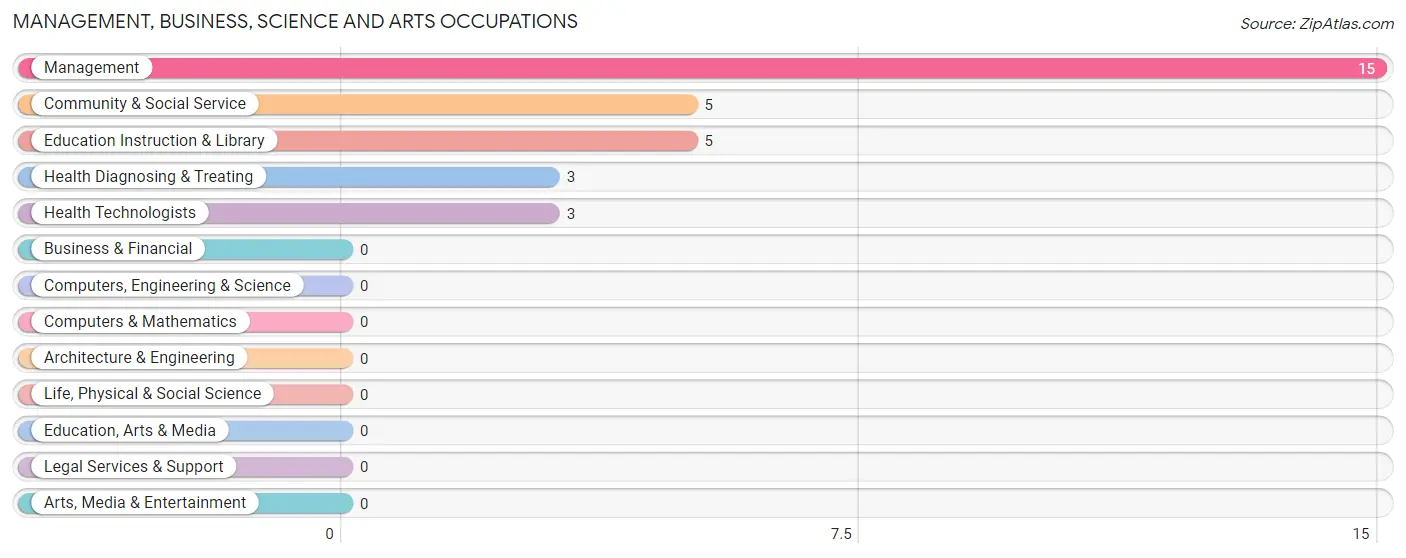
Management, Business, Science and Arts Occupations by Sex
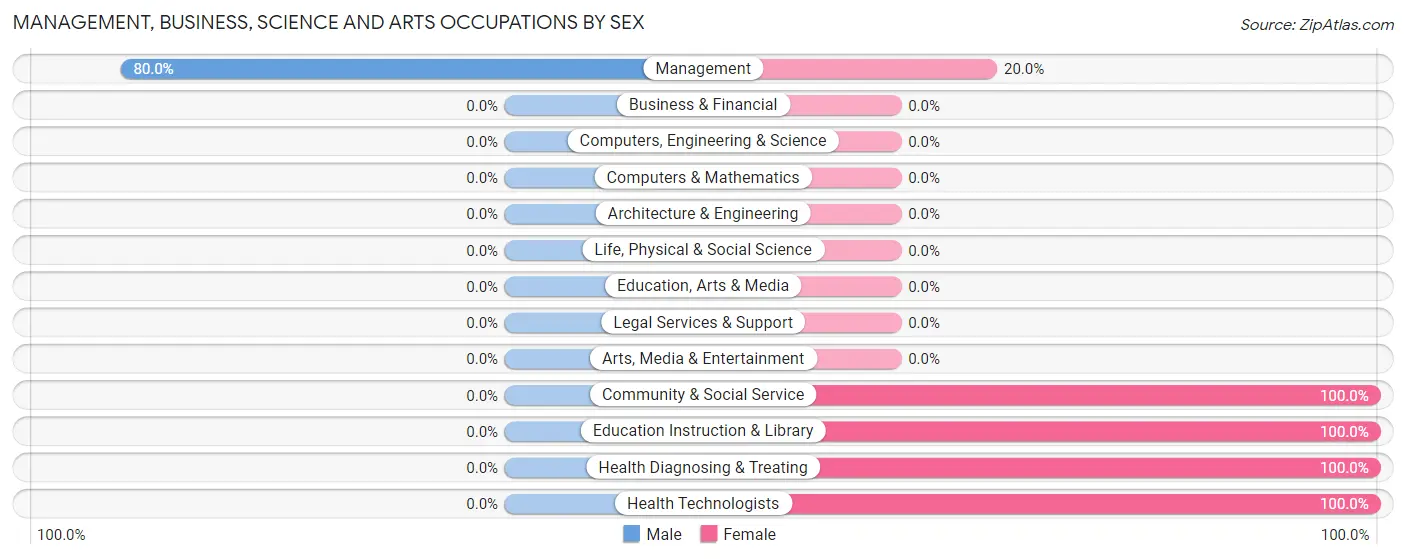
| Occupation | Male | Female |
| Management | 12 (80.0%) | 3 (20.0%) |
| Business & Financial | 0 (0.0%) | 0 (0.0%) |
| Computers, Engineering & Science | 0 (0.0%) | 0 (0.0%) |
| Computers & Mathematics | 0 (0.0%) | 0 (0.0%) |
| Architecture & Engineering | 0 (0.0%) | 0 (0.0%) |
| Life, Physical & Social Science | 0 (0.0%) | 0 (0.0%) |
| Community & Social Service | 0 (0.0%) | 5 (100.0%) |
| Education, Arts & Media | 0 (0.0%) | 0 (0.0%) |
| Legal Services & Support | 0 (0.0%) | 0 (0.0%) |
| Education Instruction & Library | 0 (0.0%) | 5 (100.0%) |
| Arts, Media & Entertainment | 0 (0.0%) | 0 (0.0%) |
| Health Diagnosing & Treating | 0 (0.0%) | 3 (100.0%) |
| Health Technologists | 0 (0.0%) | 3 (100.0%) |
| Total (Category) | 12 (52.2%) | 11 (47.8%) |
| Total (Overall) | 91 (53.5%) | 79 (46.5%) |
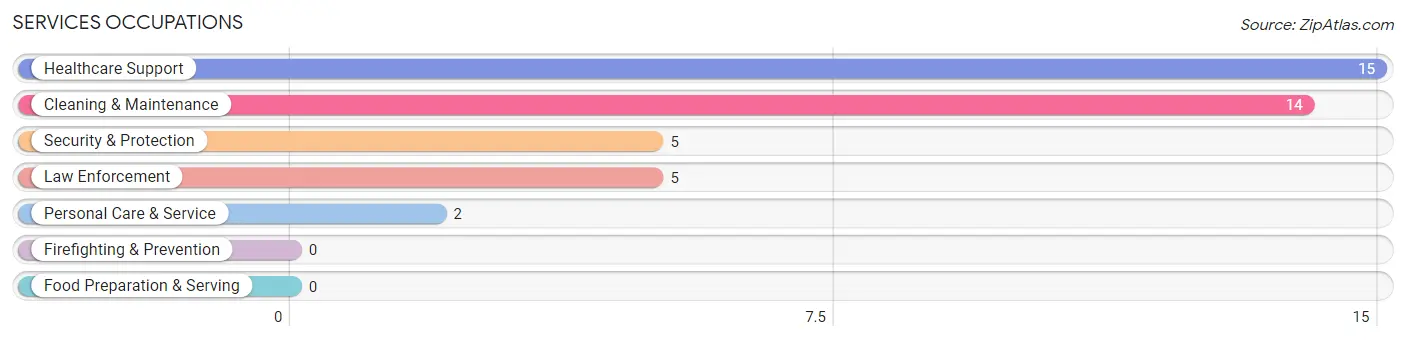
Services Occupations
The most common Services occupations in West Hamlin are Healthcare Support (15 | 8.8%), Cleaning & Maintenance (14 | 8.2%), Security & Protection (5 | 2.9%), Law Enforcement (5 | 2.9%), and Personal Care & Service (2 | 1.2%).
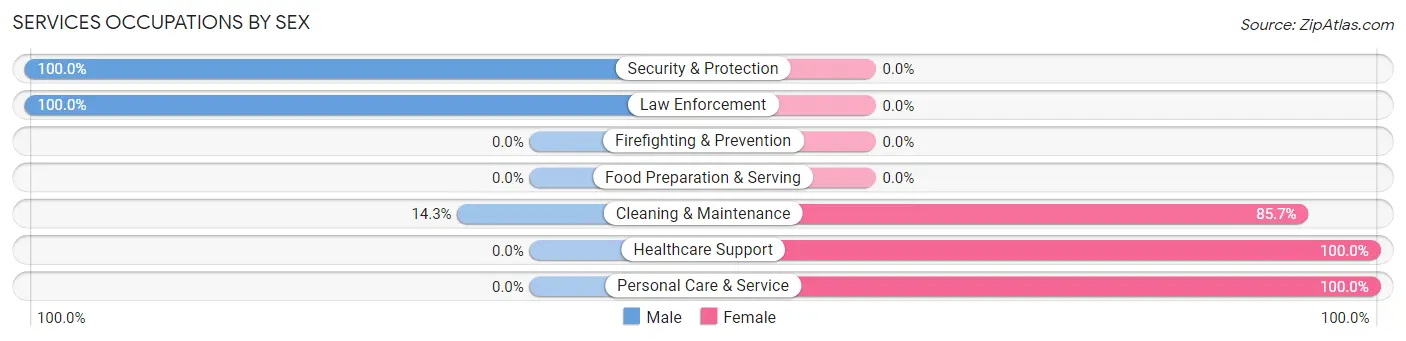
Services Occupations by Sex
Within the Services occupations in West Hamlin, the most male-oriented occupations are Security & Protection (100.0%), Law Enforcement (100.0%), and Cleaning & Maintenance (14.3%), while the most female-oriented occupations are Healthcare Support (100.0%), Personal Care & Service (100.0%), and Cleaning & Maintenance (85.7%).
| Occupation | Male | Female |
| Healthcare Support | 0 (0.0%) | 15 (100.0%) |
| Security & Protection | 5 (100.0%) | 0 (0.0%) |
| Firefighting & Prevention | 0 (0.0%) | 0 (0.0%) |
| Law Enforcement | 5 (100.0%) | 0 (0.0%) |
| Food Preparation & Serving | 0 (0.0%) | 0 (0.0%) |
| Cleaning & Maintenance | 2 (14.3%) | 12 (85.7%) |
| Personal Care & Service | 0 (0.0%) | 2 (100.0%) |
| Total (Category) | 7 (19.4%) | 29 (80.6%) |
| Total (Overall) | 91 (53.5%) | 79 (46.5%) |
Sales and Office Occupations
The most common Sales and Office occupations in West Hamlin are Sales & Related (32 | 18.8%), and Office & Administration (23 | 13.5%).
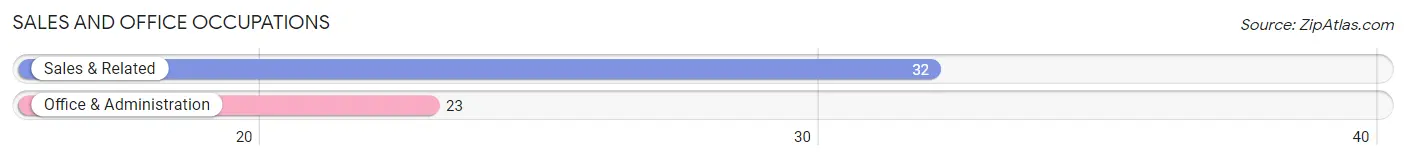
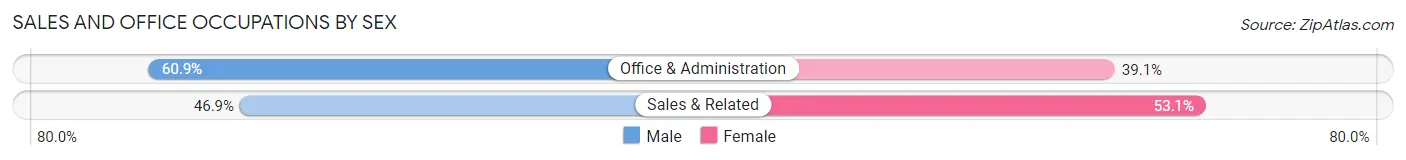
Sales and Office Occupations by Sex
| Occupation | Male | Female |
| Sales & Related | 15 (46.9%) | 17 (53.1%) |
| Office & Administration | 14 (60.9%) | 9 (39.1%) |
| Total (Category) | 29 (52.7%) | 26 (47.3%) |
| Total (Overall) | 91 (53.5%) | 79 (46.5%) |
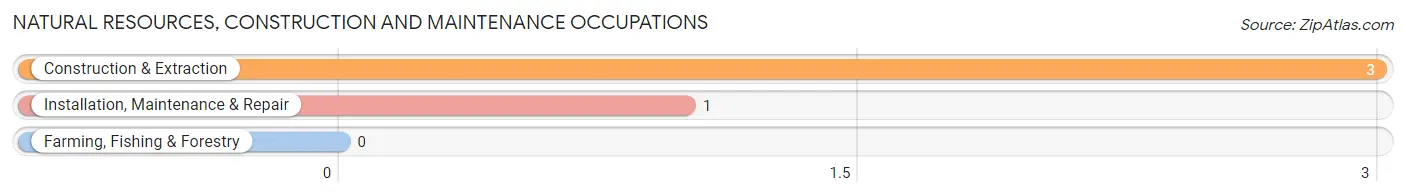
Natural Resources, Construction and Maintenance Occupations
The most common Natural Resources, Construction and Maintenance occupations in West Hamlin are Construction & Extraction (3 | 1.8%), and Installation, Maintenance & Repair (1 | 0.6%).
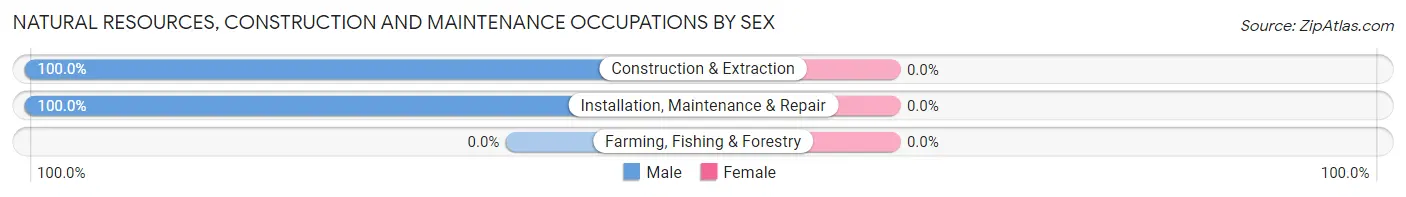
Natural Resources, Construction and Maintenance Occupations by Sex
| Occupation | Male | Female |
| Farming, Fishing & Forestry | 0 (0.0%) | 0 (0.0%) |
| Construction & Extraction | 3 (100.0%) | 0 (0.0%) |
| Installation, Maintenance & Repair | 1 (100.0%) | 0 (0.0%) |
| Total (Category) | 4 (100.0%) | 0 (0.0%) |
| Total (Overall) | 91 (53.5%) | 79 (46.5%) |
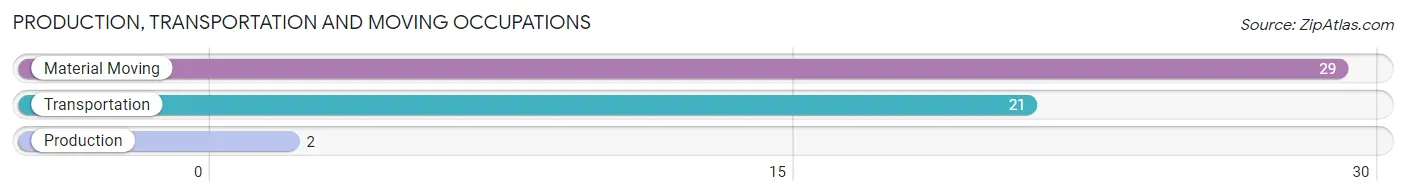
Production, Transportation and Moving Occupations
The most common Production, Transportation and Moving occupations in West Hamlin are Material Moving (29 | 17.1%), Transportation (21 | 12.3%), and Production (2 | 1.2%).
Production, Transportation and Moving Occupations by Sex
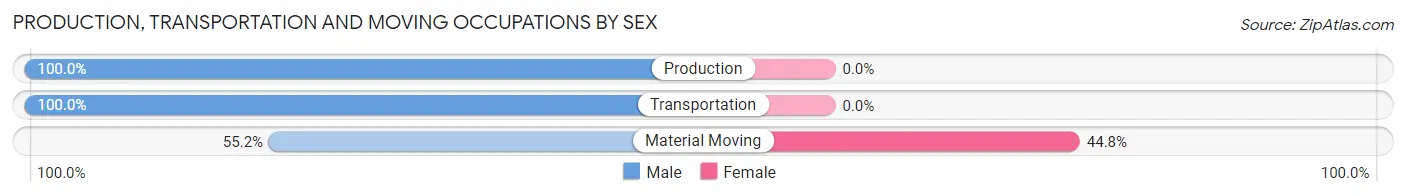
| Occupation | Male | Female |
| Production | 2 (100.0%) | 0 (0.0%) |
| Transportation | 21 (100.0%) | 0 (0.0%) |
| Material Moving | 16 (55.2%) | 13 (44.8%) |
| Total (Category) | 39 (75.0%) | 13 (25.0%) |
| Total (Overall) | 91 (53.5%) | 79 (46.5%) |
Employment Industries by Sex in West Hamlin
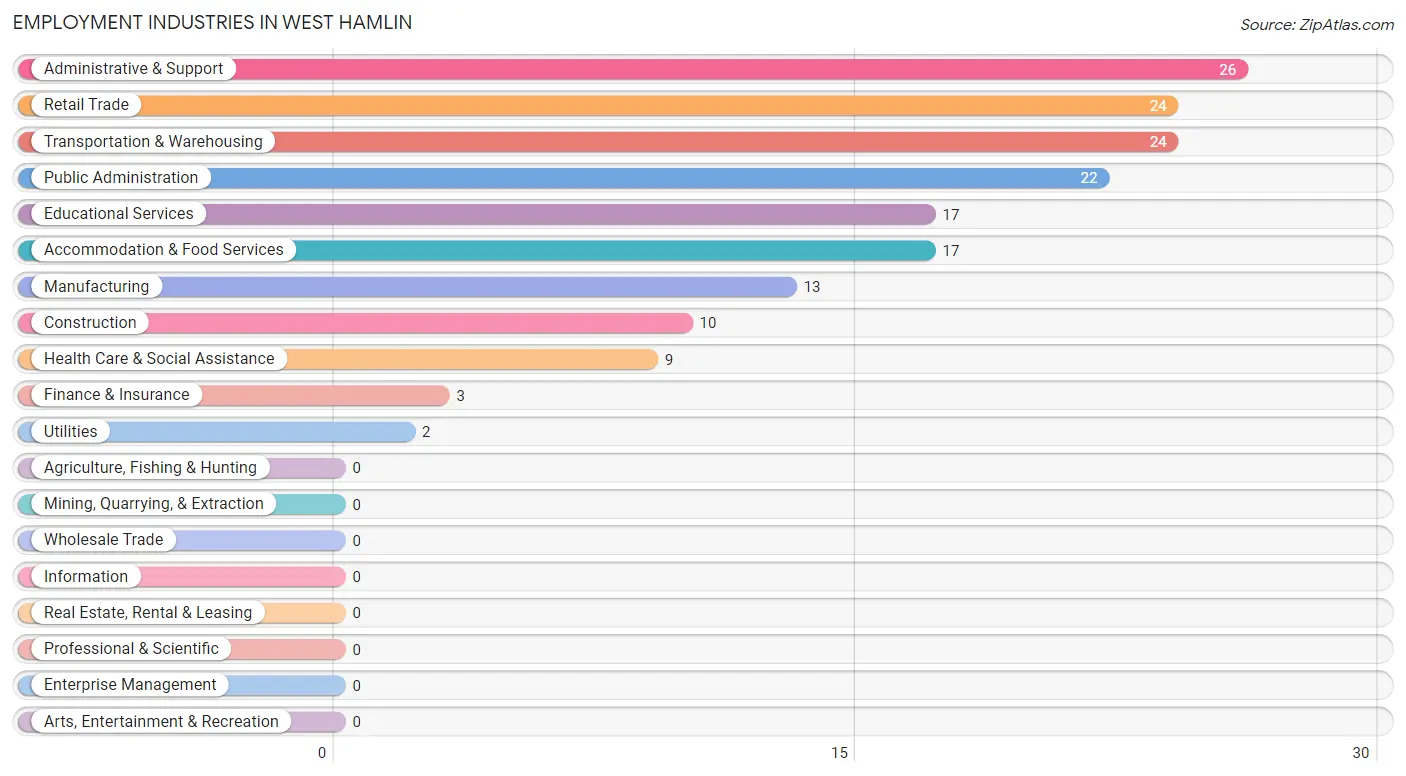
Employment Industries in West Hamlin
The major employment industries in West Hamlin include Administrative & Support (26 | 15.3%), Retail Trade (24 | 14.1%), Transportation & Warehousing (24 | 14.1%), Public Administration (22 | 12.9%), and Educational Services (17 | 10.0%).
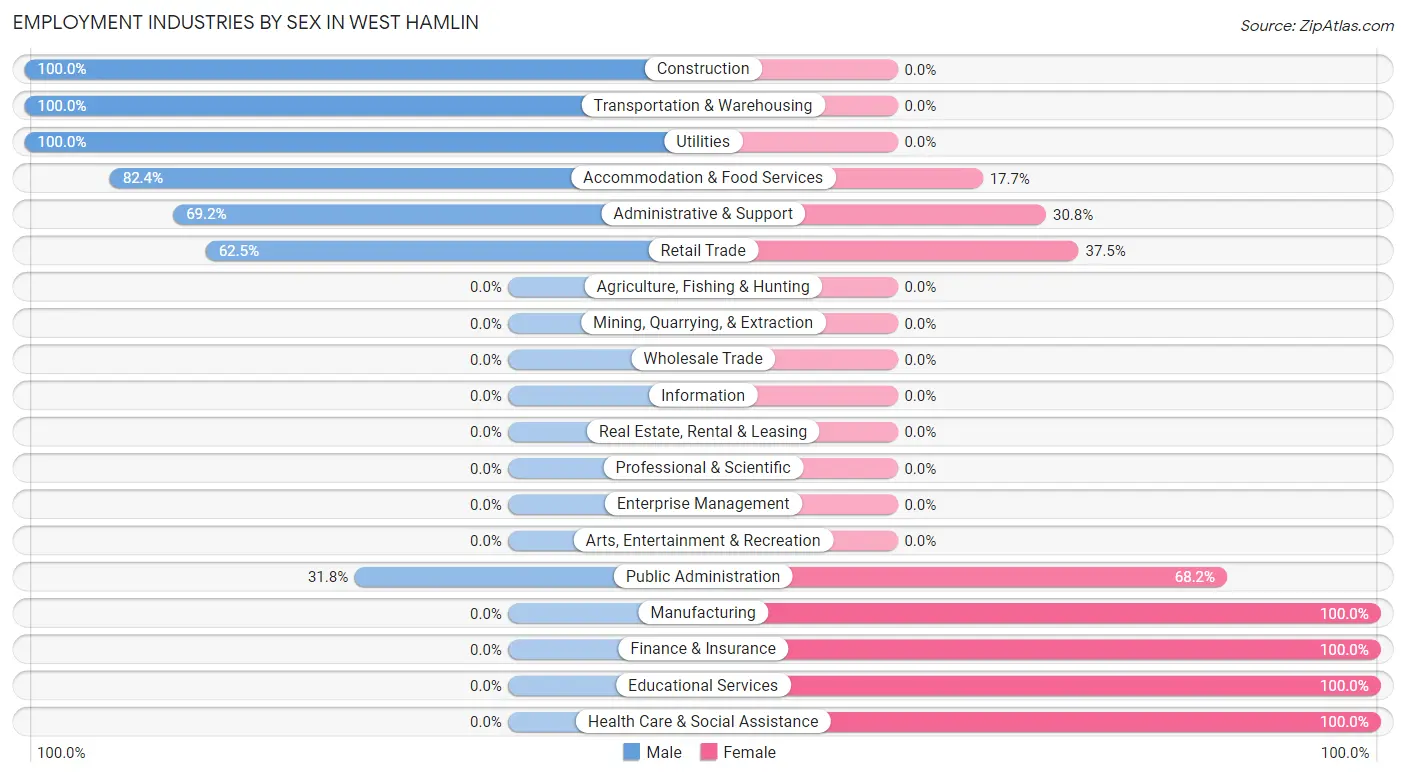
Employment Industries by Sex in West Hamlin
The West Hamlin industries that see more men than women are Construction (100.0%), Transportation & Warehousing (100.0%), and Utilities (100.0%), whereas the industries that tend to have a higher number of women are Manufacturing (100.0%), Finance & Insurance (100.0%), and Educational Services (100.0%).
| Industry | Male | Female |
| Agriculture, Fishing & Hunting | 0 (0.0%) | 0 (0.0%) |
| Mining, Quarrying, & Extraction | 0 (0.0%) | 0 (0.0%) |
| Construction | 10 (100.0%) | 0 (0.0%) |
| Manufacturing | 0 (0.0%) | 13 (100.0%) |
| Wholesale Trade | 0 (0.0%) | 0 (0.0%) |
| Retail Trade | 15 (62.5%) | 9 (37.5%) |
| Transportation & Warehousing | 24 (100.0%) | 0 (0.0%) |
| Utilities | 2 (100.0%) | 0 (0.0%) |
| Information | 0 (0.0%) | 0 (0.0%) |
| Finance & Insurance | 0 (0.0%) | 3 (100.0%) |
| Real Estate, Rental & Leasing | 0 (0.0%) | 0 (0.0%) |
| Professional & Scientific | 0 (0.0%) | 0 (0.0%) |
| Enterprise Management | 0 (0.0%) | 0 (0.0%) |
| Administrative & Support | 18 (69.2%) | 8 (30.8%) |
| Educational Services | 0 (0.0%) | 17 (100.0%) |
| Health Care & Social Assistance | 0 (0.0%) | 9 (100.0%) |
| Arts, Entertainment & Recreation | 0 (0.0%) | 0 (0.0%) |
| Accommodation & Food Services | 14 (82.4%) | 3 (17.6%) |
| Public Administration | 7 (31.8%) | 15 (68.2%) |
| Total | 91 (53.5%) | 79 (46.5%) |
Education in West Hamlin
School Enrollment in West Hamlin
The most common levels of schooling among the 32 students in West Hamlin are elementary school (14 | 43.8%), kindergarten (10 | 31.2%), and middle school (6 | 18.8%).
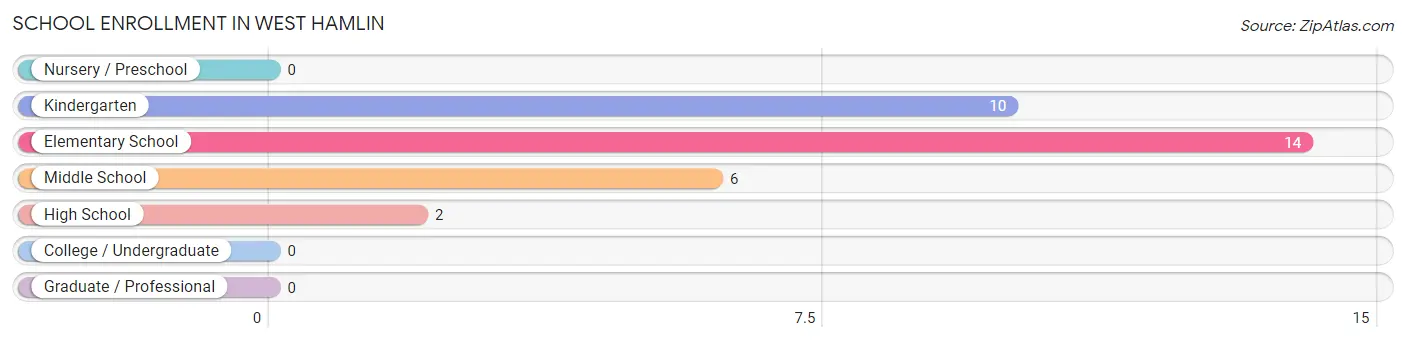
| School Level | # Students | % Students |
| Nursery / Preschool | 0 | 0.0% |
| Kindergarten | 10 | 31.2% |
| Elementary School | 14 | 43.8% |
| Middle School | 6 | 18.8% |
| High School | 2 | 6.2% |
| College / Undergraduate | 0 | 0.0% |
| Graduate / Professional | 0 | 0.0% |
| Total | 32 | 100.0% |
School Enrollment by Age by Funding Source in West Hamlin
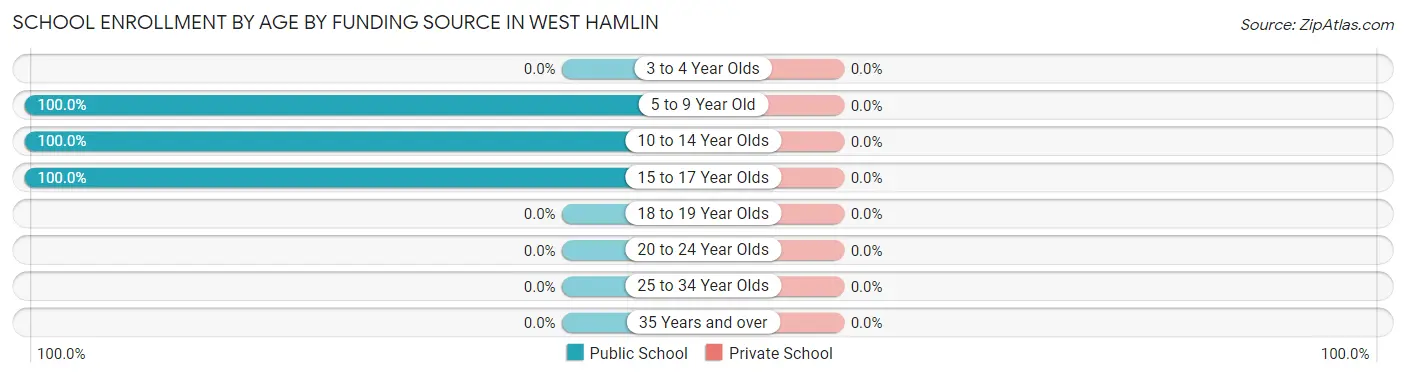
| Age Bracket | Public School | Private School |
| 3 to 4 Year Olds | 0 (0.0%) | 0 (0.0%) |
| 5 to 9 Year Old | 24 (100.0%) | 0 (0.0%) |
| 10 to 14 Year Olds | 6 (100.0%) | 0 (0.0%) |
| 15 to 17 Year Olds | 2 (100.0%) | 0 (0.0%) |
| 18 to 19 Year Olds | 0 (0.0%) | 0 (0.0%) |
| 20 to 24 Year Olds | 0 (0.0%) | 0 (0.0%) |
| 25 to 34 Year Olds | 0 (0.0%) | 0 (0.0%) |
| 35 Years and over | 0 (0.0%) | 0 (0.0%) |
| Total | 32 (100.0%) | 0 (0.0%) |
Educational Attainment by Field of Study in West Hamlin
Engineering (16 | 64.0%), science & technology (3 | 12.0%), education (3 | 12.0%), and arts & humanities (3 | 12.0%) are the most common fields of study among 25 individuals in West Hamlin who have obtained a bachelor's degree or higher.
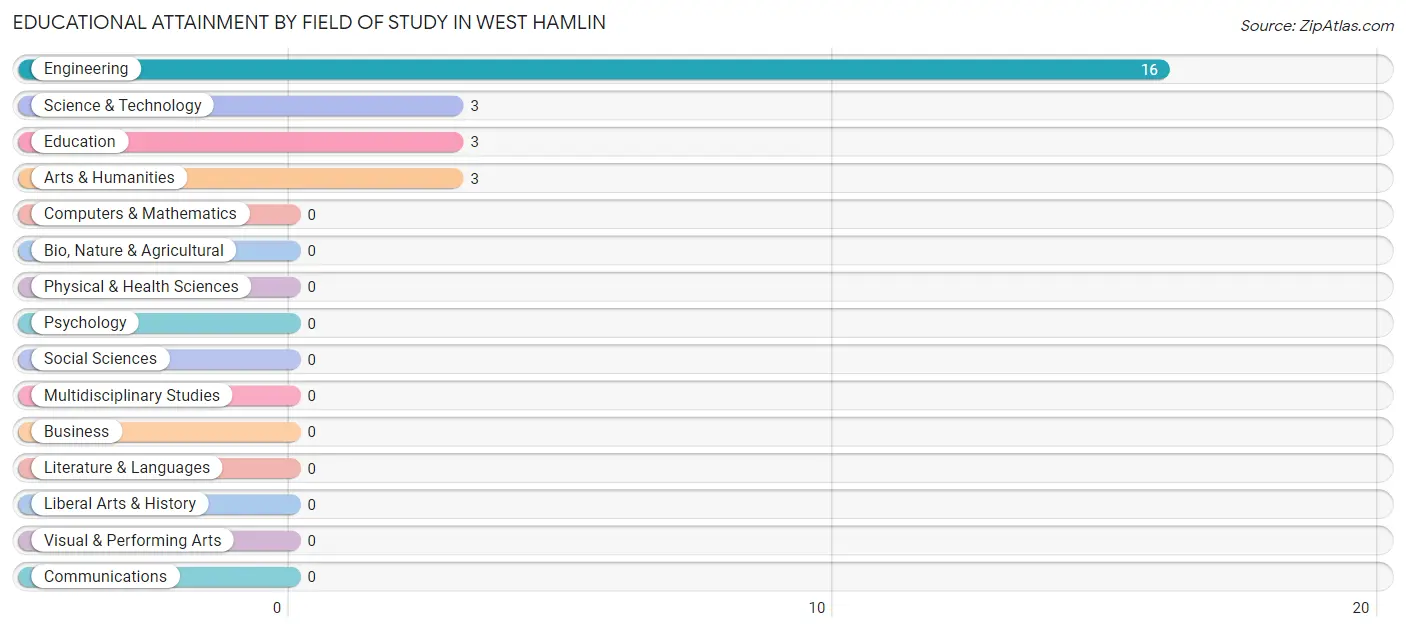
| Field of Study | # Graduates | % Graduates |
| Computers & Mathematics | 0 | 0.0% |
| Bio, Nature & Agricultural | 0 | 0.0% |
| Physical & Health Sciences | 0 | 0.0% |
| Psychology | 0 | 0.0% |
| Social Sciences | 0 | 0.0% |
| Engineering | 16 | 64.0% |
| Multidisciplinary Studies | 0 | 0.0% |
| Science & Technology | 3 | 12.0% |
| Business | 0 | 0.0% |
| Education | 3 | 12.0% |
| Literature & Languages | 0 | 0.0% |
| Liberal Arts & History | 0 | 0.0% |
| Visual & Performing Arts | 0 | 0.0% |
| Communications | 0 | 0.0% |
| Arts & Humanities | 3 | 12.0% |
| Total | 25 | 100.0% |
Transportation & Commute in West Hamlin
Vehicle Availability by Sex in West Hamlin
The most prevalent vehicle ownership categories in West Hamlin are males with 3 vehicles (42, accounting for 46.2%) and females with 3 vehicles (7, making up 55.3%).
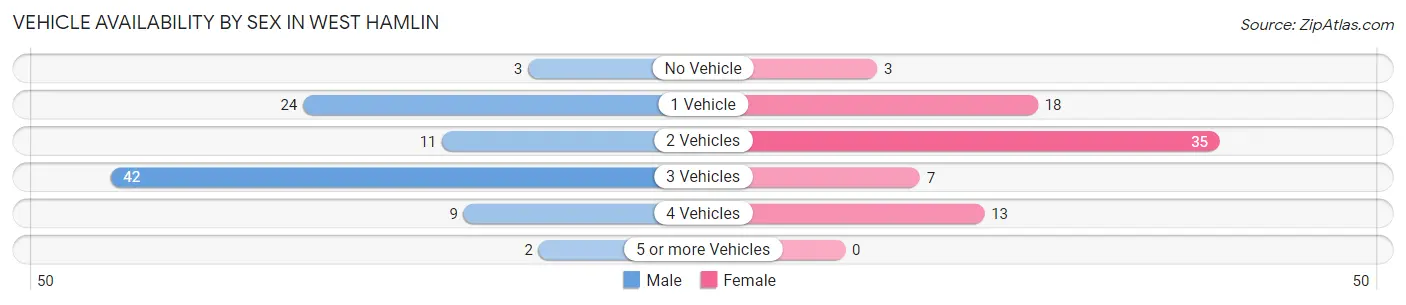
| Vehicles Available | Male | Female |
| No Vehicle | 3 (3.3%) | 3 (4.0%) |
| 1 Vehicle | 24 (26.4%) | 18 (23.7%) |
| 2 Vehicles | 11 (12.1%) | 35 (46.1%) |
| 3 Vehicles | 42 (46.2%) | 7 (9.2%) |
| 4 Vehicles | 9 (9.9%) | 13 (17.1%) |
| 5 or more Vehicles | 2 (2.2%) | 0 (0.0%) |
| Total | 91 (100.0%) | 76 (100.0%) |
Commute Time in West Hamlin
The most frequently occuring commute durations in West Hamlin are 5 to 9 minutes (42 commuters, 25.2%), 60 to 89 minutes (34 commuters, 20.4%), and less than 5 minutes (28 commuters, 16.8%).
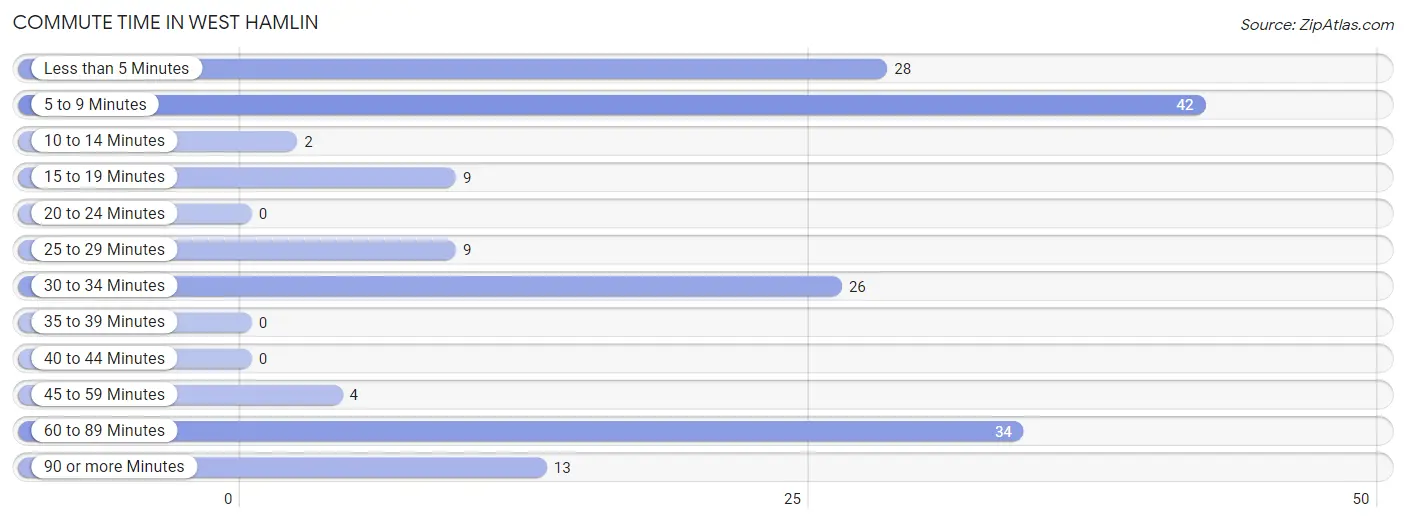
| Commute Time | # Commuters | % Commuters |
| Less than 5 Minutes | 28 | 16.8% |
| 5 to 9 Minutes | 42 | 25.2% |
| 10 to 14 Minutes | 2 | 1.2% |
| 15 to 19 Minutes | 9 | 5.4% |
| 20 to 24 Minutes | 0 | 0.0% |
| 25 to 29 Minutes | 9 | 5.4% |
| 30 to 34 Minutes | 26 | 15.6% |
| 35 to 39 Minutes | 0 | 0.0% |
| 40 to 44 Minutes | 0 | 0.0% |
| 45 to 59 Minutes | 4 | 2.4% |
| 60 to 89 Minutes | 34 | 20.4% |
| 90 or more Minutes | 13 | 7.8% |
Commute Time by Sex in West Hamlin
The most common commute times in West Hamlin are 5 to 9 minutes (35 commuters, 38.5%) for males and less than 5 minutes (27 commuters, 35.5%) for females.
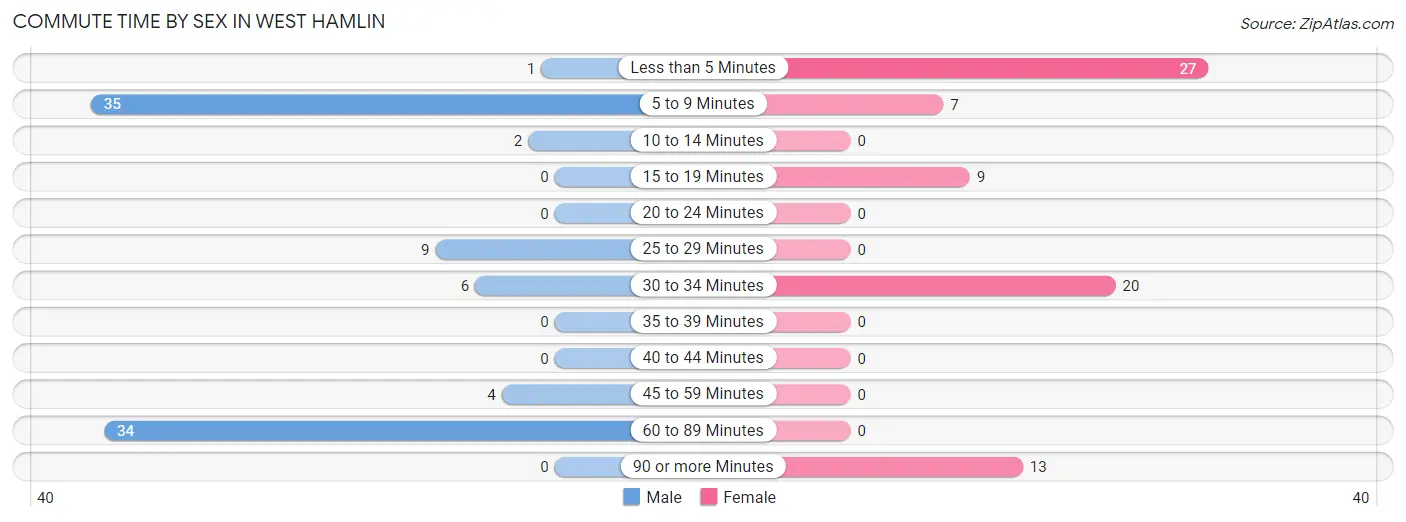
| Commute Time | Male | Female |
| Less than 5 Minutes | 1 (1.1%) | 27 (35.5%) |
| 5 to 9 Minutes | 35 (38.5%) | 7 (9.2%) |
| 10 to 14 Minutes | 2 (2.2%) | 0 (0.0%) |
| 15 to 19 Minutes | 0 (0.0%) | 9 (11.8%) |
| 20 to 24 Minutes | 0 (0.0%) | 0 (0.0%) |
| 25 to 29 Minutes | 9 (9.9%) | 0 (0.0%) |
| 30 to 34 Minutes | 6 (6.6%) | 20 (26.3%) |
| 35 to 39 Minutes | 0 (0.0%) | 0 (0.0%) |
| 40 to 44 Minutes | 0 (0.0%) | 0 (0.0%) |
| 45 to 59 Minutes | 4 (4.4%) | 0 (0.0%) |
| 60 to 89 Minutes | 34 (37.4%) | 0 (0.0%) |
| 90 or more Minutes | 0 (0.0%) | 13 (17.1%) |
Time of Departure to Work by Sex in West Hamlin
The most frequent times of departure to work in West Hamlin are 12:00 PM to 3:59 PM (30, 33.0%) for males and 6:00 AM to 6:29 AM (15, 19.7%) for females.
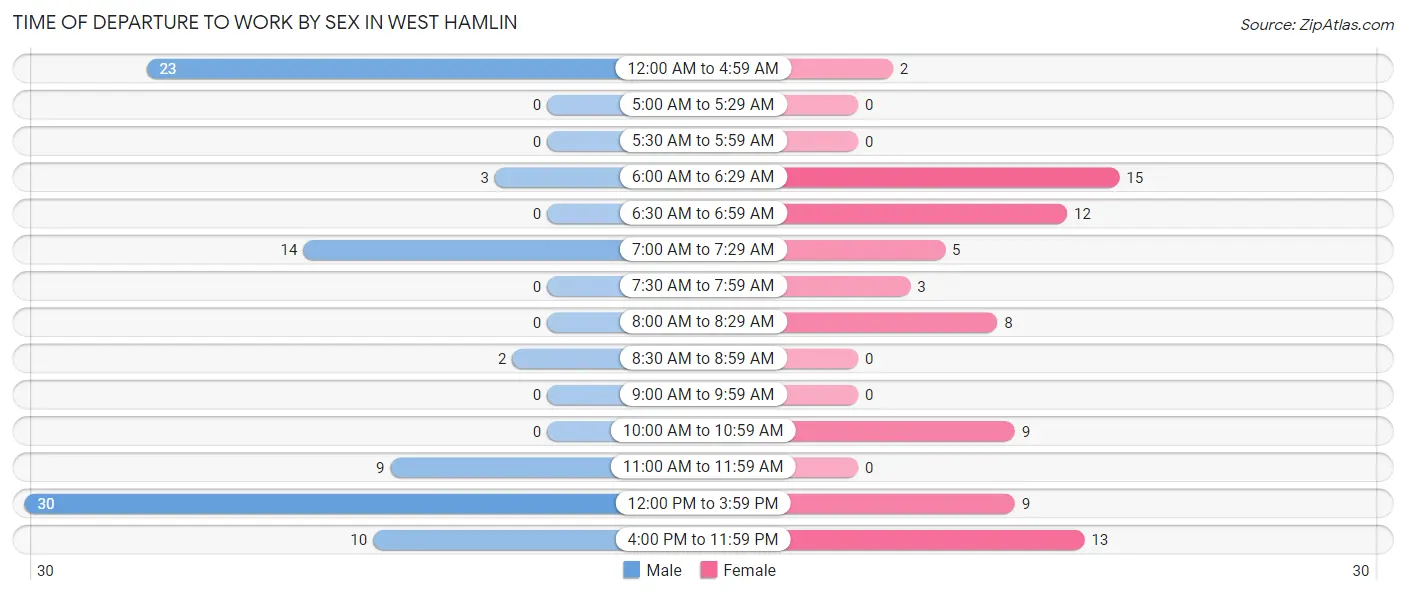
| Time of Departure | Male | Female |
| 12:00 AM to 4:59 AM | 23 (25.3%) | 2 (2.6%) |
| 5:00 AM to 5:29 AM | 0 (0.0%) | 0 (0.0%) |
| 5:30 AM to 5:59 AM | 0 (0.0%) | 0 (0.0%) |
| 6:00 AM to 6:29 AM | 3 (3.3%) | 15 (19.7%) |
| 6:30 AM to 6:59 AM | 0 (0.0%) | 12 (15.8%) |
| 7:00 AM to 7:29 AM | 14 (15.4%) | 5 (6.6%) |
| 7:30 AM to 7:59 AM | 0 (0.0%) | 3 (4.0%) |
| 8:00 AM to 8:29 AM | 0 (0.0%) | 8 (10.5%) |
| 8:30 AM to 8:59 AM | 2 (2.2%) | 0 (0.0%) |
| 9:00 AM to 9:59 AM | 0 (0.0%) | 0 (0.0%) |
| 10:00 AM to 10:59 AM | 0 (0.0%) | 9 (11.8%) |
| 11:00 AM to 11:59 AM | 9 (9.9%) | 0 (0.0%) |
| 12:00 PM to 3:59 PM | 30 (33.0%) | 9 (11.8%) |
| 4:00 PM to 11:59 PM | 10 (11.0%) | 13 (17.1%) |
| Total | 91 (100.0%) | 76 (100.0%) |
Housing Occupancy in West Hamlin
Occupancy by Ownership in West Hamlin
Of the total 241 dwellings in West Hamlin, owner-occupied units account for 167 (69.3%), while renter-occupied units make up 74 (30.7%).
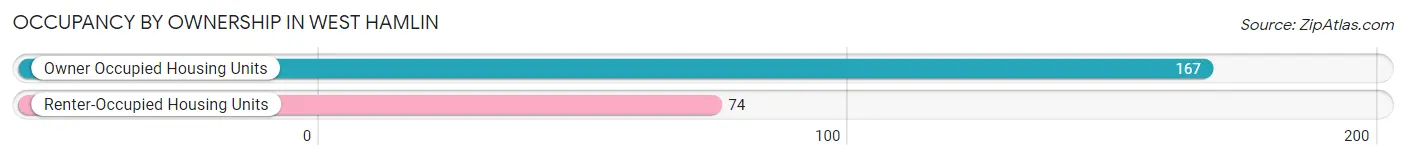
| Occupancy | # Housing Units | % Housing Units |
| Owner Occupied Housing Units | 167 | 69.3% |
| Renter-Occupied Housing Units | 74 | 30.7% |
| Total Occupied Housing Units | 241 | 100.0% |
Occupancy by Household Size in West Hamlin
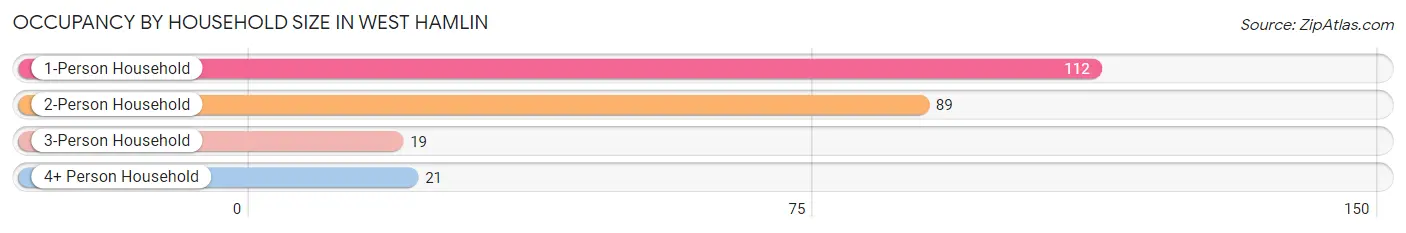
| Household Size | # Housing Units | % Housing Units |
| 1-Person Household | 112 | 46.5% |
| 2-Person Household | 89 | 36.9% |
| 3-Person Household | 19 | 7.9% |
| 4+ Person Household | 21 | 8.7% |
| Total Housing Units | 241 | 100.0% |
Occupancy by Ownership by Household Size in West Hamlin
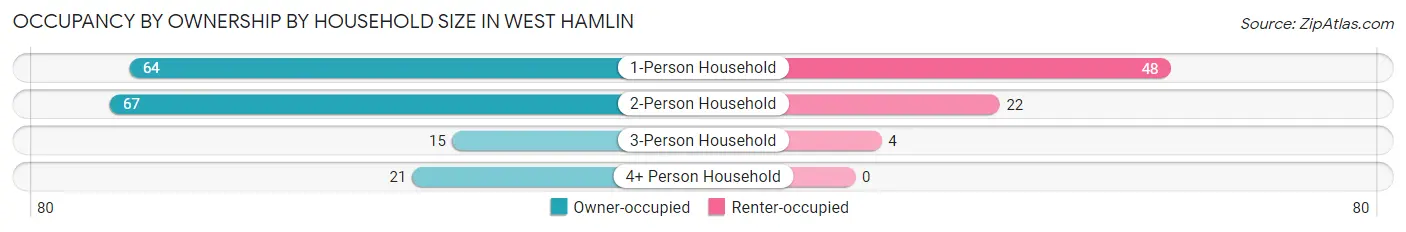
| Household Size | Owner-occupied | Renter-occupied |
| 1-Person Household | 64 (57.1%) | 48 (42.9%) |
| 2-Person Household | 67 (75.3%) | 22 (24.7%) |
| 3-Person Household | 15 (78.9%) | 4 (21.0%) |
| 4+ Person Household | 21 (100.0%) | 0 (0.0%) |
| Total Housing Units | 167 (69.3%) | 74 (30.7%) |
Occupancy by Educational Attainment in West Hamlin
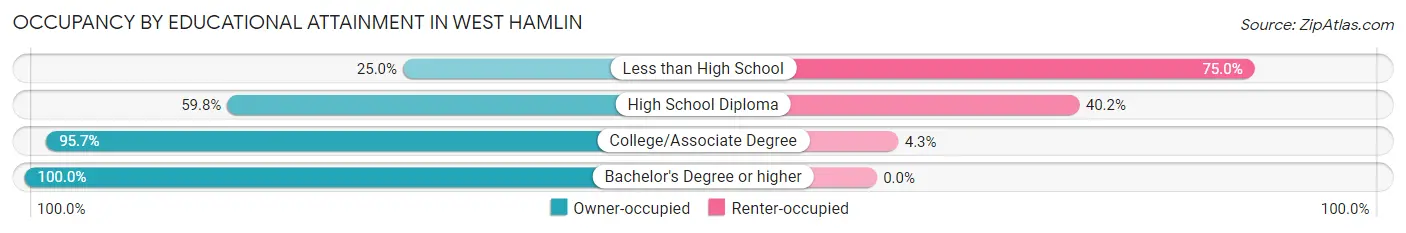
| Household Size | Owner-occupied | Renter-occupied |
| Less than High School | 8 (25.0%) | 24 (75.0%) |
| High School Diploma | 70 (59.8%) | 47 (40.2%) |
| College/Associate Degree | 67 (95.7%) | 3 (4.3%) |
| Bachelor's Degree or higher | 22 (100.0%) | 0 (0.0%) |
Occupancy by Age of Householder in West Hamlin
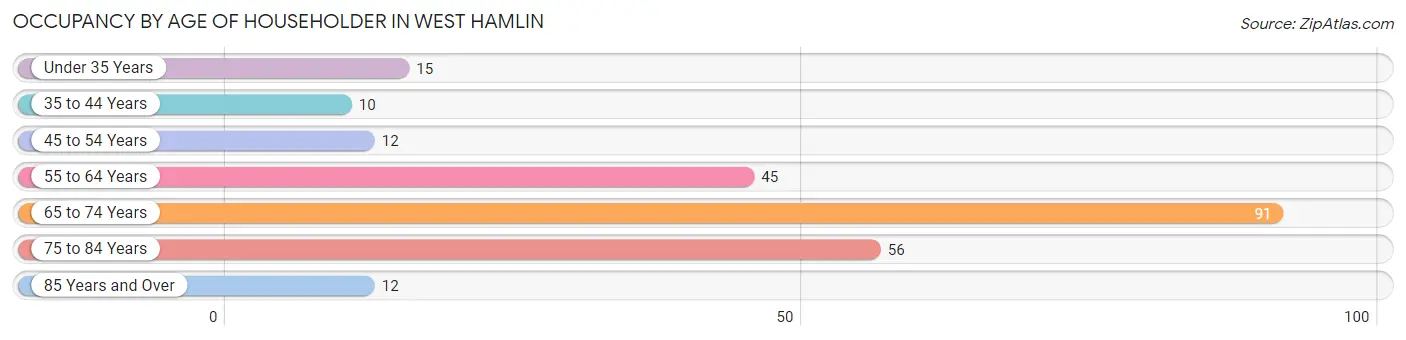
| Age Bracket | # Households | % Households |
| Under 35 Years | 15 | 6.2% |
| 35 to 44 Years | 10 | 4.2% |
| 45 to 54 Years | 12 | 5.0% |
| 55 to 64 Years | 45 | 18.7% |
| 65 to 74 Years | 91 | 37.8% |
| 75 to 84 Years | 56 | 23.2% |
| 85 Years and Over | 12 | 5.0% |
| Total | 241 | 100.0% |
Housing Finances in West Hamlin
Median Income by Occupancy in West Hamlin
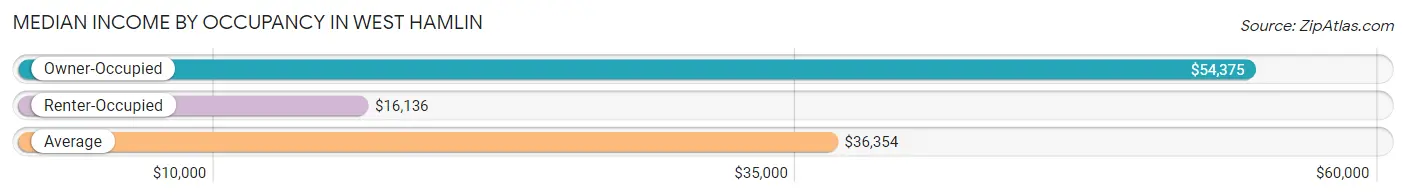
| Occupancy Type | # Households | Median Income |
| Owner-Occupied | 167 (69.3%) | $54,375 |
| Renter-Occupied | 74 (30.7%) | $16,136 |
| Average | 241 (100.0%) | $36,354 |
Occupancy by Householder Income Bracket in West Hamlin
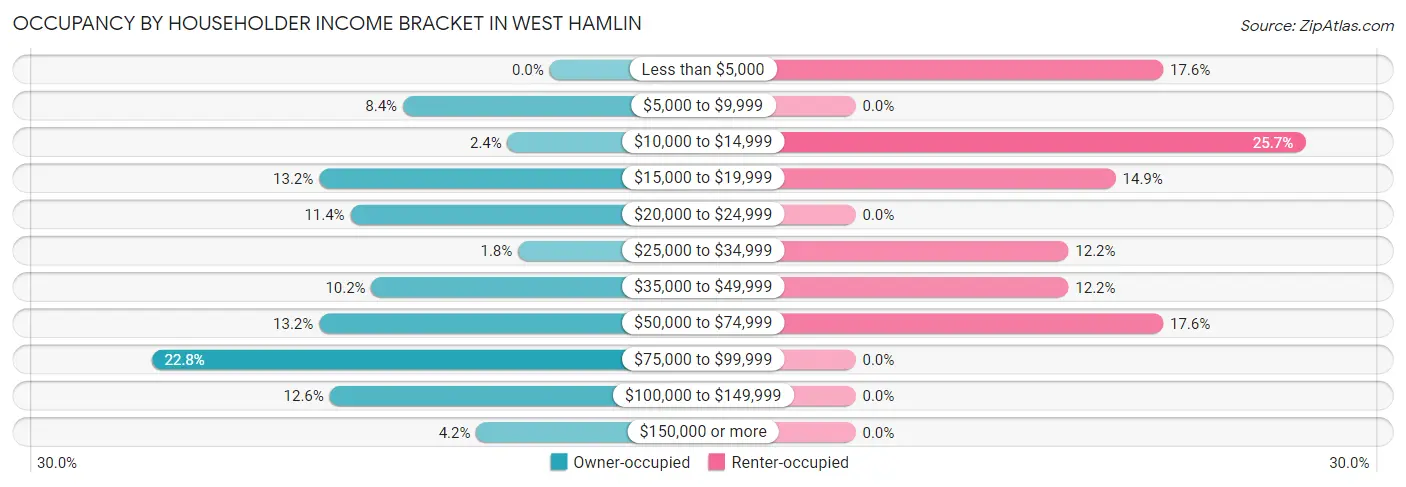
| Income Bracket | Owner-occupied | Renter-occupied |
| Less than $5,000 | 0 (0.0%) | 13 (17.6%) |
| $5,000 to $9,999 | 14 (8.4%) | 0 (0.0%) |
| $10,000 to $14,999 | 4 (2.4%) | 19 (25.7%) |
| $15,000 to $19,999 | 22 (13.2%) | 11 (14.9%) |
| $20,000 to $24,999 | 19 (11.4%) | 0 (0.0%) |
| $25,000 to $34,999 | 3 (1.8%) | 9 (12.2%) |
| $35,000 to $49,999 | 17 (10.2%) | 9 (12.2%) |
| $50,000 to $74,999 | 22 (13.2%) | 13 (17.6%) |
| $75,000 to $99,999 | 38 (22.8%) | 0 (0.0%) |
| $100,000 to $149,999 | 21 (12.6%) | 0 (0.0%) |
| $150,000 or more | 7 (4.2%) | 0 (0.0%) |
| Total | 167 (100.0%) | 74 (100.0%) |
Monthly Housing Cost Tiers in West Hamlin
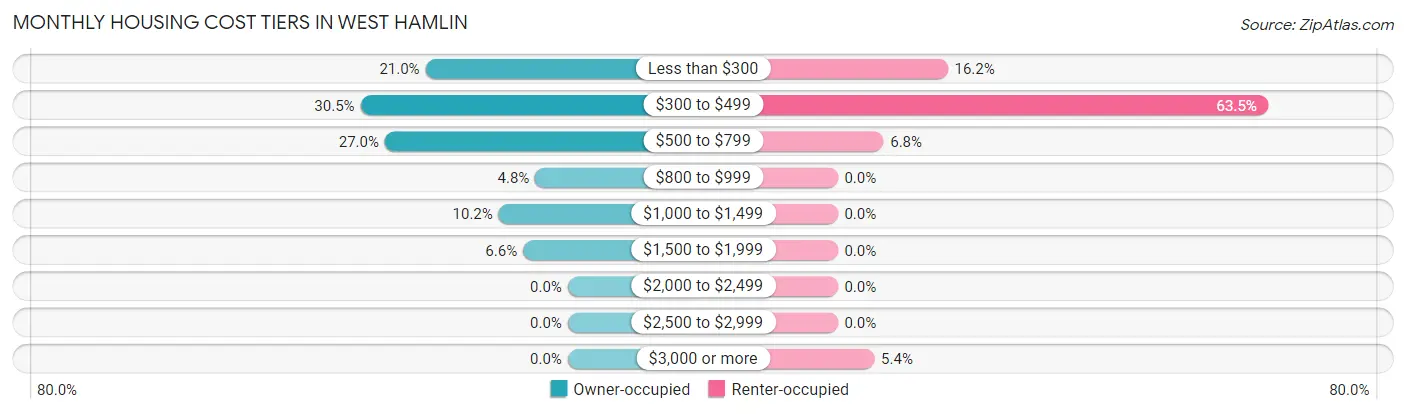
| Monthly Cost | Owner-occupied | Renter-occupied |
| Less than $300 | 35 (21.0%) | 12 (16.2%) |
| $300 to $499 | 51 (30.5%) | 47 (63.5%) |
| $500 to $799 | 45 (27.0%) | 5 (6.8%) |
| $800 to $999 | 8 (4.8%) | 0 (0.0%) |
| $1,000 to $1,499 | 17 (10.2%) | 0 (0.0%) |
| $1,500 to $1,999 | 11 (6.6%) | 0 (0.0%) |
| $2,000 to $2,499 | 0 (0.0%) | 0 (0.0%) |
| $2,500 to $2,999 | 0 (0.0%) | 0 (0.0%) |
| $3,000 or more | 0 (0.0%) | 4 (5.4%) |
| Total | 167 (100.0%) | 74 (100.0%) |
Physical Housing Characteristics in West Hamlin
Housing Structures in West Hamlin
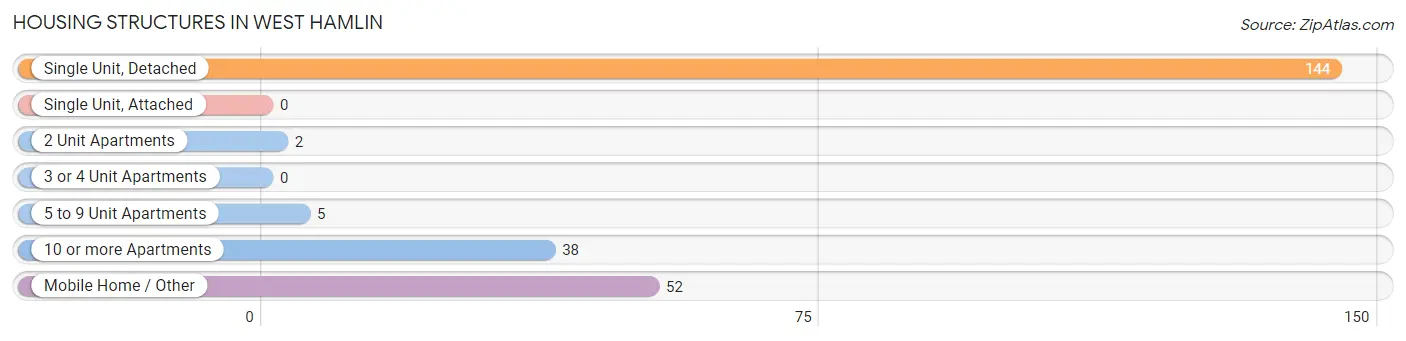
| Structure Type | # Housing Units | % Housing Units |
| Single Unit, Detached | 144 | 59.8% |
| Single Unit, Attached | 0 | 0.0% |
| 2 Unit Apartments | 2 | 0.8% |
| 3 or 4 Unit Apartments | 0 | 0.0% |
| 5 to 9 Unit Apartments | 5 | 2.1% |
| 10 or more Apartments | 38 | 15.8% |
| Mobile Home / Other | 52 | 21.6% |
| Total | 241 | 100.0% |
Housing Structures by Occupancy in West Hamlin
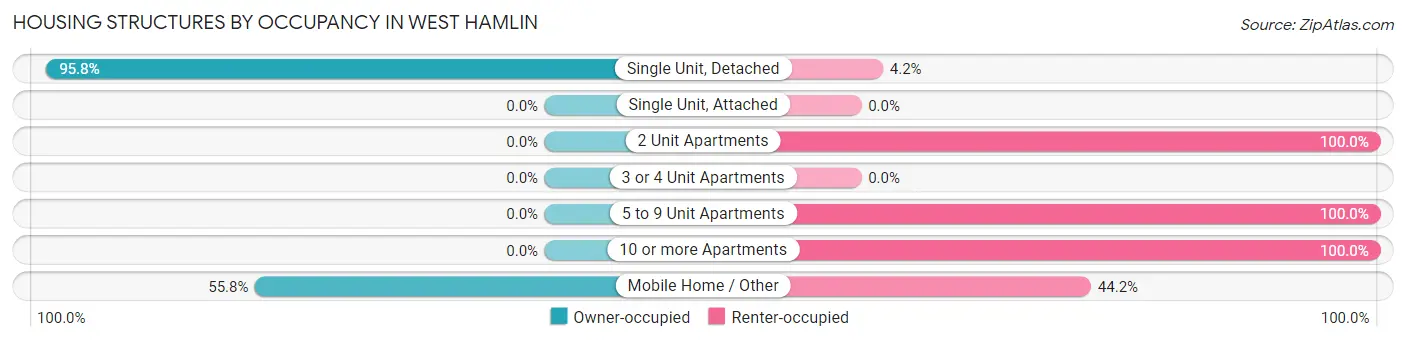
| Structure Type | Owner-occupied | Renter-occupied |
| Single Unit, Detached | 138 (95.8%) | 6 (4.2%) |
| Single Unit, Attached | 0 (0.0%) | 0 (0.0%) |
| 2 Unit Apartments | 0 (0.0%) | 2 (100.0%) |
| 3 or 4 Unit Apartments | 0 (0.0%) | 0 (0.0%) |
| 5 to 9 Unit Apartments | 0 (0.0%) | 5 (100.0%) |
| 10 or more Apartments | 0 (0.0%) | 38 (100.0%) |
| Mobile Home / Other | 29 (55.8%) | 23 (44.2%) |
| Total | 167 (69.3%) | 74 (30.7%) |
Housing Structures by Number of Rooms in West Hamlin
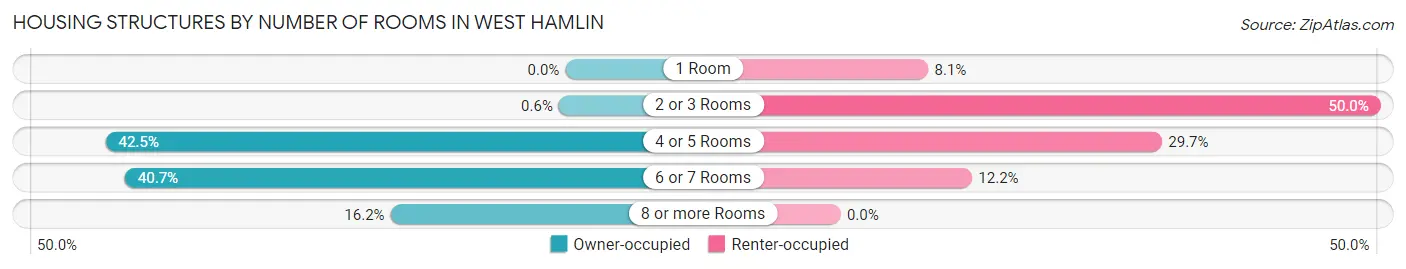
| Number of Rooms | Owner-occupied | Renter-occupied |
| 1 Room | 0 (0.0%) | 6 (8.1%) |
| 2 or 3 Rooms | 1 (0.6%) | 37 (50.0%) |
| 4 or 5 Rooms | 71 (42.5%) | 22 (29.7%) |
| 6 or 7 Rooms | 68 (40.7%) | 9 (12.2%) |
| 8 or more Rooms | 27 (16.2%) | 0 (0.0%) |
| Total | 167 (100.0%) | 74 (100.0%) |
Housing Structure by Heating Type in West Hamlin
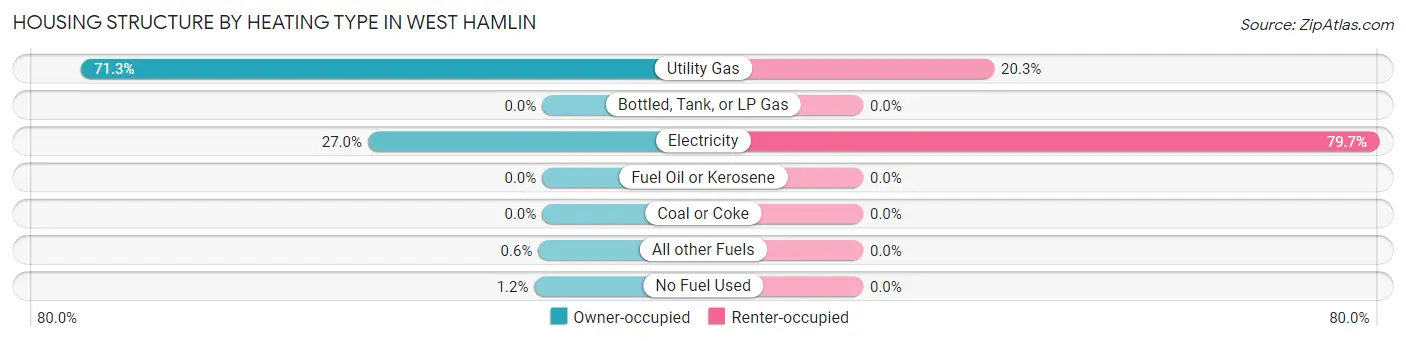
| Heating Type | Owner-occupied | Renter-occupied |
| Utility Gas | 119 (71.3%) | 15 (20.3%) |
| Bottled, Tank, or LP Gas | 0 (0.0%) | 0 (0.0%) |
| Electricity | 45 (27.0%) | 59 (79.7%) |
| Fuel Oil or Kerosene | 0 (0.0%) | 0 (0.0%) |
| Coal or Coke | 0 (0.0%) | 0 (0.0%) |
| All other Fuels | 1 (0.6%) | 0 (0.0%) |
| No Fuel Used | 2 (1.2%) | 0 (0.0%) |
| Total | 167 (100.0%) | 74 (100.0%) |
Household Vehicle Usage in West Hamlin
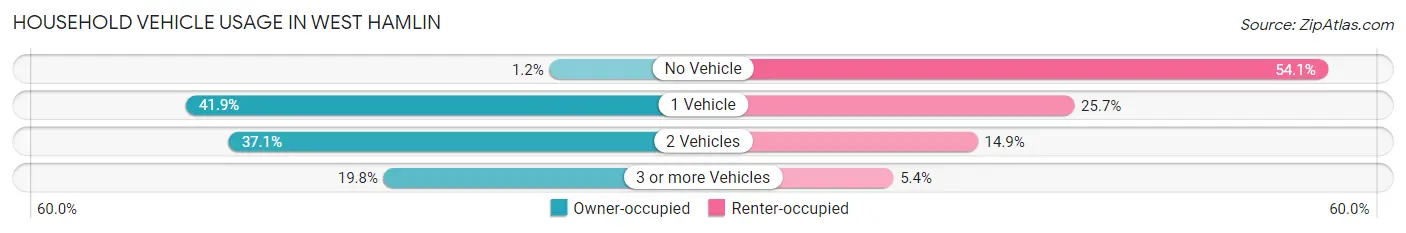
| Vehicles per Household | Owner-occupied | Renter-occupied |
| No Vehicle | 2 (1.2%) | 40 (54.0%) |
| 1 Vehicle | 70 (41.9%) | 19 (25.7%) |
| 2 Vehicles | 62 (37.1%) | 11 (14.9%) |
| 3 or more Vehicles | 33 (19.8%) | 4 (5.4%) |
| Total | 167 (100.0%) | 74 (100.0%) |
Real Estate & Mortgages in West Hamlin
Real Estate and Mortgage Overview in West Hamlin
| Characteristic | Without Mortgage | With Mortgage |
| Housing Units | 122 | 45 |
| Median Property Value | $155,600 | $169,600 |
| Median Household Income | $35,417 | $0 |
| Monthly Housing Costs | $439 | $0 |
| Real Estate Taxes | $420 | $7 |
Property Value by Mortgage Status in West Hamlin
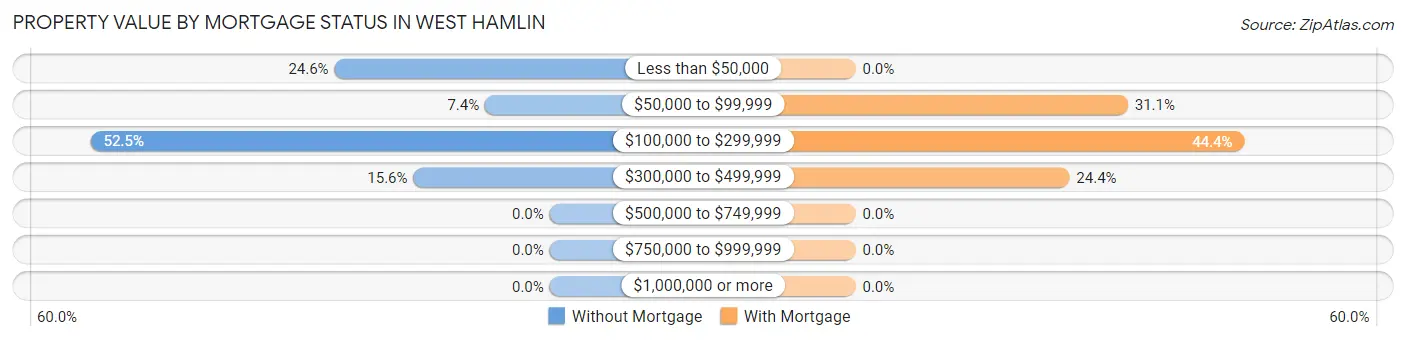
| Property Value | Without Mortgage | With Mortgage |
| Less than $50,000 | 30 (24.6%) | 0 (0.0%) |
| $50,000 to $99,999 | 9 (7.4%) | 14 (31.1%) |
| $100,000 to $299,999 | 64 (52.5%) | 20 (44.4%) |
| $300,000 to $499,999 | 19 (15.6%) | 11 (24.4%) |
| $500,000 to $749,999 | 0 (0.0%) | 0 (0.0%) |
| $750,000 to $999,999 | 0 (0.0%) | 0 (0.0%) |
| $1,000,000 or more | 0 (0.0%) | 0 (0.0%) |
| Total | 122 (100.0%) | 45 (100.0%) |
Household Income by Mortgage Status in West Hamlin
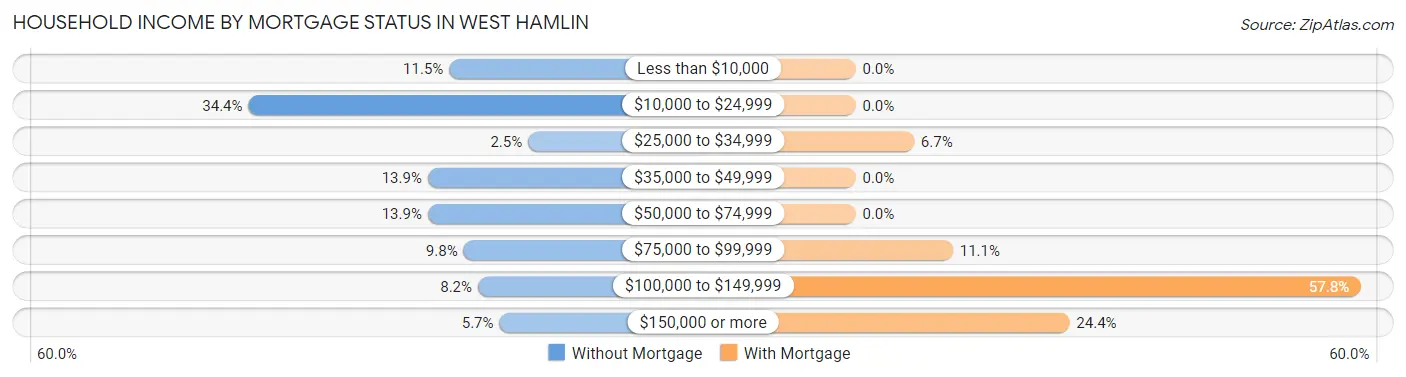
| Household Income | Without Mortgage | With Mortgage |
| Less than $10,000 | 14 (11.5%) | 0 (0.0%) |
| $10,000 to $24,999 | 42 (34.4%) | 0 (0.0%) |
| $25,000 to $34,999 | 3 (2.5%) | 3 (6.7%) |
| $35,000 to $49,999 | 17 (13.9%) | 0 (0.0%) |
| $50,000 to $74,999 | 17 (13.9%) | 0 (0.0%) |
| $75,000 to $99,999 | 12 (9.8%) | 5 (11.1%) |
| $100,000 to $149,999 | 10 (8.2%) | 26 (57.8%) |
| $150,000 or more | 7 (5.7%) | 11 (24.4%) |
| Total | 122 (100.0%) | 45 (100.0%) |
Property Value to Household Income Ratio in West Hamlin
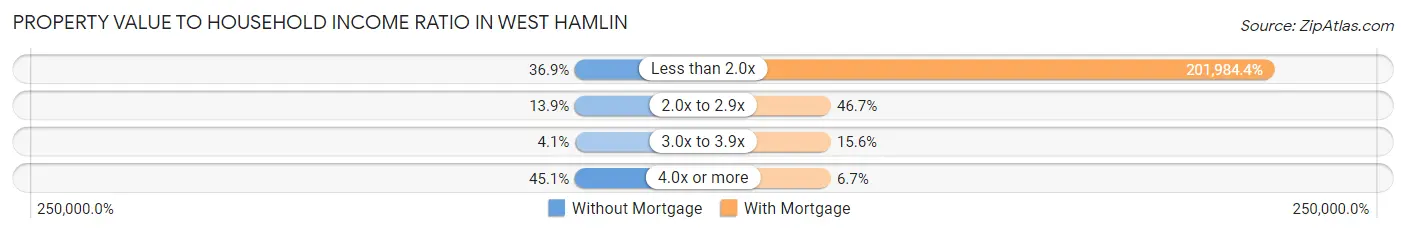
| Value-to-Income Ratio | Without Mortgage | With Mortgage |
| Less than 2.0x | 45 (36.9%) | 90,893 (201,984.4%) |
| 2.0x to 2.9x | 17 (13.9%) | 21 (46.7%) |
| 3.0x to 3.9x | 5 (4.1%) | 7 (15.6%) |
| 4.0x or more | 55 (45.1%) | 3 (6.7%) |
| Total | 122 (100.0%) | 45 (100.0%) |
Real Estate Taxes by Mortgage Status in West Hamlin
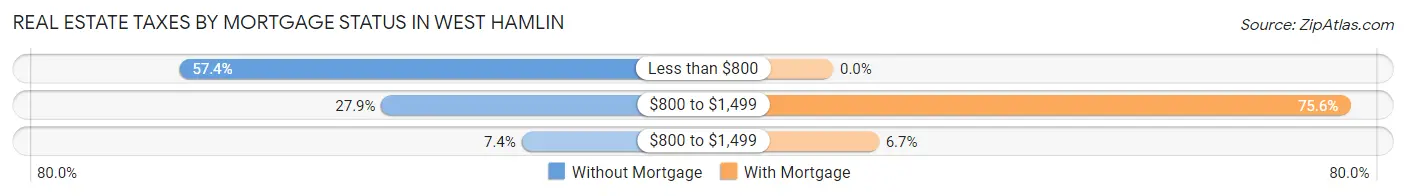
| Property Taxes | Without Mortgage | With Mortgage |
| Less than $800 | 70 (57.4%) | 0 (0.0%) |
| $800 to $1,499 | 34 (27.9%) | 34 (75.6%) |
| $800 to $1,499 | 9 (7.4%) | 3 (6.7%) |
| Total | 122 (100.0%) | 45 (100.0%) |
Health & Disability in West Hamlin
Health Insurance Coverage by Age in West Hamlin
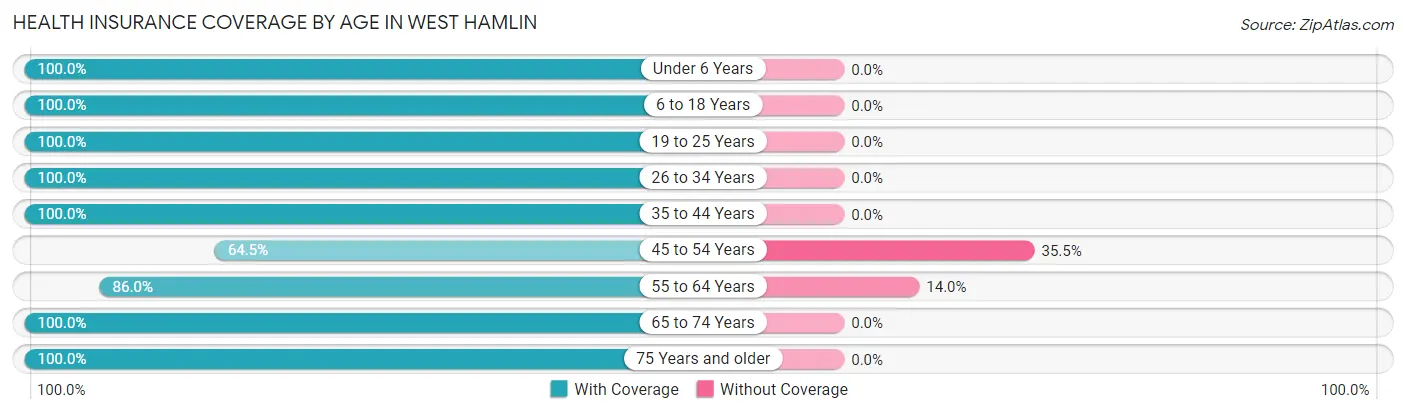
| Age Bracket | With Coverage | Without Coverage |
| Under 6 Years | 6 (100.0%) | 0 (0.0%) |
| 6 to 18 Years | 32 (100.0%) | 0 (0.0%) |
| 19 to 25 Years | 15 (100.0%) | 0 (0.0%) |
| 26 to 34 Years | 49 (100.0%) | 0 (0.0%) |
| 35 to 44 Years | 57 (100.0%) | 0 (0.0%) |
| 45 to 54 Years | 60 (64.5%) | 33 (35.5%) |
| 55 to 64 Years | 86 (86.0%) | 14 (14.0%) |
| 65 to 74 Years | 116 (100.0%) | 0 (0.0%) |
| 75 Years and older | 85 (100.0%) | 0 (0.0%) |
| Total | 506 (91.5%) | 47 (8.5%) |
Health Insurance Coverage by Citizenship Status in West Hamlin
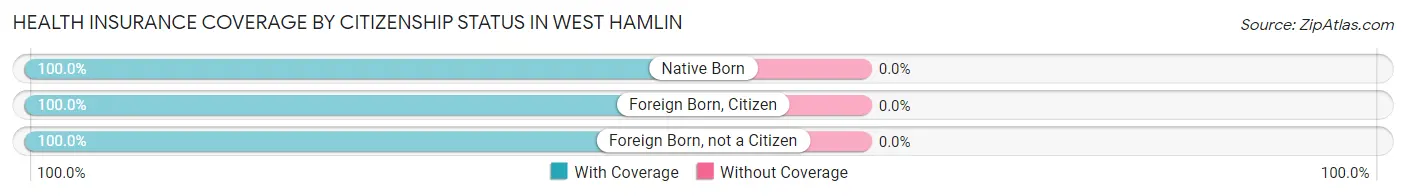
| Citizenship Status | With Coverage | Without Coverage |
| Native Born | 6 (100.0%) | 0 (0.0%) |
| Foreign Born, Citizen | 32 (100.0%) | 0 (0.0%) |
| Foreign Born, not a Citizen | 15 (100.0%) | 0 (0.0%) |
Health Insurance Coverage by Household Income in West Hamlin
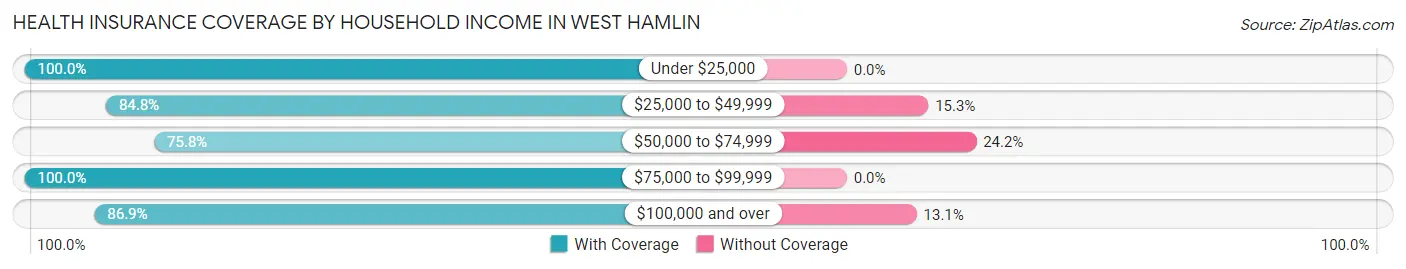
| Household Income | With Coverage | Without Coverage |
| Under $25,000 | 160 (100.0%) | 0 (0.0%) |
| $25,000 to $49,999 | 50 (84.8%) | 9 (15.2%) |
| $50,000 to $74,999 | 75 (75.8%) | 24 (24.2%) |
| $75,000 to $99,999 | 125 (100.0%) | 0 (0.0%) |
| $100,000 and over | 93 (86.9%) | 14 (13.1%) |
Public vs Private Health Insurance Coverage by Age in West Hamlin
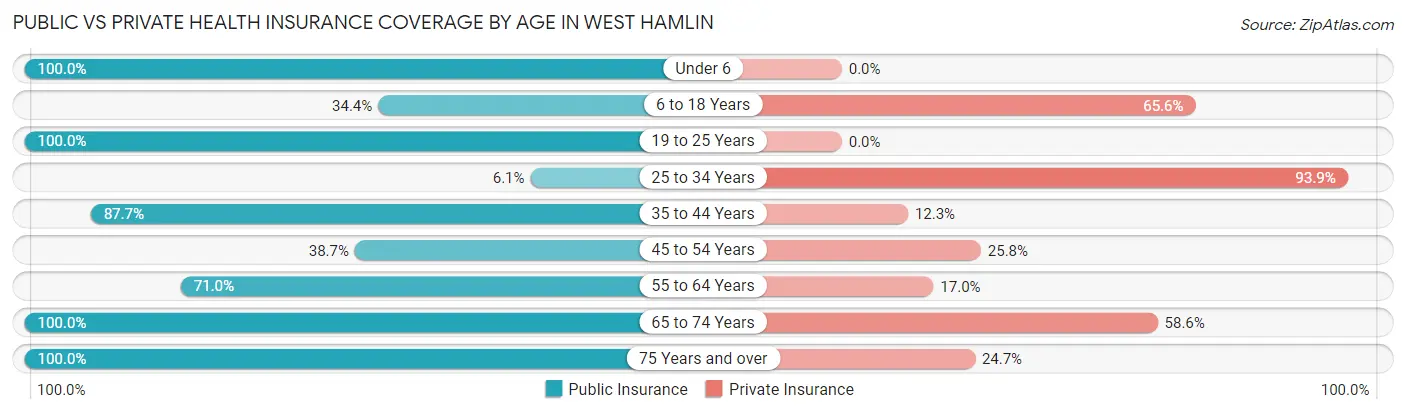
| Age Bracket | Public Insurance | Private Insurance |
| Under 6 | 6 (100.0%) | 0 (0.0%) |
| 6 to 18 Years | 11 (34.4%) | 21 (65.6%) |
| 19 to 25 Years | 15 (100.0%) | 0 (0.0%) |
| 25 to 34 Years | 3 (6.1%) | 46 (93.9%) |
| 35 to 44 Years | 50 (87.7%) | 7 (12.3%) |
| 45 to 54 Years | 36 (38.7%) | 24 (25.8%) |
| 55 to 64 Years | 71 (71.0%) | 17 (17.0%) |
| 65 to 74 Years | 116 (100.0%) | 68 (58.6%) |
| 75 Years and over | 85 (100.0%) | 21 (24.7%) |
| Total | 393 (71.1%) | 204 (36.9%) |
Disability Status by Sex by Age in West Hamlin
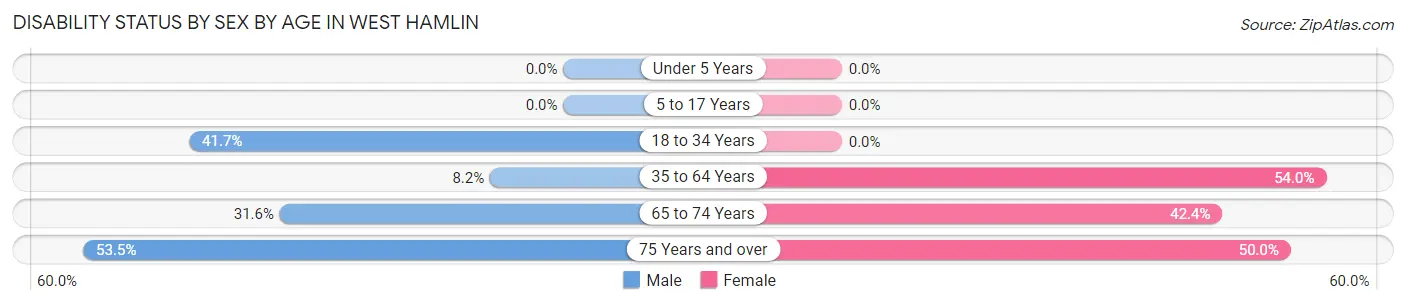
| Age Bracket | Male | Female |
| Under 5 Years | 0 (0.0%) | 0 (0.0%) |
| 5 to 17 Years | 0 (0.0%) | 0 (0.0%) |
| 18 to 34 Years | 15 (41.7%) | 0 (0.0%) |
| 35 to 64 Years | 8 (8.2%) | 82 (53.9%) |
| 65 to 74 Years | 18 (31.6%) | 25 (42.4%) |
| 75 Years and over | 23 (53.5%) | 21 (50.0%) |
Disability Class by Sex by Age in West Hamlin
Disability Class: Hearing Difficulty
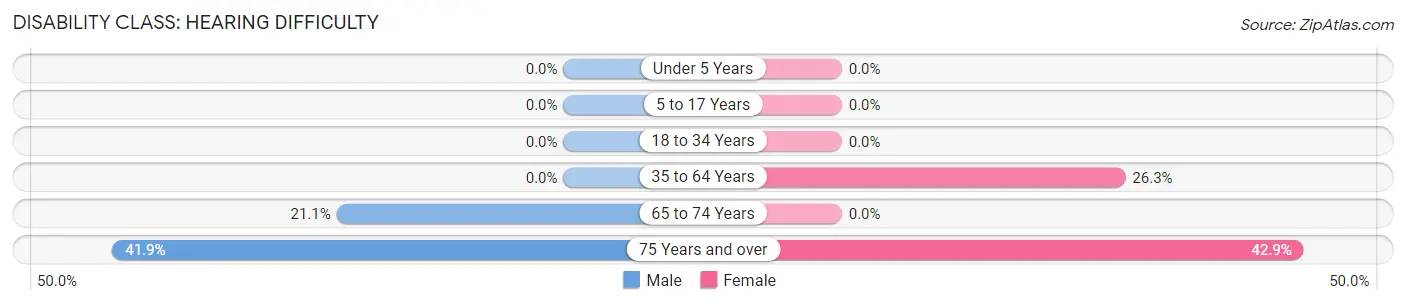
| Age Bracket | Male | Female |
| Under 5 Years | 0 (0.0%) | 0 (0.0%) |
| 5 to 17 Years | 0 (0.0%) | 0 (0.0%) |
| 18 to 34 Years | 0 (0.0%) | 0 (0.0%) |
| 35 to 64 Years | 0 (0.0%) | 40 (26.3%) |
| 65 to 74 Years | 12 (21.0%) | 0 (0.0%) |
| 75 Years and over | 18 (41.9%) | 18 (42.9%) |
Disability Class: Vision Difficulty
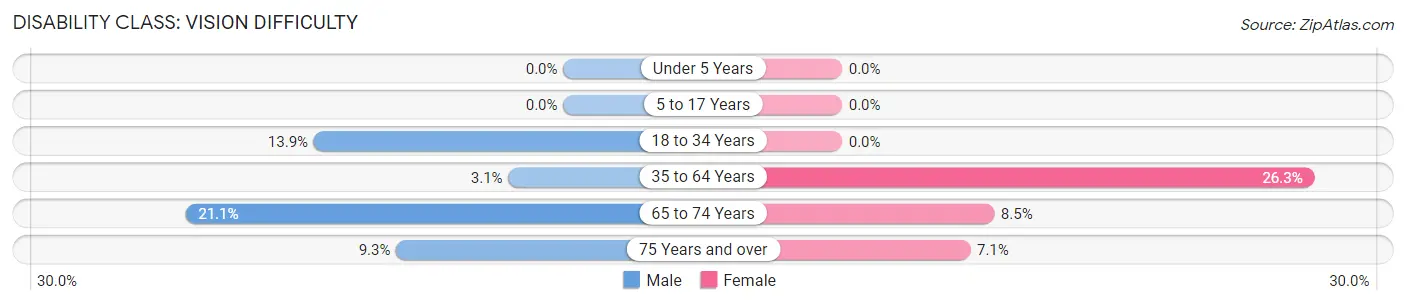
| Age Bracket | Male | Female |
| Under 5 Years | 0 (0.0%) | 0 (0.0%) |
| 5 to 17 Years | 0 (0.0%) | 0 (0.0%) |
| 18 to 34 Years | 5 (13.9%) | 0 (0.0%) |
| 35 to 64 Years | 3 (3.1%) | 40 (26.3%) |
| 65 to 74 Years | 12 (21.0%) | 5 (8.5%) |
| 75 Years and over | 4 (9.3%) | 3 (7.1%) |
Disability Class: Cognitive Difficulty
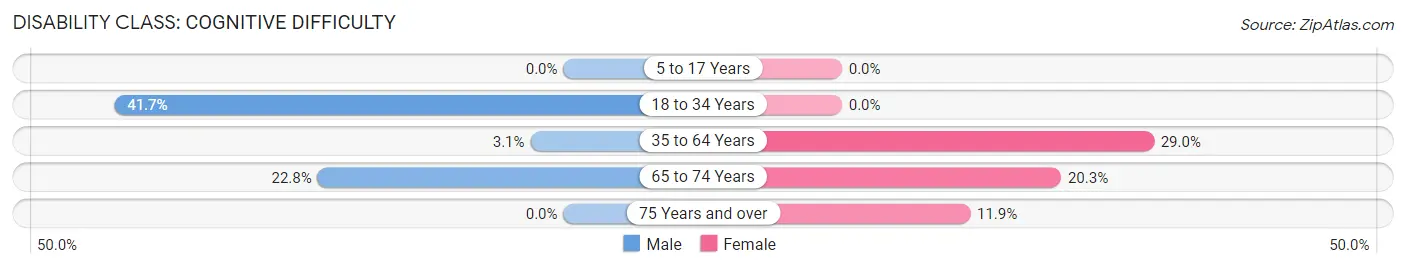
| Age Bracket | Male | Female |
| 5 to 17 Years | 0 (0.0%) | 0 (0.0%) |
| 18 to 34 Years | 15 (41.7%) | 0 (0.0%) |
| 35 to 64 Years | 3 (3.1%) | 44 (28.9%) |
| 65 to 74 Years | 13 (22.8%) | 12 (20.3%) |
| 75 Years and over | 0 (0.0%) | 5 (11.9%) |
Disability Class: Ambulatory Difficulty
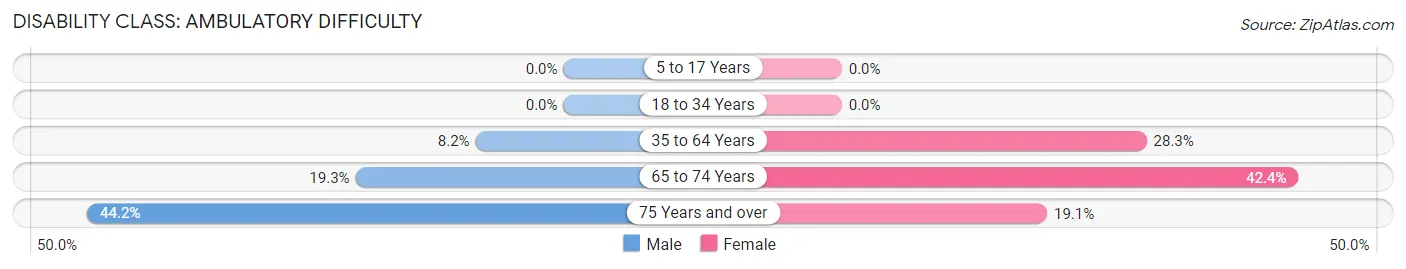
| Age Bracket | Male | Female |
| 5 to 17 Years | 0 (0.0%) | 0 (0.0%) |
| 18 to 34 Years | 0 (0.0%) | 0 (0.0%) |
| 35 to 64 Years | 8 (8.2%) | 43 (28.3%) |
| 65 to 74 Years | 11 (19.3%) | 25 (42.4%) |
| 75 Years and over | 19 (44.2%) | 8 (19.1%) |
Disability Class: Self-Care Difficulty
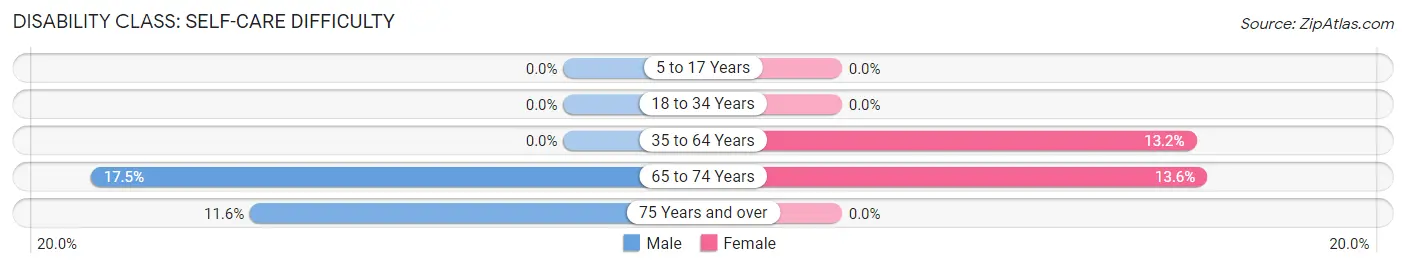
| Age Bracket | Male | Female |
| 5 to 17 Years | 0 (0.0%) | 0 (0.0%) |
| 18 to 34 Years | 0 (0.0%) | 0 (0.0%) |
| 35 to 64 Years | 0 (0.0%) | 20 (13.2%) |
| 65 to 74 Years | 10 (17.5%) | 8 (13.6%) |
| 75 Years and over | 5 (11.6%) | 0 (0.0%) |
Technology Access in West Hamlin
Computing Device Access in West Hamlin
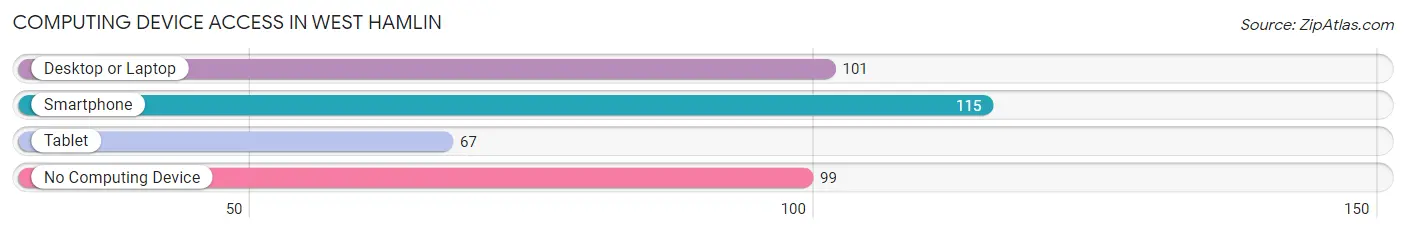
| Device Type | # Households | % Households |
| Desktop or Laptop | 101 | 41.9% |
| Smartphone | 115 | 47.7% |
| Tablet | 67 | 27.8% |
| No Computing Device | 99 | 41.1% |
| Total | 241 | 100.0% |
Internet Access in West Hamlin
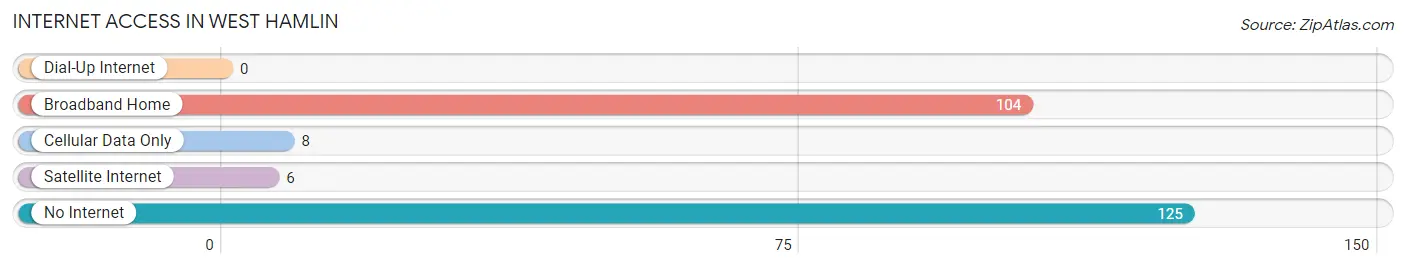
| Internet Type | # Households | % Households |
| Dial-Up Internet | 0 | 0.0% |
| Broadband Home | 104 | 43.1% |
| Cellular Data Only | 8 | 3.3% |
| Satellite Internet | 6 | 2.5% |
| No Internet | 125 | 51.9% |
| Total | 241 | 100.0% |
West Hamlin Summary
History
The town of Hamlin, West Virginia is located in the western part of the state, in the county of Lincoln. It is situated on the banks of the Guyandotte River, and is the county seat of Lincoln County. The town was founded in 1810 by William Hamlin, a Revolutionary War veteran, and was originally known as Hamlin’s Crossroads. The town was incorporated in 1872, and the name was changed to Hamlin in 1891.
The town of Hamlin has a rich history, and has been home to many notable figures throughout its history. The town was the birthplace of the famous American author and poet, Edgar Allan Poe, who was born in 1809. The town was also the home of the first African-American to serve in the West Virginia legislature, William H. Brown.
Geography
Hamlin is located in the western part of West Virginia, in the county of Lincoln. It is situated on the banks of the Guyandotte River, and is the county seat of Lincoln County. The town is located in the Appalachian Mountains, and is surrounded by rolling hills and forests. The town is located approximately 30 miles from the state capital of Charleston, and is approximately 90 miles from the city of Huntington.
The climate in Hamlin is generally mild, with temperatures ranging from the mid-30s in the winter to the mid-80s in the summer. The town receives an average of 40 inches of precipitation per year, with most of it falling in the form of snow in the winter months.
Economy
The economy of Hamlin is largely based on agriculture and tourism. The town is home to several farms, which produce a variety of crops, including corn, soybeans, wheat, and hay. The town is also home to several tourist attractions, including the Edgar Allan Poe Museum, the Lincoln County Historical Museum, and the Hamlin Lake State Park.
The town is also home to several businesses, including restaurants, retail stores, and service providers. The town is also home to several manufacturing companies, including a furniture factory, a paper mill, and a plastics factory.
Demographics
As of the 2010 census, the population of Hamlin was 1,845. The town has a population density of 1,092 people per square mile. The median age of the population is 43.7 years, and the median household income is $35,945. The town is predominantly white, with 92.3% of the population identifying as white. The town also has a small African-American population, with 4.3% of the population identifying as African-American. The town also has a small Hispanic population, with 1.3% of the population identifying as Hispanic. The town also has a small Asian population, with 0.7% of the population identifying as Asian.
Common Questions
What is Per Capita Income in West Hamlin?
Per Capita income in West Hamlin is $26,607.
What is the Median Family Income in West Hamlin?
Median Family Income in West Hamlin is $63,750.
What is the Median Household income in West Hamlin?
Median Household Income in West Hamlin is $36,354.
What is Income or Wage Gap in West Hamlin?
Income or Wage Gap in West Hamlin is 52.8%.
Women in West Hamlin earn 47.2 cents for every dollar earned by a man.
What is Inequality or Gini Index in West Hamlin?
Inequality or Gini Index in West Hamlin is 0.47.
What is the Total Population of West Hamlin?
Total Population of West Hamlin is 553.
What is the Total Male Population of West Hamlin?
Total Male Population of West Hamlin is 248.
What is the Total Female Population of West Hamlin?
Total Female Population of West Hamlin is 305.
What is the Ratio of Males per 100 Females in West Hamlin?
There are 81.31 Males per 100 Females in West Hamlin.
What is the Ratio of Females per 100 Males in West Hamlin?
There are 122.98 Females per 100 Males in West Hamlin.
What is the Median Population Age in West Hamlin?
Median Population Age in West Hamlin is 58.1 Years.
What is the Average Family Size in West Hamlin
Average Family Size in West Hamlin is 3.1 People.
What is the Average Household Size in West Hamlin
Average Household Size in West Hamlin is 2.3 People.
How Large is the Labor Force in West Hamlin?
There are 180 People in the Labor Forcein in West Hamlin.
What is the Percentage of People in the Labor Force in West Hamlin?
34.8% of People are in the Labor Force in West Hamlin.
What is the Unemployment Rate in West Hamlin?
Unemployment Rate in West Hamlin is 5.6%.