Daniels, WV Map & Demographics
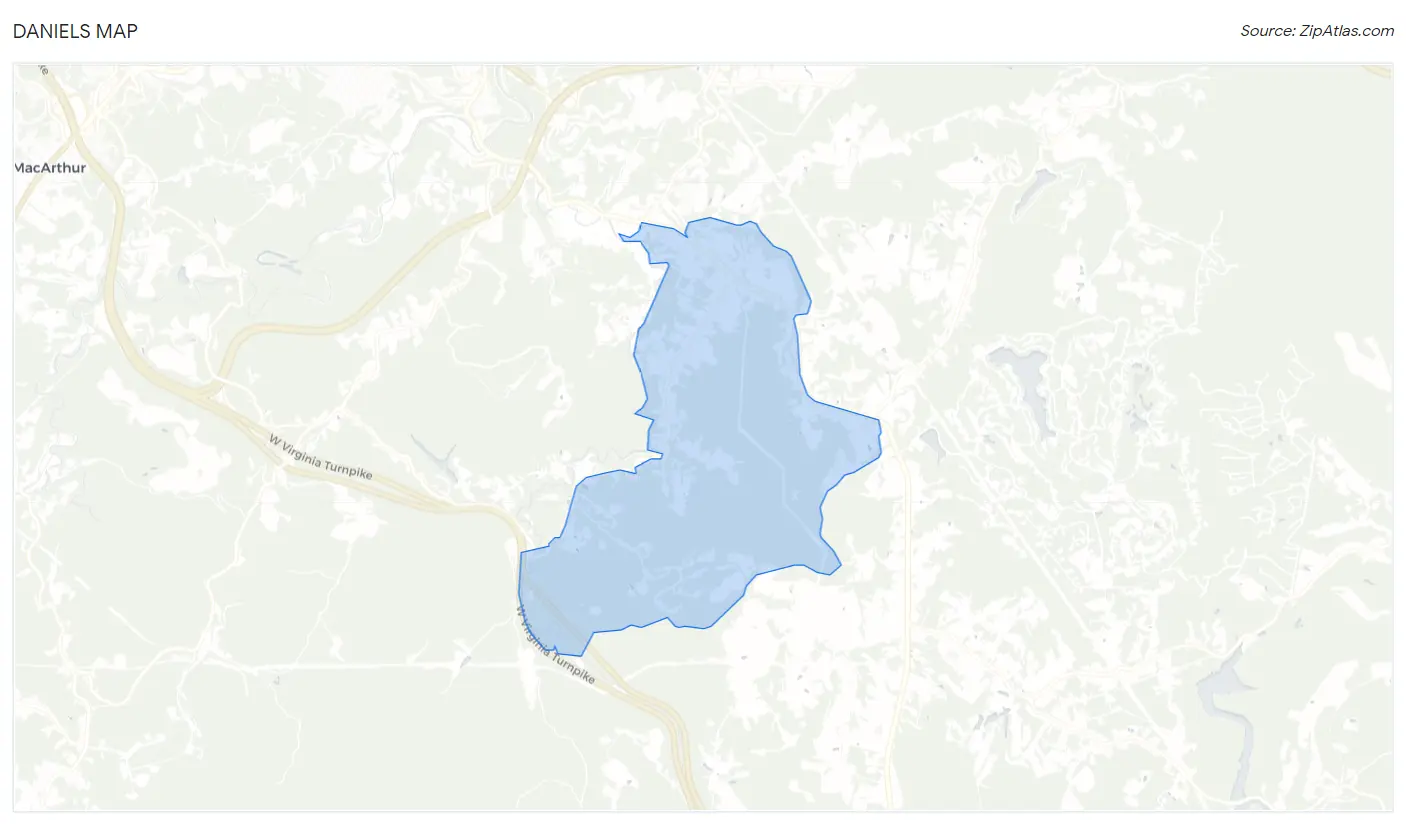
Daniels Map
Daniels Overview
$26,636
PER CAPITA INCOME
$86,563
AVG FAMILY INCOME
$52,061
AVG HOUSEHOLD INCOME
33.5%
WAGE / INCOME GAP [ % ]
66.5¢/ $1
WAGE / INCOME GAP [ $ ]
0.43
INEQUALITY / GINI INDEX
1,564
TOTAL POPULATION
776
MALE POPULATION
788
FEMALE POPULATION
98.48
MALES / 100 FEMALES
101.55
FEMALES / 100 MALES
43.7
MEDIAN AGE
2.8
AVG FAMILY SIZE
2.0
AVG HOUSEHOLD SIZE
685
LABOR FORCE [ PEOPLE ]
51.6%
PERCENT IN LABOR FORCE
3.9%
UNEMPLOYMENT RATE
Daniels Zip Codes
Daniels Area Codes
Income in Daniels
Income Overview in Daniels
Per Capita Income in Daniels is $26,636, while median incomes of families and households are $86,563 and $52,061 respectively.
| Characteristic | Number | Measure |
| Per Capita Income | 1,564 | $26,636 |
| Median Family Income | 383 | $86,563 |
| Mean Family Income | 383 | $69,530 |
| Median Household Income | 759 | $52,061 |
| Mean Household Income | 759 | $54,983 |
| Income Deficit | 383 | $0 |
| Wage / Income Gap (%) | 1,564 | 33.55% |
| Wage / Income Gap ($) | 1,564 | 66.45¢ per $1 |
| Gini / Inequality Index | 1,564 | 0.43 |
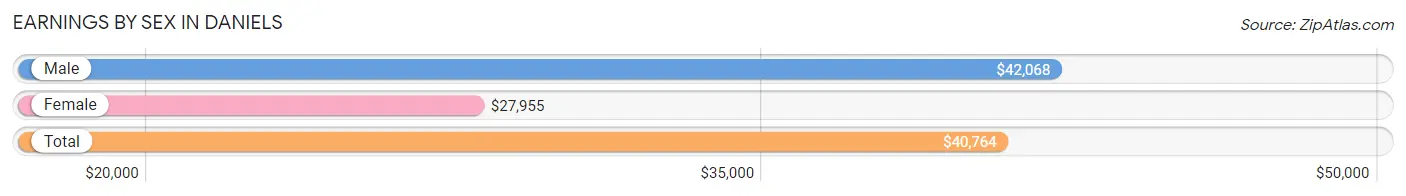
Earnings by Sex in Daniels
Average Earnings in Daniels are $40,764, $42,068 for men and $27,955 for women, a difference of 33.6%.
| Sex | Number | Average Earnings |
| Male | 411 (62.4%) | $42,068 |
| Female | 248 (37.6%) | $27,955 |
| Total | 659 (100.0%) | $40,764 |
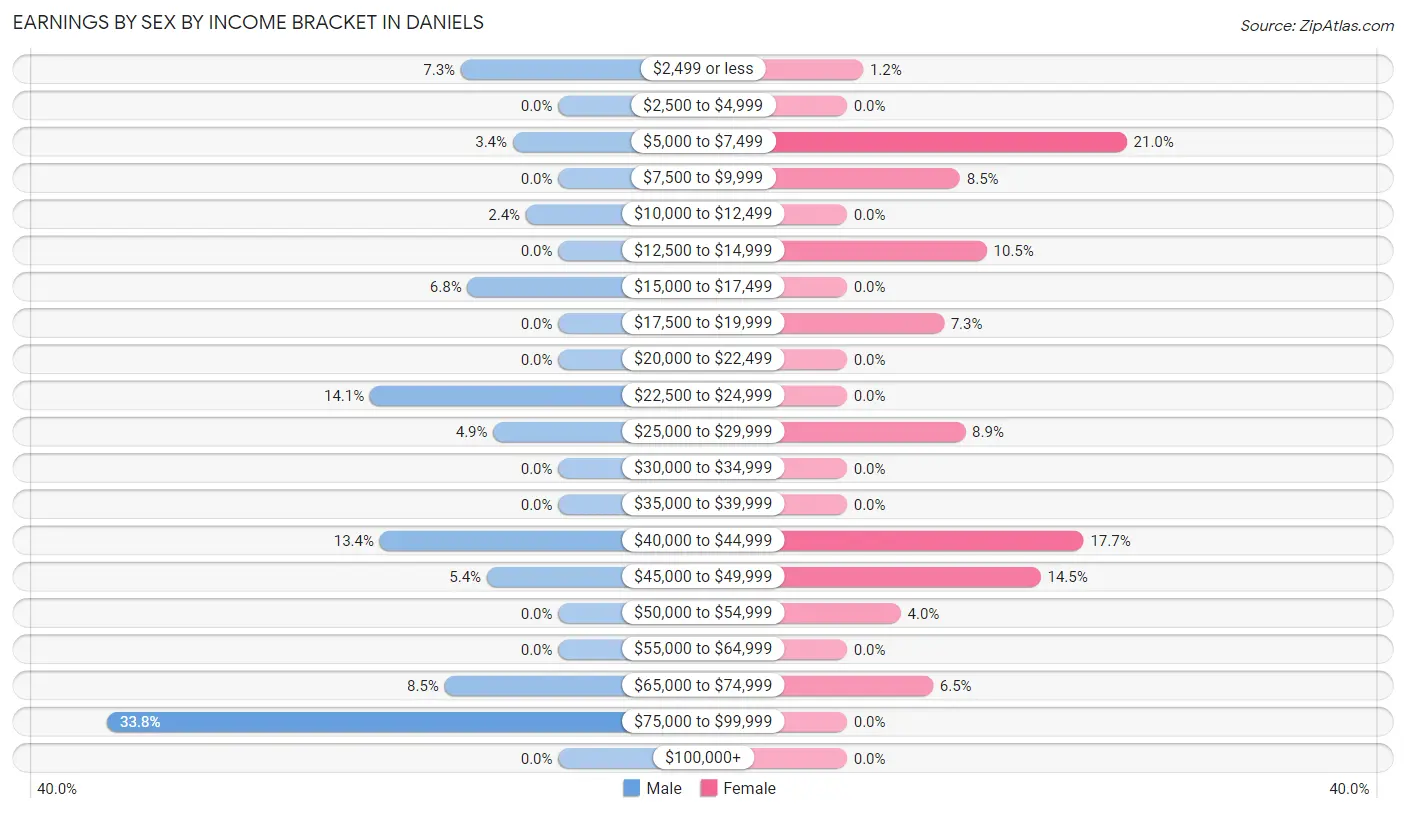
Earnings by Sex by Income Bracket in Daniels
The most common earnings brackets in Daniels are $75,000 to $99,999 for men (139 | 33.8%) and $5,000 to $7,499 for women (52 | 21.0%).
| Income | Male | Female |
| $2,499 or less | 30 (7.3%) | 3 (1.2%) |
| $2,500 to $4,999 | 0 (0.0%) | 0 (0.0%) |
| $5,000 to $7,499 | 14 (3.4%) | 52 (21.0%) |
| $7,500 to $9,999 | 0 (0.0%) | 21 (8.5%) |
| $10,000 to $12,499 | 10 (2.4%) | 0 (0.0%) |
| $12,500 to $14,999 | 0 (0.0%) | 26 (10.5%) |
| $15,000 to $17,499 | 28 (6.8%) | 0 (0.0%) |
| $17,500 to $19,999 | 0 (0.0%) | 18 (7.3%) |
| $20,000 to $22,499 | 0 (0.0%) | 0 (0.0%) |
| $22,500 to $24,999 | 58 (14.1%) | 0 (0.0%) |
| $25,000 to $29,999 | 20 (4.9%) | 22 (8.9%) |
| $30,000 to $34,999 | 0 (0.0%) | 0 (0.0%) |
| $35,000 to $39,999 | 0 (0.0%) | 0 (0.0%) |
| $40,000 to $44,999 | 55 (13.4%) | 44 (17.7%) |
| $45,000 to $49,999 | 22 (5.3%) | 36 (14.5%) |
| $50,000 to $54,999 | 0 (0.0%) | 10 (4.0%) |
| $55,000 to $64,999 | 0 (0.0%) | 0 (0.0%) |
| $65,000 to $74,999 | 35 (8.5%) | 16 (6.5%) |
| $75,000 to $99,999 | 139 (33.8%) | 0 (0.0%) |
| $100,000+ | 0 (0.0%) | 0 (0.0%) |
| Total | 411 (100.0%) | 248 (100.0%) |
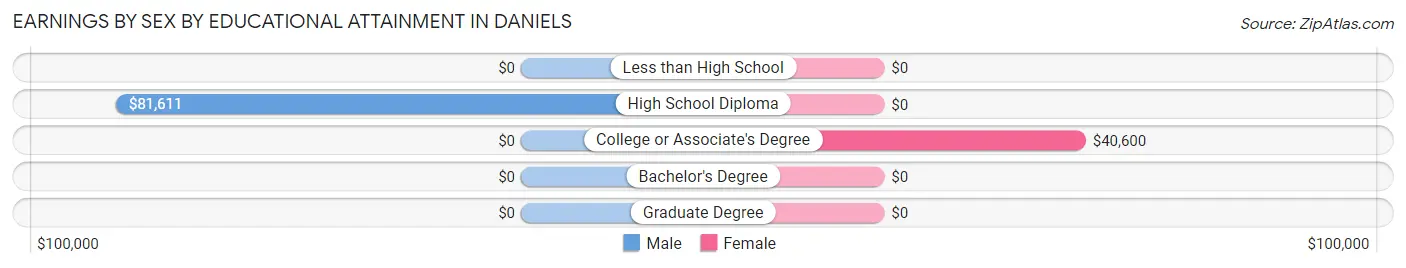
Earnings by Sex by Educational Attainment in Daniels
Average earnings in Daniels are $70,278 for men and $40,607 for women, a difference of 42.2%. Men with an educational attainment of high school diploma enjoy the highest average annual earnings of $81,611, while those with high school diploma education earn the least with $81,611. Women with an educational attainment of college or associate's degree earn the most with the average annual earnings of $40,600, while those with college or associate's degree education have the smallest earnings of $40,600.
| Educational Attainment | Male Income | Female Income |
| Less than High School | - | - |
| High School Diploma | $81,611 | $0 |
| College or Associate's Degree | - | - |
| Bachelor's Degree | - | - |
| Graduate Degree | - | - |
| Total | $70,278 | $40,607 |
Family Income in Daniels
Family Income Brackets in Daniels
According to the Daniels family income data, there are 147 families falling into the $100,000 to $149,999 income range, which is the most common income bracket and makes up 38.4% of all families.
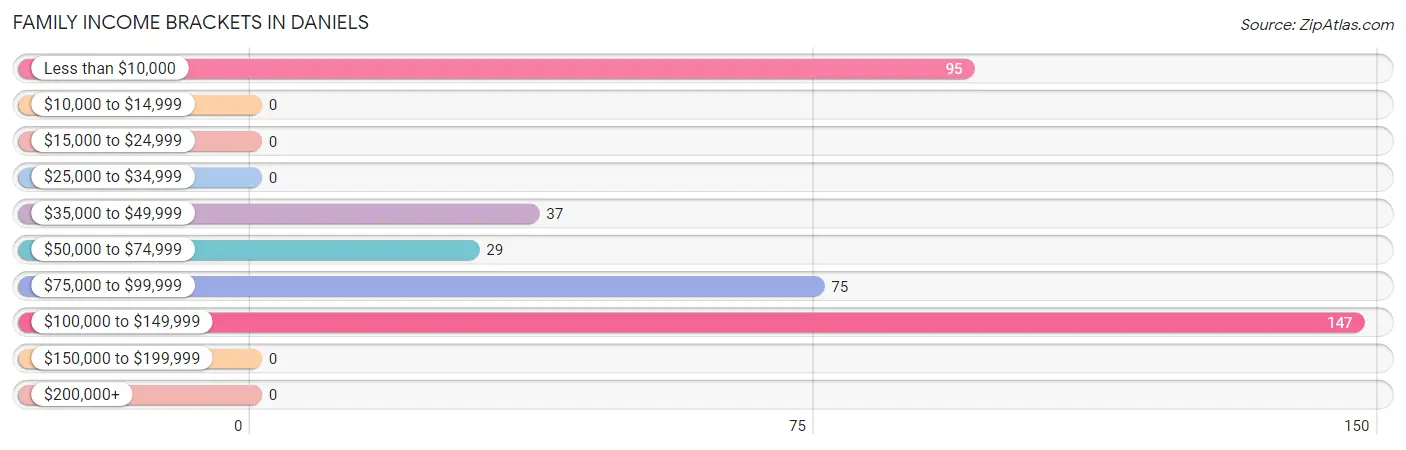
| Income Bracket | # Families | % Families |
| Less than $10,000 | 95 | 24.8% |
| $10,000 to $14,999 | 0 | 0.0% |
| $15,000 to $24,999 | 0 | 0.0% |
| $25,000 to $34,999 | 0 | 0.0% |
| $35,000 to $49,999 | 37 | 9.7% |
| $50,000 to $74,999 | 29 | 7.6% |
| $75,000 to $99,999 | 75 | 19.6% |
| $100,000 to $149,999 | 147 | 38.4% |
| $150,000 to $199,999 | 0 | 0.0% |
| $200,000+ | 0 | 0.0% |
Family Income by Famaliy Size in Daniels
4-person families (132 | 34.5%) account for the highest median family income in Daniels with $103,548 per family, while 4-person families (132 | 34.5%) have the highest median income of $25,887 per family member.
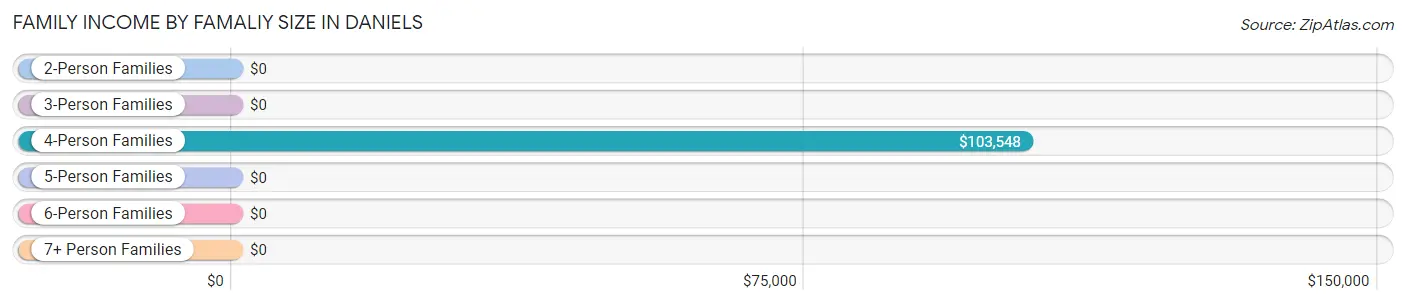
| Income Bracket | # Families | Median Income |
| 2-Person Families | 214 (55.9%) | $0 |
| 3-Person Families | 37 (9.7%) | $0 |
| 4-Person Families | 132 (34.5%) | $103,548 |
| 5-Person Families | 0 (0.0%) | $0 |
| 6-Person Families | 0 (0.0%) | $0 |
| 7+ Person Families | 0 (0.0%) | $0 |
| Total | 383 (100.0%) | $86,563 |
Family Income by Number of Earners in Daniels
The median family income in Daniels is $86,563, with families comprising 3+ earners (52) having the highest median family income of $117,976, while families with no earners (124) have the lowest median family income of $2,499, accounting for 13.6% and 32.4% of families, respectively.
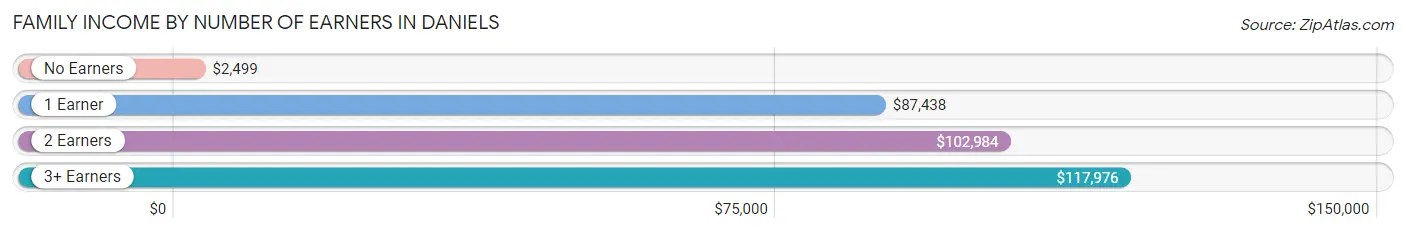
| Number of Earners | # Families | Median Income |
| No Earners | 124 (32.4%) | $2,499 |
| 1 Earner | 107 (27.9%) | $87,438 |
| 2 Earners | 100 (26.1%) | $102,984 |
| 3+ Earners | 52 (13.6%) | $117,976 |
| Total | 383 (100.0%) | $86,563 |
Household Income in Daniels
Household Income Brackets in Daniels
With 197 households falling in the category, the less than $10,000 income range is the most frequent in Daniels, accounting for 26.0% of all households.
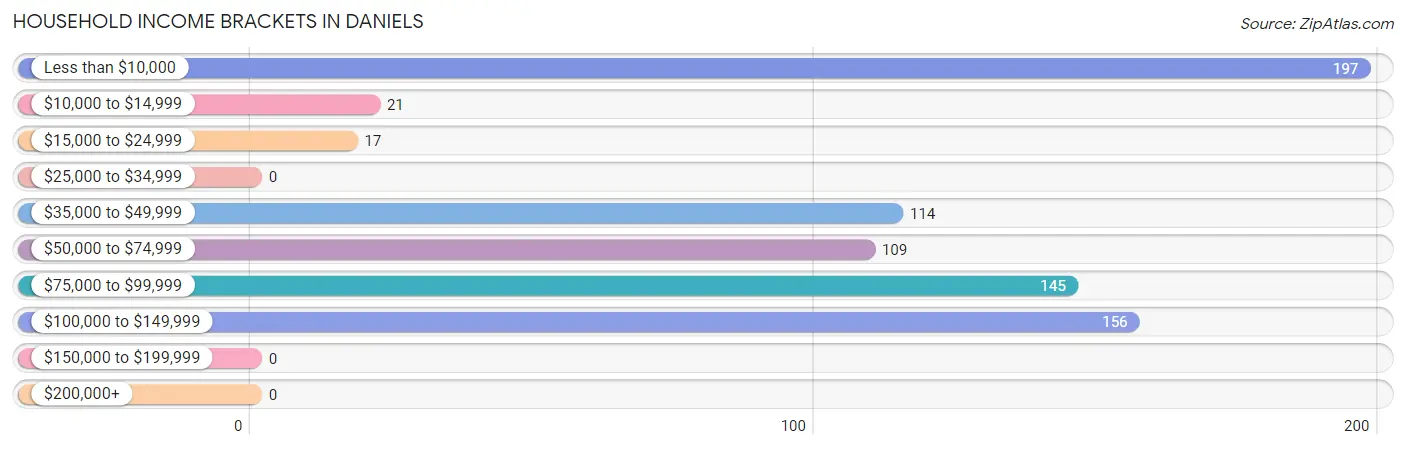
| Income Bracket | # Households | % Households |
| Less than $10,000 | 197 | 26.0% |
| $10,000 to $14,999 | 21 | 2.8% |
| $15,000 to $24,999 | 17 | 2.2% |
| $25,000 to $34,999 | 0 | 0.0% |
| $35,000 to $49,999 | 114 | 15.0% |
| $50,000 to $74,999 | 109 | 14.4% |
| $75,000 to $99,999 | 145 | 19.1% |
| $100,000 to $149,999 | 156 | 20.6% |
| $150,000 to $199,999 | 0 | 0.0% |
| $200,000+ | 0 | 0.0% |
Household Income by Householder Age in Daniels
The median household income in Daniels is $52,061, with the highest median household income of $78,359 found in the 25 to 44 years age bracket for the primary householder. A total of 209 households (27.5%) fall into this category. Meanwhile, the 15 to 24 years age bracket for the primary householder has the lowest median household income of $0, with 17 households (2.2%) in this group.
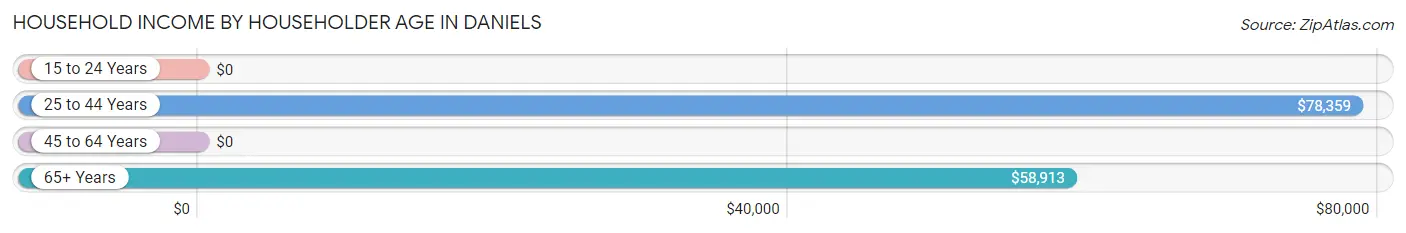
| Income Bracket | # Households | Median Income |
| 15 to 24 Years | 17 (2.2%) | $0 |
| 25 to 44 Years | 209 (27.5%) | $78,359 |
| 45 to 64 Years | 305 (40.2%) | $0 |
| 65+ Years | 228 (30.0%) | $58,913 |
| Total | 759 (100.0%) | $52,061 |
Poverty in Daniels
Income Below Poverty by Sex and Age in Daniels
With 23.2% poverty level for males and 21.3% for females among the residents of Daniels, 55 to 64 year old males and 55 to 64 year old females are the most vulnerable to poverty, with 117 males (85.4%) and 145 females (89.0%) in their respective age groups living below the poverty level.
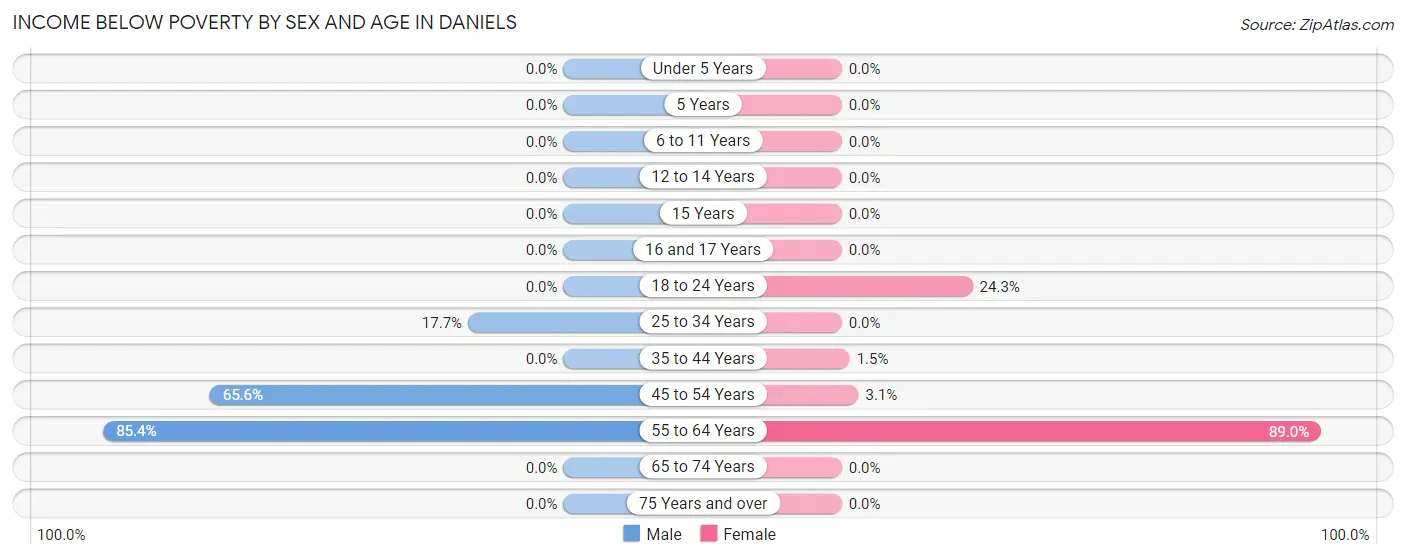
| Age Bracket | Male | Female |
| Under 5 Years | 0 (0.0%) | 0 (0.0%) |
| 5 Years | 0 (0.0%) | 0 (0.0%) |
| 6 to 11 Years | 0 (0.0%) | 0 (0.0%) |
| 12 to 14 Years | 0 (0.0%) | 0 (0.0%) |
| 15 Years | 0 (0.0%) | 0 (0.0%) |
| 16 and 17 Years | 0 (0.0%) | 0 (0.0%) |
| 18 to 24 Years | 0 (0.0%) | 17 (24.3%) |
| 25 to 34 Years | 14 (17.7%) | 0 (0.0%) |
| 35 to 44 Years | 0 (0.0%) | 1 (1.5%) |
| 45 to 54 Years | 42 (65.6%) | 2 (3.1%) |
| 55 to 64 Years | 117 (85.4%) | 145 (89.0%) |
| 65 to 74 Years | 0 (0.0%) | 0 (0.0%) |
| 75 Years and over | 0 (0.0%) | 0 (0.0%) |
| Total | 173 (23.2%) | 165 (21.3%) |
Income Above Poverty by Sex and Age in Daniels
According to the poverty statistics in Daniels, males aged 5 years and females aged under 5 years are the age groups that are most secure financially, with 100.0% of males and 100.0% of females in these age groups living above the poverty line.
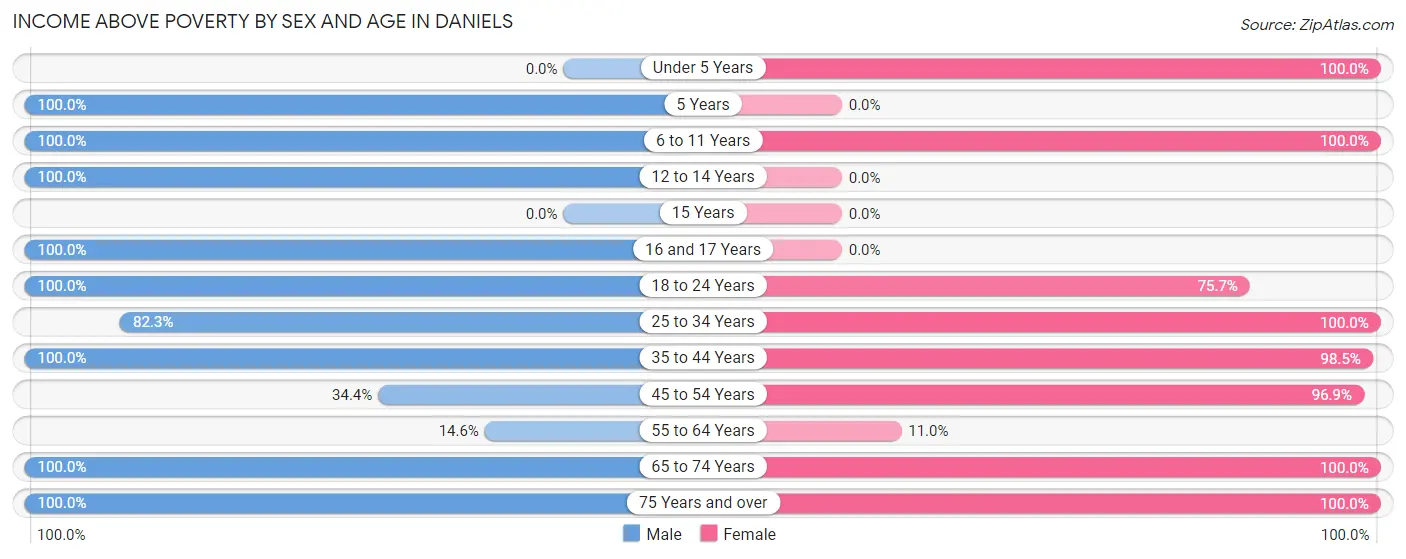
| Age Bracket | Male | Female |
| Under 5 Years | 0 (0.0%) | 44 (100.0%) |
| 5 Years | 21 (100.0%) | 0 (0.0%) |
| 6 to 11 Years | 57 (100.0%) | 87 (100.0%) |
| 12 to 14 Years | 26 (100.0%) | 0 (0.0%) |
| 15 Years | 0 (0.0%) | 0 (0.0%) |
| 16 and 17 Years | 21 (100.0%) | 0 (0.0%) |
| 18 to 24 Years | 96 (100.0%) | 53 (75.7%) |
| 25 to 34 Years | 65 (82.3%) | 98 (100.0%) |
| 35 to 44 Years | 154 (100.0%) | 67 (98.5%) |
| 45 to 54 Years | 22 (34.4%) | 62 (96.9%) |
| 55 to 64 Years | 20 (14.6%) | 18 (11.0%) |
| 65 to 74 Years | 51 (100.0%) | 135 (100.0%) |
| 75 Years and over | 39 (100.0%) | 46 (100.0%) |
| Total | 572 (76.8%) | 610 (78.7%) |
Income Below Poverty Among Married-Couple Families in Daniels
The poverty statistics for married-couple families in Daniels show that 28.1% or 95 of the total 338 families live below the poverty line. Families with no children have the highest poverty rate of 56.2%, comprising of 95 families. On the other hand, families with 1 or 2 children have the lowest poverty rate of 0.0%, which includes 0 families.
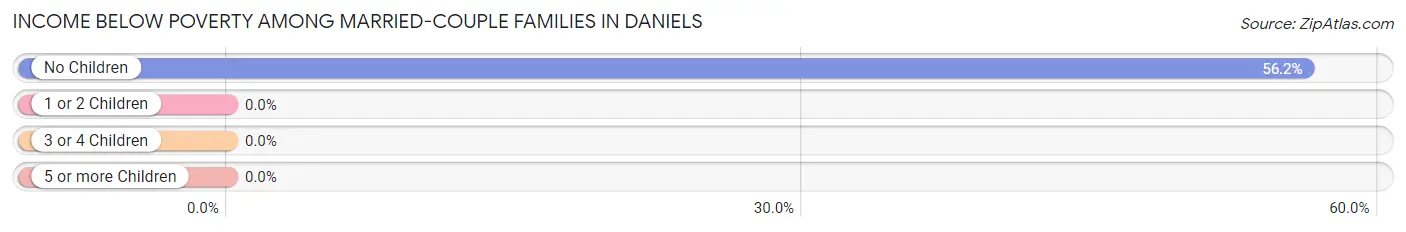
| Children | Above Poverty | Below Poverty |
| No Children | 74 (43.8%) | 95 (56.2%) |
| 1 or 2 Children | 169 (100.0%) | 0 (0.0%) |
| 3 or 4 Children | 0 (0.0%) | 0 (0.0%) |
| 5 or more Children | 0 (0.0%) | 0 (0.0%) |
| Total | 243 (71.9%) | 95 (28.1%) |
Income Below Poverty Among Single-Parent Households in Daniels
| Children | Single Father | Single Mother |
| No Children | 0 (0.0%) | 0 (0.0%) |
| 1 or 2 Children | 0 (0.0%) | 0 (0.0%) |
| 3 or 4 Children | 0 (0.0%) | 0 (0.0%) |
| 5 or more Children | 0 (0.0%) | 0 (0.0%) |
| Total | 0 (0.0%) | 0 (0.0%) |
Income Below Poverty Among Married-Couple vs Single-Parent Households in Daniels
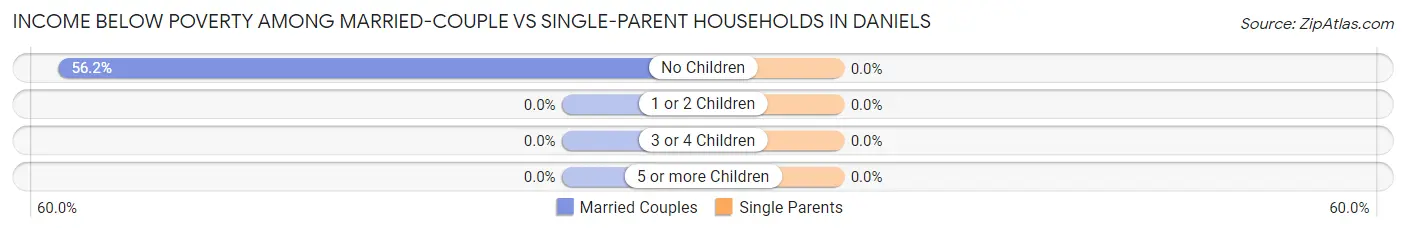
| Children | Married-Couple Families | Single-Parent Households |
| No Children | 95 (56.2%) | 0 (0.0%) |
| 1 or 2 Children | 0 (0.0%) | 0 (0.0%) |
| 3 or 4 Children | 0 (0.0%) | 0 (0.0%) |
| 5 or more Children | 0 (0.0%) | 0 (0.0%) |
| Total | 95 (28.1%) | 0 (0.0%) |
Race in Daniels
The most populous races in Daniels are White / Caucasian (1,535 | 98.2%), Black / African American (28 | 1.8%), and Hispanic or Latino (1 | 0.1%).
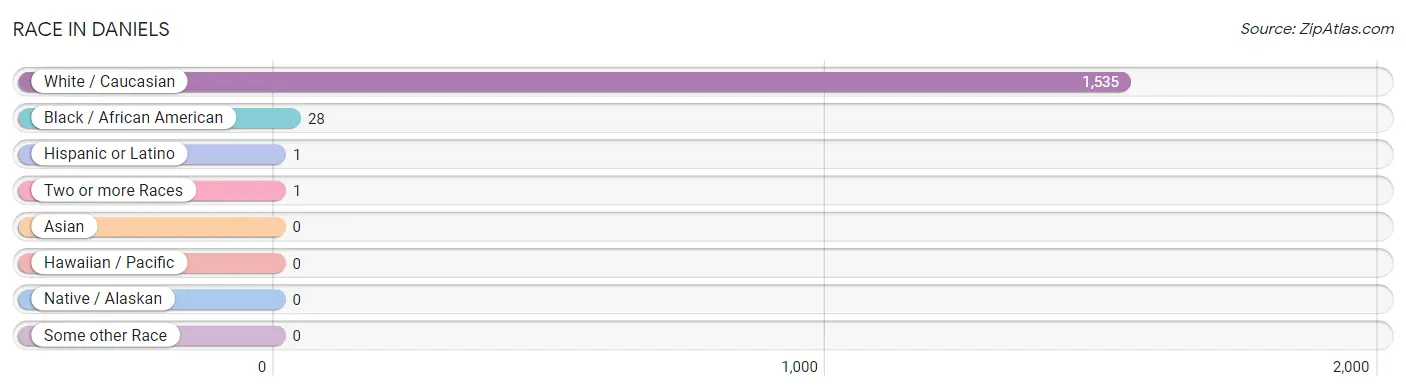
| Race | # Population | % Population |
| Asian | 0 | 0.0% |
| Black / African American | 28 | 1.8% |
| Hawaiian / Pacific | 0 | 0.0% |
| Hispanic or Latino | 1 | 0.1% |
| Native / Alaskan | 0 | 0.0% |
| White / Caucasian | 1,535 | 98.2% |
| Two or more Races | 1 | 0.1% |
| Some other Race | 0 | 0.0% |
| Total | 1,564 | 100.0% |
Ancestry in Daniels
The most populous ancestries reported in Daniels are English (486 | 31.1%), Irish (130 | 8.3%), German (105 | 6.7%), American (89 | 5.7%), and British (33 | 2.1%), together accounting for 53.9% of all Daniels residents.
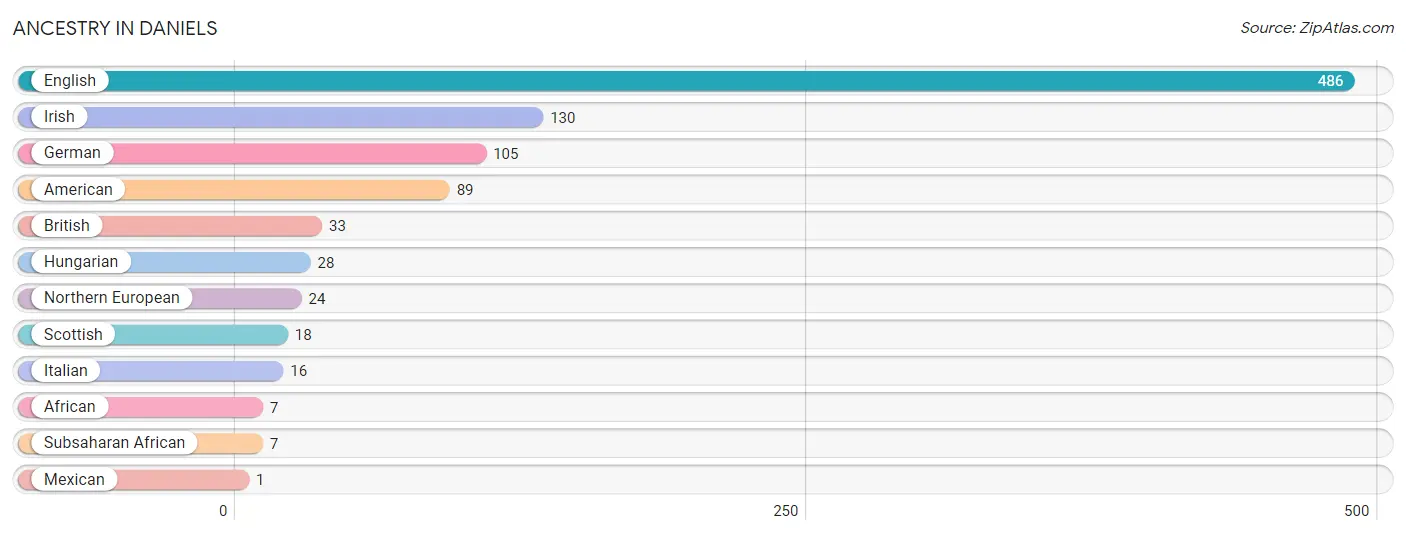
| Ancestry | # Population | % Population |
| African | 7 | 0.4% |
| American | 89 | 5.7% |
| British | 33 | 2.1% |
| English | 486 | 31.1% |
| German | 105 | 6.7% |
| Hungarian | 28 | 1.8% |
| Irish | 130 | 8.3% |
| Italian | 16 | 1.0% |
| Mexican | 1 | 0.1% |
| Northern European | 24 | 1.5% |
| Scottish | 18 | 1.1% |
| Subsaharan African | 7 | 0.4% | View All 12 Rows |
Immigrants in Daniels

| Immigration Origin | # Population | % Population | View All 0 Rows |
Sex and Age in Daniels
Sex and Age in Daniels
The most populous age groups in Daniels are 40 to 44 Years (154 | 19.9%) for men and 60 to 64 Years (117 | 14.8%) for women.
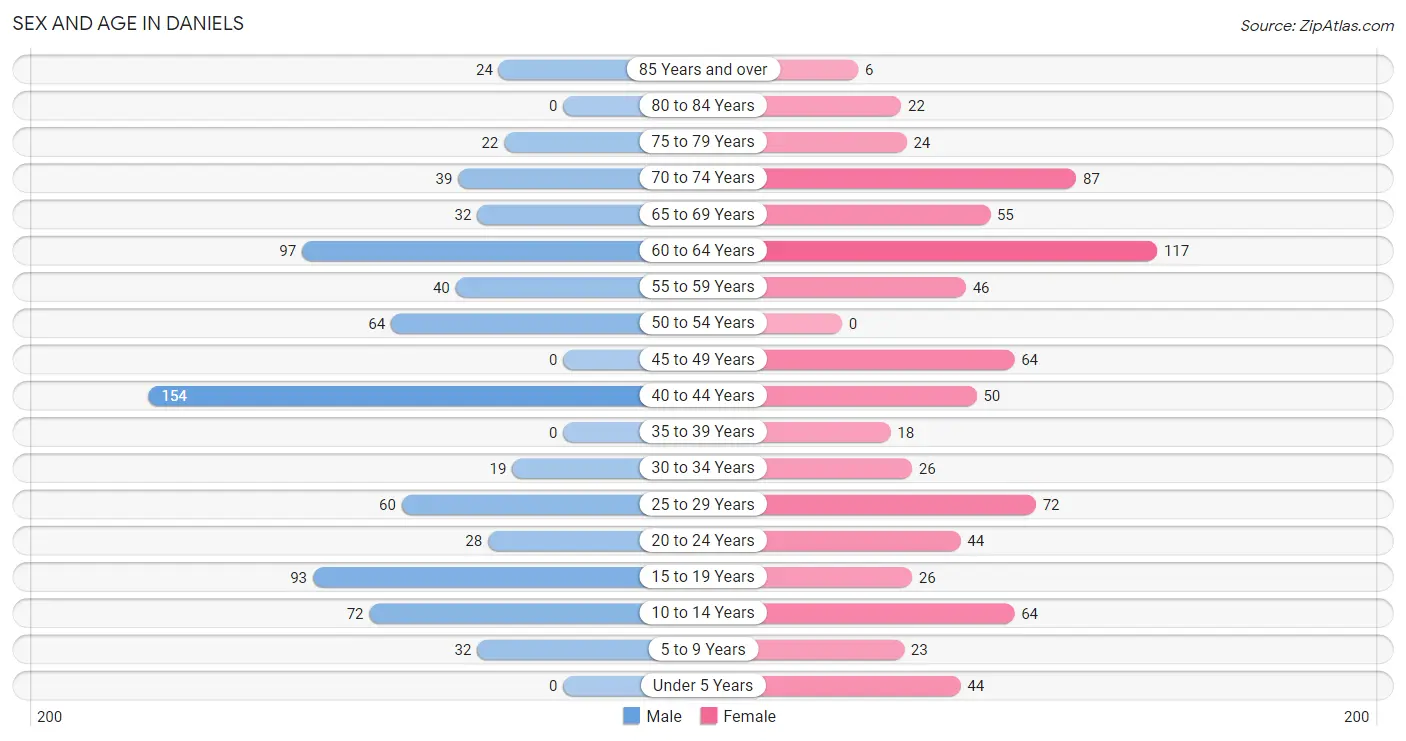
| Age Bracket | Male | Female |
| Under 5 Years | 0 (0.0%) | 44 (5.6%) |
| 5 to 9 Years | 32 (4.1%) | 23 (2.9%) |
| 10 to 14 Years | 72 (9.3%) | 64 (8.1%) |
| 15 to 19 Years | 93 (12.0%) | 26 (3.3%) |
| 20 to 24 Years | 28 (3.6%) | 44 (5.6%) |
| 25 to 29 Years | 60 (7.7%) | 72 (9.1%) |
| 30 to 34 Years | 19 (2.5%) | 26 (3.3%) |
| 35 to 39 Years | 0 (0.0%) | 18 (2.3%) |
| 40 to 44 Years | 154 (19.9%) | 50 (6.4%) |
| 45 to 49 Years | 0 (0.0%) | 64 (8.1%) |
| 50 to 54 Years | 64 (8.3%) | 0 (0.0%) |
| 55 to 59 Years | 40 (5.1%) | 46 (5.8%) |
| 60 to 64 Years | 97 (12.5%) | 117 (14.8%) |
| 65 to 69 Years | 32 (4.1%) | 55 (7.0%) |
| 70 to 74 Years | 39 (5.0%) | 87 (11.0%) |
| 75 to 79 Years | 22 (2.8%) | 24 (3.0%) |
| 80 to 84 Years | 0 (0.0%) | 22 (2.8%) |
| 85 Years and over | 24 (3.1%) | 6 (0.8%) |
| Total | 776 (100.0%) | 788 (100.0%) |
Families and Households in Daniels
Median Family Size in Daniels
The median family size in Daniels is 2.83 persons per family, with married-couple families (338 | 88.2%) accounting for the largest median family size of 2.92 persons per family. On the other hand, single female/mother families (25 | 6.5%) represent the smallest median family size with 1.96 persons per family.
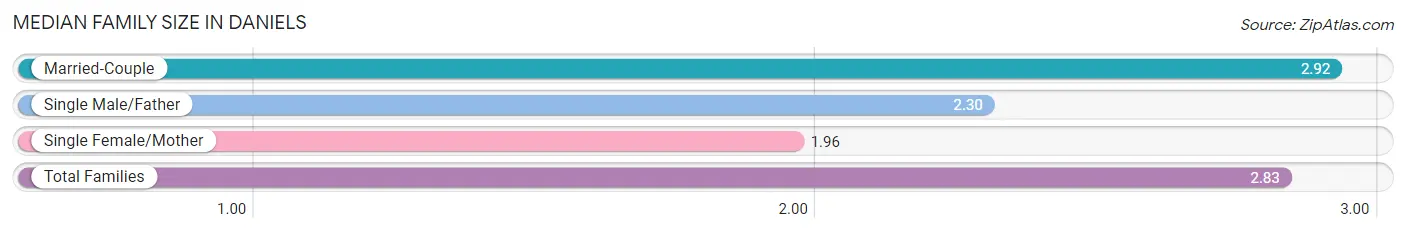
| Family Type | # Families | Family Size |
| Married-Couple | 338 (88.2%) | 2.92 |
| Single Male/Father | 20 (5.2%) | 2.30 |
| Single Female/Mother | 25 (6.5%) | 1.96 |
| Total Families | 383 (100.0%) | 2.83 |
Median Household Size in Daniels
The median household size in Daniels is 1.99 persons per household, with single male/father households (20 | 2.6%) accounting for the largest median household size of 3.7 persons per household. non-family households (376 | 49.5%) represent the smallest median household size with 1.06 persons per household.
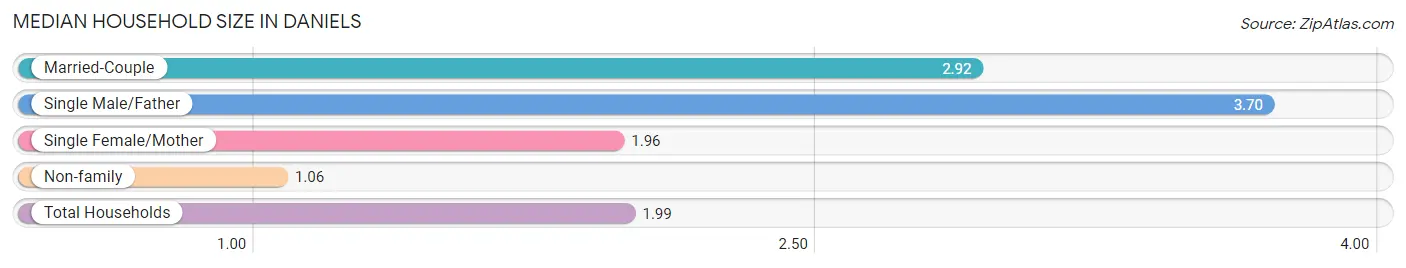
| Household Type | # Households | Household Size |
| Married-Couple | 338 (44.5%) | 2.92 |
| Single Male/Father | 20 (2.6%) | 3.70 |
| Single Female/Mother | 25 (3.3%) | 1.96 |
| Non-family | 376 (49.5%) | 1.06 |
| Total Households | 759 (100.0%) | 1.99 |
Household Size by Marriage Status in Daniels
Out of a total of 759 households in Daniels, 383 (50.5%) are family households, while 376 (49.5%) are nonfamily households. The most numerous type of family households are 2-person households, comprising 194, and the most common type of nonfamily households are 1-person households, comprising 351.
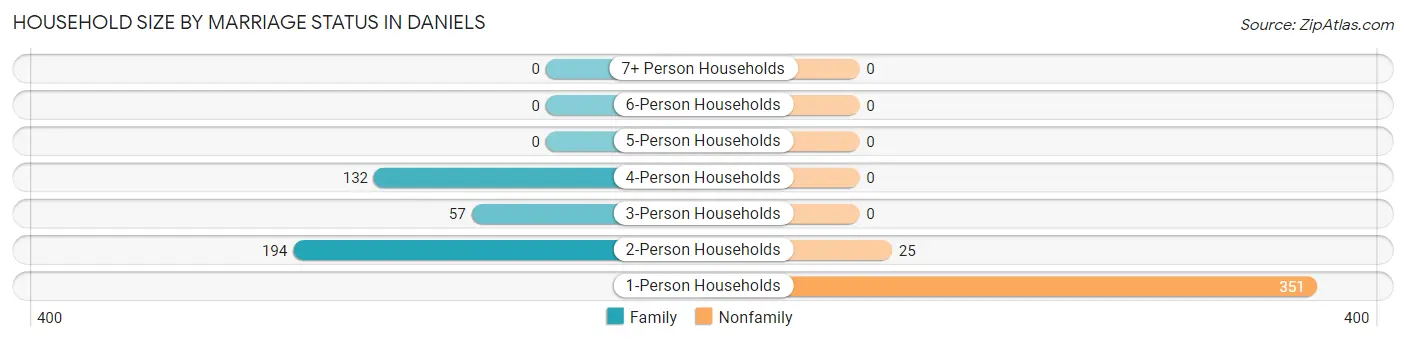
| Household Size | Family Households | Nonfamily Households |
| 1-Person Households | - | 351 (46.3%) |
| 2-Person Households | 194 (25.6%) | 25 (3.3%) |
| 3-Person Households | 57 (7.5%) | 0 (0.0%) |
| 4-Person Households | 132 (17.4%) | 0 (0.0%) |
| 5-Person Households | 0 (0.0%) | 0 (0.0%) |
| 6-Person Households | 0 (0.0%) | 0 (0.0%) |
| 7+ Person Households | 0 (0.0%) | 0 (0.0%) |
| Total | 383 (50.5%) | 376 (49.5%) |
Female Fertility in Daniels
Fertility by Age in Daniels
| Age Bracket | Women with Births | Births / 1,000 Women |
| 15 to 19 years | 0 (0.0%) | 0.0 |
| 20 to 34 years | 0 (0.0%) | 0.0 |
| 35 to 50 years | 0 (0.0%) | 0.0 |
| Total | 0 (0.0%) | 0.0 |
Fertility by Age by Marriage Status in Daniels
| Age Bracket | Married | Unmarried |
| 15 to 19 years | 0 (0.0%) | 0 (0.0%) |
| 20 to 34 years | 0 (0.0%) | 0 (0.0%) |
| 35 to 50 years | 0 (0.0%) | 0 (0.0%) |
| Total | 0 (0.0%) | 0 (0.0%) |
Fertility by Education in Daniels
| Educational Attainment | Women with Births | Births / 1,000 Women |
| Less than High School | 0 (0.0%) | 0.0 |
| High School Diploma | 0 (0.0%) | 0.0 |
| College or Associate's Degree | 0 (0.0%) | 0.0 |
| Bachelor's Degree | 0 (0.0%) | 0.0 |
| Graduate Degree | 0 (0.0%) | 0.0 |
| Total | 0 (0.0%) | 0.0 |
Fertility by Education by Marriage Status in Daniels
| Educational Attainment | Married | Unmarried |
| Less than High School | 0 (0.0%) | 0 (0.0%) |
| High School Diploma | 0 (0.0%) | 0 (0.0%) |
| College or Associate's Degree | 0 (0.0%) | 0 (0.0%) |
| Bachelor's Degree | 0 (0.0%) | 0 (0.0%) |
| Graduate Degree | 0 (0.0%) | 0 (0.0%) |
| Total | 0 (0.0%) | 0 (0.0%) |
Employment Characteristics in Daniels
Employment by Class of Employer in Daniels
Among the 659 employed individuals in Daniels, private company employees (477 | 72.4%), federal government employees (93 | 14.1%), and state government employees (37 | 5.6%) make up the most common classes of employment.
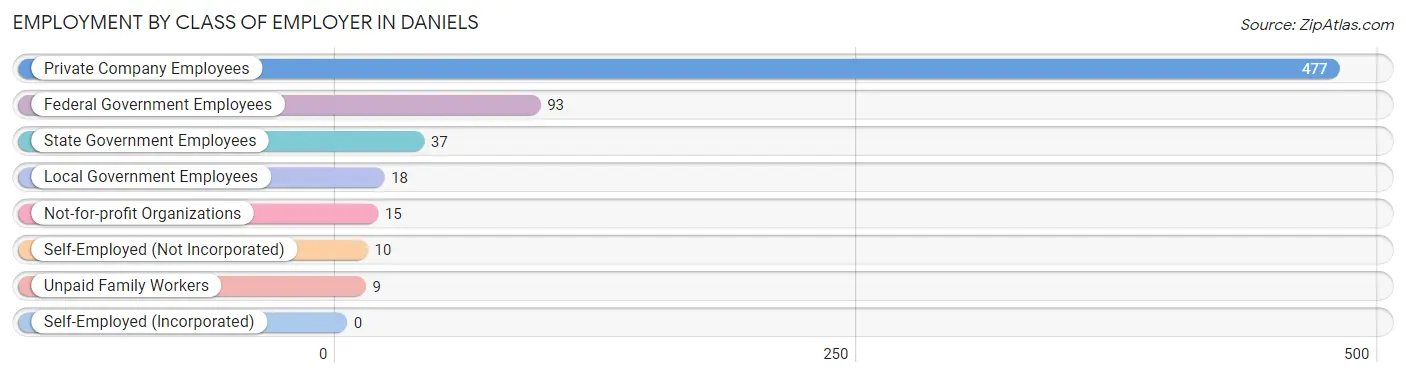
| Employer Class | # Employees | % Employees |
| Private Company Employees | 477 | 72.4% |
| Self-Employed (Incorporated) | 0 | 0.0% |
| Self-Employed (Not Incorporated) | 10 | 1.5% |
| Not-for-profit Organizations | 15 | 2.3% |
| Local Government Employees | 18 | 2.7% |
| State Government Employees | 37 | 5.6% |
| Federal Government Employees | 93 | 14.1% |
| Unpaid Family Workers | 9 | 1.4% |
| Total | 659 | 100.0% |
Employment Status by Age in Daniels
According to the labor force statistics for Daniels, out of the total population over 16 years of age (1,327), 51.6% or 685 individuals are in the labor force, with 3.9% or 27 of them unemployed. The age group with the highest labor force participation rate is 20 to 24 years, with 100.0% or 72 individuals in the labor force. Within the labor force, the 20 to 24 years age range has the highest percentage of unemployed individuals, with 23.6% or 17 of them being unemployed.
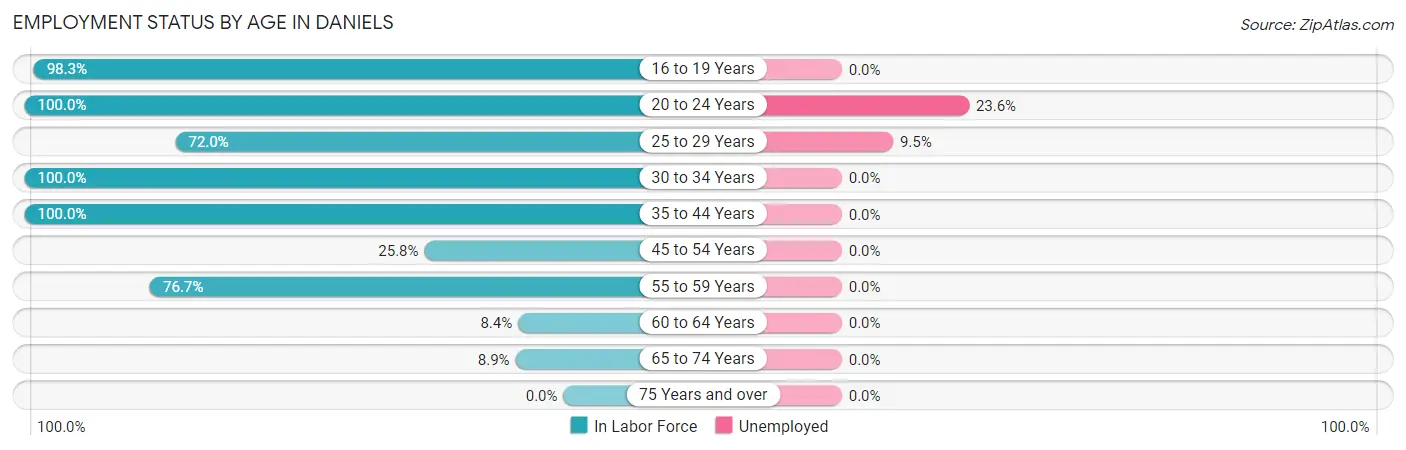
| Age Bracket | In Labor Force | Unemployed |
| 16 to 19 Years | 115 (98.3%) | 0 (0.0%) |
| 20 to 24 Years | 72 (100.0%) | 17 (23.6%) |
| 25 to 29 Years | 95 (72.0%) | 9 (9.5%) |
| 30 to 34 Years | 45 (100.0%) | 0 (0.0%) |
| 35 to 44 Years | 222 (100.0%) | 0 (0.0%) |
| 45 to 54 Years | 33 (25.8%) | 0 (0.0%) |
| 55 to 59 Years | 66 (76.7%) | 0 (0.0%) |
| 60 to 64 Years | 18 (8.4%) | 0 (0.0%) |
| 65 to 74 Years | 19 (8.9%) | 0 (0.0%) |
| 75 Years and over | 0 (0.0%) | 0 (0.0%) |
| Total | 685 (51.6%) | 27 (3.9%) |
Employment Status by Educational Attainment in Daniels
According to labor force statistics for Daniels, 57.9% of individuals (479) out of the total population between 25 and 64 years of age (827) are in the labor force, with 1.9% or 9 of them being unemployed. The group with the highest labor force participation rate are those with the educational attainment of bachelor's degree or higher, with 100.0% or 76 individuals in the labor force. Within the labor force, individuals with college / associate degree education have the highest percentage of unemployment, with 4.0% or 9 of them being unemployed.
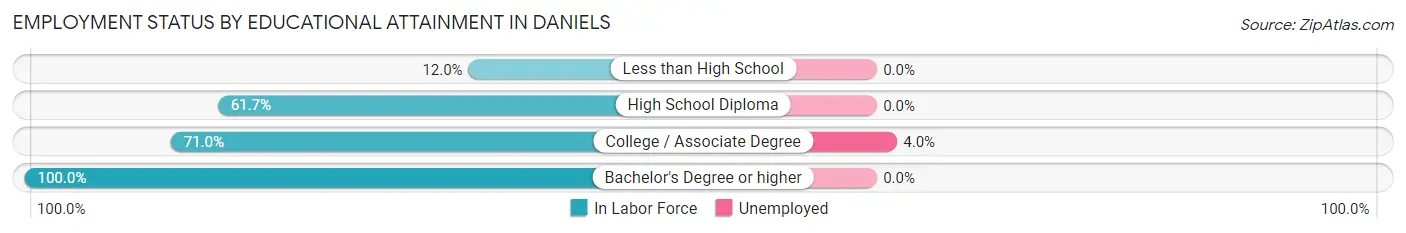
| Educational Attainment | In Labor Force | Unemployed |
| Less than High School | 22 (12.0%) | 0 (0.0%) |
| High School Diploma | 148 (61.7%) | 0 (0.0%) |
| College / Associate Degree | 233 (71.0%) | 13 (4.0%) |
| Bachelor's Degree or higher | 76 (100.0%) | 0 (0.0%) |
| Total | 479 (57.9%) | 16 (1.9%) |
Employment Occupations by Sex in Daniels
Management, Business, Science and Arts Occupations
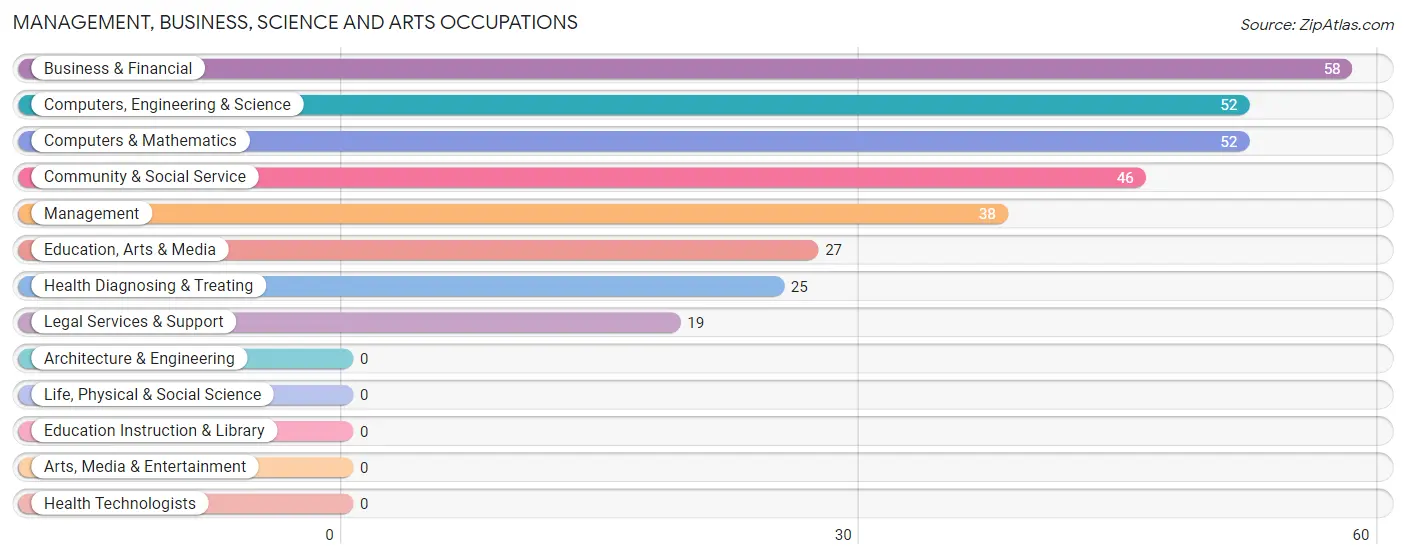
The most common Management, Business, Science and Arts occupations in Daniels are Business & Financial (58 | 8.9%), Computers, Engineering & Science (52 | 8.0%), Computers & Mathematics (52 | 8.0%), Community & Social Service (46 | 7.1%), and Management (38 | 5.9%).
Management, Business, Science and Arts Occupations by Sex
Within the Management, Business, Science and Arts occupations in Daniels, the most male-oriented occupations are Business & Financial (100.0%), Computers, Engineering & Science (100.0%), and Computers & Mathematics (100.0%), while the most female-oriented occupations are Health Diagnosing & Treating (100.0%), Education, Arts & Media (66.7%), and Management (42.1%).
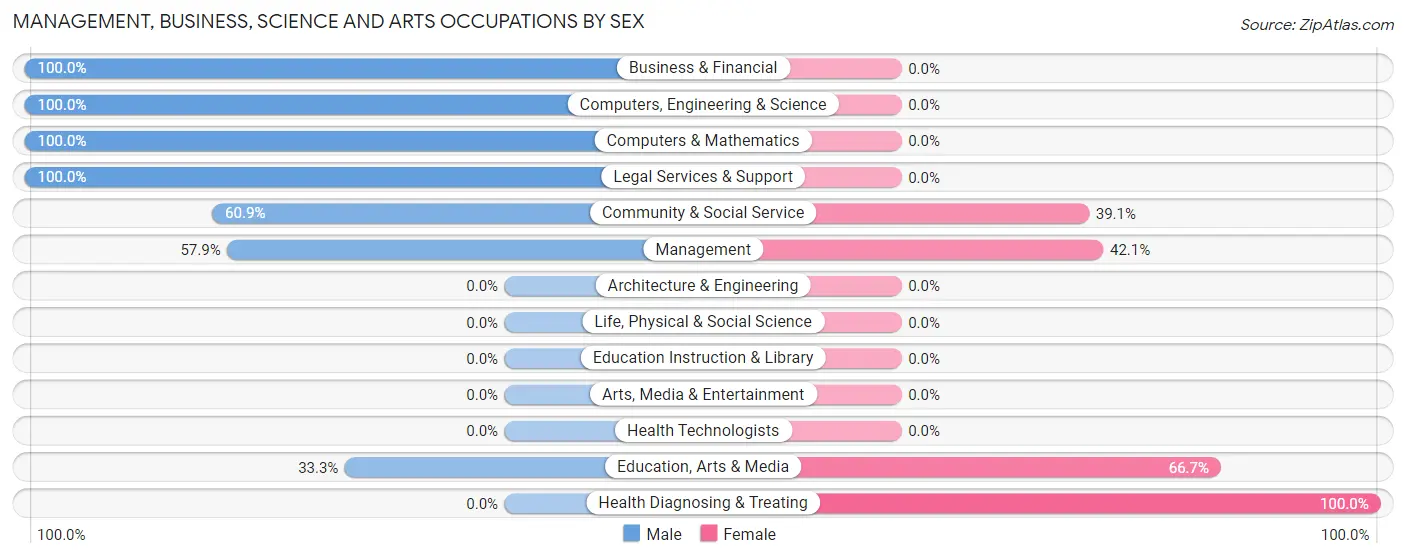
| Occupation | Male | Female |
| Management | 22 (57.9%) | 16 (42.1%) |
| Business & Financial | 58 (100.0%) | 0 (0.0%) |
| Computers, Engineering & Science | 52 (100.0%) | 0 (0.0%) |
| Computers & Mathematics | 52 (100.0%) | 0 (0.0%) |
| Architecture & Engineering | 0 (0.0%) | 0 (0.0%) |
| Life, Physical & Social Science | 0 (0.0%) | 0 (0.0%) |
| Community & Social Service | 28 (60.9%) | 18 (39.1%) |
| Education, Arts & Media | 9 (33.3%) | 18 (66.7%) |
| Legal Services & Support | 19 (100.0%) | 0 (0.0%) |
| Education Instruction & Library | 0 (0.0%) | 0 (0.0%) |
| Arts, Media & Entertainment | 0 (0.0%) | 0 (0.0%) |
| Health Diagnosing & Treating | 0 (0.0%) | 25 (100.0%) |
| Health Technologists | 0 (0.0%) | 0 (0.0%) |
| Total (Category) | 160 (73.1%) | 59 (26.9%) |
| Total (Overall) | 401 (61.8%) | 248 (38.2%) |
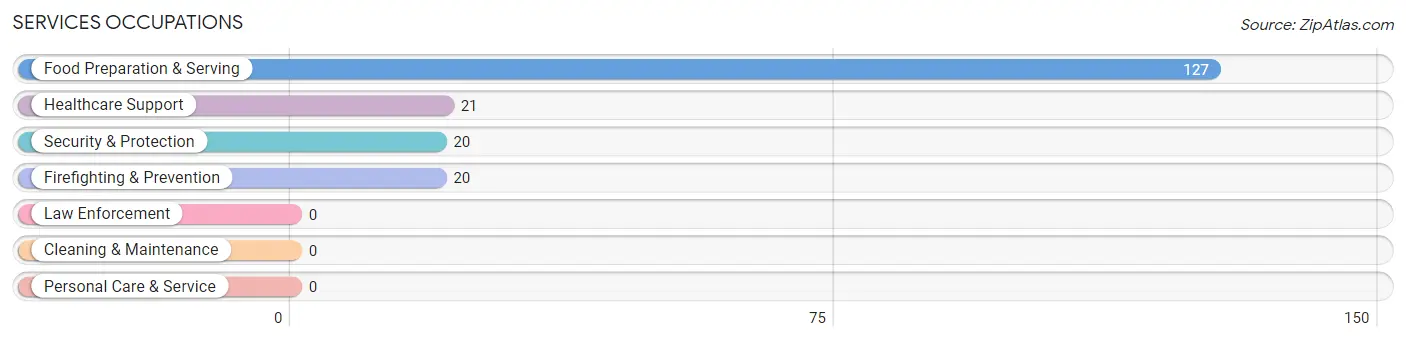
Services Occupations
The most common Services occupations in Daniels are Food Preparation & Serving (127 | 19.6%), Healthcare Support (21 | 3.2%), Security & Protection (20 | 3.1%), and Firefighting & Prevention (20 | 3.1%).
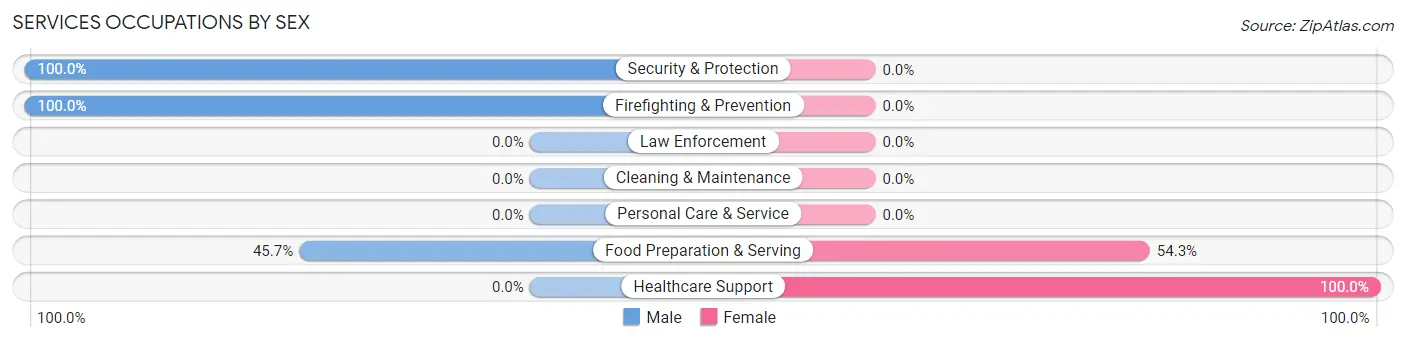
Services Occupations by Sex
Within the Services occupations in Daniels, the most male-oriented occupations are Security & Protection (100.0%), Firefighting & Prevention (100.0%), and Food Preparation & Serving (45.7%), while the most female-oriented occupations are Healthcare Support (100.0%), and Food Preparation & Serving (54.3%).
| Occupation | Male | Female |
| Healthcare Support | 0 (0.0%) | 21 (100.0%) |
| Security & Protection | 20 (100.0%) | 0 (0.0%) |
| Firefighting & Prevention | 20 (100.0%) | 0 (0.0%) |
| Law Enforcement | 0 (0.0%) | 0 (0.0%) |
| Food Preparation & Serving | 58 (45.7%) | 69 (54.3%) |
| Cleaning & Maintenance | 0 (0.0%) | 0 (0.0%) |
| Personal Care & Service | 0 (0.0%) | 0 (0.0%) |
| Total (Category) | 78 (46.4%) | 90 (53.6%) |
| Total (Overall) | 401 (61.8%) | 248 (38.2%) |
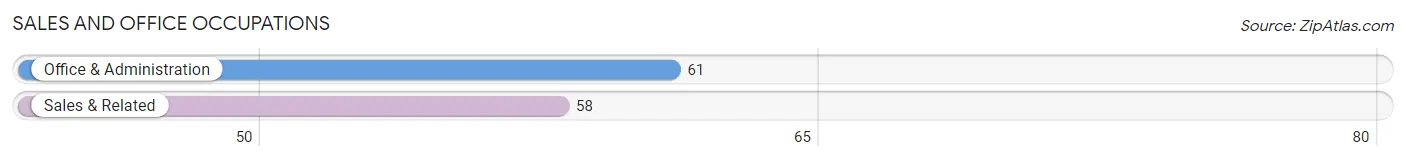
Sales and Office Occupations
The most common Sales and Office occupations in Daniels are Office & Administration (61 | 9.4%), and Sales & Related (58 | 8.9%).
Sales and Office Occupations by Sex
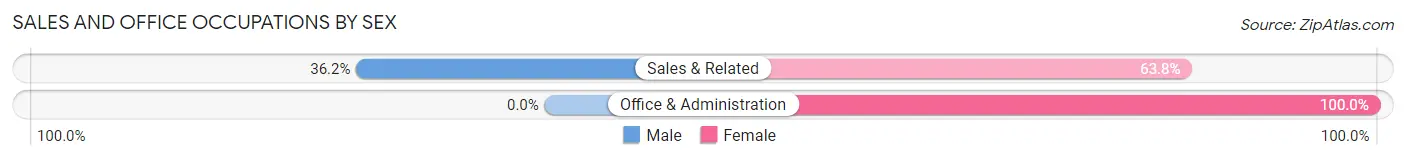
| Occupation | Male | Female |
| Sales & Related | 21 (36.2%) | 37 (63.8%) |
| Office & Administration | 0 (0.0%) | 61 (100.0%) |
| Total (Category) | 21 (17.6%) | 98 (82.4%) |
| Total (Overall) | 401 (61.8%) | 248 (38.2%) |
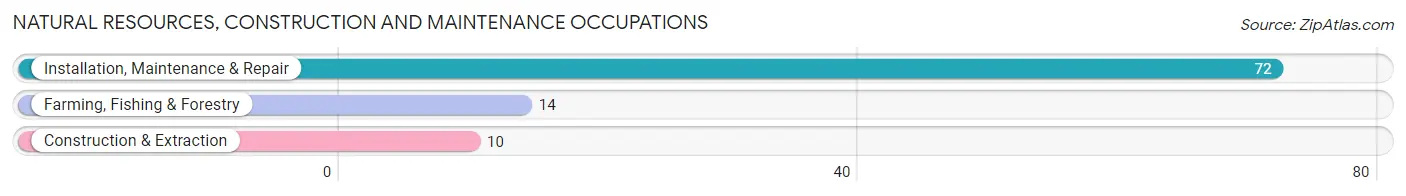
Natural Resources, Construction and Maintenance Occupations
The most common Natural Resources, Construction and Maintenance occupations in Daniels are Installation, Maintenance & Repair (72 | 11.1%), Farming, Fishing & Forestry (14 | 2.2%), and Construction & Extraction (10 | 1.5%).
Natural Resources, Construction and Maintenance Occupations by Sex
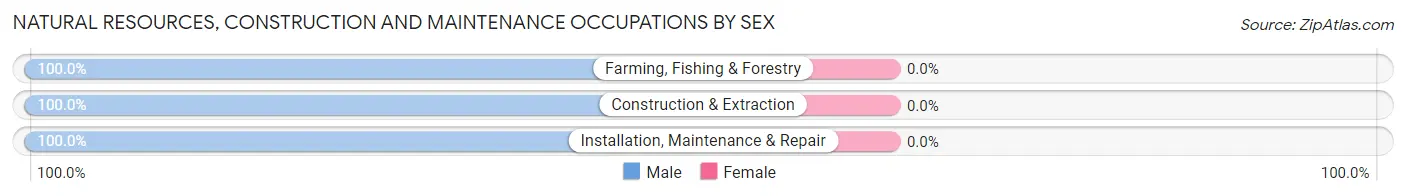
| Occupation | Male | Female |
| Farming, Fishing & Forestry | 14 (100.0%) | 0 (0.0%) |
| Construction & Extraction | 10 (100.0%) | 0 (0.0%) |
| Installation, Maintenance & Repair | 72 (100.0%) | 0 (0.0%) |
| Total (Category) | 96 (100.0%) | 0 (0.0%) |
| Total (Overall) | 401 (61.8%) | 248 (38.2%) |
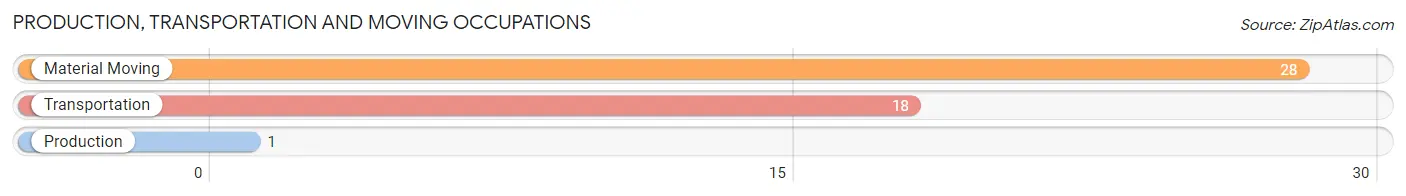
Production, Transportation and Moving Occupations
The most common Production, Transportation and Moving occupations in Daniels are Material Moving (28 | 4.3%), Transportation (18 | 2.8%), and Production (1 | 0.2%).
Production, Transportation and Moving Occupations by Sex
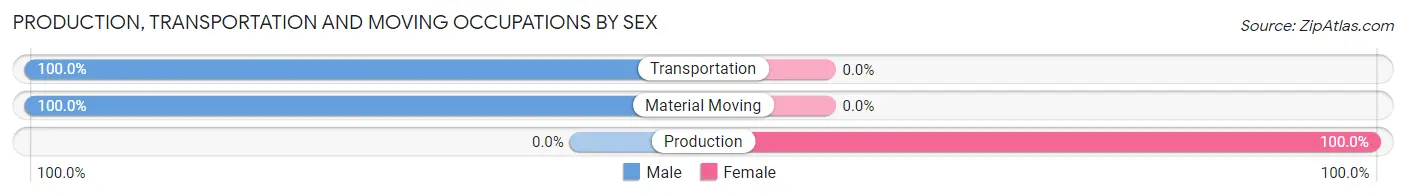
| Occupation | Male | Female |
| Production | 0 (0.0%) | 1 (100.0%) |
| Transportation | 18 (100.0%) | 0 (0.0%) |
| Material Moving | 28 (100.0%) | 0 (0.0%) |
| Total (Category) | 46 (97.9%) | 1 (2.1%) |
| Total (Overall) | 401 (61.8%) | 248 (38.2%) |
Employment Industries by Sex in Daniels
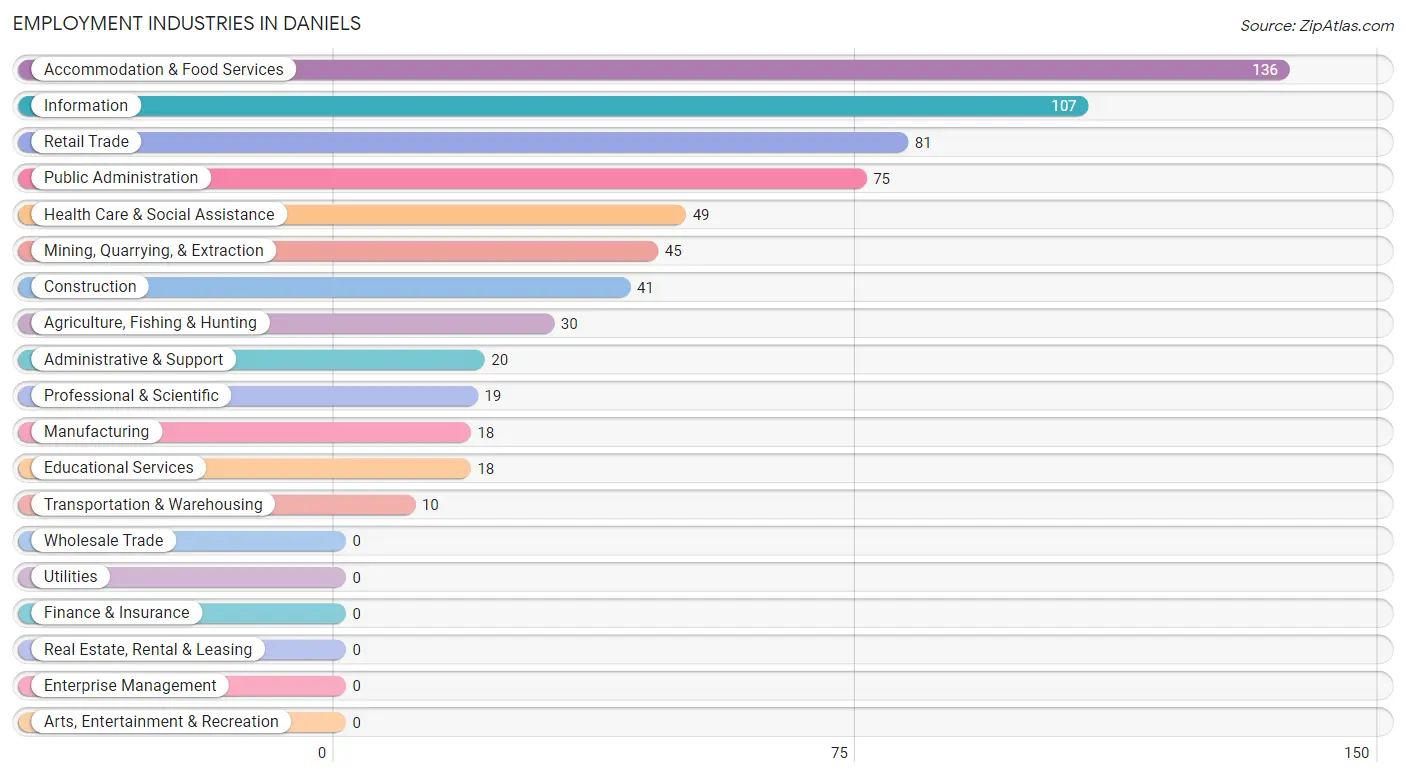
Employment Industries in Daniels
The major employment industries in Daniels include Accommodation & Food Services (136 | 21.0%), Information (107 | 16.5%), Retail Trade (81 | 12.5%), Public Administration (75 | 11.6%), and Health Care & Social Assistance (49 | 7.5%).
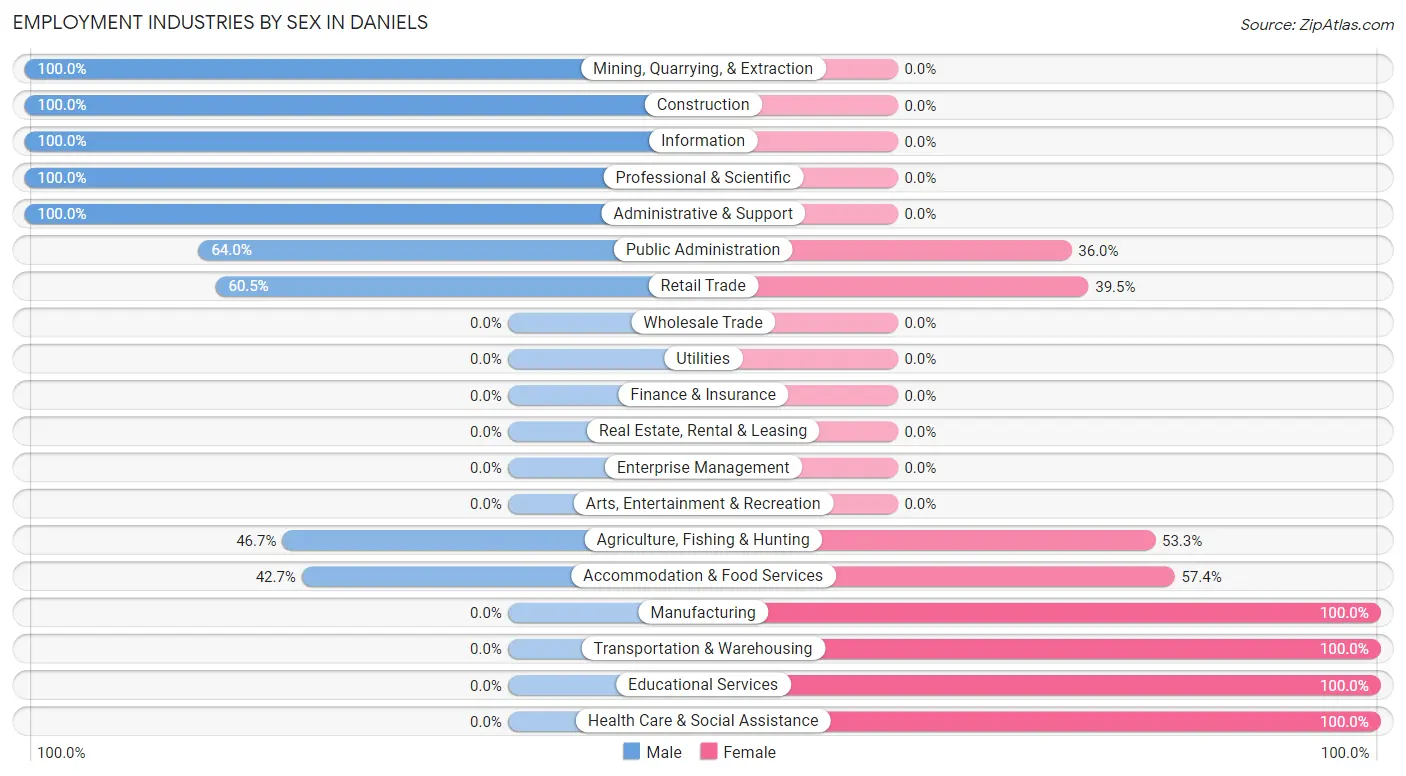
Employment Industries by Sex in Daniels
The Daniels industries that see more men than women are Mining, Quarrying, & Extraction (100.0%), Construction (100.0%), and Information (100.0%), whereas the industries that tend to have a higher number of women are Manufacturing (100.0%), Transportation & Warehousing (100.0%), and Educational Services (100.0%).
| Industry | Male | Female |
| Agriculture, Fishing & Hunting | 14 (46.7%) | 16 (53.3%) |
| Mining, Quarrying, & Extraction | 45 (100.0%) | 0 (0.0%) |
| Construction | 41 (100.0%) | 0 (0.0%) |
| Manufacturing | 0 (0.0%) | 18 (100.0%) |
| Wholesale Trade | 0 (0.0%) | 0 (0.0%) |
| Retail Trade | 49 (60.5%) | 32 (39.5%) |
| Transportation & Warehousing | 0 (0.0%) | 10 (100.0%) |
| Utilities | 0 (0.0%) | 0 (0.0%) |
| Information | 107 (100.0%) | 0 (0.0%) |
| Finance & Insurance | 0 (0.0%) | 0 (0.0%) |
| Real Estate, Rental & Leasing | 0 (0.0%) | 0 (0.0%) |
| Professional & Scientific | 19 (100.0%) | 0 (0.0%) |
| Enterprise Management | 0 (0.0%) | 0 (0.0%) |
| Administrative & Support | 20 (100.0%) | 0 (0.0%) |
| Educational Services | 0 (0.0%) | 18 (100.0%) |
| Health Care & Social Assistance | 0 (0.0%) | 49 (100.0%) |
| Arts, Entertainment & Recreation | 0 (0.0%) | 0 (0.0%) |
| Accommodation & Food Services | 58 (42.6%) | 78 (57.4%) |
| Public Administration | 48 (64.0%) | 27 (36.0%) |
| Total | 401 (61.8%) | 248 (38.2%) |
Education in Daniels
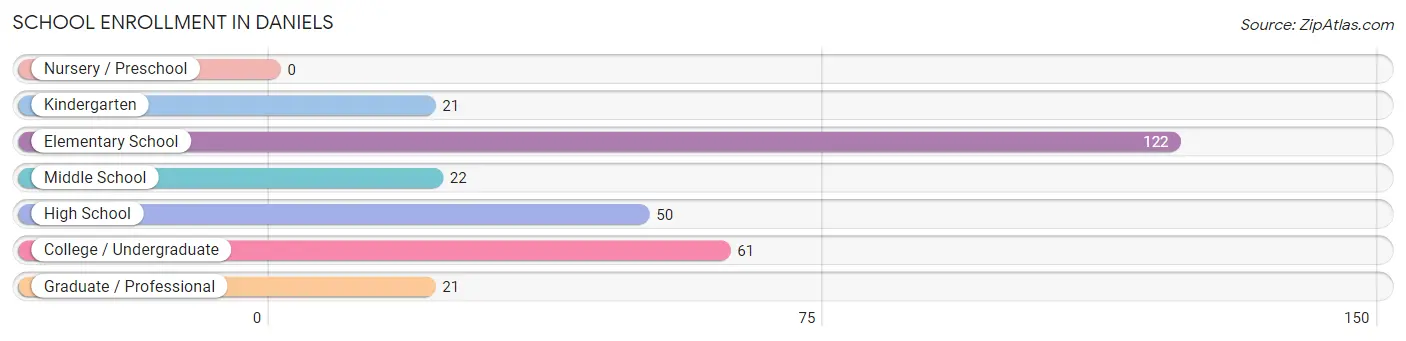
School Enrollment in Daniels
The most common levels of schooling among the 297 students in Daniels are elementary school (122 | 41.1%), college / undergraduate (61 | 20.5%), and high school (50 | 16.8%).
| School Level | # Students | % Students |
| Nursery / Preschool | 0 | 0.0% |
| Kindergarten | 21 | 7.1% |
| Elementary School | 122 | 41.1% |
| Middle School | 22 | 7.4% |
| High School | 50 | 16.8% |
| College / Undergraduate | 61 | 20.5% |
| Graduate / Professional | 21 | 7.1% |
| Total | 297 | 100.0% |
School Enrollment by Age by Funding Source in Daniels
Out of a total of 297 students who are enrolled in schools in Daniels, 134 (45.1%) attend a private institution, while the remaining 163 (54.9%) are enrolled in public schools. The age group of 10 to 14 year olds has the highest likelihood of being enrolled in private schools, with 110 (80.9% in the age bracket) enrolled. Conversely, the age group of 20 to 24 year olds has the lowest likelihood of being enrolled in a private school, with 27 (100.0% in the age bracket) attending a public institution.
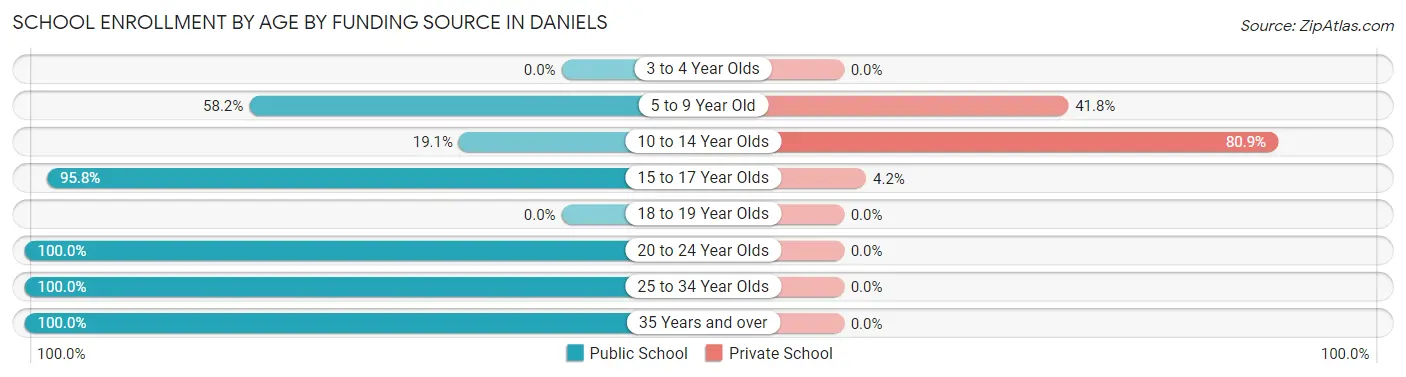
| Age Bracket | Public School | Private School |
| 3 to 4 Year Olds | 0 (0.0%) | 0 (0.0%) |
| 5 to 9 Year Old | 32 (58.2%) | 23 (41.8%) |
| 10 to 14 Year Olds | 26 (19.1%) | 110 (80.9%) |
| 15 to 17 Year Olds | 23 (95.8%) | 1 (4.2%) |
| 18 to 19 Year Olds | 0 (0.0%) | 0 (0.0%) |
| 20 to 24 Year Olds | 27 (100.0%) | 0 (0.0%) |
| 25 to 34 Year Olds | 34 (100.0%) | 0 (0.0%) |
| 35 Years and over | 21 (100.0%) | 0 (0.0%) |
| Total | 163 (54.9%) | 134 (45.1%) |
Educational Attainment by Field of Study in Daniels
Arts & humanities (73 | 32.2%), education (60 | 26.4%), bio, nature & agricultural (52 | 22.9%), visual & performing arts (19 | 8.4%), and literature & languages (14 | 6.2%) are the most common fields of study among 227 individuals in Daniels who have obtained a bachelor's degree or higher.
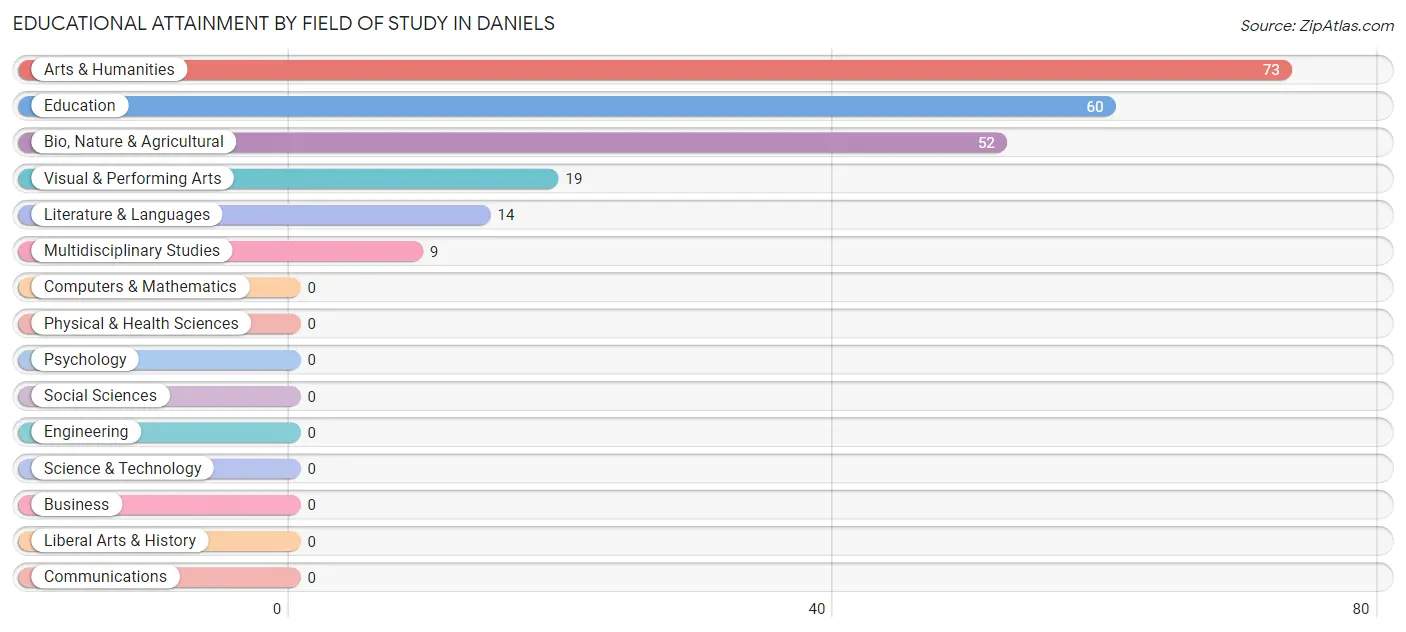
| Field of Study | # Graduates | % Graduates |
| Computers & Mathematics | 0 | 0.0% |
| Bio, Nature & Agricultural | 52 | 22.9% |
| Physical & Health Sciences | 0 | 0.0% |
| Psychology | 0 | 0.0% |
| Social Sciences | 0 | 0.0% |
| Engineering | 0 | 0.0% |
| Multidisciplinary Studies | 9 | 4.0% |
| Science & Technology | 0 | 0.0% |
| Business | 0 | 0.0% |
| Education | 60 | 26.4% |
| Literature & Languages | 14 | 6.2% |
| Liberal Arts & History | 0 | 0.0% |
| Visual & Performing Arts | 19 | 8.4% |
| Communications | 0 | 0.0% |
| Arts & Humanities | 73 | 32.2% |
| Total | 227 | 100.0% |
Transportation & Commute in Daniels
Vehicle Availability by Sex in Daniels
The most prevalent vehicle ownership categories in Daniels are males with 2 vehicles (310, accounting for 75.4%) and females with 2 vehicles (123, making up 126.5%).
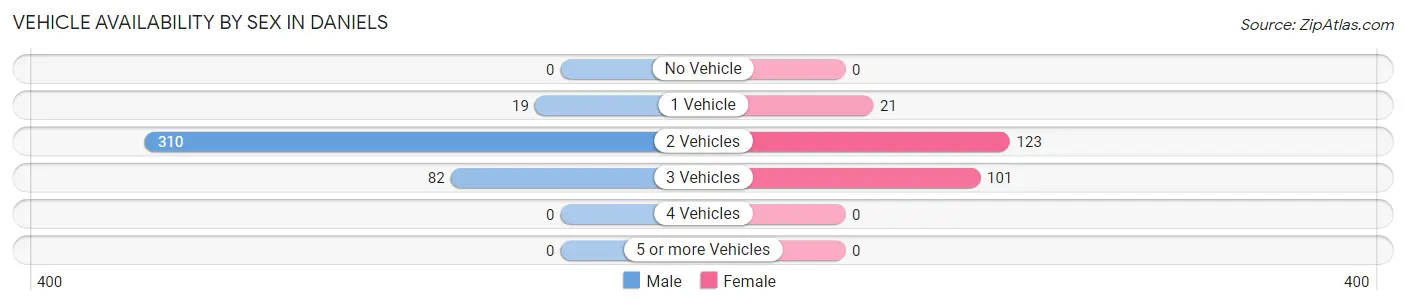
| Vehicles Available | Male | Female |
| No Vehicle | 0 (0.0%) | 0 (0.0%) |
| 1 Vehicle | 19 (4.6%) | 21 (8.6%) |
| 2 Vehicles | 310 (75.4%) | 123 (50.2%) |
| 3 Vehicles | 82 (20.0%) | 101 (41.2%) |
| 4 Vehicles | 0 (0.0%) | 0 (0.0%) |
| 5 or more Vehicles | 0 (0.0%) | 0 (0.0%) |
| Total | 411 (100.0%) | 245 (100.0%) |
Commute Time in Daniels
The most frequently occuring commute durations in Daniels are 20 to 24 minutes (174 commuters, 26.8%), 10 to 14 minutes (136 commuters, 21.0%), and 15 to 19 minutes (96 commuters, 14.8%).
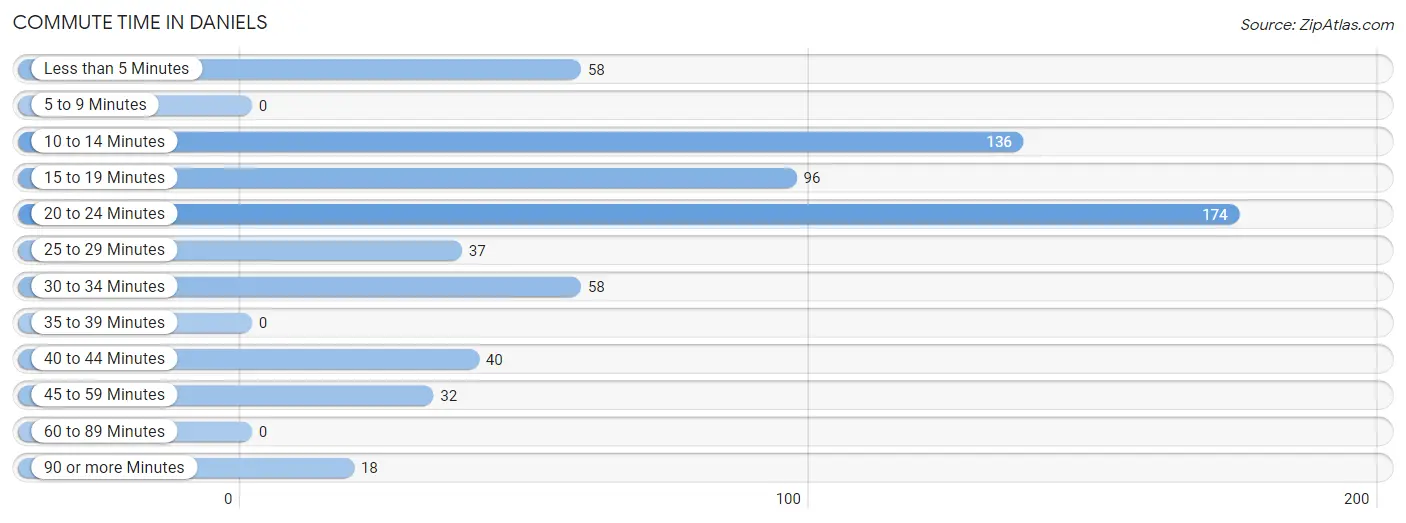
| Commute Time | # Commuters | % Commuters |
| Less than 5 Minutes | 58 | 8.9% |
| 5 to 9 Minutes | 0 | 0.0% |
| 10 to 14 Minutes | 136 | 21.0% |
| 15 to 19 Minutes | 96 | 14.8% |
| 20 to 24 Minutes | 174 | 26.8% |
| 25 to 29 Minutes | 37 | 5.7% |
| 30 to 34 Minutes | 58 | 8.9% |
| 35 to 39 Minutes | 0 | 0.0% |
| 40 to 44 Minutes | 40 | 6.2% |
| 45 to 59 Minutes | 32 | 4.9% |
| 60 to 89 Minutes | 0 | 0.0% |
| 90 or more Minutes | 18 | 2.8% |
Commute Time by Sex in Daniels
The most common commute times in Daniels are 20 to 24 minutes (117 commuters, 28.5%) for males and 10 to 14 minutes (84 commuters, 35.3%) for females.
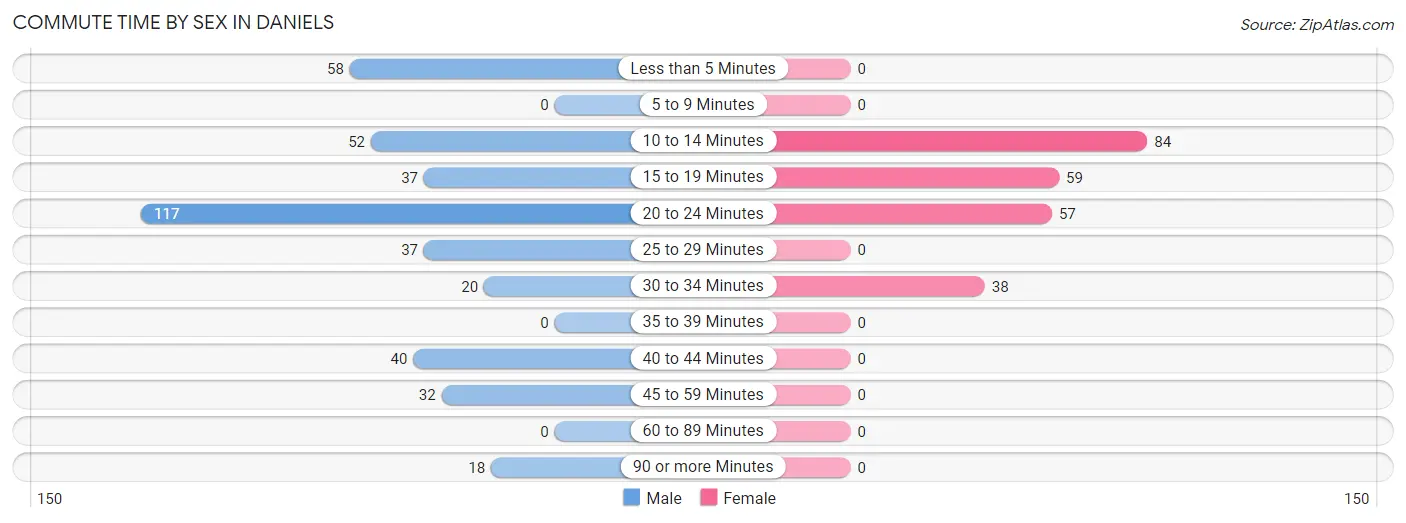
| Commute Time | Male | Female |
| Less than 5 Minutes | 58 (14.1%) | 0 (0.0%) |
| 5 to 9 Minutes | 0 (0.0%) | 0 (0.0%) |
| 10 to 14 Minutes | 52 (12.7%) | 84 (35.3%) |
| 15 to 19 Minutes | 37 (9.0%) | 59 (24.8%) |
| 20 to 24 Minutes | 117 (28.5%) | 57 (23.9%) |
| 25 to 29 Minutes | 37 (9.0%) | 0 (0.0%) |
| 30 to 34 Minutes | 20 (4.9%) | 38 (16.0%) |
| 35 to 39 Minutes | 0 (0.0%) | 0 (0.0%) |
| 40 to 44 Minutes | 40 (9.7%) | 0 (0.0%) |
| 45 to 59 Minutes | 32 (7.8%) | 0 (0.0%) |
| 60 to 89 Minutes | 0 (0.0%) | 0 (0.0%) |
| 90 or more Minutes | 18 (4.4%) | 0 (0.0%) |
Time of Departure to Work by Sex in Daniels
The most frequent times of departure to work in Daniels are 8:00 AM to 8:29 AM (143, 34.8%) for males and 7:30 AM to 7:59 AM (133, 55.9%) for females.
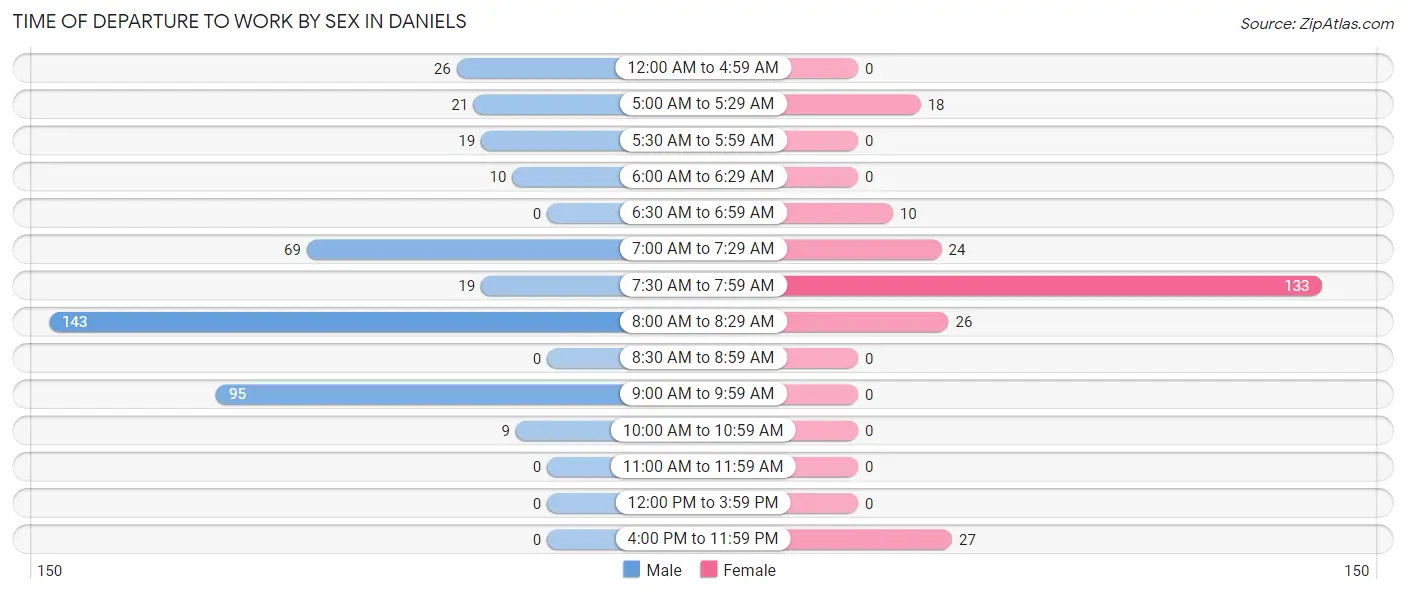
| Time of Departure | Male | Female |
| 12:00 AM to 4:59 AM | 26 (6.3%) | 0 (0.0%) |
| 5:00 AM to 5:29 AM | 21 (5.1%) | 18 (7.6%) |
| 5:30 AM to 5:59 AM | 19 (4.6%) | 0 (0.0%) |
| 6:00 AM to 6:29 AM | 10 (2.4%) | 0 (0.0%) |
| 6:30 AM to 6:59 AM | 0 (0.0%) | 10 (4.2%) |
| 7:00 AM to 7:29 AM | 69 (16.8%) | 24 (10.1%) |
| 7:30 AM to 7:59 AM | 19 (4.6%) | 133 (55.9%) |
| 8:00 AM to 8:29 AM | 143 (34.8%) | 26 (10.9%) |
| 8:30 AM to 8:59 AM | 0 (0.0%) | 0 (0.0%) |
| 9:00 AM to 9:59 AM | 95 (23.1%) | 0 (0.0%) |
| 10:00 AM to 10:59 AM | 9 (2.2%) | 0 (0.0%) |
| 11:00 AM to 11:59 AM | 0 (0.0%) | 0 (0.0%) |
| 12:00 PM to 3:59 PM | 0 (0.0%) | 0 (0.0%) |
| 4:00 PM to 11:59 PM | 0 (0.0%) | 27 (11.3%) |
| Total | 411 (100.0%) | 238 (100.0%) |
Housing Occupancy in Daniels
Occupancy by Ownership in Daniels
Of the total 759 dwellings in Daniels, owner-occupied units account for 711 (93.7%), while renter-occupied units make up 48 (6.3%).
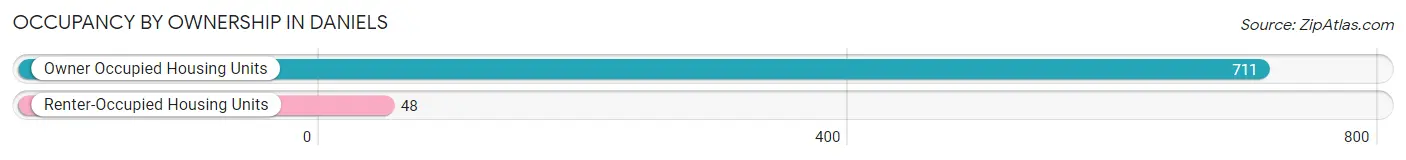
| Occupancy | # Housing Units | % Housing Units |
| Owner Occupied Housing Units | 711 | 93.7% |
| Renter-Occupied Housing Units | 48 | 6.3% |
| Total Occupied Housing Units | 759 | 100.0% |
Occupancy by Household Size in Daniels
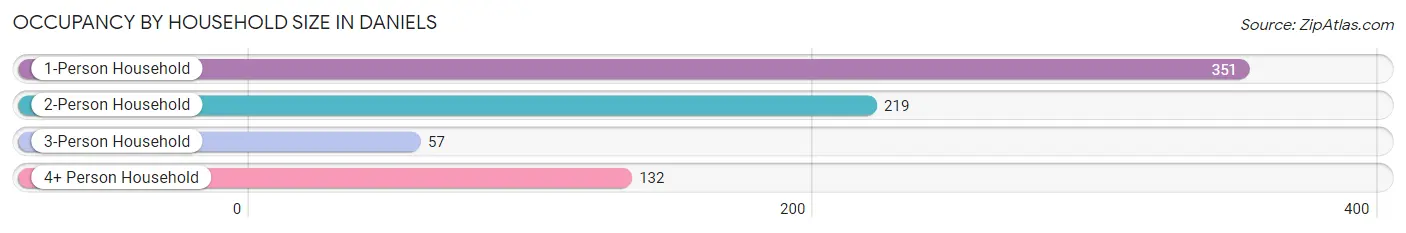
| Household Size | # Housing Units | % Housing Units |
| 1-Person Household | 351 | 46.3% |
| 2-Person Household | 219 | 28.8% |
| 3-Person Household | 57 | 7.5% |
| 4+ Person Household | 132 | 17.4% |
| Total Housing Units | 759 | 100.0% |
Occupancy by Ownership by Household Size in Daniels
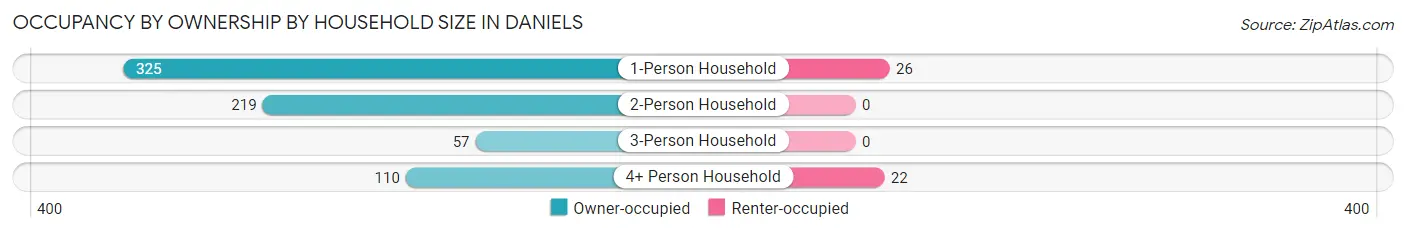
| Household Size | Owner-occupied | Renter-occupied |
| 1-Person Household | 325 (92.6%) | 26 (7.4%) |
| 2-Person Household | 219 (100.0%) | 0 (0.0%) |
| 3-Person Household | 57 (100.0%) | 0 (0.0%) |
| 4+ Person Household | 110 (83.3%) | 22 (16.7%) |
| Total Housing Units | 711 (93.7%) | 48 (6.3%) |
Occupancy by Educational Attainment in Daniels
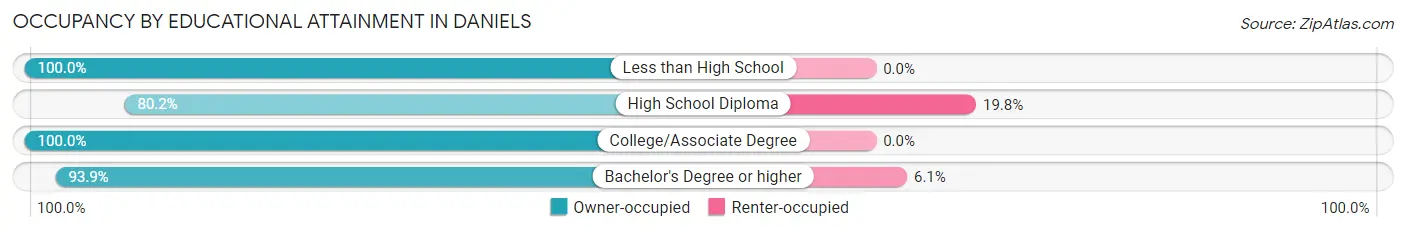
| Household Size | Owner-occupied | Renter-occupied |
| Less than High School | 83 (100.0%) | 0 (0.0%) |
| High School Diploma | 158 (80.2%) | 39 (19.8%) |
| College/Associate Degree | 332 (100.0%) | 0 (0.0%) |
| Bachelor's Degree or higher | 138 (93.9%) | 9 (6.1%) |
Occupancy by Age of Householder in Daniels
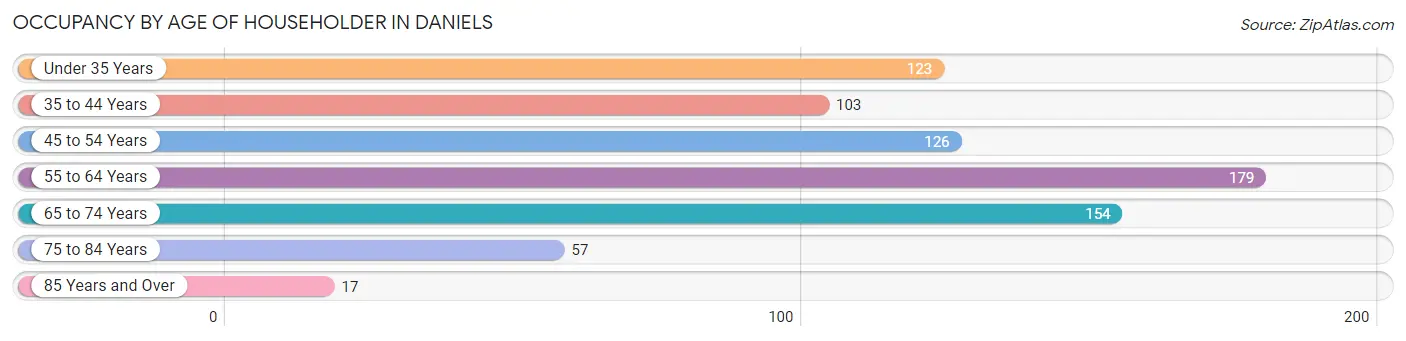
| Age Bracket | # Households | % Households |
| Under 35 Years | 123 | 16.2% |
| 35 to 44 Years | 103 | 13.6% |
| 45 to 54 Years | 126 | 16.6% |
| 55 to 64 Years | 179 | 23.6% |
| 65 to 74 Years | 154 | 20.3% |
| 75 to 84 Years | 57 | 7.5% |
| 85 Years and Over | 17 | 2.2% |
| Total | 759 | 100.0% |
Housing Finances in Daniels
Median Income by Occupancy in Daniels
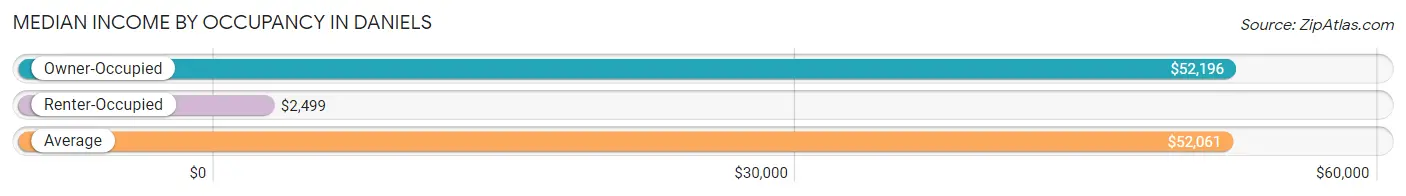
| Occupancy Type | # Households | Median Income |
| Owner-Occupied | 711 (93.7%) | $52,196 |
| Renter-Occupied | 48 (6.3%) | $2,499 |
| Average | 759 (100.0%) | $52,061 |
Occupancy by Householder Income Bracket in Daniels
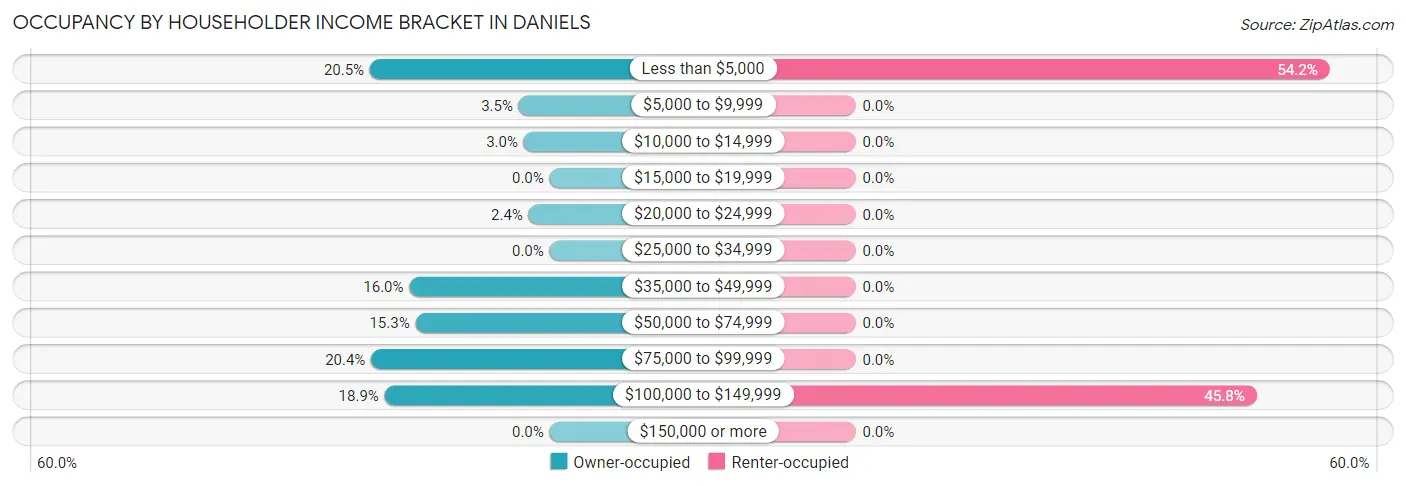
| Income Bracket | Owner-occupied | Renter-occupied |
| Less than $5,000 | 146 (20.5%) | 26 (54.2%) |
| $5,000 to $9,999 | 25 (3.5%) | 0 (0.0%) |
| $10,000 to $14,999 | 21 (2.9%) | 0 (0.0%) |
| $15,000 to $19,999 | 0 (0.0%) | 0 (0.0%) |
| $20,000 to $24,999 | 17 (2.4%) | 0 (0.0%) |
| $25,000 to $34,999 | 0 (0.0%) | 0 (0.0%) |
| $35,000 to $49,999 | 114 (16.0%) | 0 (0.0%) |
| $50,000 to $74,999 | 109 (15.3%) | 0 (0.0%) |
| $75,000 to $99,999 | 145 (20.4%) | 0 (0.0%) |
| $100,000 to $149,999 | 134 (18.9%) | 22 (45.8%) |
| $150,000 or more | 0 (0.0%) | 0 (0.0%) |
| Total | 711 (100.0%) | 48 (100.0%) |
Monthly Housing Cost Tiers in Daniels
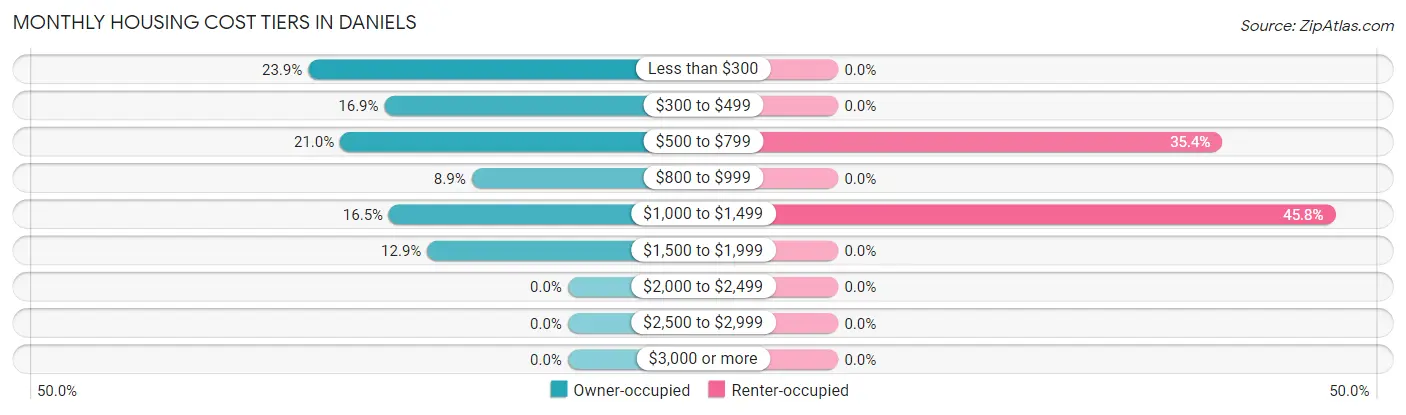
| Monthly Cost | Owner-occupied | Renter-occupied |
| Less than $300 | 170 (23.9%) | 0 (0.0%) |
| $300 to $499 | 120 (16.9%) | 0 (0.0%) |
| $500 to $799 | 149 (21.0%) | 17 (35.4%) |
| $800 to $999 | 63 (8.9%) | 0 (0.0%) |
| $1,000 to $1,499 | 117 (16.5%) | 22 (45.8%) |
| $1,500 to $1,999 | 92 (12.9%) | 0 (0.0%) |
| $2,000 to $2,499 | 0 (0.0%) | 0 (0.0%) |
| $2,500 to $2,999 | 0 (0.0%) | 0 (0.0%) |
| $3,000 or more | 0 (0.0%) | 0 (0.0%) |
| Total | 711 (100.0%) | 48 (100.0%) |
Physical Housing Characteristics in Daniels
Housing Structures in Daniels
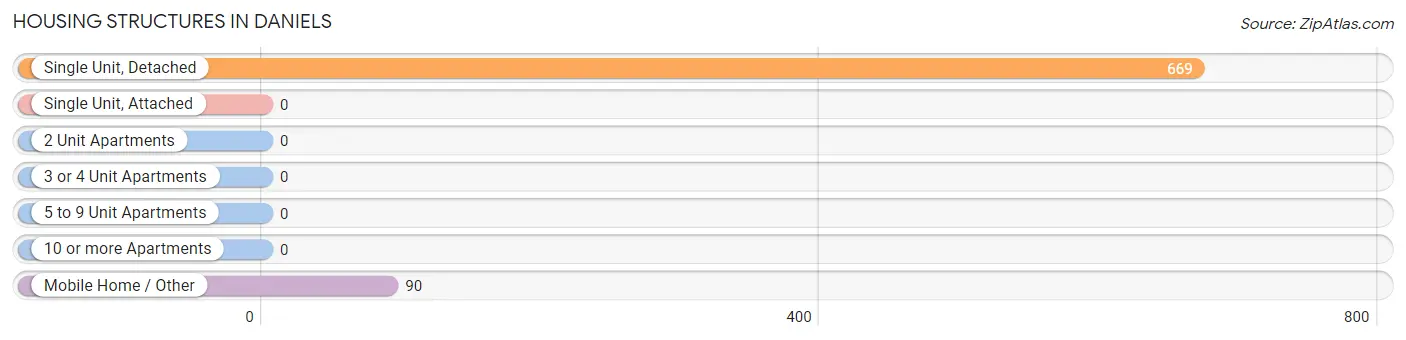
| Structure Type | # Housing Units | % Housing Units |
| Single Unit, Detached | 669 | 88.1% |
| Single Unit, Attached | 0 | 0.0% |
| 2 Unit Apartments | 0 | 0.0% |
| 3 or 4 Unit Apartments | 0 | 0.0% |
| 5 to 9 Unit Apartments | 0 | 0.0% |
| 10 or more Apartments | 0 | 0.0% |
| Mobile Home / Other | 90 | 11.9% |
| Total | 759 | 100.0% |
Housing Structures by Occupancy in Daniels
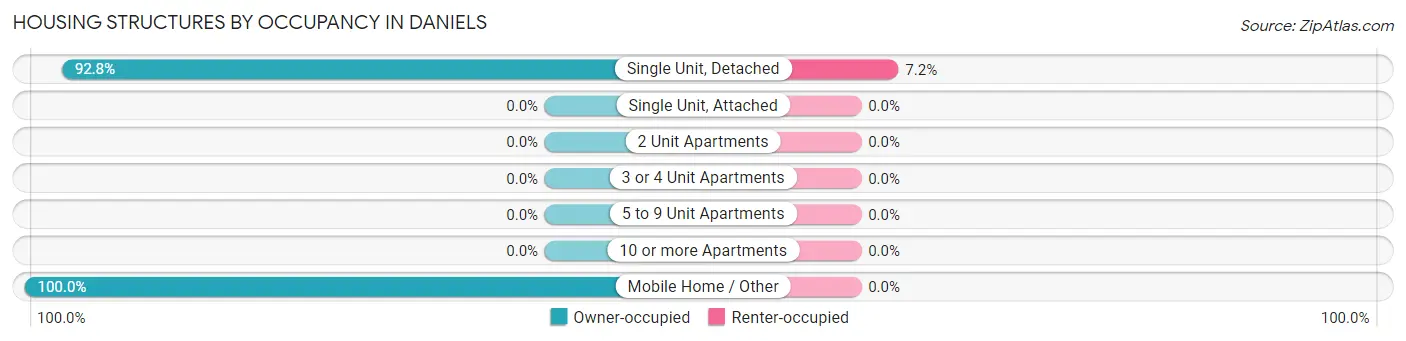
| Structure Type | Owner-occupied | Renter-occupied |
| Single Unit, Detached | 621 (92.8%) | 48 (7.2%) |
| Single Unit, Attached | 0 (0.0%) | 0 (0.0%) |
| 2 Unit Apartments | 0 (0.0%) | 0 (0.0%) |
| 3 or 4 Unit Apartments | 0 (0.0%) | 0 (0.0%) |
| 5 to 9 Unit Apartments | 0 (0.0%) | 0 (0.0%) |
| 10 or more Apartments | 0 (0.0%) | 0 (0.0%) |
| Mobile Home / Other | 90 (100.0%) | 0 (0.0%) |
| Total | 711 (93.7%) | 48 (6.3%) |
Housing Structures by Number of Rooms in Daniels
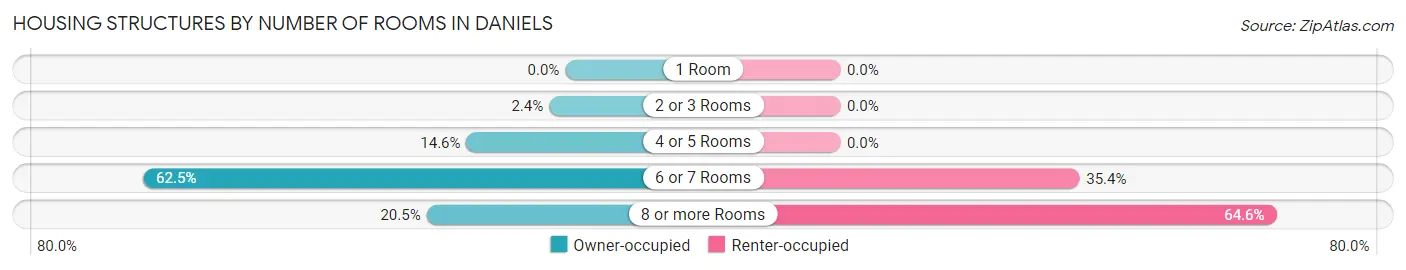
| Number of Rooms | Owner-occupied | Renter-occupied |
| 1 Room | 0 (0.0%) | 0 (0.0%) |
| 2 or 3 Rooms | 17 (2.4%) | 0 (0.0%) |
| 4 or 5 Rooms | 104 (14.6%) | 0 (0.0%) |
| 6 or 7 Rooms | 444 (62.5%) | 17 (35.4%) |
| 8 or more Rooms | 146 (20.5%) | 31 (64.6%) |
| Total | 711 (100.0%) | 48 (100.0%) |
Housing Structure by Heating Type in Daniels
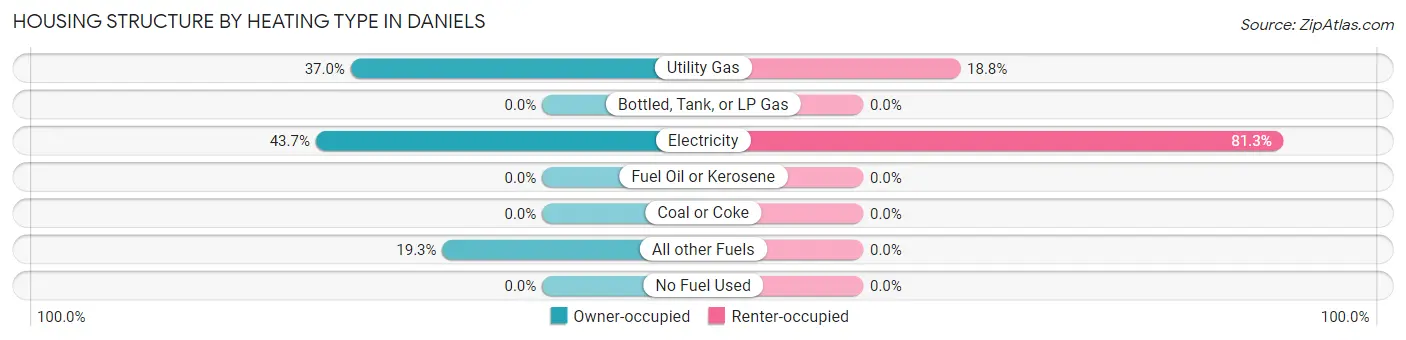
| Heating Type | Owner-occupied | Renter-occupied |
| Utility Gas | 263 (37.0%) | 9 (18.8%) |
| Bottled, Tank, or LP Gas | 0 (0.0%) | 0 (0.0%) |
| Electricity | 311 (43.7%) | 39 (81.2%) |
| Fuel Oil or Kerosene | 0 (0.0%) | 0 (0.0%) |
| Coal or Coke | 0 (0.0%) | 0 (0.0%) |
| All other Fuels | 137 (19.3%) | 0 (0.0%) |
| No Fuel Used | 0 (0.0%) | 0 (0.0%) |
| Total | 711 (100.0%) | 48 (100.0%) |
Household Vehicle Usage in Daniels
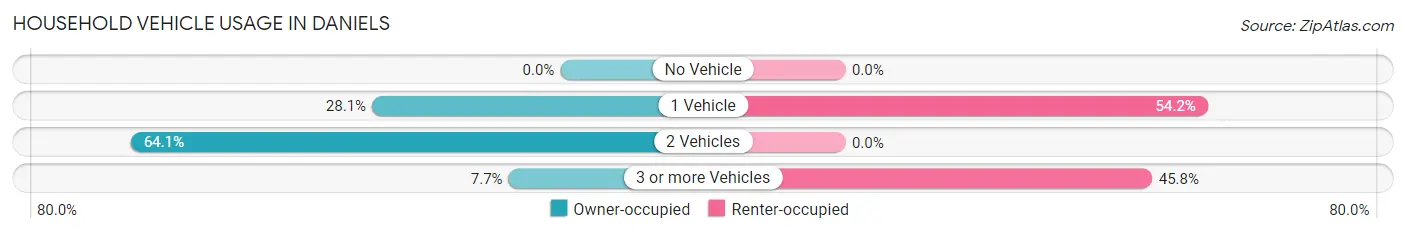
| Vehicles per Household | Owner-occupied | Renter-occupied |
| No Vehicle | 0 (0.0%) | 0 (0.0%) |
| 1 Vehicle | 200 (28.1%) | 26 (54.2%) |
| 2 Vehicles | 456 (64.1%) | 0 (0.0%) |
| 3 or more Vehicles | 55 (7.7%) | 22 (45.8%) |
| Total | 711 (100.0%) | 48 (100.0%) |
Real Estate & Mortgages in Daniels
Real Estate and Mortgage Overview in Daniels
| Characteristic | Without Mortgage | With Mortgage |
| Housing Units | 349 | 362 |
| Median Property Value | $120,500 | $180,900 |
| Median Household Income | $41,750 | $0 |
| Monthly Housing Costs | $304 | $0 |
| Real Estate Taxes | $611 | $16 |
Property Value by Mortgage Status in Daniels
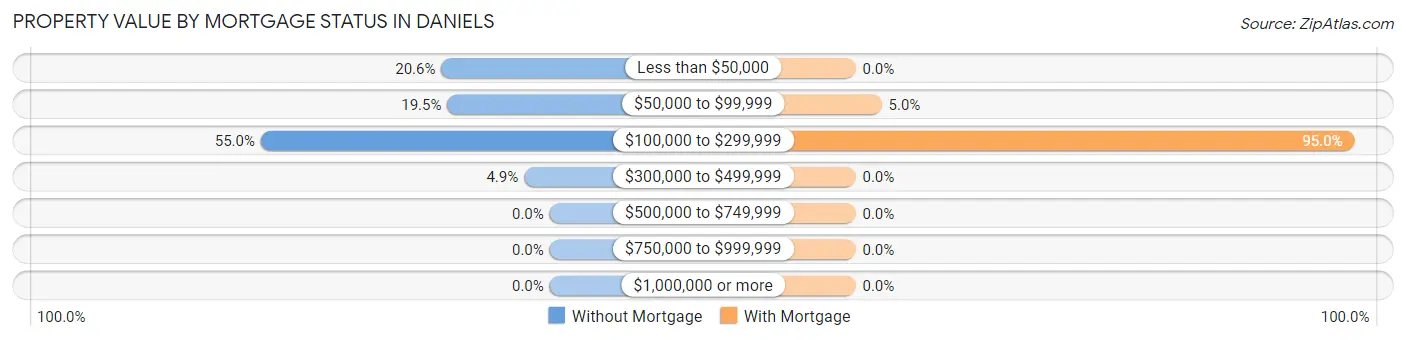
| Property Value | Without Mortgage | With Mortgage |
| Less than $50,000 | 72 (20.6%) | 0 (0.0%) |
| $50,000 to $99,999 | 68 (19.5%) | 18 (5.0%) |
| $100,000 to $299,999 | 192 (55.0%) | 344 (95.0%) |
| $300,000 to $499,999 | 17 (4.9%) | 0 (0.0%) |
| $500,000 to $749,999 | 0 (0.0%) | 0 (0.0%) |
| $750,000 to $999,999 | 0 (0.0%) | 0 (0.0%) |
| $1,000,000 or more | 0 (0.0%) | 0 (0.0%) |
| Total | 349 (100.0%) | 362 (100.0%) |
Household Income by Mortgage Status in Daniels
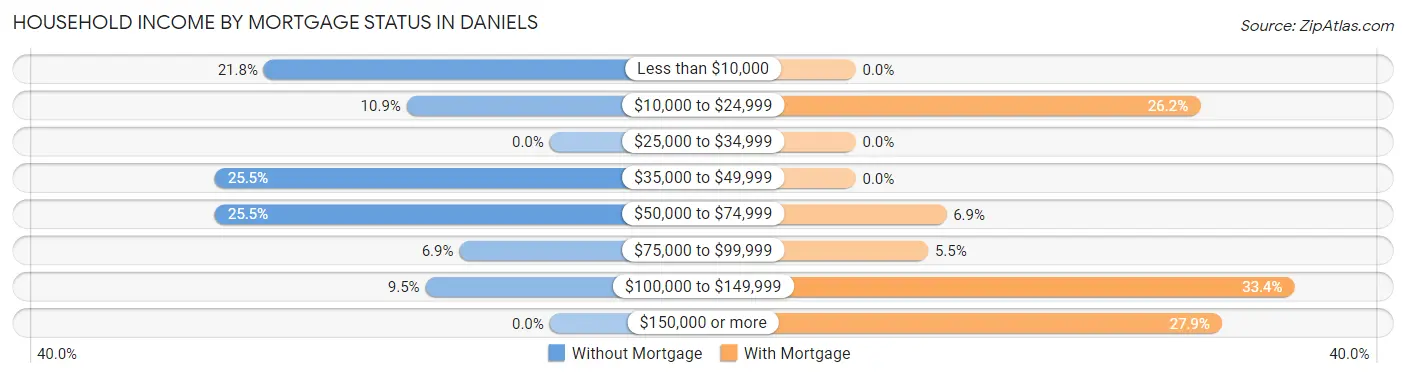
| Household Income | Without Mortgage | With Mortgage |
| Less than $10,000 | 76 (21.8%) | 0 (0.0%) |
| $10,000 to $24,999 | 38 (10.9%) | 95 (26.2%) |
| $25,000 to $34,999 | 0 (0.0%) | 0 (0.0%) |
| $35,000 to $49,999 | 89 (25.5%) | 0 (0.0%) |
| $50,000 to $74,999 | 89 (25.5%) | 25 (6.9%) |
| $75,000 to $99,999 | 24 (6.9%) | 20 (5.5%) |
| $100,000 to $149,999 | 33 (9.5%) | 121 (33.4%) |
| $150,000 or more | 0 (0.0%) | 101 (27.9%) |
| Total | 349 (100.0%) | 362 (100.0%) |
Property Value to Household Income Ratio in Daniels
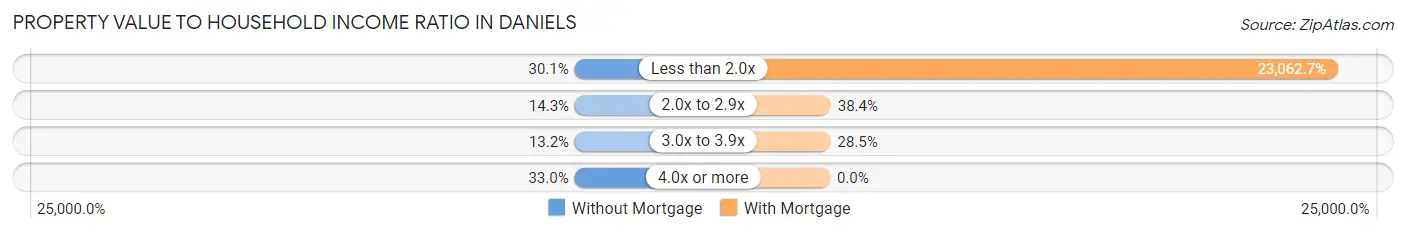
| Value-to-Income Ratio | Without Mortgage | With Mortgage |
| Less than 2.0x | 105 (30.1%) | 83,487 (23,062.7%) |
| 2.0x to 2.9x | 50 (14.3%) | 139 (38.4%) |
| 3.0x to 3.9x | 46 (13.2%) | 103 (28.4%) |
| 4.0x or more | 115 (33.0%) | 0 (0.0%) |
| Total | 349 (100.0%) | 362 (100.0%) |
Real Estate Taxes by Mortgage Status in Daniels
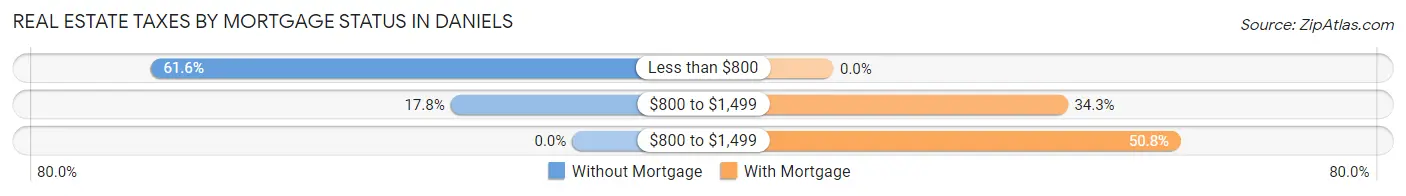
| Property Taxes | Without Mortgage | With Mortgage |
| Less than $800 | 215 (61.6%) | 0 (0.0%) |
| $800 to $1,499 | 62 (17.8%) | 124 (34.3%) |
| $800 to $1,499 | 0 (0.0%) | 184 (50.8%) |
| Total | 349 (100.0%) | 362 (100.0%) |
Health & Disability in Daniels
Health Insurance Coverage by Age in Daniels
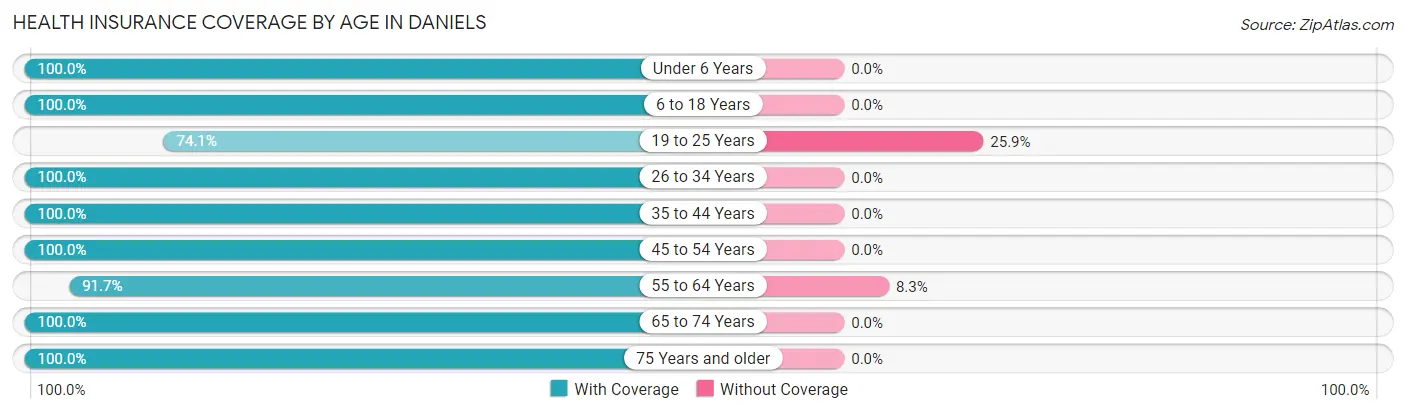
| Age Bracket | With Coverage | Without Coverage |
| Under 6 Years | 65 (100.0%) | 0 (0.0%) |
| 6 to 18 Years | 259 (100.0%) | 0 (0.0%) |
| 19 to 25 Years | 80 (74.1%) | 28 (25.9%) |
| 26 to 34 Years | 157 (100.0%) | 0 (0.0%) |
| 35 to 44 Years | 222 (100.0%) | 0 (0.0%) |
| 45 to 54 Years | 128 (100.0%) | 0 (0.0%) |
| 55 to 64 Years | 275 (91.7%) | 25 (8.3%) |
| 65 to 74 Years | 186 (100.0%) | 0 (0.0%) |
| 75 Years and older | 85 (100.0%) | 0 (0.0%) |
| Total | 1,457 (96.5%) | 53 (3.5%) |
Health Insurance Coverage by Citizenship Status in Daniels
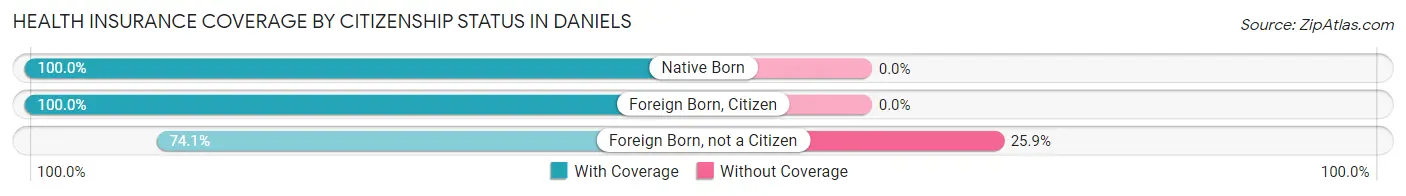
| Citizenship Status | With Coverage | Without Coverage |
| Native Born | 65 (100.0%) | 0 (0.0%) |
| Foreign Born, Citizen | 259 (100.0%) | 0 (0.0%) |
| Foreign Born, not a Citizen | 80 (74.1%) | 28 (25.9%) |
Health Insurance Coverage by Household Income in Daniels
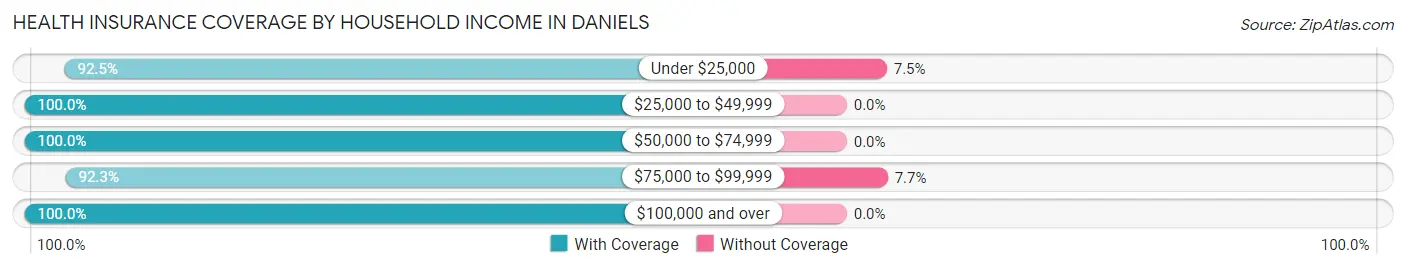
| Household Income | With Coverage | Without Coverage |
| Under $25,000 | 309 (92.5%) | 25 (7.5%) |
| $25,000 to $49,999 | 149 (100.0%) | 0 (0.0%) |
| $50,000 to $74,999 | 119 (100.0%) | 0 (0.0%) |
| $75,000 to $99,999 | 337 (92.3%) | 28 (7.7%) |
| $100,000 and over | 534 (100.0%) | 0 (0.0%) |
Public vs Private Health Insurance Coverage by Age in Daniels
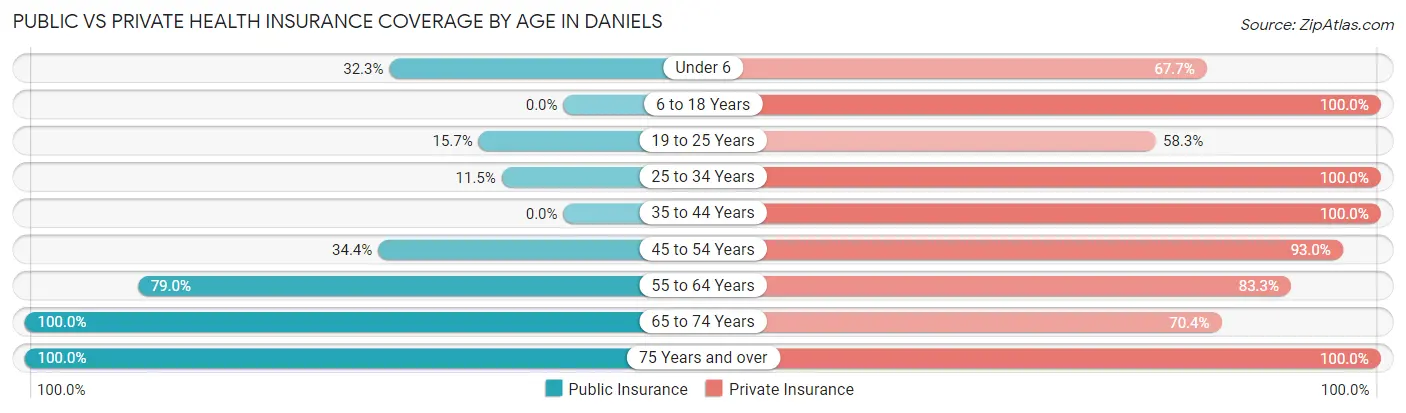
| Age Bracket | Public Insurance | Private Insurance |
| Under 6 | 21 (32.3%) | 44 (67.7%) |
| 6 to 18 Years | 0 (0.0%) | 259 (100.0%) |
| 19 to 25 Years | 17 (15.7%) | 63 (58.3%) |
| 25 to 34 Years | 18 (11.5%) | 157 (100.0%) |
| 35 to 44 Years | 0 (0.0%) | 222 (100.0%) |
| 45 to 54 Years | 44 (34.4%) | 119 (93.0%) |
| 55 to 64 Years | 237 (79.0%) | 250 (83.3%) |
| 65 to 74 Years | 186 (100.0%) | 131 (70.4%) |
| 75 Years and over | 85 (100.0%) | 85 (100.0%) |
| Total | 608 (40.3%) | 1,330 (88.1%) |
Disability Status by Sex by Age in Daniels
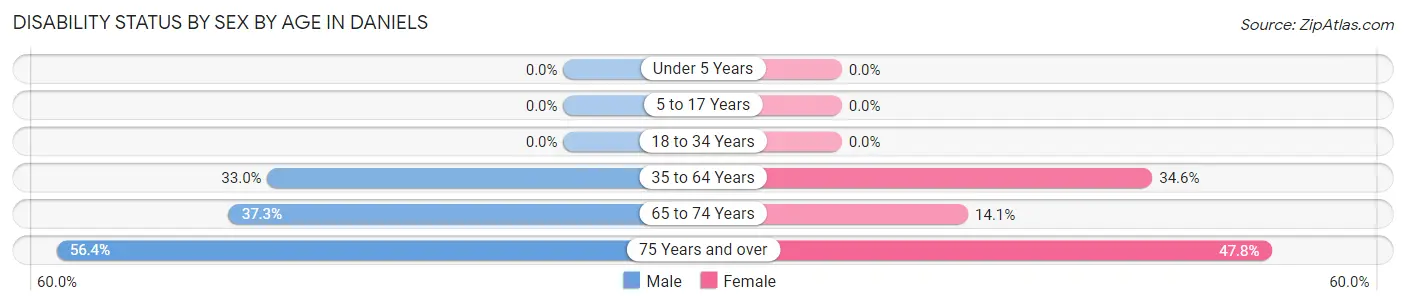
| Age Bracket | Male | Female |
| Under 5 Years | 0 (0.0%) | 0 (0.0%) |
| 5 to 17 Years | 0 (0.0%) | 0 (0.0%) |
| 18 to 34 Years | 0 (0.0%) | 0 (0.0%) |
| 35 to 64 Years | 117 (33.0%) | 102 (34.6%) |
| 65 to 74 Years | 19 (37.2%) | 19 (14.1%) |
| 75 Years and over | 22 (56.4%) | 22 (47.8%) |
Disability Class by Sex by Age in Daniels
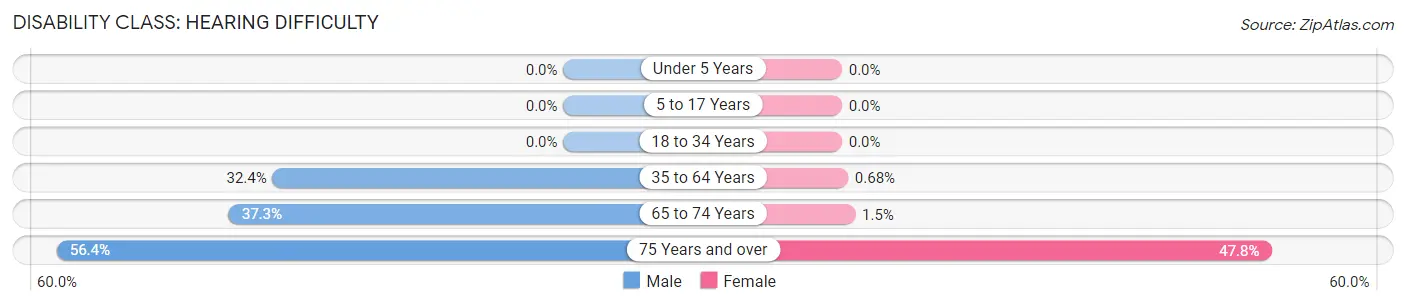
Disability Class: Hearing Difficulty
| Age Bracket | Male | Female |
| Under 5 Years | 0 (0.0%) | 0 (0.0%) |
| 5 to 17 Years | 0 (0.0%) | 0 (0.0%) |
| 18 to 34 Years | 0 (0.0%) | 0 (0.0%) |
| 35 to 64 Years | 115 (32.4%) | 2 (0.7%) |
| 65 to 74 Years | 19 (37.2%) | 2 (1.5%) |
| 75 Years and over | 22 (56.4%) | 22 (47.8%) |
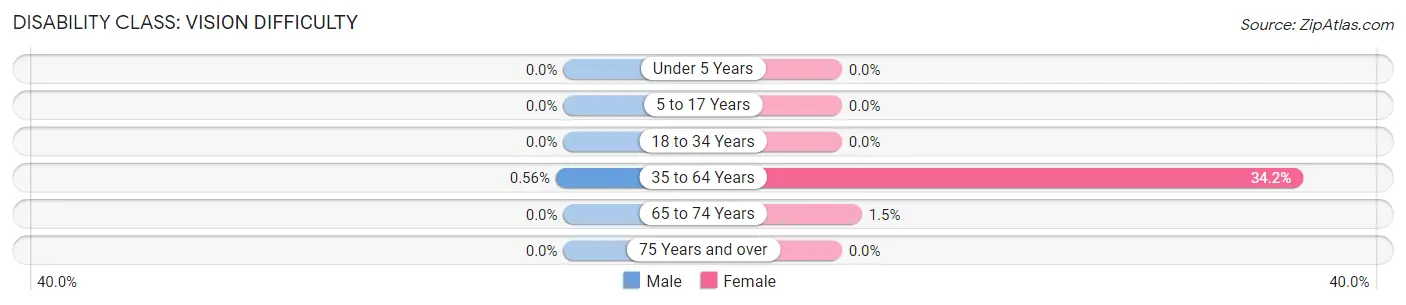
Disability Class: Vision Difficulty
| Age Bracket | Male | Female |
| Under 5 Years | 0 (0.0%) | 0 (0.0%) |
| 5 to 17 Years | 0 (0.0%) | 0 (0.0%) |
| 18 to 34 Years | 0 (0.0%) | 0 (0.0%) |
| 35 to 64 Years | 2 (0.6%) | 101 (34.2%) |
| 65 to 74 Years | 0 (0.0%) | 2 (1.5%) |
| 75 Years and over | 0 (0.0%) | 0 (0.0%) |
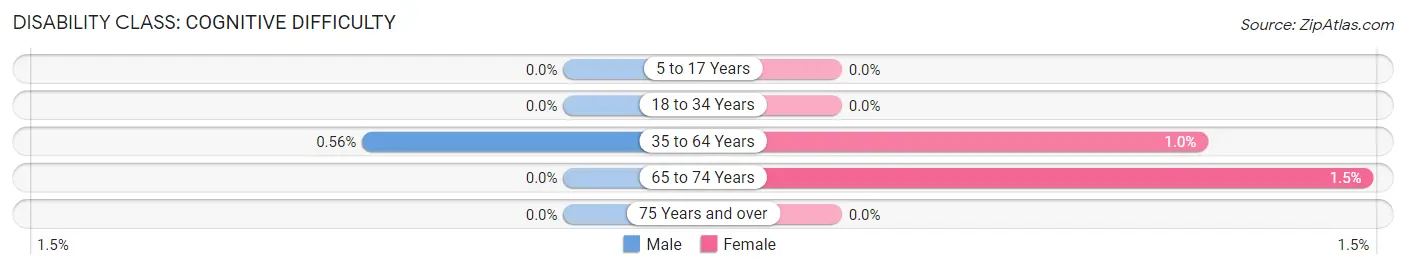
Disability Class: Cognitive Difficulty
| Age Bracket | Male | Female |
| 5 to 17 Years | 0 (0.0%) | 0 (0.0%) |
| 18 to 34 Years | 0 (0.0%) | 0 (0.0%) |
| 35 to 64 Years | 2 (0.6%) | 3 (1.0%) |
| 65 to 74 Years | 0 (0.0%) | 2 (1.5%) |
| 75 Years and over | 0 (0.0%) | 0 (0.0%) |
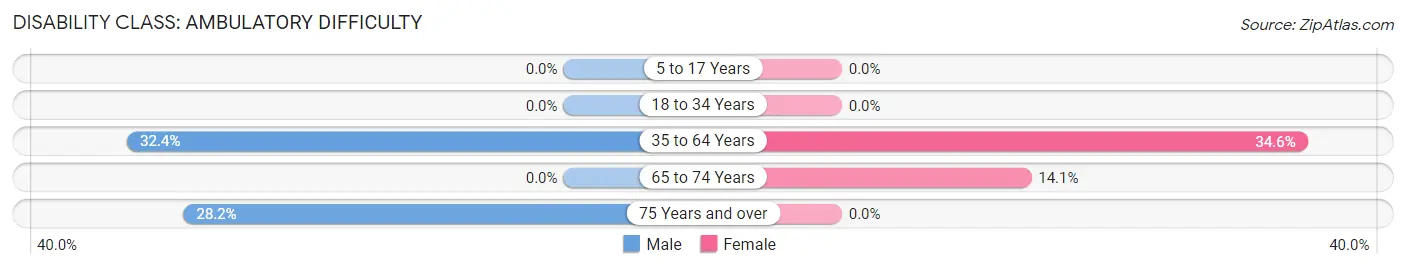
Disability Class: Ambulatory Difficulty
| Age Bracket | Male | Female |
| 5 to 17 Years | 0 (0.0%) | 0 (0.0%) |
| 18 to 34 Years | 0 (0.0%) | 0 (0.0%) |
| 35 to 64 Years | 115 (32.4%) | 102 (34.6%) |
| 65 to 74 Years | 0 (0.0%) | 19 (14.1%) |
| 75 Years and over | 11 (28.2%) | 0 (0.0%) |
Disability Class: Self-Care Difficulty
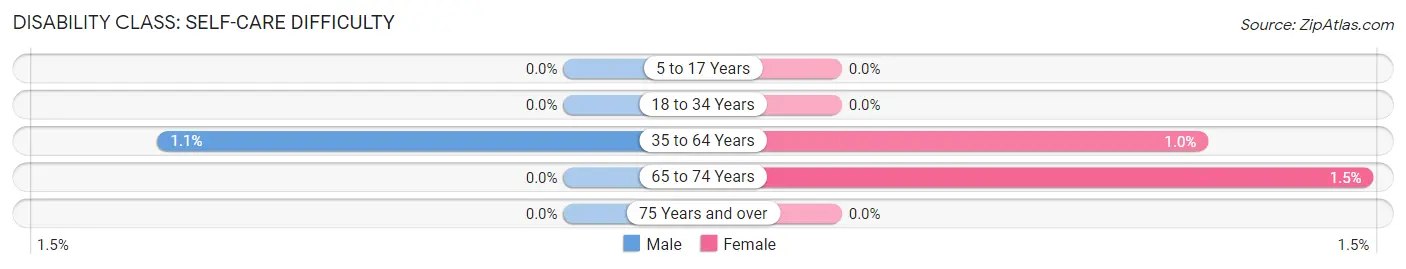
| Age Bracket | Male | Female |
| 5 to 17 Years | 0 (0.0%) | 0 (0.0%) |
| 18 to 34 Years | 0 (0.0%) | 0 (0.0%) |
| 35 to 64 Years | 4 (1.1%) | 3 (1.0%) |
| 65 to 74 Years | 0 (0.0%) | 2 (1.5%) |
| 75 Years and over | 0 (0.0%) | 0 (0.0%) |
Technology Access in Daniels
Computing Device Access in Daniels
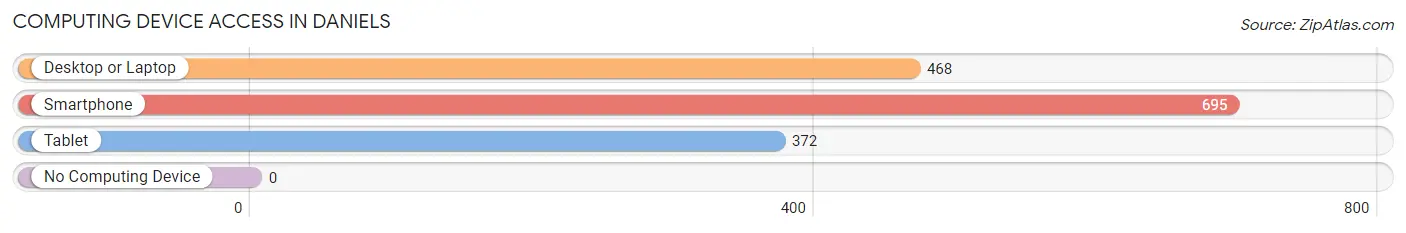
| Device Type | # Households | % Households |
| Desktop or Laptop | 468 | 61.7% |
| Smartphone | 695 | 91.6% |
| Tablet | 372 | 49.0% |
| No Computing Device | 0 | 0.0% |
| Total | 759 | 100.0% |
Internet Access in Daniels
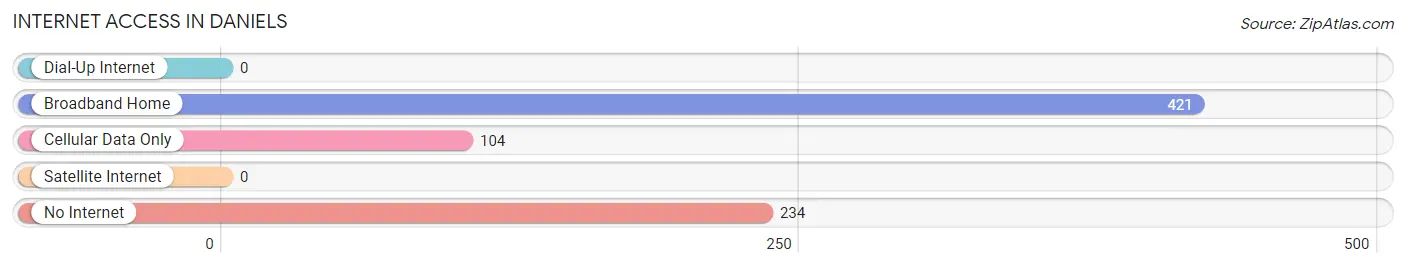
| Internet Type | # Households | % Households |
| Dial-Up Internet | 0 | 0.0% |
| Broadband Home | 421 | 55.5% |
| Cellular Data Only | 104 | 13.7% |
| Satellite Internet | 0 | 0.0% |
| No Internet | 234 | 30.8% |
| Total | 759 | 100.0% |
Daniels Summary
Daniels is an unincorporated community located in Raleigh County, West Virginia. It is situated in the Appalachian Mountains, approximately 10 miles south of Beckley. The community is named after the Daniels family, who were among the first settlers in the area.
History
The first settlers in the area were the Daniels family, who arrived in the late 1700s. The family established a homestead and began farming the land. The community was officially established in 1883 when the post office was opened. The post office was named after the Daniels family.
In the early 1900s, the community began to grow as coal mining operations began in the area. The coal industry provided employment for many of the residents and helped to fuel the local economy. The coal industry also brought an influx of new residents to the area.
Geography
Daniels is located in the Appalachian Mountains of West Virginia. The community is situated in a valley surrounded by hills and mountains. The area is known for its scenic beauty and is a popular destination for outdoor recreation.
The climate in Daniels is temperate, with mild winters and warm summers. The average annual temperature is around 50 degrees Fahrenheit. The average annual precipitation is around 40 inches.
Economy
The economy of Daniels is largely based on coal mining and related industries. The coal industry has been a major source of employment for the community for many years. In addition to coal mining, the community also has a number of small businesses, including restaurants, stores, and service providers.
The community also has a number of tourist attractions, including the nearby New River Gorge National River and the nearby Bluestone National Scenic River. These attractions bring in visitors from all over the country and help to support the local economy.
Demographics
As of the 2010 census, the population of Daniels was 1,845. The racial makeup of the community was 97.3% White, 0.7% African American, 0.2% Native American, 0.2% Asian, 0.1% Pacific Islander, and 1.5% from other races. The median household income was $30,938.
Conclusion
Daniels is a small unincorporated community located in Raleigh County, West Virginia. The community was established in the late 1700s by the Daniels family and has since grown to become a thriving community. The economy of Daniels is largely based on coal mining and related industries, and the community also has a number of tourist attractions that bring in visitors from all over the country. The population of Daniels is 1,845, and the median household income is $30,938.
Common Questions
What is Per Capita Income in Daniels?
Per Capita income in Daniels is $26,636.
What is the Median Family Income in Daniels?
Median Family Income in Daniels is $86,563.
What is the Median Household income in Daniels?
Median Household Income in Daniels is $52,061.
What is Income or Wage Gap in Daniels?
Income or Wage Gap in Daniels is 33.5%.
Women in Daniels earn 66.5 cents for every dollar earned by a man.
What is Inequality or Gini Index in Daniels?
Inequality or Gini Index in Daniels is 0.43.
What is the Total Population of Daniels?
Total Population of Daniels is 1,564.
What is the Total Male Population of Daniels?
Total Male Population of Daniels is 776.
What is the Total Female Population of Daniels?
Total Female Population of Daniels is 788.
What is the Ratio of Males per 100 Females in Daniels?
There are 98.48 Males per 100 Females in Daniels.
What is the Ratio of Females per 100 Males in Daniels?
There are 101.55 Females per 100 Males in Daniels.
What is the Median Population Age in Daniels?
Median Population Age in Daniels is 43.7 Years.
What is the Average Family Size in Daniels
Average Family Size in Daniels is 2.8 People.
What is the Average Household Size in Daniels
Average Household Size in Daniels is 2.0 People.
How Large is the Labor Force in Daniels?
There are 685 People in the Labor Forcein in Daniels.
What is the Percentage of People in the Labor Force in Daniels?
51.6% of People are in the Labor Force in Daniels.
What is the Unemployment Rate in Daniels?
Unemployment Rate in Daniels is 3.9%.