Northfork, WV Map & Demographics
Northfork Map
Northfork Overview
$14,221
PER CAPITA INCOME
$46,250
AVG FAMILY INCOME
$37,059
AVG HOUSEHOLD INCOME
0.40
INEQUALITY / GINI INDEX
402
TOTAL POPULATION
139
MALE POPULATION
263
FEMALE POPULATION
52.85
MALES / 100 FEMALES
189.21
FEMALES / 100 MALES
36.8
MEDIAN AGE
4.4
AVG FAMILY SIZE
3.5
AVG HOUSEHOLD SIZE
136
LABOR FORCE [ PEOPLE ]
40.7%
PERCENT IN LABOR FORCE
15.4%
UNEMPLOYMENT RATE
Northfork Zip Codes
Income in Northfork
Income Overview in Northfork
Per Capita Income in Northfork is $14,221, while median incomes of families and households are $46,250 and $37,059 respectively.
| Characteristic | Number | Measure |
| Per Capita Income | 402 | $14,221 |
| Median Family Income | 83 | $46,250 |
| Mean Family Income | 83 | $52,752 |
| Median Household Income | 116 | $37,059 |
| Mean Household Income | 116 | $44,633 |
| Income Deficit | 83 | $0 |
| Wage / Income Gap (%) | 402 | 0.00% |
| Wage / Income Gap ($) | 402 | 100.00¢ per $1 |
| Gini / Inequality Index | 402 | 0.40 |
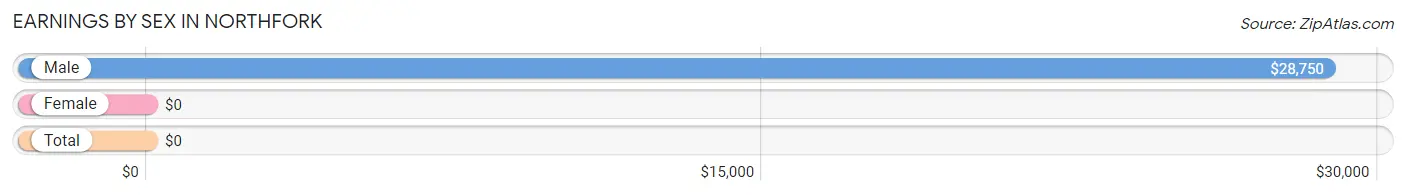
Earnings by Sex in Northfork
| Sex | Number | Average Earnings |
| Male | 54 (36.5%) | $28,750 |
| Female | 94 (63.5%) | $0 |
| Total | 148 (100.0%) | $0 |
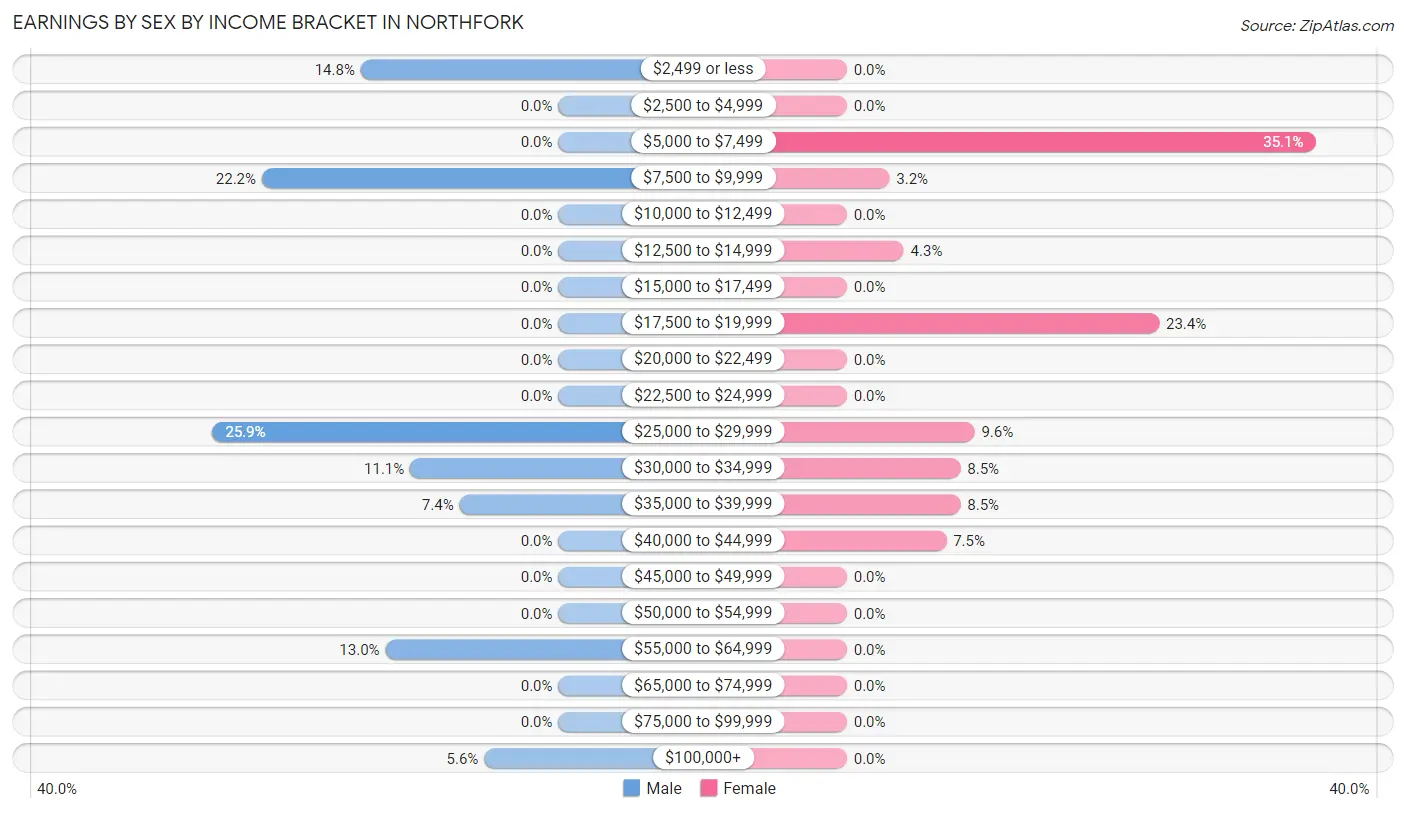
Earnings by Sex by Income Bracket in Northfork
The most common earnings brackets in Northfork are $25,000 to $29,999 for men (14 | 25.9%) and $5,000 to $7,499 for women (33 | 35.1%).
| Income | Male | Female |
| $2,499 or less | 8 (14.8%) | 0 (0.0%) |
| $2,500 to $4,999 | 0 (0.0%) | 0 (0.0%) |
| $5,000 to $7,499 | 0 (0.0%) | 33 (35.1%) |
| $7,500 to $9,999 | 12 (22.2%) | 3 (3.2%) |
| $10,000 to $12,499 | 0 (0.0%) | 0 (0.0%) |
| $12,500 to $14,999 | 0 (0.0%) | 4 (4.3%) |
| $15,000 to $17,499 | 0 (0.0%) | 0 (0.0%) |
| $17,500 to $19,999 | 0 (0.0%) | 22 (23.4%) |
| $20,000 to $22,499 | 0 (0.0%) | 0 (0.0%) |
| $22,500 to $24,999 | 0 (0.0%) | 0 (0.0%) |
| $25,000 to $29,999 | 14 (25.9%) | 9 (9.6%) |
| $30,000 to $34,999 | 6 (11.1%) | 8 (8.5%) |
| $35,000 to $39,999 | 4 (7.4%) | 8 (8.5%) |
| $40,000 to $44,999 | 0 (0.0%) | 7 (7.4%) |
| $45,000 to $49,999 | 0 (0.0%) | 0 (0.0%) |
| $50,000 to $54,999 | 0 (0.0%) | 0 (0.0%) |
| $55,000 to $64,999 | 7 (13.0%) | 0 (0.0%) |
| $65,000 to $74,999 | 0 (0.0%) | 0 (0.0%) |
| $75,000 to $99,999 | 0 (0.0%) | 0 (0.0%) |
| $100,000+ | 3 (5.6%) | 0 (0.0%) |
| Total | 54 (100.0%) | 94 (100.0%) |
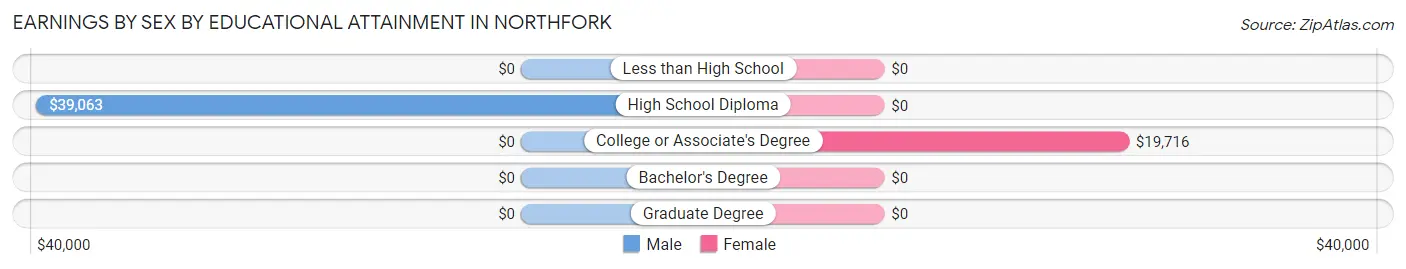
Earnings by Sex by Educational Attainment in Northfork
| Educational Attainment | Male Income | Female Income |
| Less than High School | - | - |
| High School Diploma | $39,063 | $0 |
| College or Associate's Degree | - | - |
| Bachelor's Degree | - | - |
| Graduate Degree | - | - |
| Total | $29,911 | $0 |
Family Income in Northfork
Family Income Brackets in Northfork
According to the Northfork family income data, there are 31 families falling into the $35,000 to $49,999 income range, which is the most common income bracket and makes up 37.3% of all families.
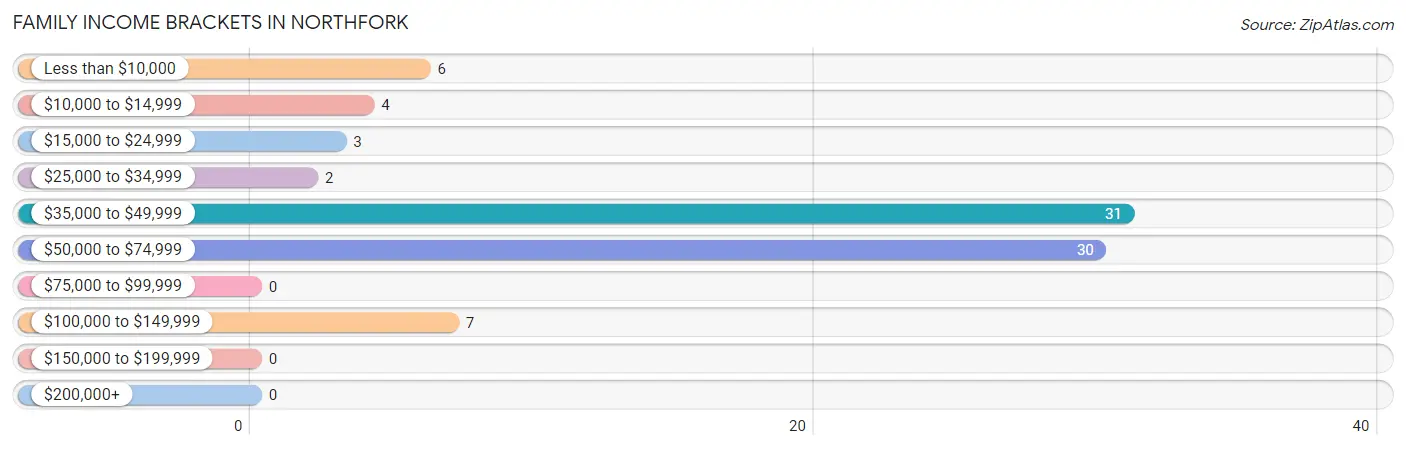
| Income Bracket | # Families | % Families |
| Less than $10,000 | 6 | 7.2% |
| $10,000 to $14,999 | 4 | 4.8% |
| $15,000 to $24,999 | 3 | 3.6% |
| $25,000 to $34,999 | 2 | 2.4% |
| $35,000 to $49,999 | 31 | 37.3% |
| $50,000 to $74,999 | 30 | 36.1% |
| $75,000 to $99,999 | 0 | 0.0% |
| $100,000 to $149,999 | 7 | 8.4% |
| $150,000 to $199,999 | 0 | 0.0% |
| $200,000+ | 0 | 0.0% |
Family Income by Famaliy Size in Northfork
2-person families (42 | 50.6%) account for the highest median family income in Northfork with $63,750 per family, while 2-person families (42 | 50.6%) have the highest median income of $31,875 per family member.
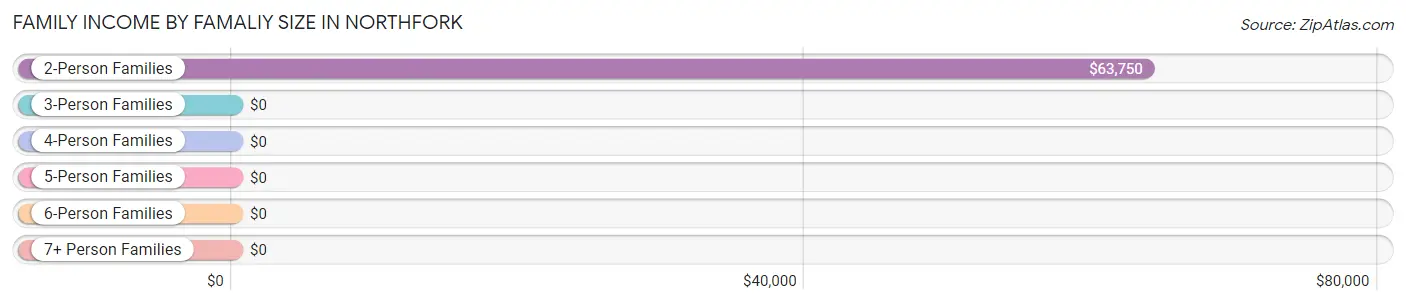
| Income Bracket | # Families | Median Income |
| 2-Person Families | 42 (50.6%) | $63,750 |
| 3-Person Families | 11 (13.3%) | $0 |
| 4-Person Families | 17 (20.5%) | $0 |
| 5-Person Families | 0 (0.0%) | $0 |
| 6-Person Families | 8 (9.6%) | $0 |
| 7+ Person Families | 5 (6.0%) | $0 |
| Total | 83 (100.0%) | $46,250 |
Family Income by Number of Earners in Northfork
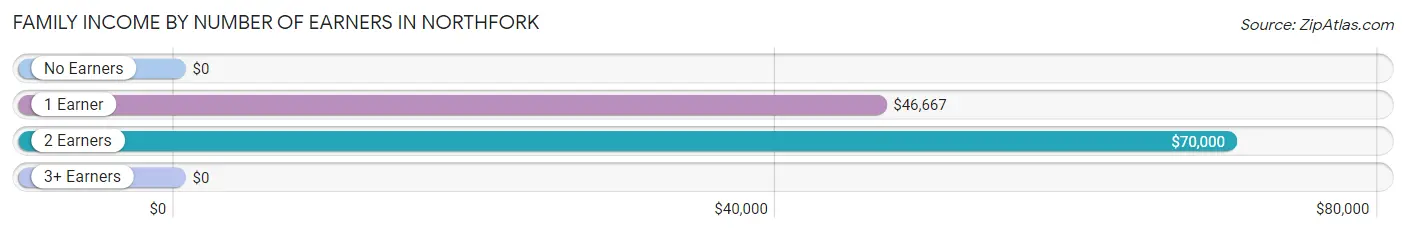
| Number of Earners | # Families | Median Income |
| No Earners | 18 (21.7%) | $0 |
| 1 Earner | 24 (28.9%) | $46,667 |
| 2 Earners | 36 (43.4%) | $70,000 |
| 3+ Earners | 5 (6.0%) | $0 |
| Total | 83 (100.0%) | $46,250 |
Household Income in Northfork
Household Income Brackets in Northfork
With 31 households falling in the category, the $35,000 to $49,999 income range is the most frequent in Northfork, accounting for 26.7% of all households.
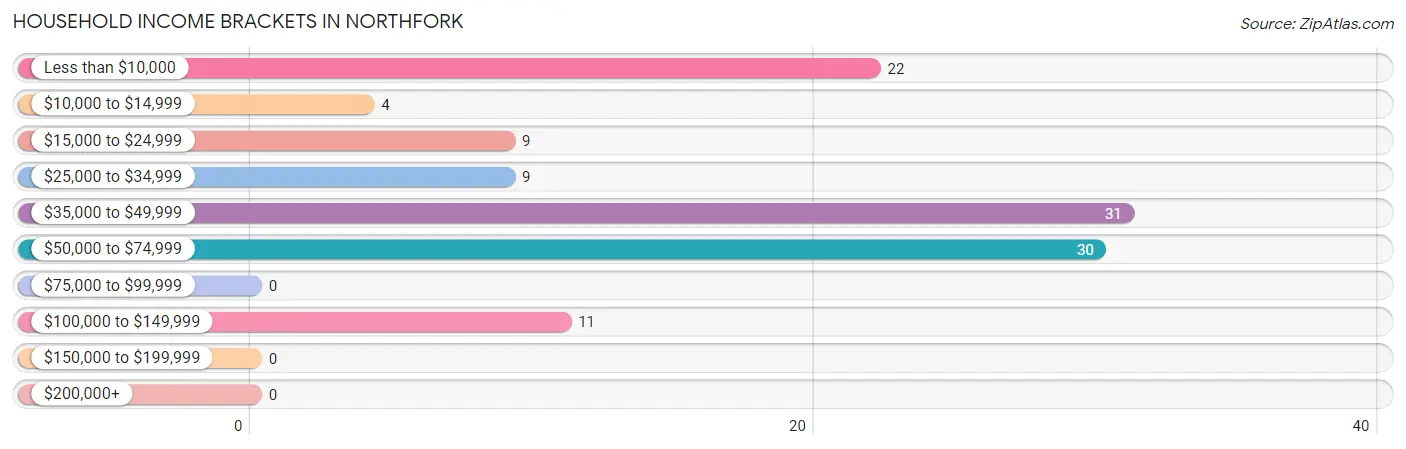
| Income Bracket | # Households | % Households |
| Less than $10,000 | 22 | 19.0% |
| $10,000 to $14,999 | 4 | 3.4% |
| $15,000 to $24,999 | 9 | 7.8% |
| $25,000 to $34,999 | 9 | 7.8% |
| $35,000 to $49,999 | 31 | 26.7% |
| $50,000 to $74,999 | 30 | 25.9% |
| $75,000 to $99,999 | 0 | 0.0% |
| $100,000 to $149,999 | 11 | 9.5% |
| $150,000 to $199,999 | 0 | 0.0% |
| $200,000+ | 0 | 0.0% |
Household Income by Householder Age in Northfork
The median household income in Northfork is $37,059, with the highest median household income of $43,000 found in the 65+ years age bracket for the primary householder. A total of 38 households (32.8%) fall into this category.
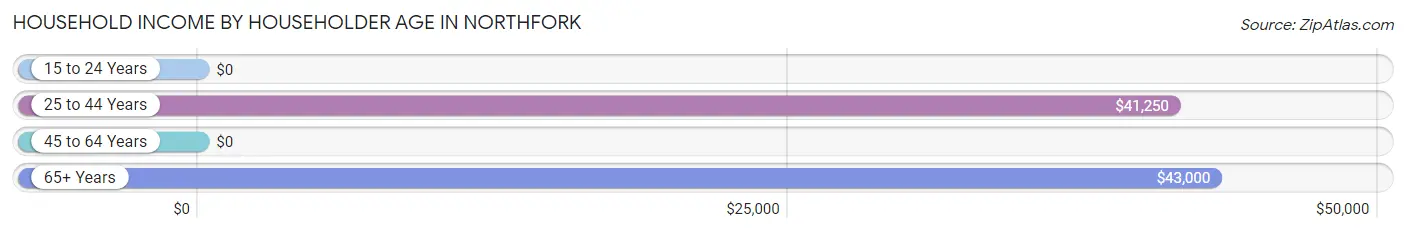
| Income Bracket | # Households | Median Income |
| 15 to 24 Years | 0 (0.0%) | $0 |
| 25 to 44 Years | 34 (29.3%) | $41,250 |
| 45 to 64 Years | 44 (37.9%) | $0 |
| 65+ Years | 38 (32.8%) | $43,000 |
| Total | 116 (100.0%) | $37,059 |
Poverty in Northfork
Income Below Poverty by Sex and Age in Northfork
With 51.8% poverty level for males and 23.7% for females among the residents of Northfork, under 5 year old males and 55 to 64 year old females are the most vulnerable to poverty, with 8 males (100.0%) and 6 females (66.7%) in their respective age groups living below the poverty level.
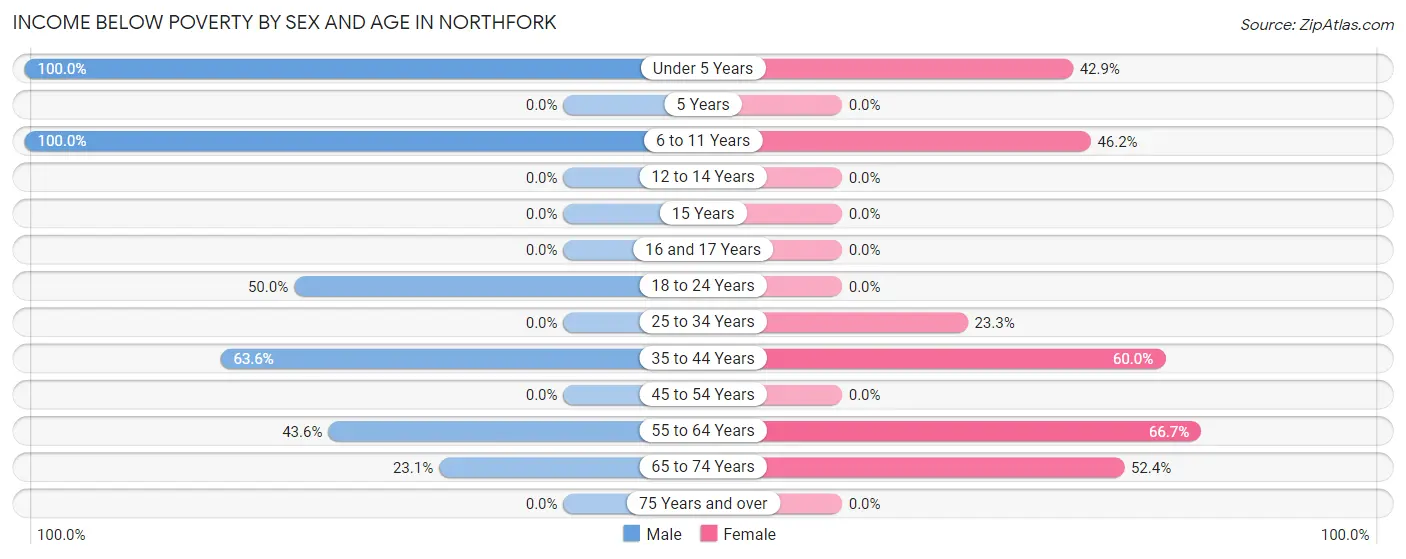
| Age Bracket | Male | Female |
| Under 5 Years | 8 (100.0%) | 6 (42.9%) |
| 5 Years | 0 (0.0%) | 0 (0.0%) |
| 6 to 11 Years | 22 (100.0%) | 6 (46.2%) |
| 12 to 14 Years | 0 (0.0%) | 0 (0.0%) |
| 15 Years | 0 (0.0%) | 0 (0.0%) |
| 16 and 17 Years | 0 (0.0%) | 0 (0.0%) |
| 18 to 24 Years | 8 (50.0%) | 0 (0.0%) |
| 25 to 34 Years | 0 (0.0%) | 21 (23.3%) |
| 35 to 44 Years | 7 (63.6%) | 12 (60.0%) |
| 45 to 54 Years | 0 (0.0%) | 0 (0.0%) |
| 55 to 64 Years | 24 (43.6%) | 6 (66.7%) |
| 65 to 74 Years | 3 (23.1%) | 11 (52.4%) |
| 75 Years and over | 0 (0.0%) | 0 (0.0%) |
| Total | 72 (51.8%) | 62 (23.7%) |
Income Above Poverty by Sex and Age in Northfork
According to the poverty statistics in Northfork, males aged 15 years and females aged 16 and 17 years are the age groups that are most secure financially, with 100.0% of males and 100.0% of females in these age groups living above the poverty line.
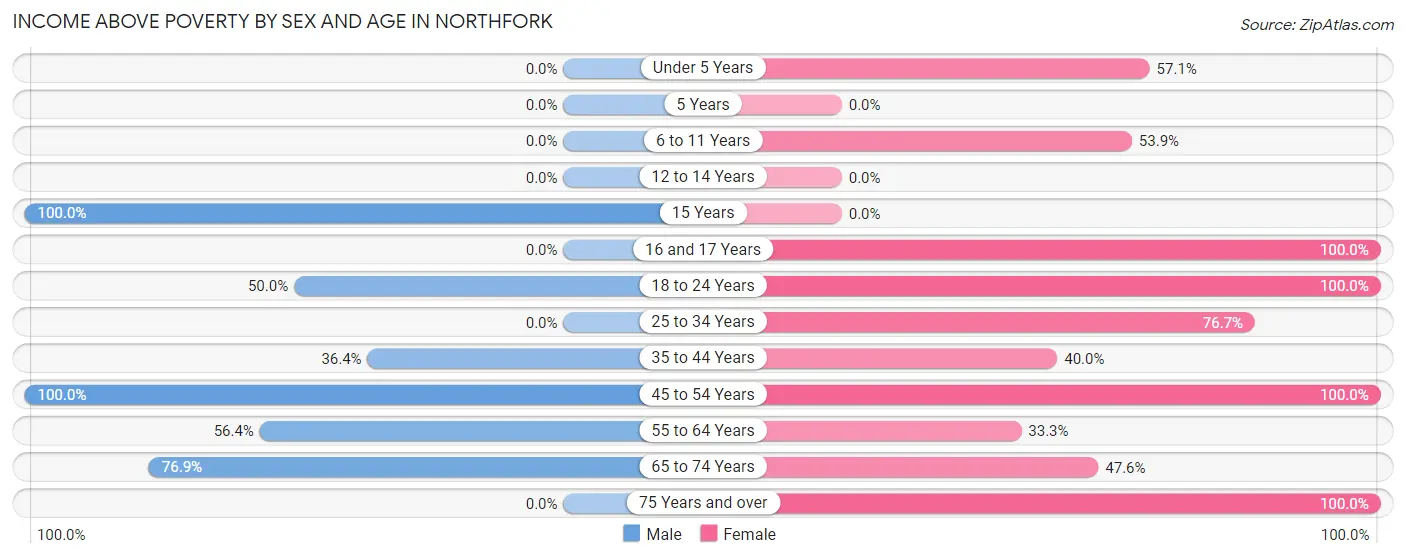
| Age Bracket | Male | Female |
| Under 5 Years | 0 (0.0%) | 8 (57.1%) |
| 5 Years | 0 (0.0%) | 0 (0.0%) |
| 6 to 11 Years | 0 (0.0%) | 7 (53.8%) |
| 12 to 14 Years | 0 (0.0%) | 0 (0.0%) |
| 15 Years | 11 (100.0%) | 0 (0.0%) |
| 16 and 17 Years | 0 (0.0%) | 8 (100.0%) |
| 18 to 24 Years | 8 (50.0%) | 12 (100.0%) |
| 25 to 34 Years | 0 (0.0%) | 69 (76.7%) |
| 35 to 44 Years | 4 (36.4%) | 8 (40.0%) |
| 45 to 54 Years | 3 (100.0%) | 62 (100.0%) |
| 55 to 64 Years | 31 (56.4%) | 3 (33.3%) |
| 65 to 74 Years | 10 (76.9%) | 10 (47.6%) |
| 75 Years and over | 0 (0.0%) | 13 (100.0%) |
| Total | 67 (48.2%) | 200 (76.3%) |
Income Below Poverty Among Married-Couple Families in Northfork
The poverty statistics for married-couple families in Northfork show that 23.1% or 9 of the total 39 families live below the poverty line. Families with no children have the highest poverty rate of 40.9%, comprising of 9 families. On the other hand, families with 1 or 2 children have the lowest poverty rate of 0.0%, which includes 0 families.
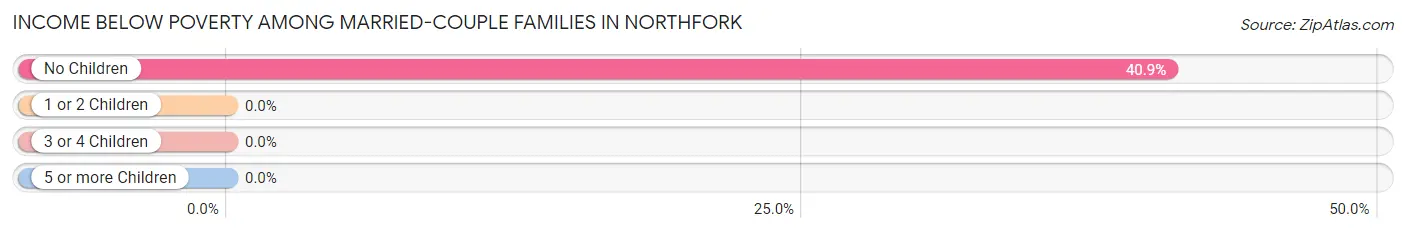
| Children | Above Poverty | Below Poverty |
| No Children | 13 (59.1%) | 9 (40.9%) |
| 1 or 2 Children | 9 (100.0%) | 0 (0.0%) |
| 3 or 4 Children | 8 (100.0%) | 0 (0.0%) |
| 5 or more Children | 0 (0.0%) | 0 (0.0%) |
| Total | 30 (76.9%) | 9 (23.1%) |
Income Below Poverty Among Single-Parent Households in Northfork
According to the poverty data in Northfork, 100.0% or 4 single-father households and 12.5% or 5 single-mother households are living below the poverty line. Among single-father households, those with no children have the highest poverty rate, with 4 households (100.0%) experiencing poverty. Likewise, among single-mother households, those with 5 or more children have the highest poverty rate, with 5 households (100.0%) falling below the poverty line.
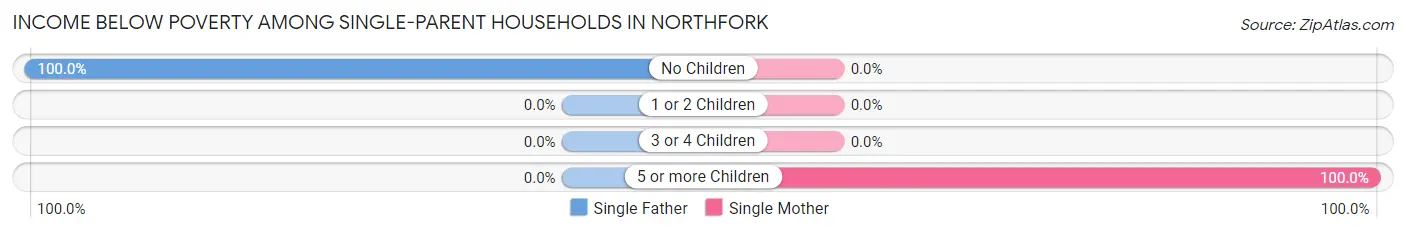
| Children | Single Father | Single Mother |
| No Children | 4 (100.0%) | 0 (0.0%) |
| 1 or 2 Children | 0 (0.0%) | 0 (0.0%) |
| 3 or 4 Children | 0 (0.0%) | 0 (0.0%) |
| 5 or more Children | 0 (0.0%) | 5 (100.0%) |
| Total | 4 (100.0%) | 5 (12.5%) |
Income Below Poverty Among Married-Couple vs Single-Parent Households in Northfork
The poverty data for Northfork shows that 9 of the married-couple family households (23.1%) and 9 of the single-parent households (20.4%) are living below the poverty level. Within the married-couple family households, those with no children have the highest poverty rate, with 9 households (40.9%) falling below the poverty line. Among the single-parent households, those with 5 or more children have the highest poverty rate, with 5 household (100.0%) living below poverty.
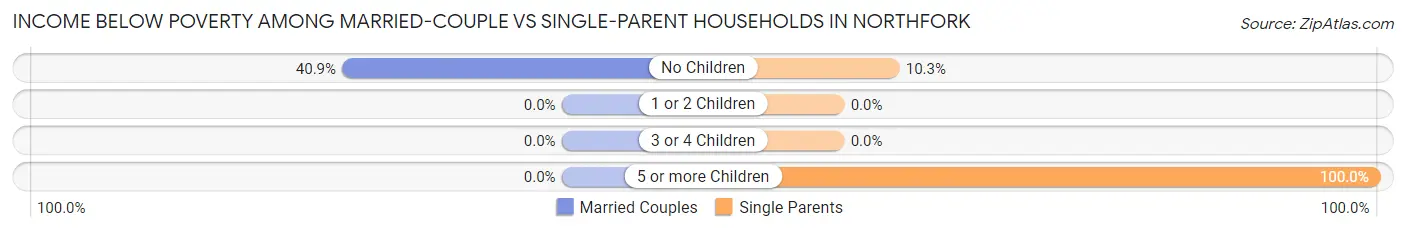
| Children | Married-Couple Families | Single-Parent Households |
| No Children | 9 (40.9%) | 4 (10.3%) |
| 1 or 2 Children | 0 (0.0%) | 0 (0.0%) |
| 3 or 4 Children | 0 (0.0%) | 0 (0.0%) |
| 5 or more Children | 0 (0.0%) | 5 (100.0%) |
| Total | 9 (23.1%) | 9 (20.4%) |
Race in Northfork
The most populous races in Northfork are White / Caucasian (204 | 50.7%), and Black / African American (198 | 49.2%).
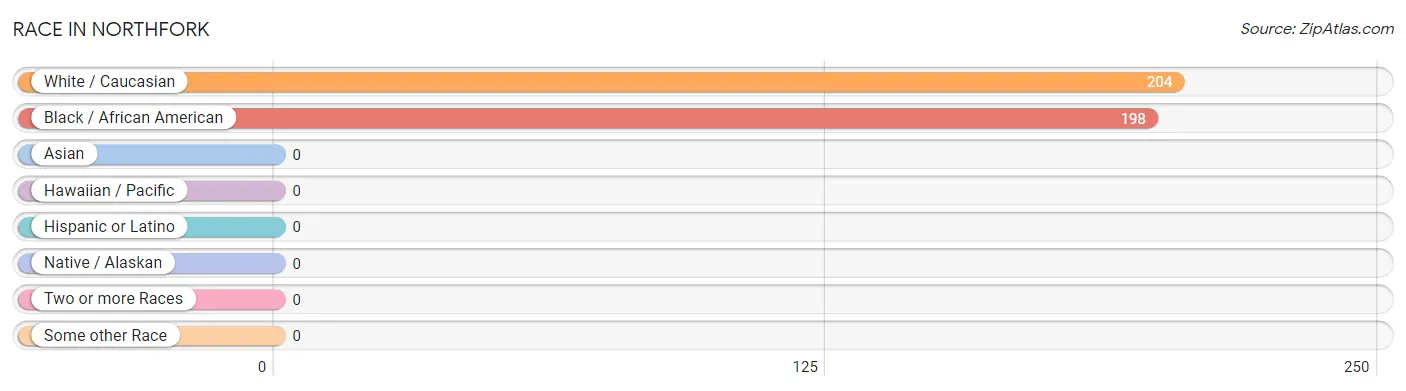
| Race | # Population | % Population |
| Asian | 0 | 0.0% |
| Black / African American | 198 | 49.2% |
| Hawaiian / Pacific | 0 | 0.0% |
| Hispanic or Latino | 0 | 0.0% |
| Native / Alaskan | 0 | 0.0% |
| White / Caucasian | 204 | 50.7% |
| Two or more Races | 0 | 0.0% |
| Some other Race | 0 | 0.0% |
| Total | 402 | 100.0% |
Ancestry in Northfork
The most populous ancestries reported in Northfork are Irish (90 | 22.4%), English (19 | 4.7%), Polish (11 | 2.7%), German (10 | 2.5%), and Scottish (6 | 1.5%), together accounting for 33.8% of all Northfork residents.
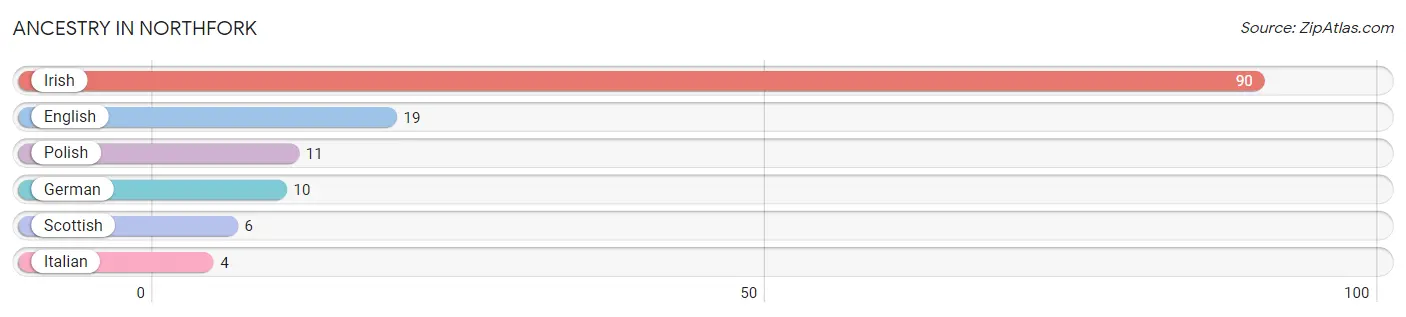
| Ancestry | # Population | % Population |
| English | 19 | 4.7% |
| German | 10 | 2.5% |
| Irish | 90 | 22.4% |
| Italian | 4 | 1.0% |
| Polish | 11 | 2.7% |
| Scottish | 6 | 1.5% | View All 6 Rows |
Immigrants in Northfork
The most numerous immigrant groups reported in Northfork came from Guyana (7 | 1.7%), Latin America (7 | 1.7%), and South America (7 | 1.7%), together accounting for 5.2% of all Northfork residents.
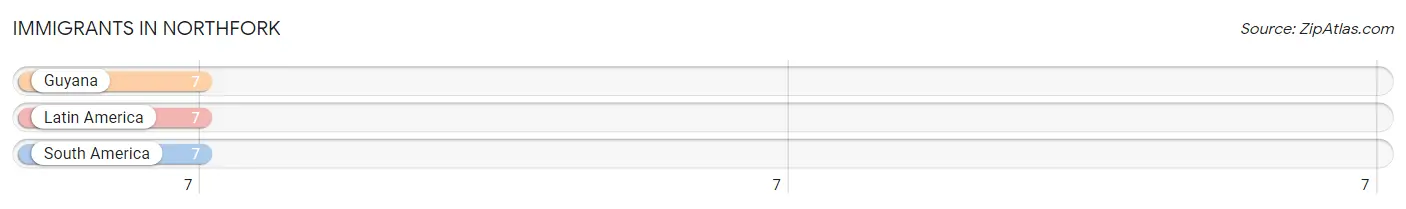
| Immigration Origin | # Population | % Population |
| Guyana | 7 | 1.7% |
| Latin America | 7 | 1.7% |
| South America | 7 | 1.7% | View All 3 Rows |
Sex and Age in Northfork
Sex and Age in Northfork
The most populous age groups in Northfork are 60 to 64 Years (29 | 20.9%) for men and 30 to 34 Years (83 | 31.6%) for women.
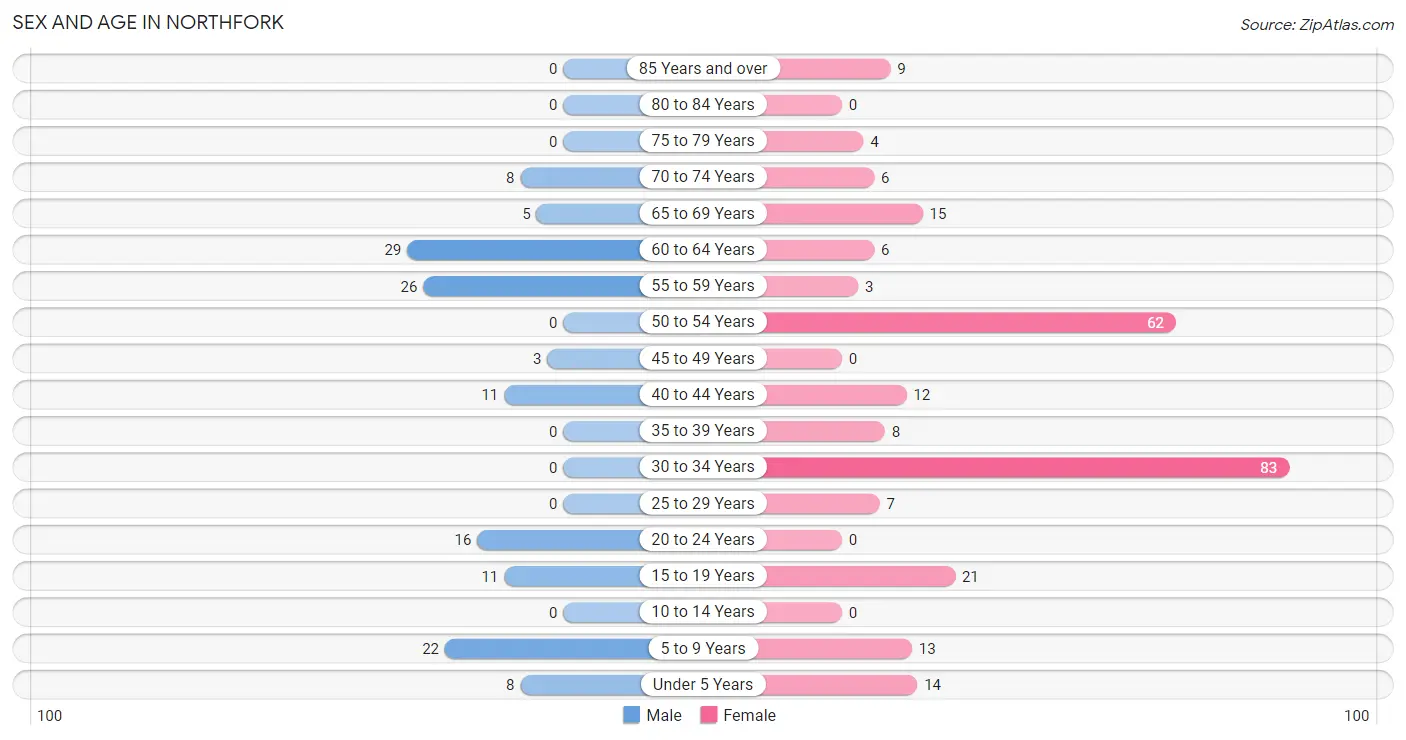
| Age Bracket | Male | Female |
| Under 5 Years | 8 (5.8%) | 14 (5.3%) |
| 5 to 9 Years | 22 (15.8%) | 13 (4.9%) |
| 10 to 14 Years | 0 (0.0%) | 0 (0.0%) |
| 15 to 19 Years | 11 (7.9%) | 21 (8.0%) |
| 20 to 24 Years | 16 (11.5%) | 0 (0.0%) |
| 25 to 29 Years | 0 (0.0%) | 7 (2.7%) |
| 30 to 34 Years | 0 (0.0%) | 83 (31.6%) |
| 35 to 39 Years | 0 (0.0%) | 8 (3.0%) |
| 40 to 44 Years | 11 (7.9%) | 12 (4.6%) |
| 45 to 49 Years | 3 (2.2%) | 0 (0.0%) |
| 50 to 54 Years | 0 (0.0%) | 62 (23.6%) |
| 55 to 59 Years | 26 (18.7%) | 3 (1.1%) |
| 60 to 64 Years | 29 (20.9%) | 6 (2.3%) |
| 65 to 69 Years | 5 (3.6%) | 15 (5.7%) |
| 70 to 74 Years | 8 (5.8%) | 6 (2.3%) |
| 75 to 79 Years | 0 (0.0%) | 4 (1.5%) |
| 80 to 84 Years | 0 (0.0%) | 0 (0.0%) |
| 85 Years and over | 0 (0.0%) | 9 (3.4%) |
| Total | 139 (100.0%) | 263 (100.0%) |
Families and Households in Northfork
Median Family Size in Northfork
The median family size in Northfork is 4.43 persons per family, with single female/mother families (40 | 48.2%) accounting for the largest median family size of 5.85 persons per family. On the other hand, single male/father families (4 | 4.8%) represent the smallest median family size with 3.00 persons per family.
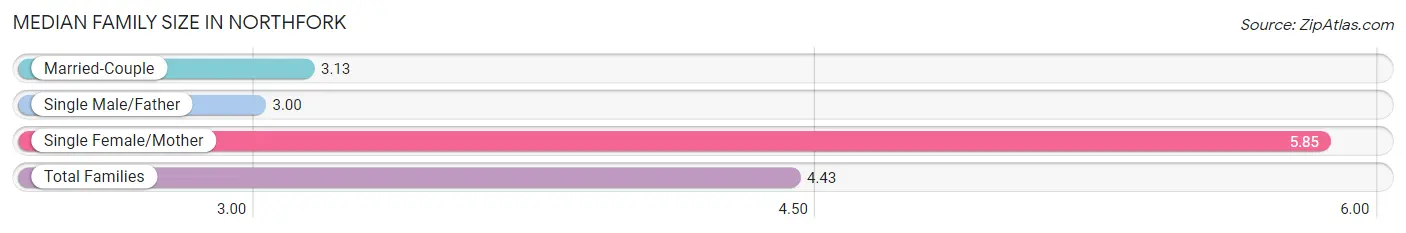
| Family Type | # Families | Family Size |
| Married-Couple | 39 (47.0%) | 3.13 |
| Single Male/Father | 4 (4.8%) | 3.00 |
| Single Female/Mother | 40 (48.2%) | 5.85 |
| Total Families | 83 (100.0%) | 4.43 |
Median Household Size in Northfork
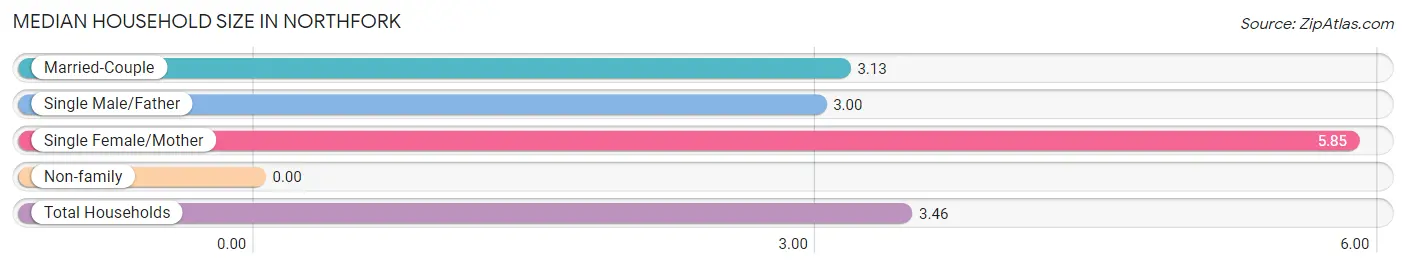
| Household Type | # Households | Household Size |
| Married-Couple | 39 (33.6%) | 3.13 |
| Single Male/Father | 4 (3.5%) | 3.00 |
| Single Female/Mother | 40 (34.5%) | 5.85 |
| Non-family | 33 (28.4%) | - |
| Total Households | 116 (100.0%) | 3.46 |
Household Size by Marriage Status in Northfork
Out of a total of 116 households in Northfork, 83 (71.6%) are family households, while 33 (28.4%) are nonfamily households. The most numerous type of family households are 2-person households, comprising 42, and the most common type of nonfamily households are 1-person households, comprising 33.
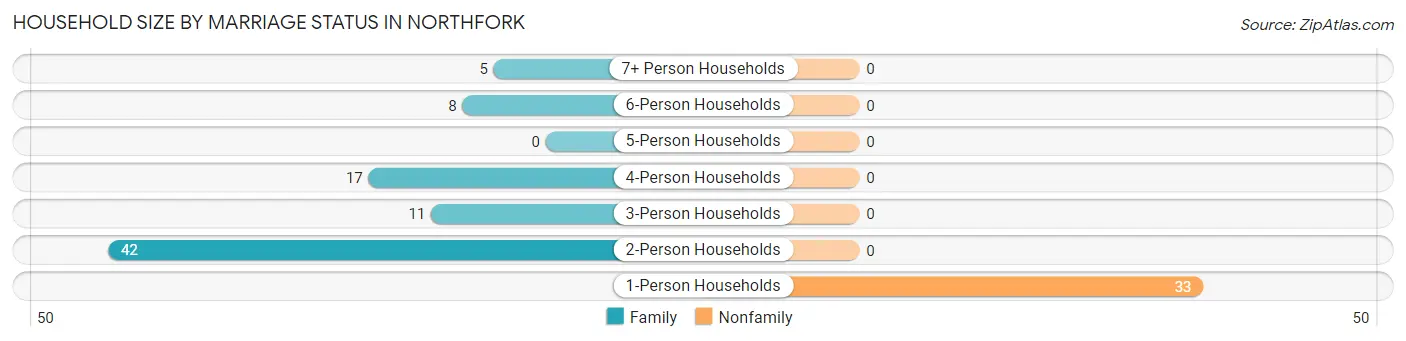
| Household Size | Family Households | Nonfamily Households |
| 1-Person Households | - | 33 (28.4%) |
| 2-Person Households | 42 (36.2%) | 0 (0.0%) |
| 3-Person Households | 11 (9.5%) | 0 (0.0%) |
| 4-Person Households | 17 (14.7%) | 0 (0.0%) |
| 5-Person Households | 0 (0.0%) | 0 (0.0%) |
| 6-Person Households | 8 (6.9%) | 0 (0.0%) |
| 7+ Person Households | 5 (4.3%) | 0 (0.0%) |
| Total | 83 (71.6%) | 33 (28.4%) |
Female Fertility in Northfork
Fertility by Age in Northfork
Average fertility rate in Northfork is 338.0 births per 1,000 women. Women in the age bracket of 15 to 19 years have the highest fertility rate with 571.0 births per 1,000 women. Women in the age bracket of 20 to 34 years acount for 77.8% of all women with births.
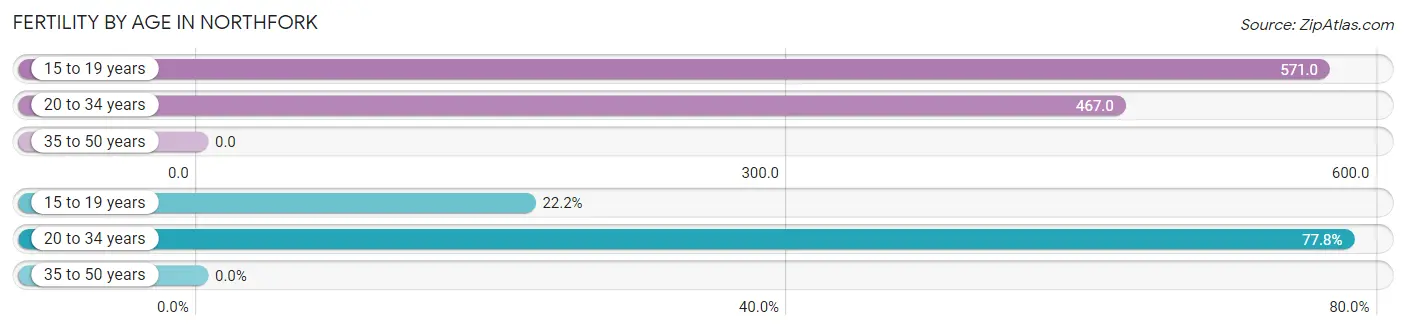
| Age Bracket | Women with Births | Births / 1,000 Women |
| 15 to 19 years | 12 (22.2%) | 571.0 |
| 20 to 34 years | 42 (77.8%) | 467.0 |
| 35 to 50 years | 0 (0.0%) | 0.0 |
| Total | 54 (100.0%) | 338.0 |
Fertility by Age by Marriage Status in Northfork
38.9% of women with births (54) in Northfork are married. The highest percentage of unmarried women with births falls into 15 to 19 years age bracket with 100.0% of them unmarried at the time of birth, while the lowest percentage of unmarried women with births belong to 20 to 34 years age bracket with 50.0% of them unmarried.
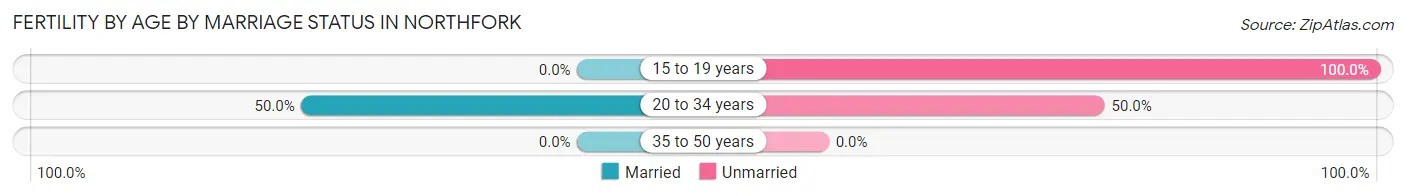
| Age Bracket | Married | Unmarried |
| 15 to 19 years | 0 (0.0%) | 12 (100.0%) |
| 20 to 34 years | 21 (50.0%) | 21 (50.0%) |
| 35 to 50 years | 0 (0.0%) | 0 (0.0%) |
| Total | 21 (38.9%) | 33 (61.1%) |
Fertility by Education in Northfork
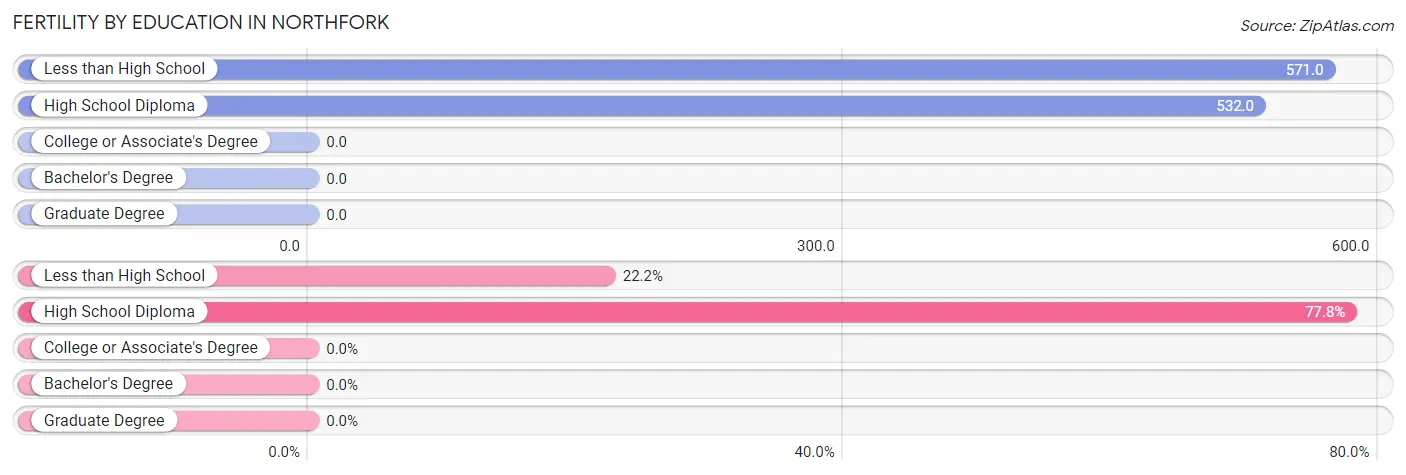
| Educational Attainment | Women with Births | Births / 1,000 Women |
| Less than High School | 12 (22.2%) | 571.0 |
| High School Diploma | 42 (77.8%) | 532.0 |
| College or Associate's Degree | 0 (0.0%) | 0.0 |
| Bachelor's Degree | 0 (0.0%) | 0.0 |
| Graduate Degree | 0 (0.0%) | 0.0 |
| Total | 54 (100.0%) | 338.0 |
Fertility by Education by Marriage Status in Northfork
61.1% of women with births in Northfork are unmarried. Women with the educational attainment of high school diploma are most likely to be married with 50.0% of them married at childbirth, while women with the educational attainment of less than high school are least likely to be married with 100.0% of them unmarried at childbirth.
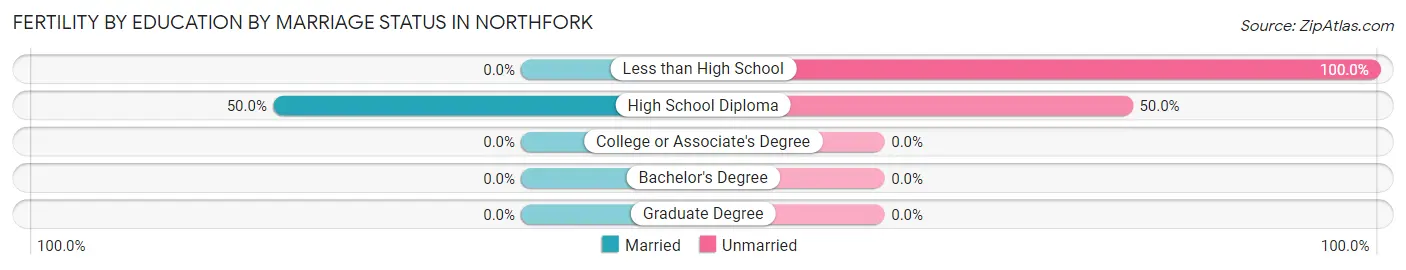
| Educational Attainment | Married | Unmarried |
| Less than High School | 0 (0.0%) | 12 (100.0%) |
| High School Diploma | 21 (50.0%) | 21 (50.0%) |
| College or Associate's Degree | 0 (0.0%) | 0 (0.0%) |
| Bachelor's Degree | 0 (0.0%) | 0 (0.0%) |
| Graduate Degree | 0 (0.0%) | 0 (0.0%) |
| Total | 21 (38.9%) | 33 (61.1%) |
Employment Characteristics in Northfork
Employment by Class of Employer in Northfork
Among the 115 employed individuals in Northfork, private company employees (68 | 59.1%), state government employees (39 | 33.9%), and self-employed (not incorporated) (4 | 3.5%) make up the most common classes of employment.
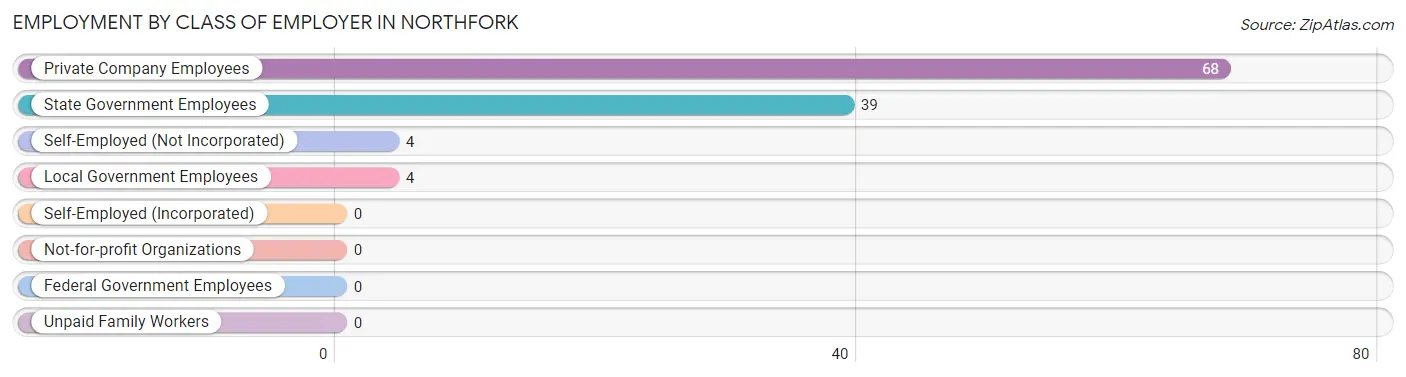
| Employer Class | # Employees | % Employees |
| Private Company Employees | 68 | 59.1% |
| Self-Employed (Incorporated) | 0 | 0.0% |
| Self-Employed (Not Incorporated) | 4 | 3.5% |
| Not-for-profit Organizations | 0 | 0.0% |
| Local Government Employees | 4 | 3.5% |
| State Government Employees | 39 | 33.9% |
| Federal Government Employees | 0 | 0.0% |
| Unpaid Family Workers | 0 | 0.0% |
| Total | 115 | 100.0% |
Employment Status by Age in Northfork
According to the labor force statistics for Northfork, out of the total population over 16 years of age (334), 40.7% or 136 individuals are in the labor force, with 15.4% or 21 of them unemployed. The age group with the highest labor force participation rate is 20 to 24 years, with 81.3% or 13 individuals in the labor force. Within the labor force, the 30 to 34 years age range has the highest percentage of unemployed individuals, with 40.4% or 21 of them being unemployed.
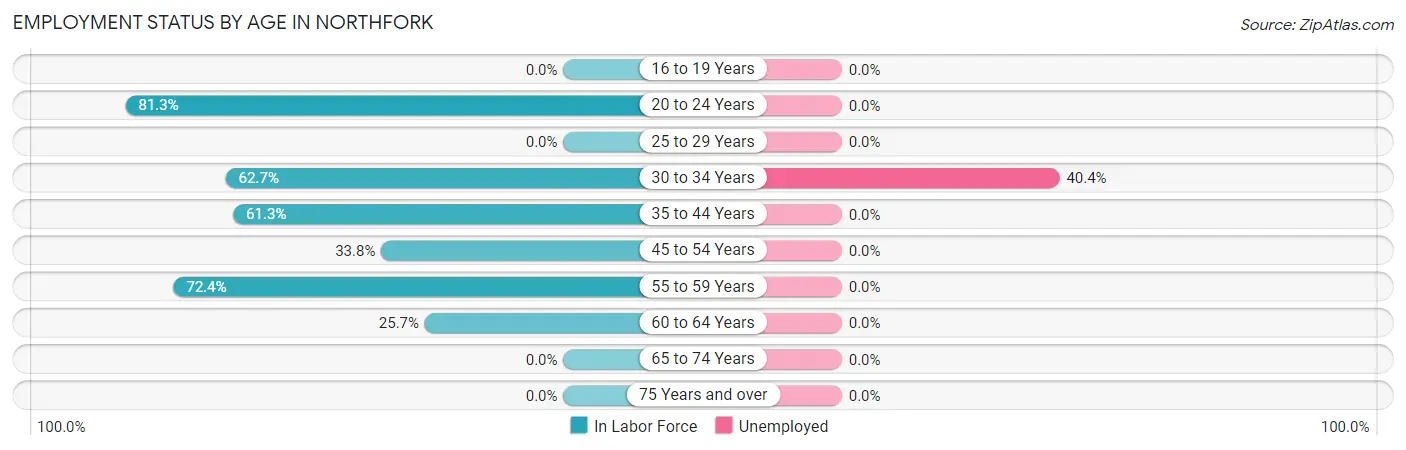
| Age Bracket | In Labor Force | Unemployed |
| 16 to 19 Years | 0 (0.0%) | 0 (0.0%) |
| 20 to 24 Years | 13 (81.3%) | 0 (0.0%) |
| 25 to 29 Years | 0 (0.0%) | 0 (0.0%) |
| 30 to 34 Years | 52 (62.7%) | 21 (40.4%) |
| 35 to 44 Years | 19 (61.3%) | 0 (0.0%) |
| 45 to 54 Years | 22 (33.8%) | 0 (0.0%) |
| 55 to 59 Years | 21 (72.4%) | 0 (0.0%) |
| 60 to 64 Years | 9 (25.7%) | 0 (0.0%) |
| 65 to 74 Years | 0 (0.0%) | 0 (0.0%) |
| 75 Years and over | 0 (0.0%) | 0 (0.0%) |
| Total | 136 (40.7%) | 21 (15.4%) |
Employment Status by Educational Attainment in Northfork
According to labor force statistics for Northfork, 49.2% of individuals (123) out of the total population between 25 and 64 years of age (250) are in the labor force, with 17.1% or 21 of them being unemployed. The group with the highest labor force participation rate are those with the educational attainment of bachelor's degree or higher, with 100.0% or 12 individuals in the labor force. Within the labor force, individuals with high school diploma education have the highest percentage of unemployment, with 40.4% or 21 of them being unemployed.
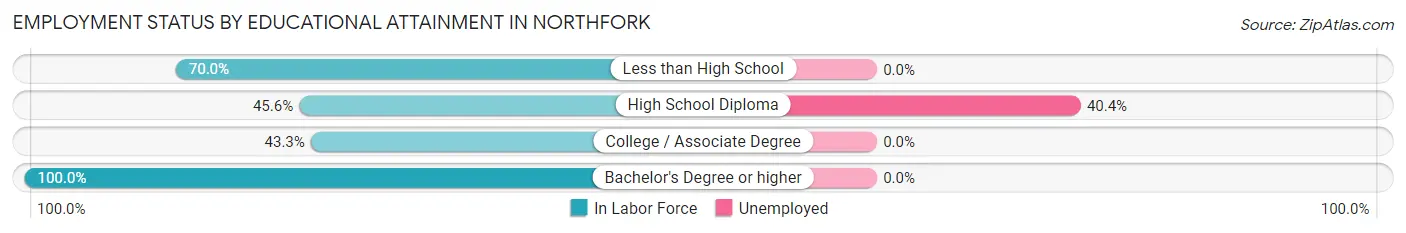
| Educational Attainment | In Labor Force | Unemployed |
| Less than High School | 14 (70.0%) | 0 (0.0%) |
| High School Diploma | 52 (45.6%) | 46 (40.4%) |
| College / Associate Degree | 45 (43.3%) | 0 (0.0%) |
| Bachelor's Degree or higher | 12 (100.0%) | 0 (0.0%) |
| Total | 123 (49.2%) | 43 (17.1%) |
Employment Occupations by Sex in Northfork
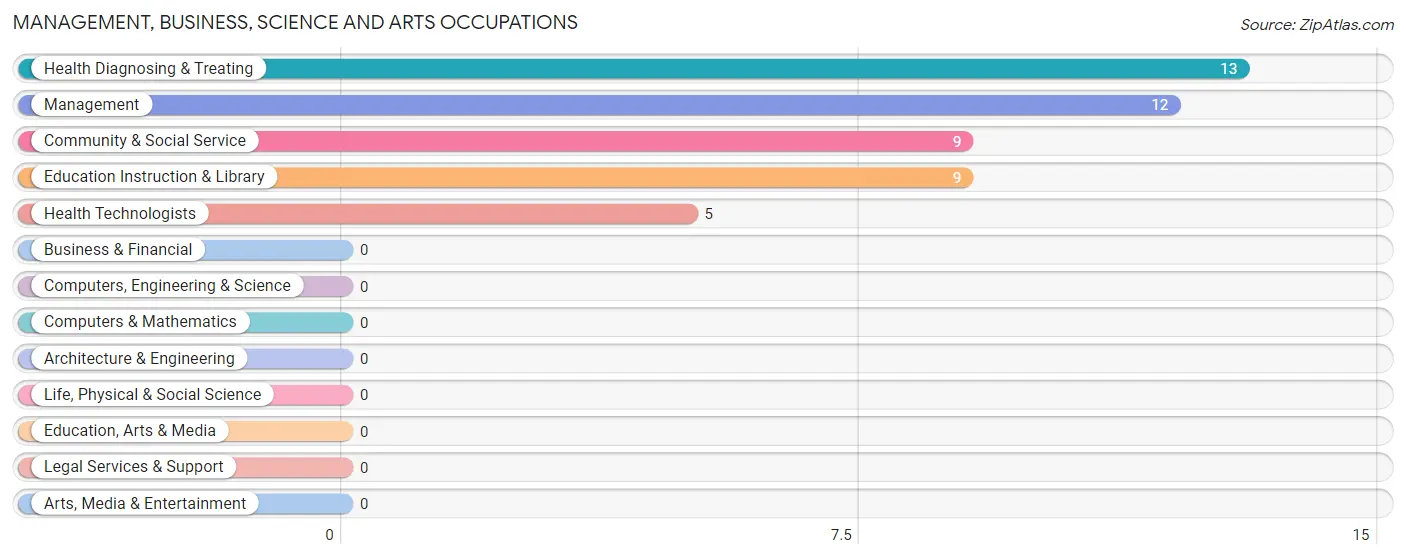
Management, Business, Science and Arts Occupations
The most common Management, Business, Science and Arts occupations in Northfork are Health Diagnosing & Treating (13 | 11.3%), Management (12 | 10.4%), Community & Social Service (9 | 7.8%), Education Instruction & Library (9 | 7.8%), and Health Technologists (5 | 4.3%).
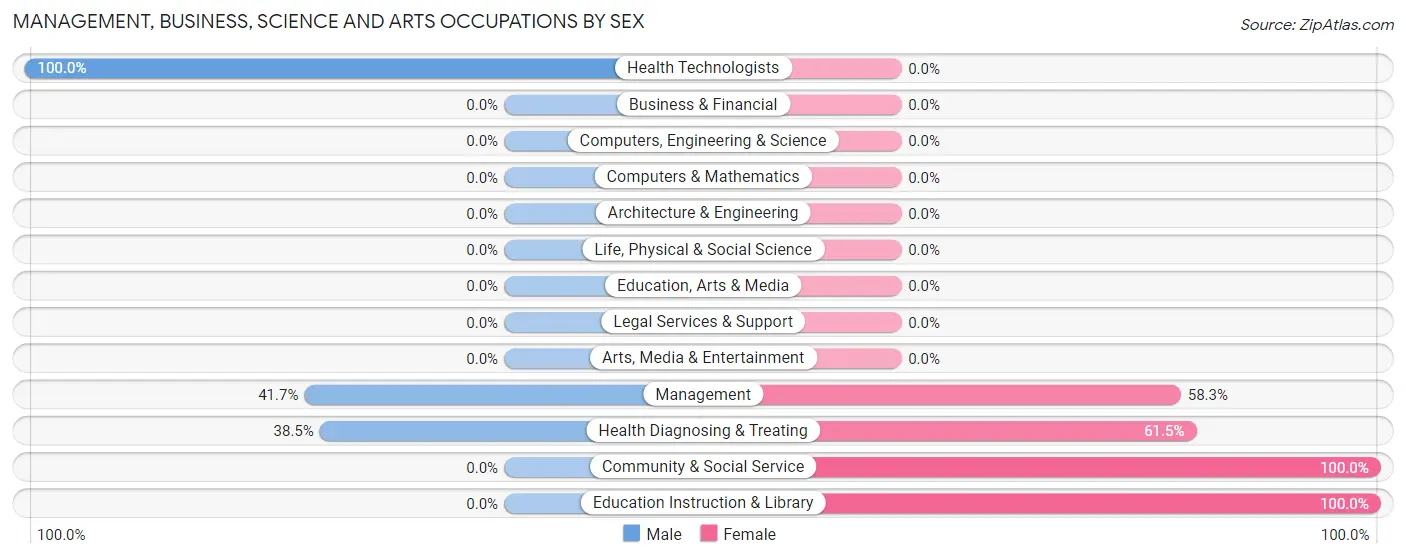
Management, Business, Science and Arts Occupations by Sex
Within the Management, Business, Science and Arts occupations in Northfork, the most male-oriented occupations are Health Technologists (100.0%), Management (41.7%), and Health Diagnosing & Treating (38.5%), while the most female-oriented occupations are Community & Social Service (100.0%), Education Instruction & Library (100.0%), and Health Diagnosing & Treating (61.5%).
| Occupation | Male | Female |
| Management | 5 (41.7%) | 7 (58.3%) |
| Business & Financial | 0 (0.0%) | 0 (0.0%) |
| Computers, Engineering & Science | 0 (0.0%) | 0 (0.0%) |
| Computers & Mathematics | 0 (0.0%) | 0 (0.0%) |
| Architecture & Engineering | 0 (0.0%) | 0 (0.0%) |
| Life, Physical & Social Science | 0 (0.0%) | 0 (0.0%) |
| Community & Social Service | 0 (0.0%) | 9 (100.0%) |
| Education, Arts & Media | 0 (0.0%) | 0 (0.0%) |
| Legal Services & Support | 0 (0.0%) | 0 (0.0%) |
| Education Instruction & Library | 0 (0.0%) | 9 (100.0%) |
| Arts, Media & Entertainment | 0 (0.0%) | 0 (0.0%) |
| Health Diagnosing & Treating | 5 (38.5%) | 8 (61.5%) |
| Health Technologists | 5 (100.0%) | 0 (0.0%) |
| Total (Category) | 10 (29.4%) | 24 (70.6%) |
| Total (Overall) | 54 (47.0%) | 61 (53.0%) |
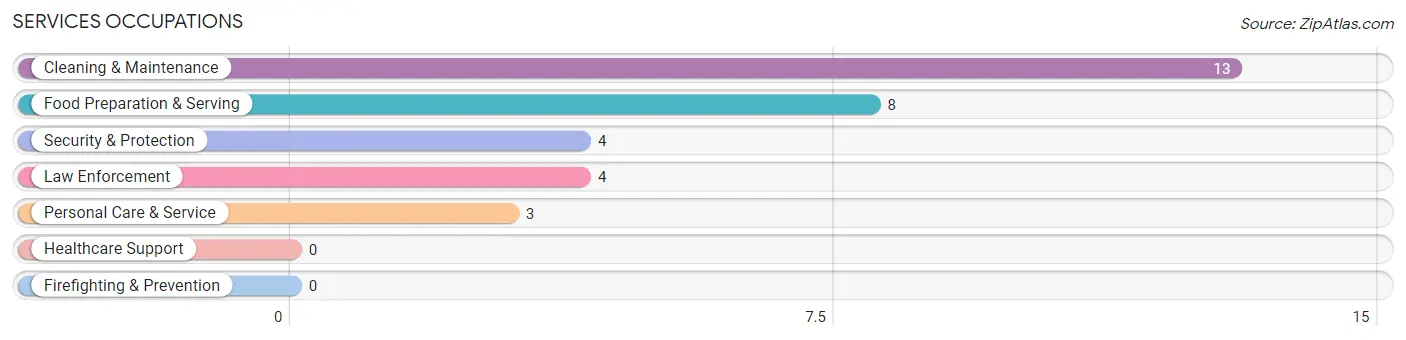
Services Occupations
The most common Services occupations in Northfork are Cleaning & Maintenance (13 | 11.3%), Food Preparation & Serving (8 | 7.0%), Security & Protection (4 | 3.5%), Law Enforcement (4 | 3.5%), and Personal Care & Service (3 | 2.6%).
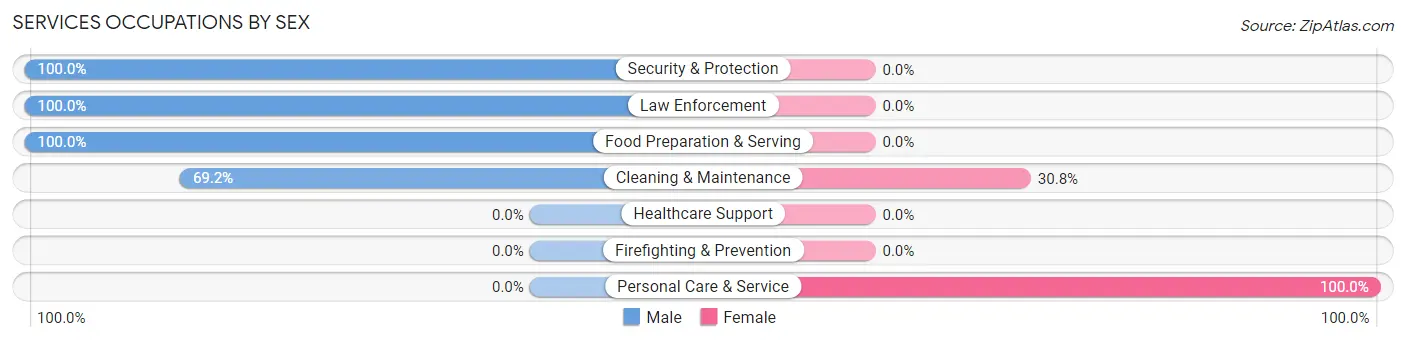
Services Occupations by Sex
Within the Services occupations in Northfork, the most male-oriented occupations are Security & Protection (100.0%), Law Enforcement (100.0%), and Food Preparation & Serving (100.0%), while the most female-oriented occupations are Personal Care & Service (100.0%), and Cleaning & Maintenance (30.8%).
| Occupation | Male | Female |
| Healthcare Support | 0 (0.0%) | 0 (0.0%) |
| Security & Protection | 4 (100.0%) | 0 (0.0%) |
| Firefighting & Prevention | 0 (0.0%) | 0 (0.0%) |
| Law Enforcement | 4 (100.0%) | 0 (0.0%) |
| Food Preparation & Serving | 8 (100.0%) | 0 (0.0%) |
| Cleaning & Maintenance | 9 (69.2%) | 4 (30.8%) |
| Personal Care & Service | 0 (0.0%) | 3 (100.0%) |
| Total (Category) | 21 (75.0%) | 7 (25.0%) |
| Total (Overall) | 54 (47.0%) | 61 (53.0%) |
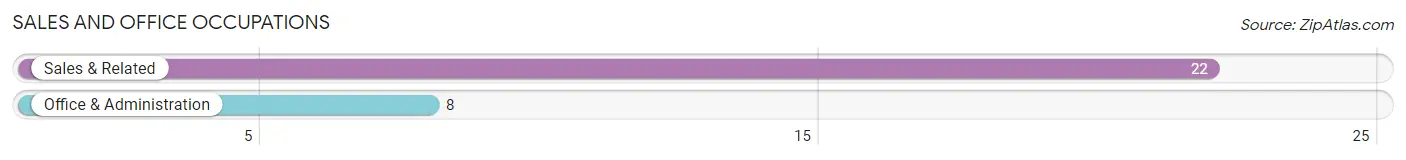
Sales and Office Occupations
The most common Sales and Office occupations in Northfork are Sales & Related (22 | 19.1%), and Office & Administration (8 | 7.0%).
Sales and Office Occupations by Sex
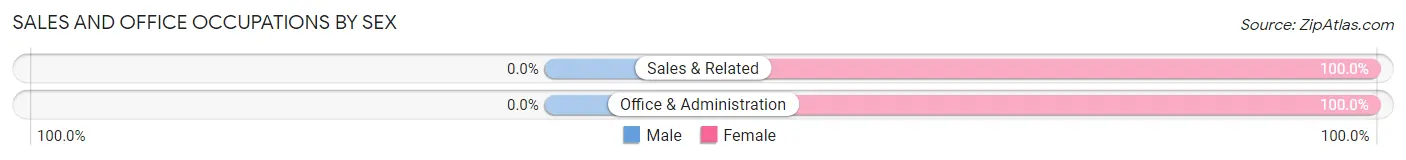
| Occupation | Male | Female |
| Sales & Related | 0 (0.0%) | 22 (100.0%) |
| Office & Administration | 0 (0.0%) | 8 (100.0%) |
| Total (Category) | 0 (0.0%) | 30 (100.0%) |
| Total (Overall) | 54 (47.0%) | 61 (53.0%) |
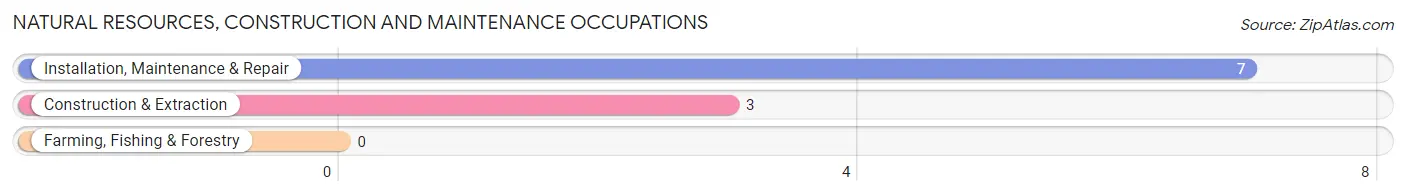
Natural Resources, Construction and Maintenance Occupations
The most common Natural Resources, Construction and Maintenance occupations in Northfork are Installation, Maintenance & Repair (7 | 6.1%), and Construction & Extraction (3 | 2.6%).
Natural Resources, Construction and Maintenance Occupations by Sex
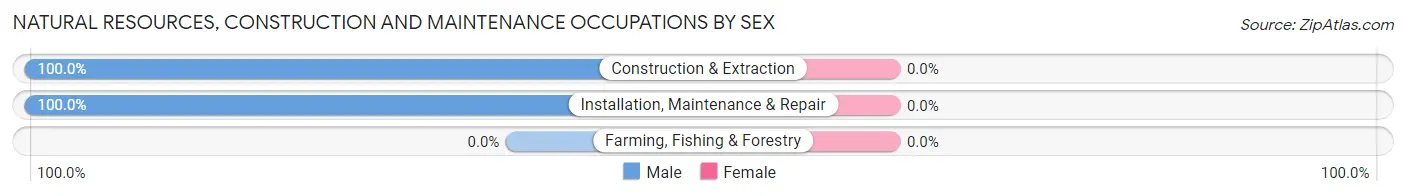
| Occupation | Male | Female |
| Farming, Fishing & Forestry | 0 (0.0%) | 0 (0.0%) |
| Construction & Extraction | 3 (100.0%) | 0 (0.0%) |
| Installation, Maintenance & Repair | 7 (100.0%) | 0 (0.0%) |
| Total (Category) | 10 (100.0%) | 0 (0.0%) |
| Total (Overall) | 54 (47.0%) | 61 (53.0%) |
Production, Transportation and Moving Occupations
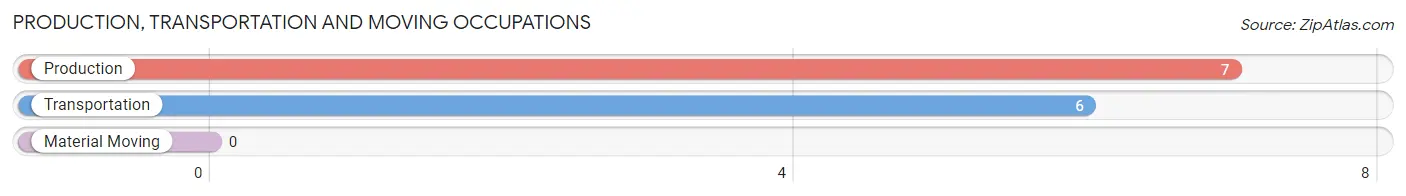
The most common Production, Transportation and Moving occupations in Northfork are Production (7 | 6.1%), and Transportation (6 | 5.2%).
Production, Transportation and Moving Occupations by Sex
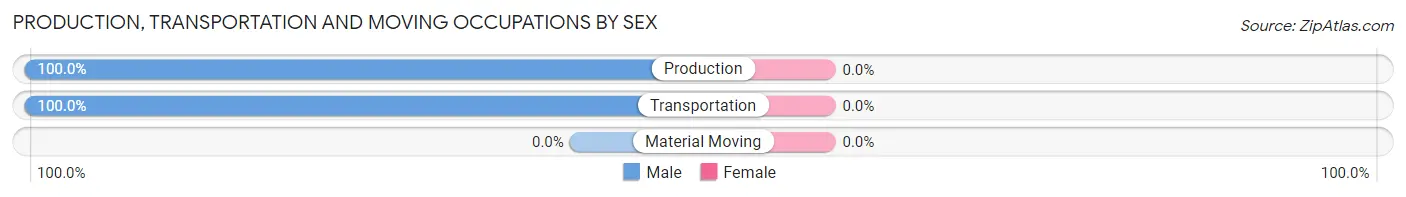
| Occupation | Male | Female |
| Production | 7 (100.0%) | 0 (0.0%) |
| Transportation | 6 (100.0%) | 0 (0.0%) |
| Material Moving | 0 (0.0%) | 0 (0.0%) |
| Total (Category) | 13 (100.0%) | 0 (0.0%) |
| Total (Overall) | 54 (47.0%) | 61 (53.0%) |
Employment Industries by Sex in Northfork
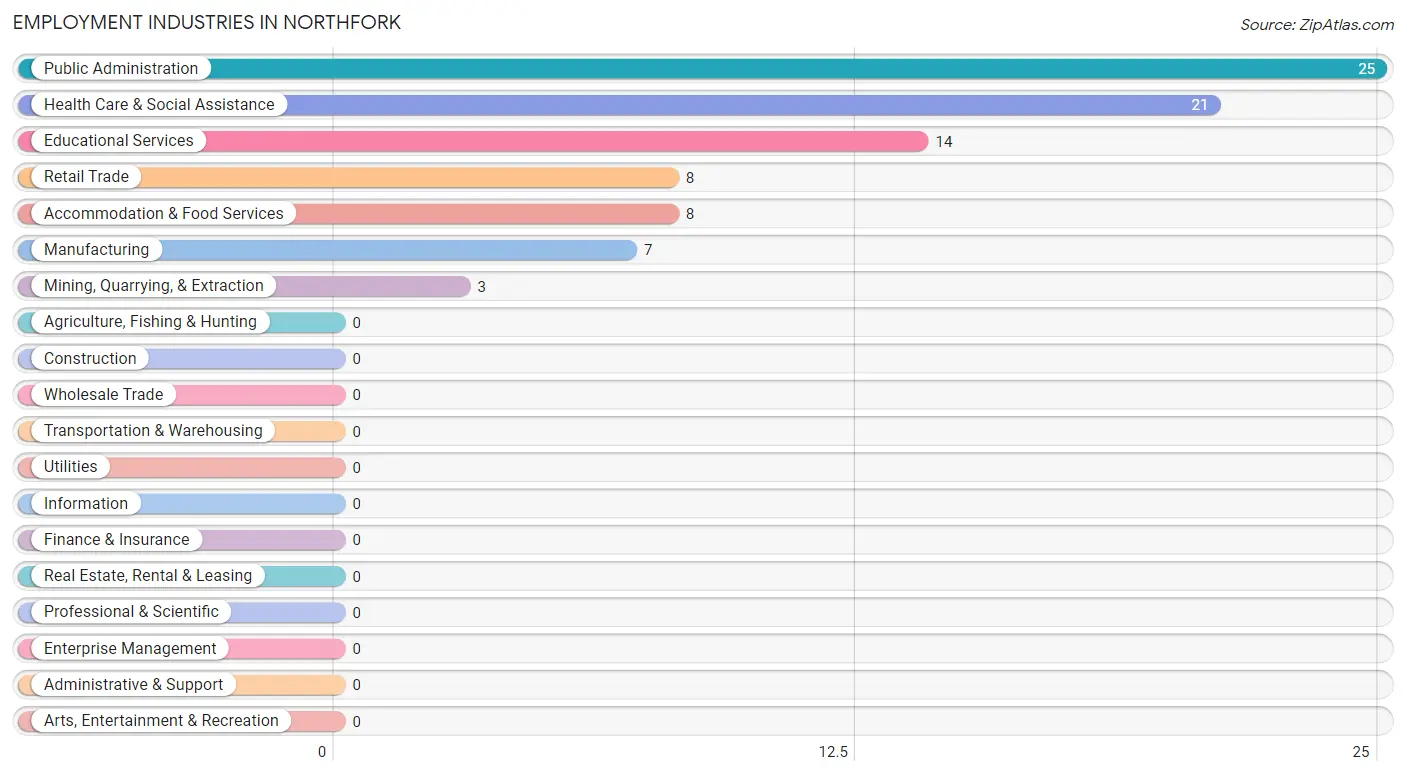
Employment Industries in Northfork
The major employment industries in Northfork include Public Administration (25 | 21.7%), Health Care & Social Assistance (21 | 18.3%), Educational Services (14 | 12.2%), Retail Trade (8 | 7.0%), and Accommodation & Food Services (8 | 7.0%).
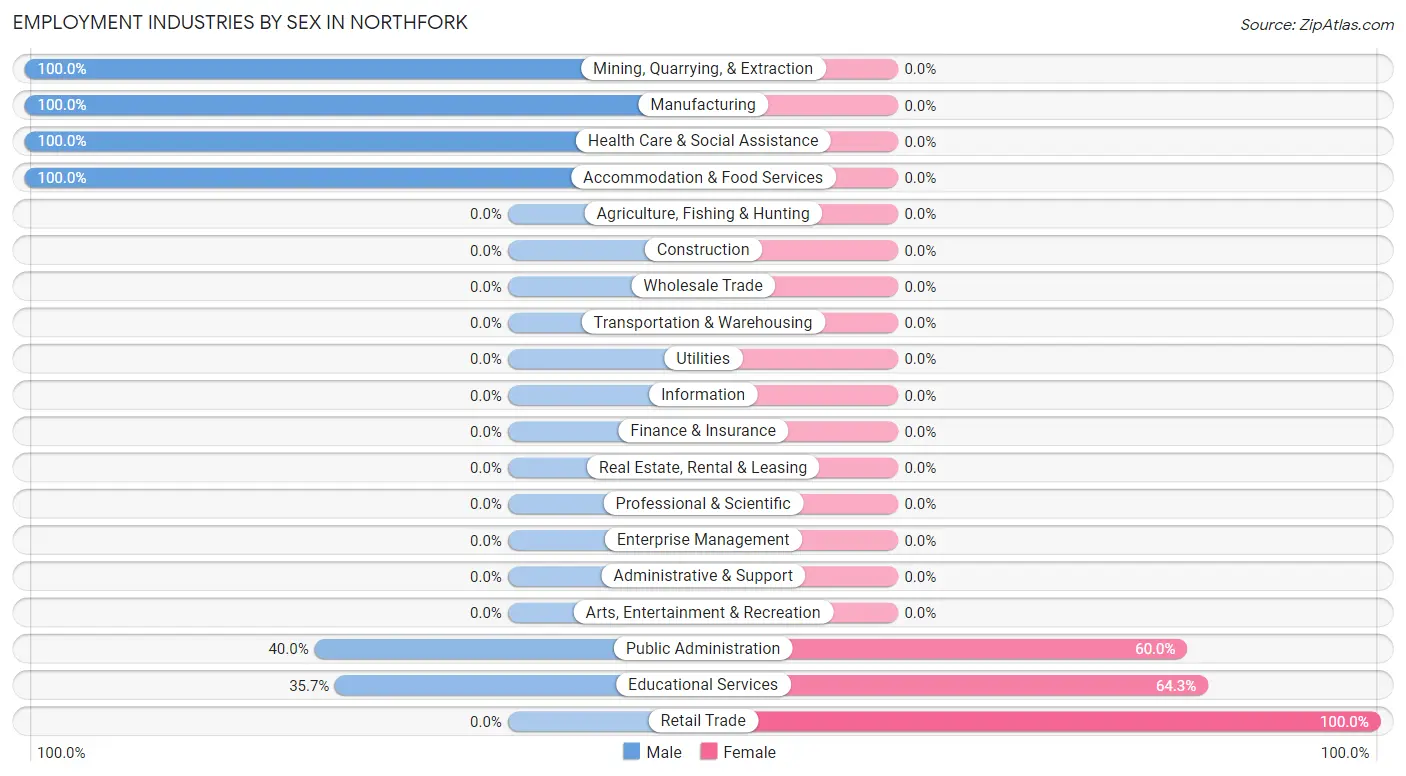
Employment Industries by Sex in Northfork
The Northfork industries that see more men than women are Mining, Quarrying, & Extraction (100.0%), Manufacturing (100.0%), and Health Care & Social Assistance (100.0%), whereas the industries that tend to have a higher number of women are Retail Trade (100.0%), Educational Services (64.3%), and Public Administration (60.0%).
| Industry | Male | Female |
| Agriculture, Fishing & Hunting | 0 (0.0%) | 0 (0.0%) |
| Mining, Quarrying, & Extraction | 3 (100.0%) | 0 (0.0%) |
| Construction | 0 (0.0%) | 0 (0.0%) |
| Manufacturing | 7 (100.0%) | 0 (0.0%) |
| Wholesale Trade | 0 (0.0%) | 0 (0.0%) |
| Retail Trade | 0 (0.0%) | 8 (100.0%) |
| Transportation & Warehousing | 0 (0.0%) | 0 (0.0%) |
| Utilities | 0 (0.0%) | 0 (0.0%) |
| Information | 0 (0.0%) | 0 (0.0%) |
| Finance & Insurance | 0 (0.0%) | 0 (0.0%) |
| Real Estate, Rental & Leasing | 0 (0.0%) | 0 (0.0%) |
| Professional & Scientific | 0 (0.0%) | 0 (0.0%) |
| Enterprise Management | 0 (0.0%) | 0 (0.0%) |
| Administrative & Support | 0 (0.0%) | 0 (0.0%) |
| Educational Services | 5 (35.7%) | 9 (64.3%) |
| Health Care & Social Assistance | 21 (100.0%) | 0 (0.0%) |
| Arts, Entertainment & Recreation | 0 (0.0%) | 0 (0.0%) |
| Accommodation & Food Services | 8 (100.0%) | 0 (0.0%) |
| Public Administration | 10 (40.0%) | 15 (60.0%) |
| Total | 54 (47.0%) | 61 (53.0%) |
Education in Northfork
School Enrollment in Northfork
The most common levels of schooling among the 75 students in Northfork are high school (32 | 42.7%), elementary school (29 | 38.7%), and kindergarten (6 | 8.0%).
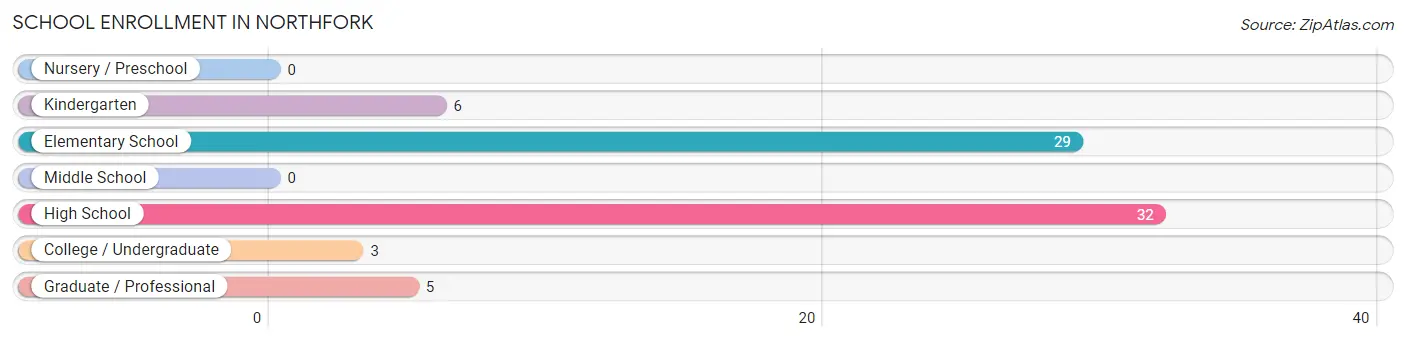
| School Level | # Students | % Students |
| Nursery / Preschool | 0 | 0.0% |
| Kindergarten | 6 | 8.0% |
| Elementary School | 29 | 38.7% |
| Middle School | 0 | 0.0% |
| High School | 32 | 42.7% |
| College / Undergraduate | 3 | 4.0% |
| Graduate / Professional | 5 | 6.7% |
| Total | 75 | 100.0% |
School Enrollment by Age by Funding Source in Northfork
Out of a total of 75 students who are enrolled in schools in Northfork, 1 (1.3%) attend a private institution, while the remaining 74 (98.7%) are enrolled in public schools. The age group of 15 to 17 year olds has the highest likelihood of being enrolled in private schools, with 1 (5.0% in the age bracket) enrolled. Conversely, the age group of 5 to 9 year old has the lowest likelihood of being enrolled in a private school, with 35 (100.0% in the age bracket) attending a public institution.
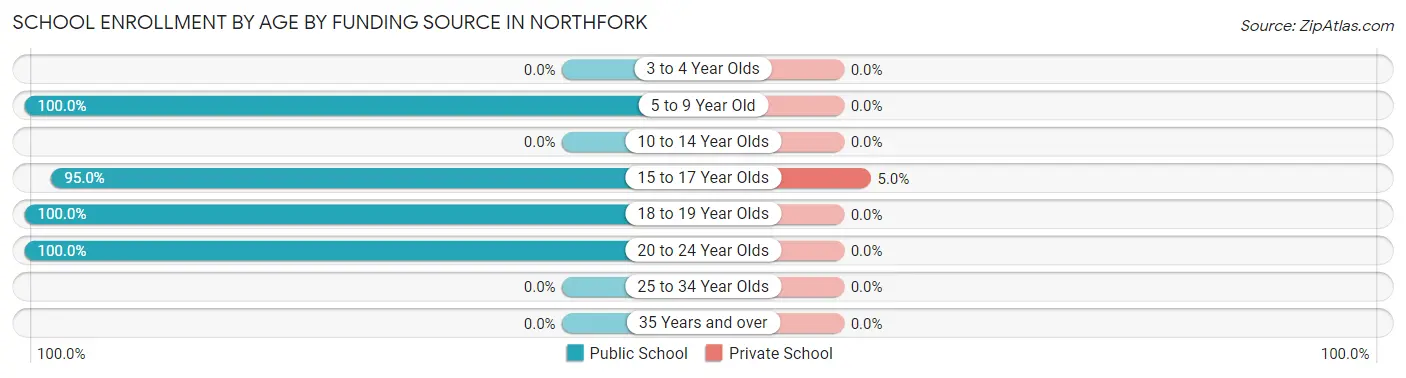
| Age Bracket | Public School | Private School |
| 3 to 4 Year Olds | 0 (0.0%) | 0 (0.0%) |
| 5 to 9 Year Old | 35 (100.0%) | 0 (0.0%) |
| 10 to 14 Year Olds | 0 (0.0%) | 0 (0.0%) |
| 15 to 17 Year Olds | 19 (95.0%) | 1 (5.0%) |
| 18 to 19 Year Olds | 12 (100.0%) | 0 (0.0%) |
| 20 to 24 Year Olds | 8 (100.0%) | 0 (0.0%) |
| 25 to 34 Year Olds | 0 (0.0%) | 0 (0.0%) |
| 35 Years and over | 0 (0.0%) | 0 (0.0%) |
| Total | 74 (98.7%) | 1 (1.3%) |
Educational Attainment by Field of Study in Northfork
Physical & health sciences (7 | 46.7%), science & technology (5 | 33.3%), and education (3 | 20.0%) are the most common fields of study among 15 individuals in Northfork who have obtained a bachelor's degree or higher.
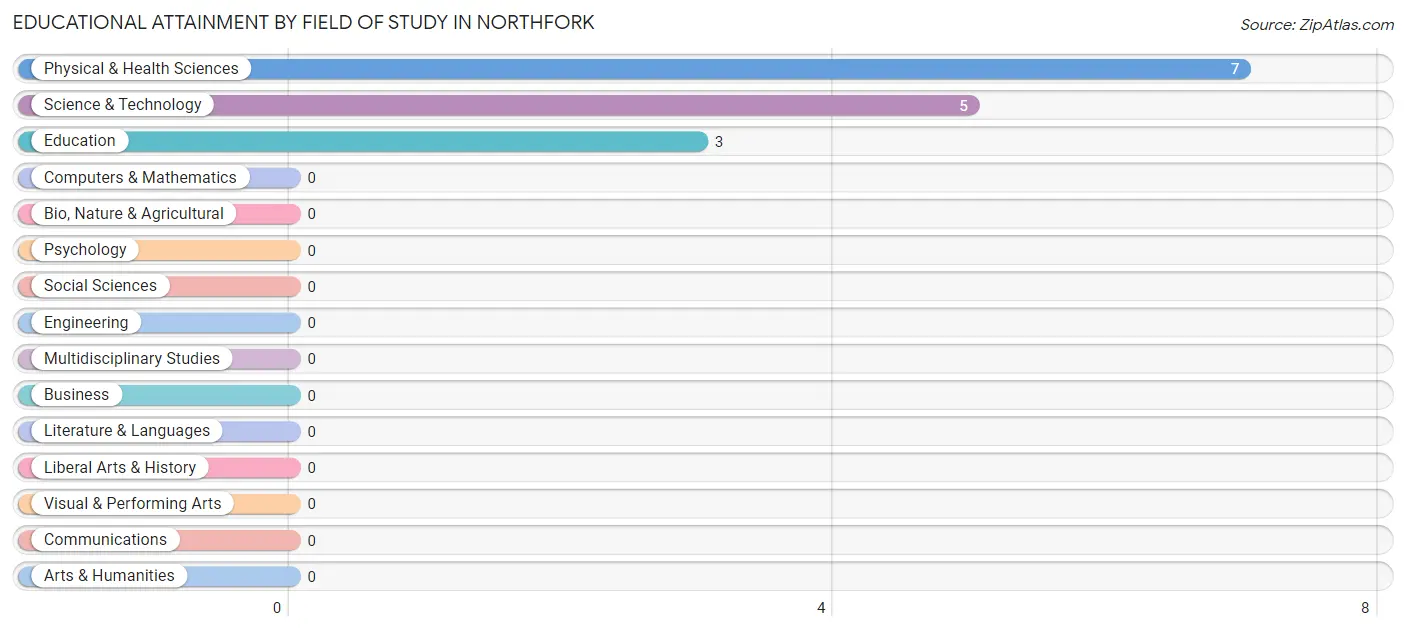
| Field of Study | # Graduates | % Graduates |
| Computers & Mathematics | 0 | 0.0% |
| Bio, Nature & Agricultural | 0 | 0.0% |
| Physical & Health Sciences | 7 | 46.7% |
| Psychology | 0 | 0.0% |
| Social Sciences | 0 | 0.0% |
| Engineering | 0 | 0.0% |
| Multidisciplinary Studies | 0 | 0.0% |
| Science & Technology | 5 | 33.3% |
| Business | 0 | 0.0% |
| Education | 3 | 20.0% |
| Literature & Languages | 0 | 0.0% |
| Liberal Arts & History | 0 | 0.0% |
| Visual & Performing Arts | 0 | 0.0% |
| Communications | 0 | 0.0% |
| Arts & Humanities | 0 | 0.0% |
| Total | 15 | 100.0% |
Transportation & Commute in Northfork
Vehicle Availability by Sex in Northfork
The most prevalent vehicle ownership categories in Northfork are males with 2 vehicles (29, accounting for 53.7%) and females with 2 vehicles (36, making up 47.5%).
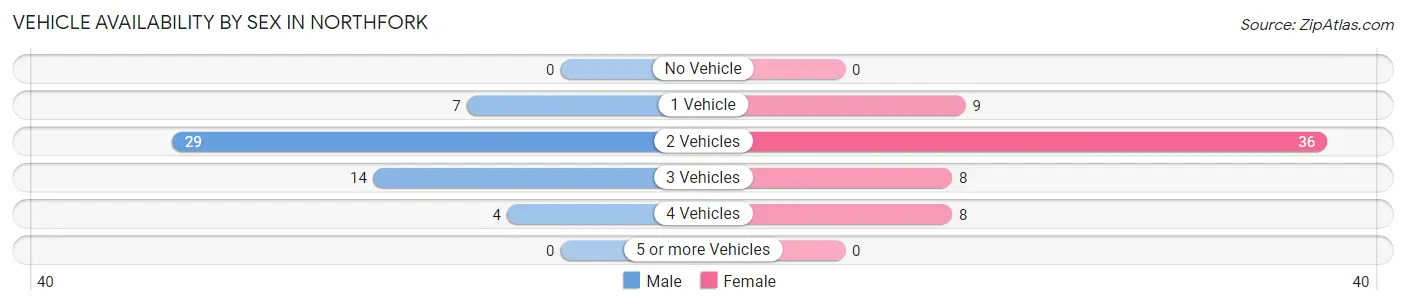
| Vehicles Available | Male | Female |
| No Vehicle | 0 (0.0%) | 0 (0.0%) |
| 1 Vehicle | 7 (13.0%) | 9 (14.7%) |
| 2 Vehicles | 29 (53.7%) | 36 (59.0%) |
| 3 Vehicles | 14 (25.9%) | 8 (13.1%) |
| 4 Vehicles | 4 (7.4%) | 8 (13.1%) |
| 5 or more Vehicles | 0 (0.0%) | 0 (0.0%) |
| Total | 54 (100.0%) | 61 (100.0%) |
Commute Time in Northfork
The most frequently occuring commute durations in Northfork are 10 to 14 minutes (19 commuters, 21.1%), 25 to 29 minutes (18 commuters, 20.0%), and less than 5 minutes (12 commuters, 13.3%).
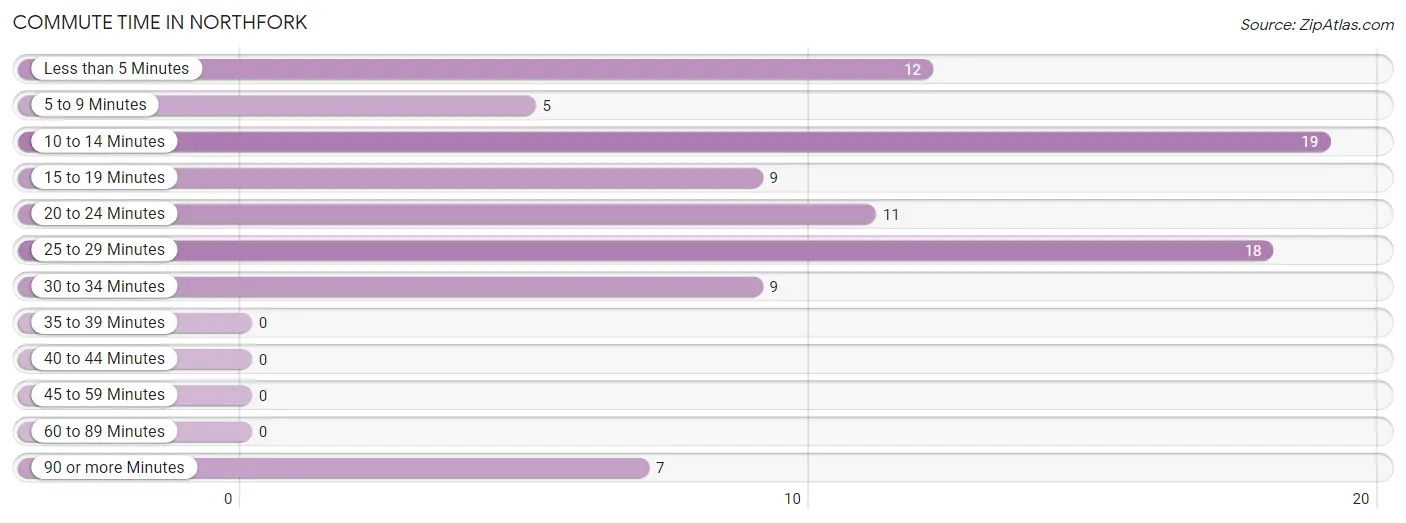
| Commute Time | # Commuters | % Commuters |
| Less than 5 Minutes | 12 | 13.3% |
| 5 to 9 Minutes | 5 | 5.6% |
| 10 to 14 Minutes | 19 | 21.1% |
| 15 to 19 Minutes | 9 | 10.0% |
| 20 to 24 Minutes | 11 | 12.2% |
| 25 to 29 Minutes | 18 | 20.0% |
| 30 to 34 Minutes | 9 | 10.0% |
| 35 to 39 Minutes | 0 | 0.0% |
| 40 to 44 Minutes | 0 | 0.0% |
| 45 to 59 Minutes | 0 | 0.0% |
| 60 to 89 Minutes | 0 | 0.0% |
| 90 or more Minutes | 7 | 7.8% |
Commute Time by Sex in Northfork
The most common commute times in Northfork are 10 to 14 minutes (12 commuters, 22.2%) for males and less than 5 minutes (12 commuters, 33.3%) for females.
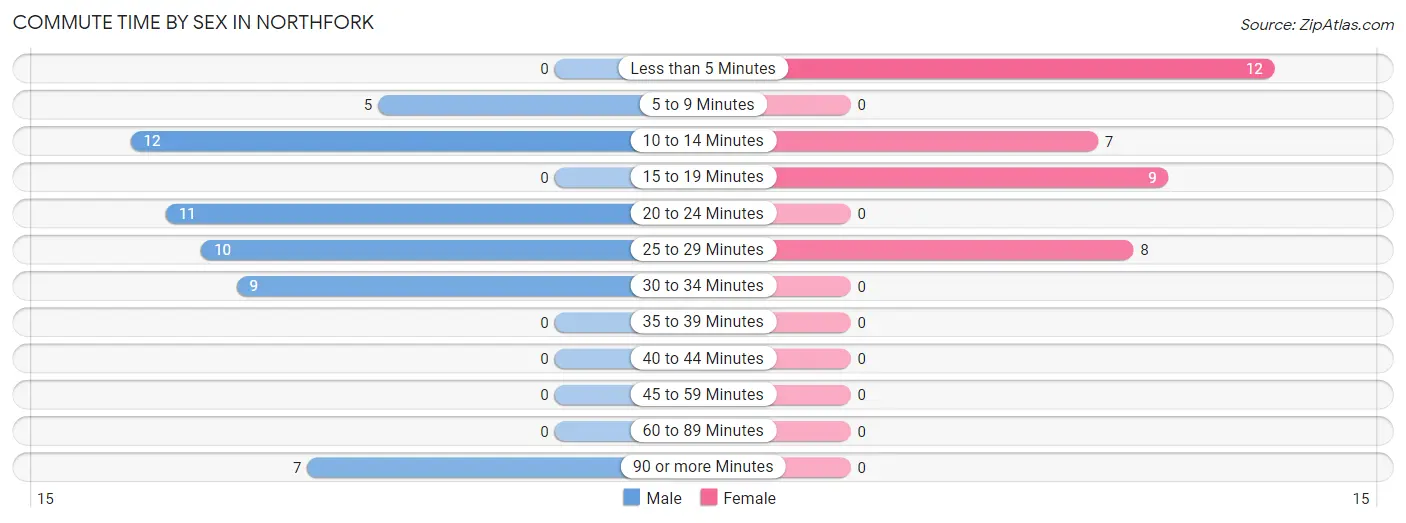
| Commute Time | Male | Female |
| Less than 5 Minutes | 0 (0.0%) | 12 (33.3%) |
| 5 to 9 Minutes | 5 (9.3%) | 0 (0.0%) |
| 10 to 14 Minutes | 12 (22.2%) | 7 (19.4%) |
| 15 to 19 Minutes | 0 (0.0%) | 9 (25.0%) |
| 20 to 24 Minutes | 11 (20.4%) | 0 (0.0%) |
| 25 to 29 Minutes | 10 (18.5%) | 8 (22.2%) |
| 30 to 34 Minutes | 9 (16.7%) | 0 (0.0%) |
| 35 to 39 Minutes | 0 (0.0%) | 0 (0.0%) |
| 40 to 44 Minutes | 0 (0.0%) | 0 (0.0%) |
| 45 to 59 Minutes | 0 (0.0%) | 0 (0.0%) |
| 60 to 89 Minutes | 0 (0.0%) | 0 (0.0%) |
| 90 or more Minutes | 7 (13.0%) | 0 (0.0%) |
Time of Departure to Work by Sex in Northfork
The most frequent times of departure to work in Northfork are 12:00 AM to 4:59 AM (13, 24.1%) for males and 8:30 AM to 8:59 AM (15, 41.7%) for females.
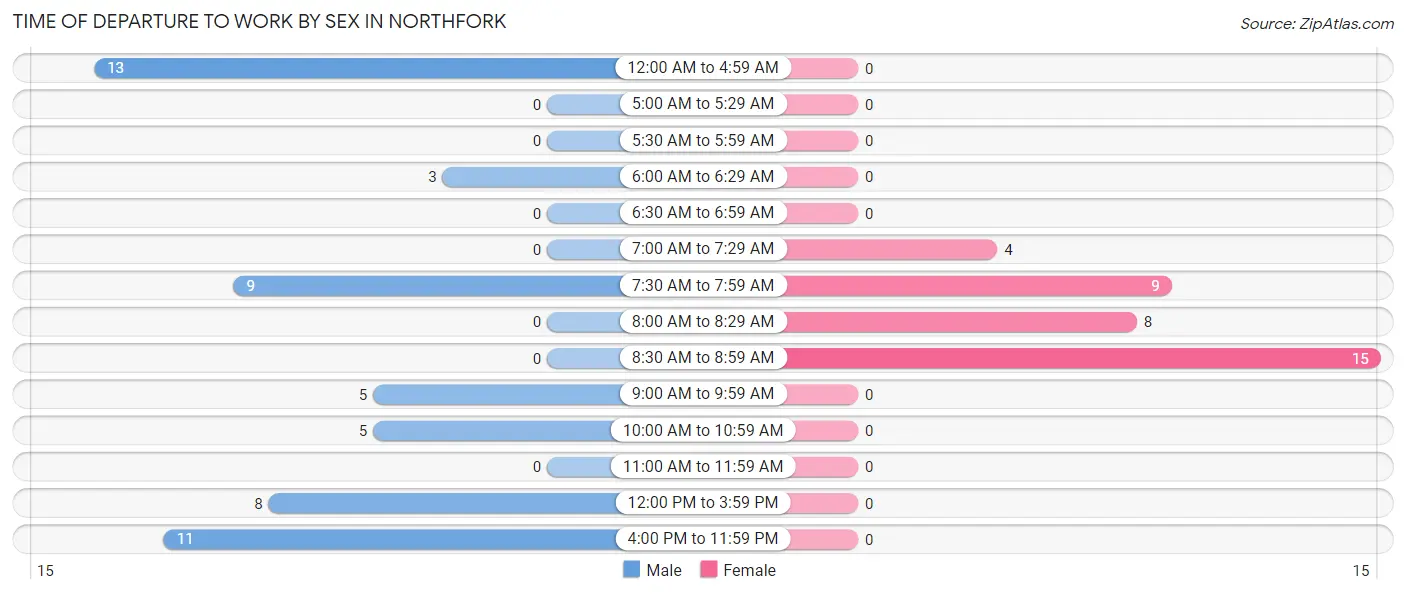
| Time of Departure | Male | Female |
| 12:00 AM to 4:59 AM | 13 (24.1%) | 0 (0.0%) |
| 5:00 AM to 5:29 AM | 0 (0.0%) | 0 (0.0%) |
| 5:30 AM to 5:59 AM | 0 (0.0%) | 0 (0.0%) |
| 6:00 AM to 6:29 AM | 3 (5.6%) | 0 (0.0%) |
| 6:30 AM to 6:59 AM | 0 (0.0%) | 0 (0.0%) |
| 7:00 AM to 7:29 AM | 0 (0.0%) | 4 (11.1%) |
| 7:30 AM to 7:59 AM | 9 (16.7%) | 9 (25.0%) |
| 8:00 AM to 8:29 AM | 0 (0.0%) | 8 (22.2%) |
| 8:30 AM to 8:59 AM | 0 (0.0%) | 15 (41.7%) |
| 9:00 AM to 9:59 AM | 5 (9.3%) | 0 (0.0%) |
| 10:00 AM to 10:59 AM | 5 (9.3%) | 0 (0.0%) |
| 11:00 AM to 11:59 AM | 0 (0.0%) | 0 (0.0%) |
| 12:00 PM to 3:59 PM | 8 (14.8%) | 0 (0.0%) |
| 4:00 PM to 11:59 PM | 11 (20.4%) | 0 (0.0%) |
| Total | 54 (100.0%) | 36 (100.0%) |
Housing Occupancy in Northfork
Occupancy by Ownership in Northfork
Of the total 116 dwellings in Northfork, owner-occupied units account for 95 (81.9%), while renter-occupied units make up 21 (18.1%).
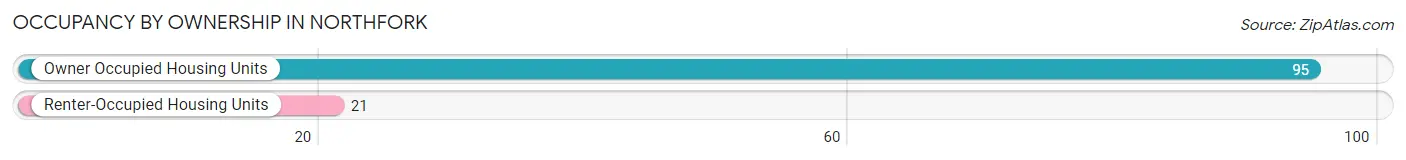
| Occupancy | # Housing Units | % Housing Units |
| Owner Occupied Housing Units | 95 | 81.9% |
| Renter-Occupied Housing Units | 21 | 18.1% |
| Total Occupied Housing Units | 116 | 100.0% |
Occupancy by Household Size in Northfork
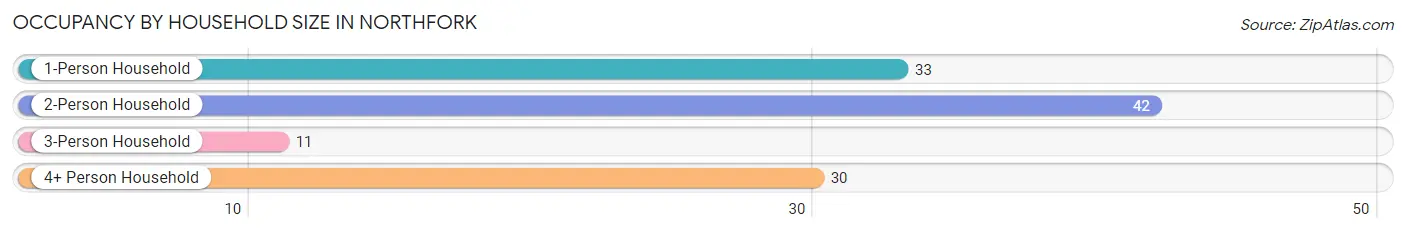
| Household Size | # Housing Units | % Housing Units |
| 1-Person Household | 33 | 28.4% |
| 2-Person Household | 42 | 36.2% |
| 3-Person Household | 11 | 9.5% |
| 4+ Person Household | 30 | 25.9% |
| Total Housing Units | 116 | 100.0% |
Occupancy by Ownership by Household Size in Northfork
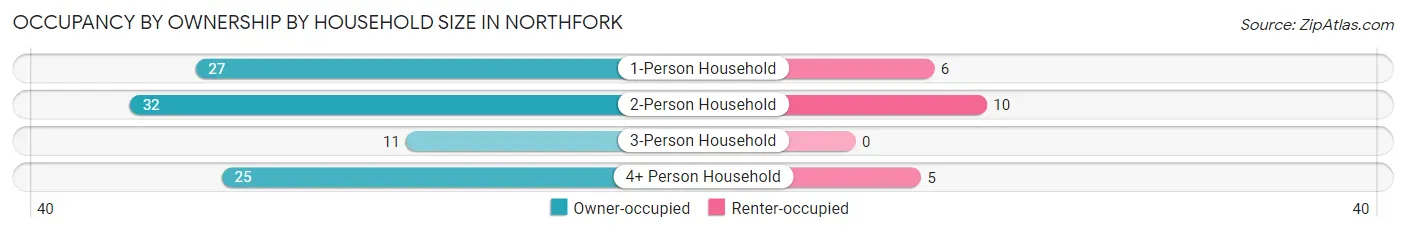
| Household Size | Owner-occupied | Renter-occupied |
| 1-Person Household | 27 (81.8%) | 6 (18.2%) |
| 2-Person Household | 32 (76.2%) | 10 (23.8%) |
| 3-Person Household | 11 (100.0%) | 0 (0.0%) |
| 4+ Person Household | 25 (83.3%) | 5 (16.7%) |
| Total Housing Units | 95 (81.9%) | 21 (18.1%) |
Occupancy by Educational Attainment in Northfork
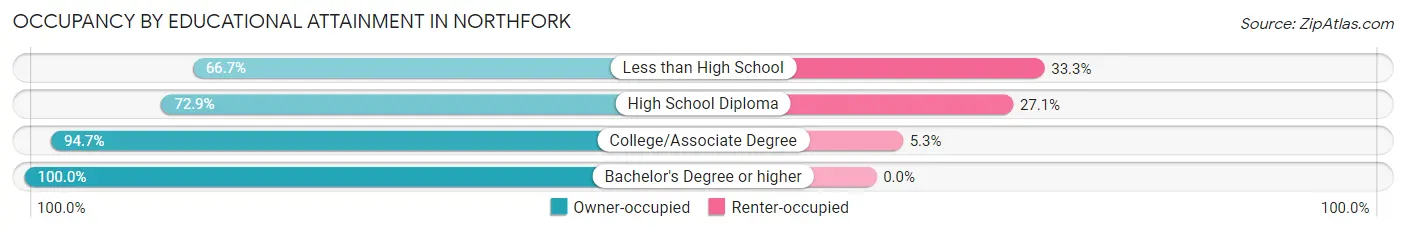
| Household Size | Owner-occupied | Renter-occupied |
| Less than High School | 6 (66.7%) | 3 (33.3%) |
| High School Diploma | 43 (72.9%) | 16 (27.1%) |
| College/Associate Degree | 36 (94.7%) | 2 (5.3%) |
| Bachelor's Degree or higher | 10 (100.0%) | 0 (0.0%) |
Occupancy by Age of Householder in Northfork
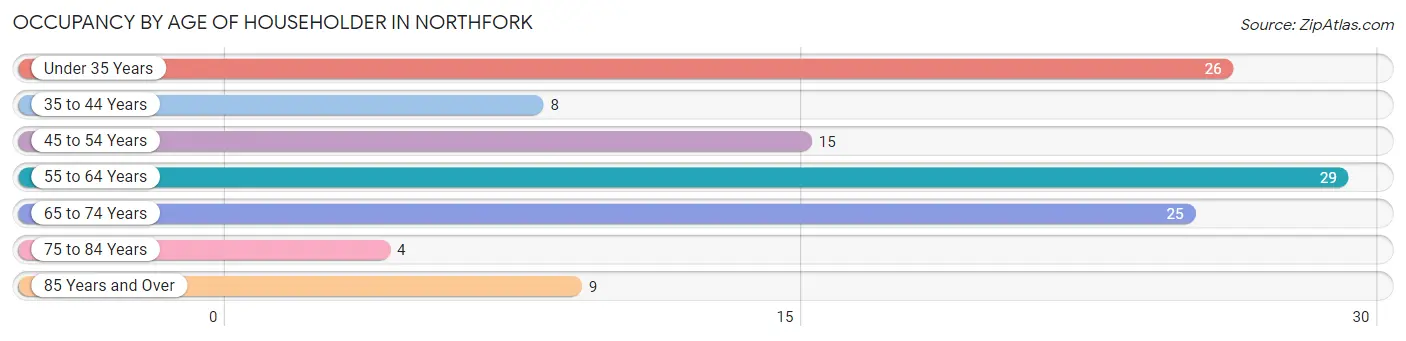
| Age Bracket | # Households | % Households |
| Under 35 Years | 26 | 22.4% |
| 35 to 44 Years | 8 | 6.9% |
| 45 to 54 Years | 15 | 12.9% |
| 55 to 64 Years | 29 | 25.0% |
| 65 to 74 Years | 25 | 21.5% |
| 75 to 84 Years | 4 | 3.5% |
| 85 Years and Over | 9 | 7.8% |
| Total | 116 | 100.0% |
Housing Finances in Northfork
Median Income by Occupancy in Northfork
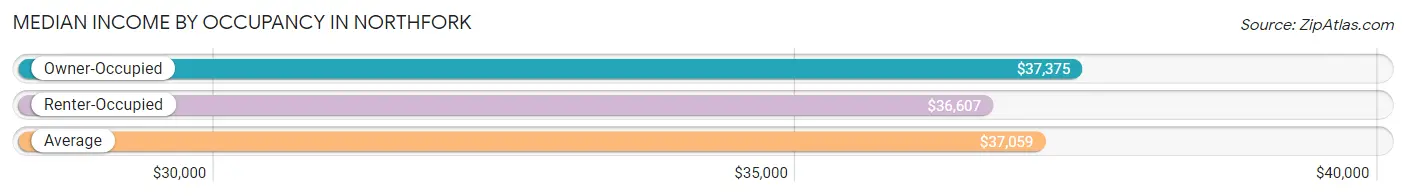
| Occupancy Type | # Households | Median Income |
| Owner-Occupied | 95 (81.9%) | $37,375 |
| Renter-Occupied | 21 (18.1%) | $36,607 |
| Average | 116 (100.0%) | $37,059 |
Occupancy by Householder Income Bracket in Northfork
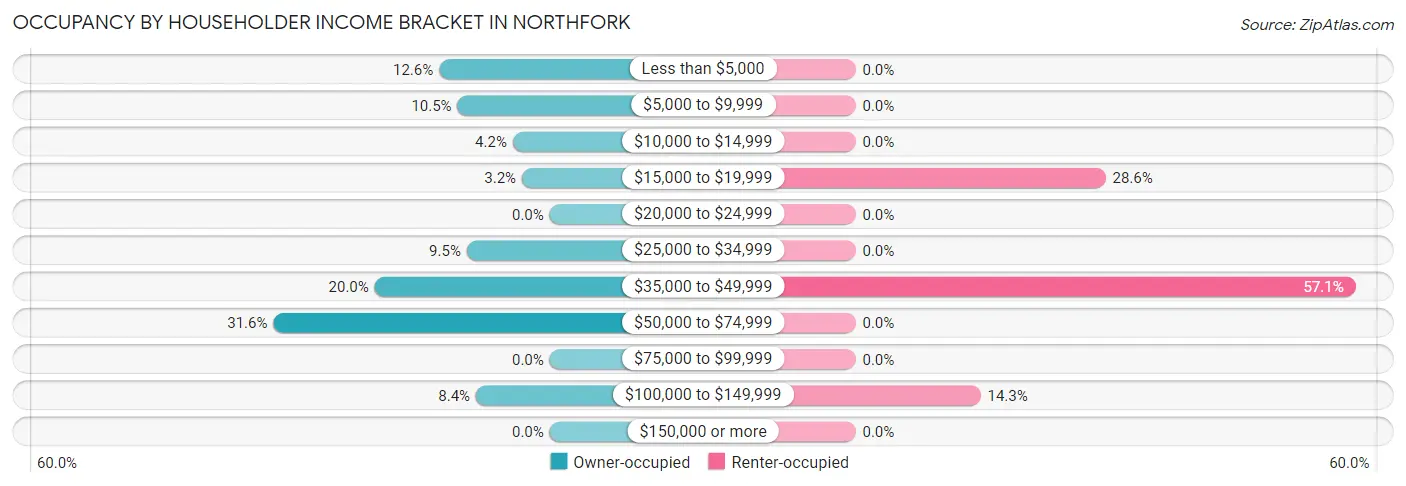
| Income Bracket | Owner-occupied | Renter-occupied |
| Less than $5,000 | 12 (12.6%) | 0 (0.0%) |
| $5,000 to $9,999 | 10 (10.5%) | 0 (0.0%) |
| $10,000 to $14,999 | 4 (4.2%) | 0 (0.0%) |
| $15,000 to $19,999 | 3 (3.2%) | 6 (28.6%) |
| $20,000 to $24,999 | 0 (0.0%) | 0 (0.0%) |
| $25,000 to $34,999 | 9 (9.5%) | 0 (0.0%) |
| $35,000 to $49,999 | 19 (20.0%) | 12 (57.1%) |
| $50,000 to $74,999 | 30 (31.6%) | 0 (0.0%) |
| $75,000 to $99,999 | 0 (0.0%) | 0 (0.0%) |
| $100,000 to $149,999 | 8 (8.4%) | 3 (14.3%) |
| $150,000 or more | 0 (0.0%) | 0 (0.0%) |
| Total | 95 (100.0%) | 21 (100.0%) |
Monthly Housing Cost Tiers in Northfork
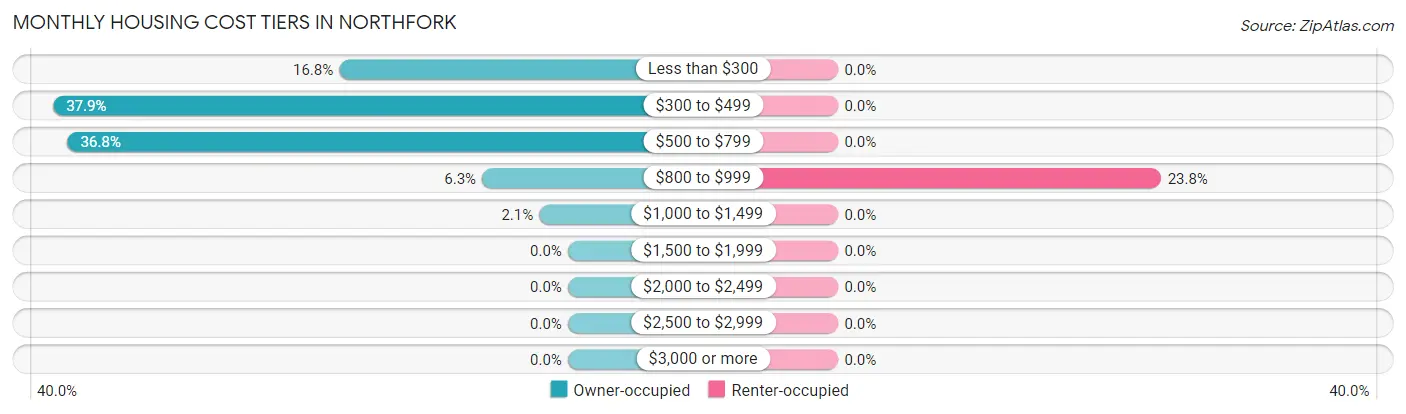
| Monthly Cost | Owner-occupied | Renter-occupied |
| Less than $300 | 16 (16.8%) | 0 (0.0%) |
| $300 to $499 | 36 (37.9%) | 0 (0.0%) |
| $500 to $799 | 35 (36.8%) | 0 (0.0%) |
| $800 to $999 | 6 (6.3%) | 5 (23.8%) |
| $1,000 to $1,499 | 2 (2.1%) | 0 (0.0%) |
| $1,500 to $1,999 | 0 (0.0%) | 0 (0.0%) |
| $2,000 to $2,499 | 0 (0.0%) | 0 (0.0%) |
| $2,500 to $2,999 | 0 (0.0%) | 0 (0.0%) |
| $3,000 or more | 0 (0.0%) | 0 (0.0%) |
| Total | 95 (100.0%) | 21 (100.0%) |
Physical Housing Characteristics in Northfork
Housing Structures in Northfork
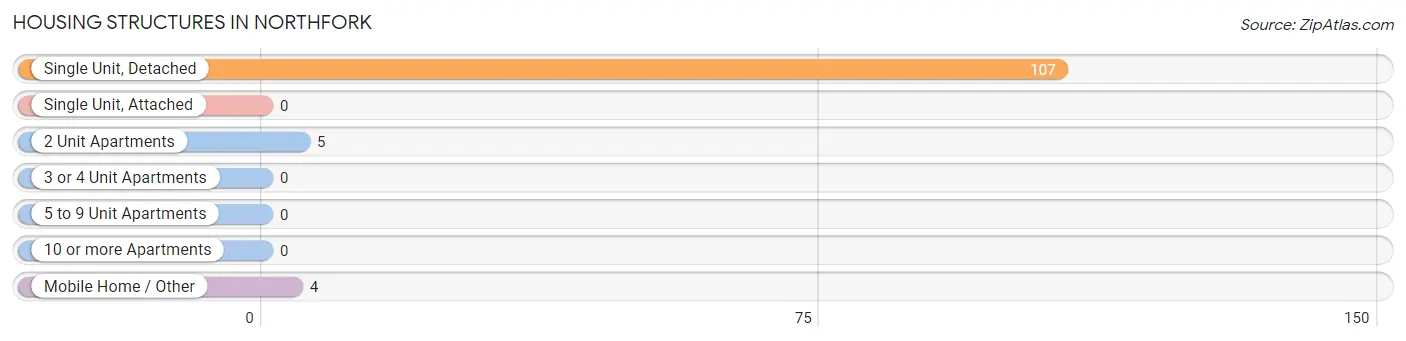
| Structure Type | # Housing Units | % Housing Units |
| Single Unit, Detached | 107 | 92.2% |
| Single Unit, Attached | 0 | 0.0% |
| 2 Unit Apartments | 5 | 4.3% |
| 3 or 4 Unit Apartments | 0 | 0.0% |
| 5 to 9 Unit Apartments | 0 | 0.0% |
| 10 or more Apartments | 0 | 0.0% |
| Mobile Home / Other | 4 | 3.5% |
| Total | 116 | 100.0% |
Housing Structures by Occupancy in Northfork
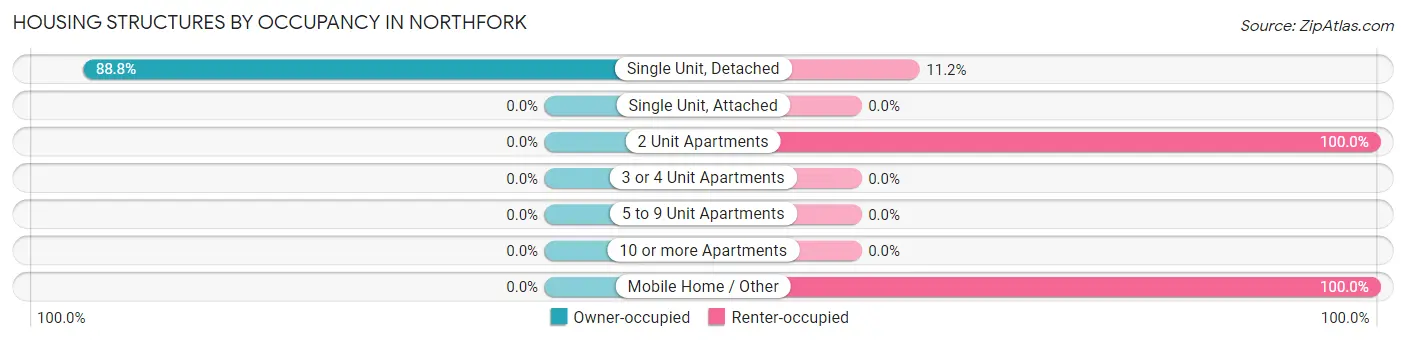
| Structure Type | Owner-occupied | Renter-occupied |
| Single Unit, Detached | 95 (88.8%) | 12 (11.2%) |
| Single Unit, Attached | 0 (0.0%) | 0 (0.0%) |
| 2 Unit Apartments | 0 (0.0%) | 5 (100.0%) |
| 3 or 4 Unit Apartments | 0 (0.0%) | 0 (0.0%) |
| 5 to 9 Unit Apartments | 0 (0.0%) | 0 (0.0%) |
| 10 or more Apartments | 0 (0.0%) | 0 (0.0%) |
| Mobile Home / Other | 0 (0.0%) | 4 (100.0%) |
| Total | 95 (81.9%) | 21 (18.1%) |
Housing Structures by Number of Rooms in Northfork
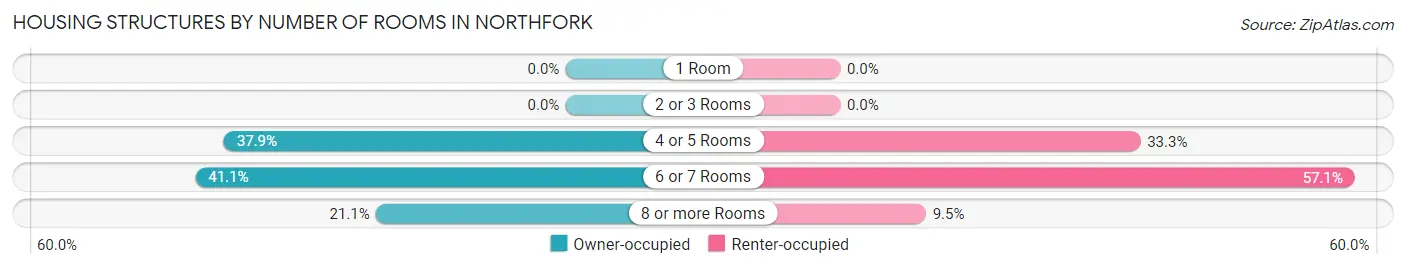
| Number of Rooms | Owner-occupied | Renter-occupied |
| 1 Room | 0 (0.0%) | 0 (0.0%) |
| 2 or 3 Rooms | 0 (0.0%) | 0 (0.0%) |
| 4 or 5 Rooms | 36 (37.9%) | 7 (33.3%) |
| 6 or 7 Rooms | 39 (41.0%) | 12 (57.1%) |
| 8 or more Rooms | 20 (21.0%) | 2 (9.5%) |
| Total | 95 (100.0%) | 21 (100.0%) |
Housing Structure by Heating Type in Northfork
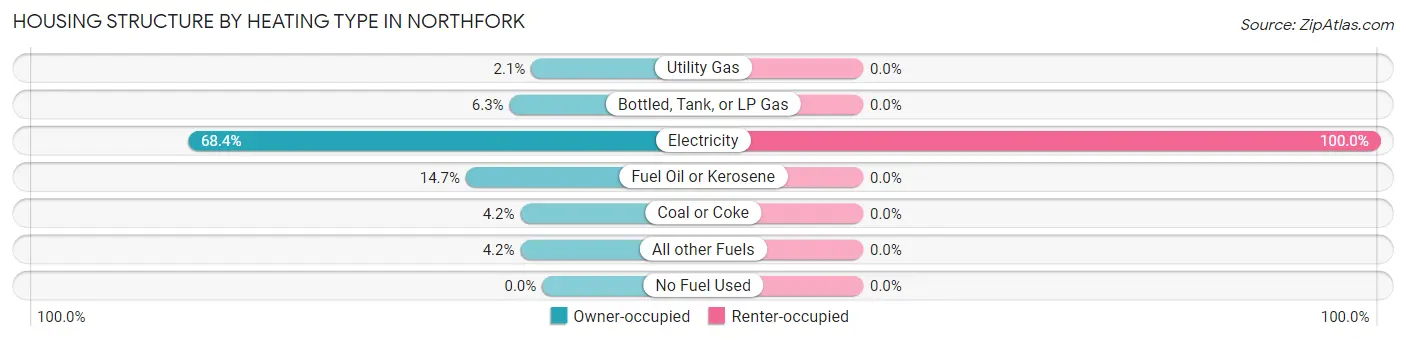
| Heating Type | Owner-occupied | Renter-occupied |
| Utility Gas | 2 (2.1%) | 0 (0.0%) |
| Bottled, Tank, or LP Gas | 6 (6.3%) | 0 (0.0%) |
| Electricity | 65 (68.4%) | 21 (100.0%) |
| Fuel Oil or Kerosene | 14 (14.7%) | 0 (0.0%) |
| Coal or Coke | 4 (4.2%) | 0 (0.0%) |
| All other Fuels | 4 (4.2%) | 0 (0.0%) |
| No Fuel Used | 0 (0.0%) | 0 (0.0%) |
| Total | 95 (100.0%) | 21 (100.0%) |
Household Vehicle Usage in Northfork
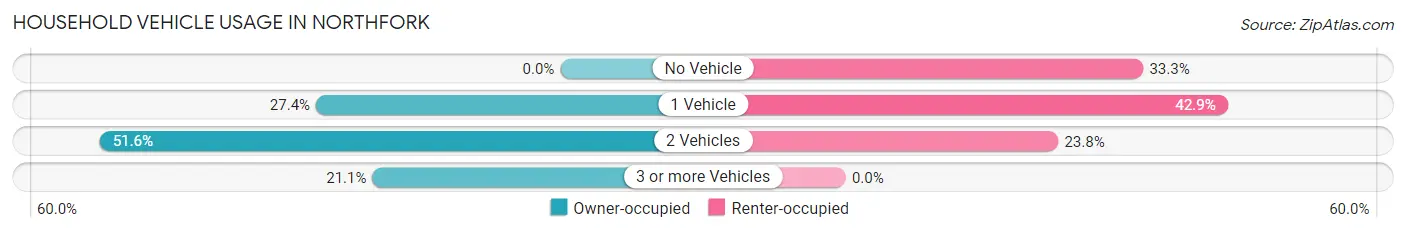
| Vehicles per Household | Owner-occupied | Renter-occupied |
| No Vehicle | 0 (0.0%) | 7 (33.3%) |
| 1 Vehicle | 26 (27.4%) | 9 (42.9%) |
| 2 Vehicles | 49 (51.6%) | 5 (23.8%) |
| 3 or more Vehicles | 20 (21.0%) | 0 (0.0%) |
| Total | 95 (100.0%) | 21 (100.0%) |
Real Estate & Mortgages in Northfork
Real Estate and Mortgage Overview in Northfork
| Characteristic | Without Mortgage | With Mortgage |
| Housing Units | 85 | 10 |
| Median Property Value | $30,800 | $0 |
| Median Household Income | $46,250 | $0 |
| Monthly Housing Costs | $474 | $0 |
| Real Estate Taxes | - | - |
Property Value by Mortgage Status in Northfork
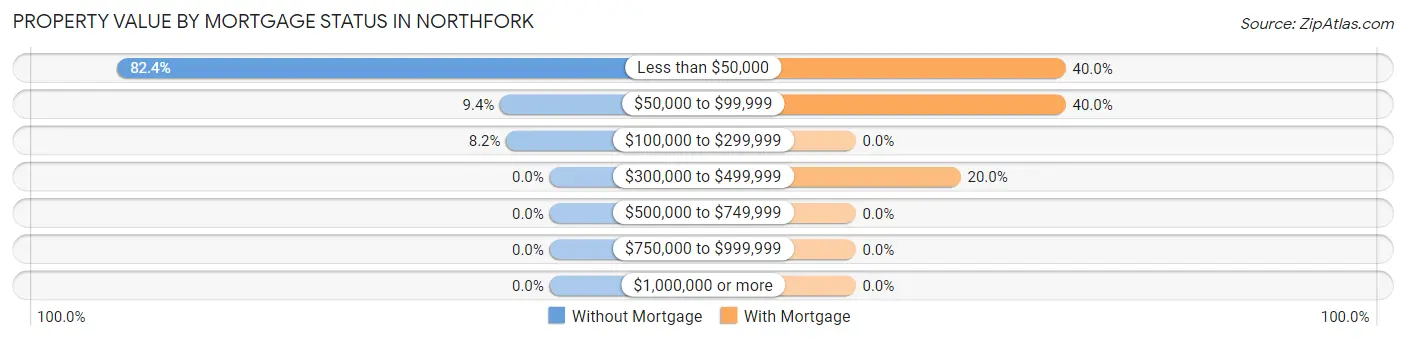
| Property Value | Without Mortgage | With Mortgage |
| Less than $50,000 | 70 (82.4%) | 4 (40.0%) |
| $50,000 to $99,999 | 8 (9.4%) | 4 (40.0%) |
| $100,000 to $299,999 | 7 (8.2%) | 0 (0.0%) |
| $300,000 to $499,999 | 0 (0.0%) | 2 (20.0%) |
| $500,000 to $749,999 | 0 (0.0%) | 0 (0.0%) |
| $750,000 to $999,999 | 0 (0.0%) | 0 (0.0%) |
| $1,000,000 or more | 0 (0.0%) | 0 (0.0%) |
| Total | 85 (100.0%) | 10 (100.0%) |
Household Income by Mortgage Status in Northfork
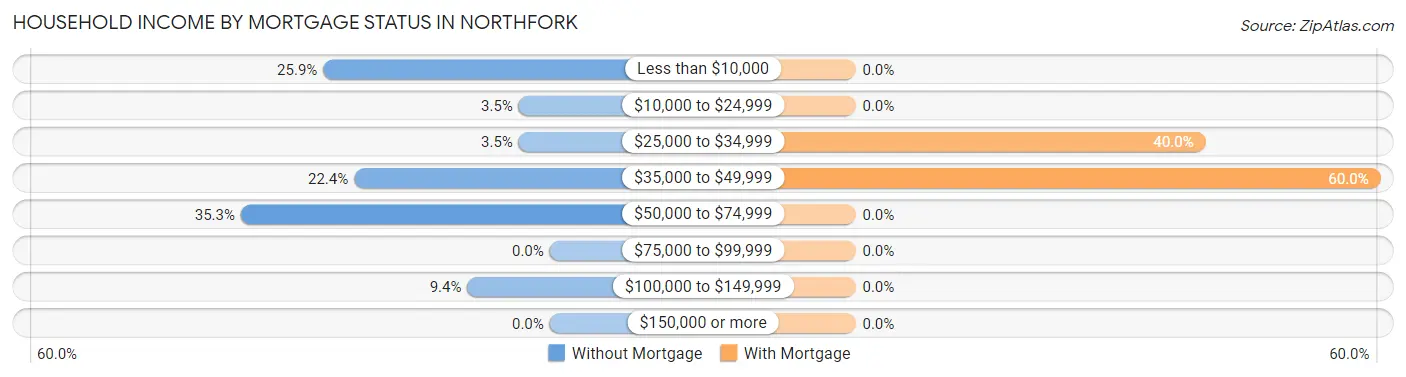
| Household Income | Without Mortgage | With Mortgage |
| Less than $10,000 | 22 (25.9%) | 0 (0.0%) |
| $10,000 to $24,999 | 3 (3.5%) | 0 (0.0%) |
| $25,000 to $34,999 | 3 (3.5%) | 4 (40.0%) |
| $35,000 to $49,999 | 19 (22.4%) | 6 (60.0%) |
| $50,000 to $74,999 | 30 (35.3%) | 0 (0.0%) |
| $75,000 to $99,999 | 0 (0.0%) | 0 (0.0%) |
| $100,000 to $149,999 | 8 (9.4%) | 0 (0.0%) |
| $150,000 or more | 0 (0.0%) | 0 (0.0%) |
| Total | 85 (100.0%) | 10 (100.0%) |
Property Value to Household Income Ratio in Northfork
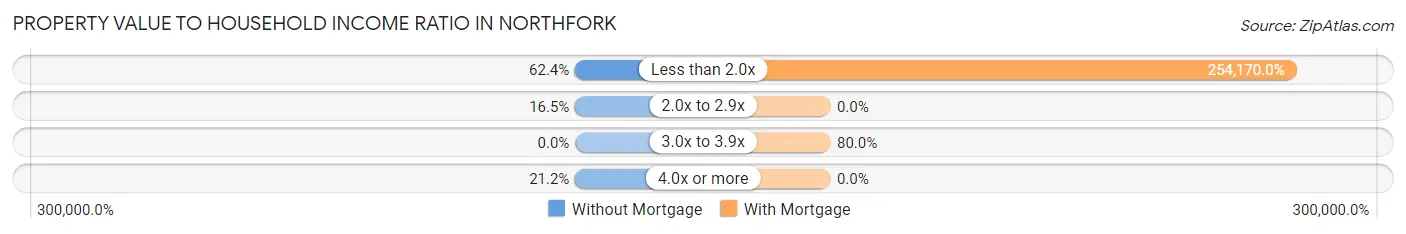
| Value-to-Income Ratio | Without Mortgage | With Mortgage |
| Less than 2.0x | 53 (62.4%) | 25,417 (254,170.0%) |
| 2.0x to 2.9x | 14 (16.5%) | 0 (0.0%) |
| 3.0x to 3.9x | 0 (0.0%) | 8 (80.0%) |
| 4.0x or more | 18 (21.2%) | 0 (0.0%) |
| Total | 85 (100.0%) | 10 (100.0%) |
Real Estate Taxes by Mortgage Status in Northfork
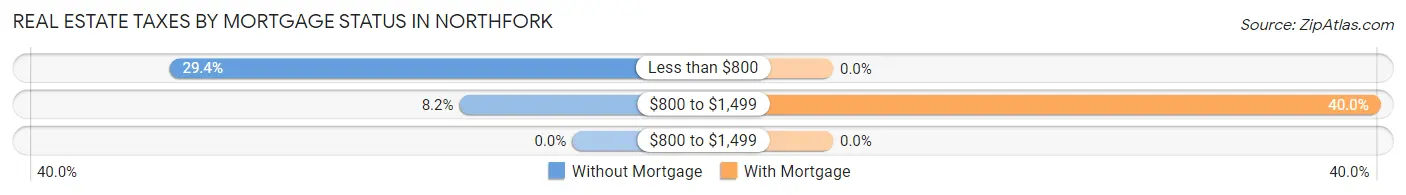
| Property Taxes | Without Mortgage | With Mortgage |
| Less than $800 | 25 (29.4%) | 0 (0.0%) |
| $800 to $1,499 | 7 (8.2%) | 4 (40.0%) |
| $800 to $1,499 | 0 (0.0%) | 0 (0.0%) |
| Total | 85 (100.0%) | 10 (100.0%) |
Health & Disability in Northfork
Health Insurance Coverage by Age in Northfork
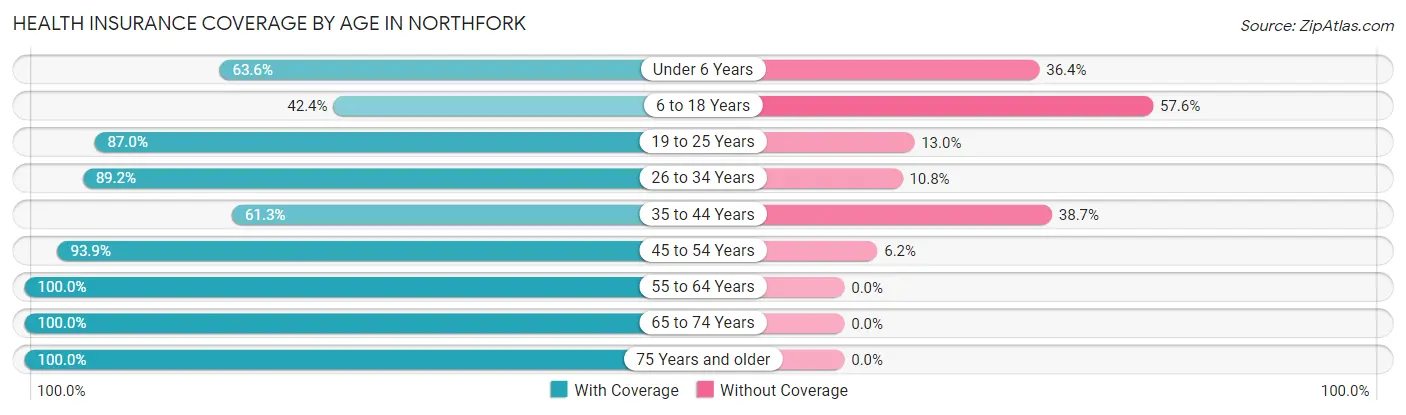
| Age Bracket | With Coverage | Without Coverage |
| Under 6 Years | 14 (63.6%) | 8 (36.4%) |
| 6 to 18 Years | 28 (42.4%) | 38 (57.6%) |
| 19 to 25 Years | 20 (87.0%) | 3 (13.0%) |
| 26 to 34 Years | 74 (89.2%) | 9 (10.8%) |
| 35 to 44 Years | 19 (61.3%) | 12 (38.7%) |
| 45 to 54 Years | 61 (93.9%) | 4 (6.1%) |
| 55 to 64 Years | 64 (100.0%) | 0 (0.0%) |
| 65 to 74 Years | 34 (100.0%) | 0 (0.0%) |
| 75 Years and older | 13 (100.0%) | 0 (0.0%) |
| Total | 327 (81.6%) | 74 (18.4%) |
Health Insurance Coverage by Citizenship Status in Northfork
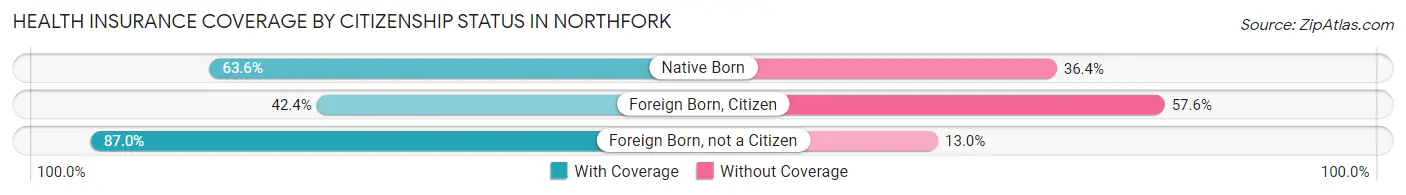
| Citizenship Status | With Coverage | Without Coverage |
| Native Born | 14 (63.6%) | 8 (36.4%) |
| Foreign Born, Citizen | 28 (42.4%) | 38 (57.6%) |
| Foreign Born, not a Citizen | 20 (87.0%) | 3 (13.0%) |
Health Insurance Coverage by Household Income in Northfork
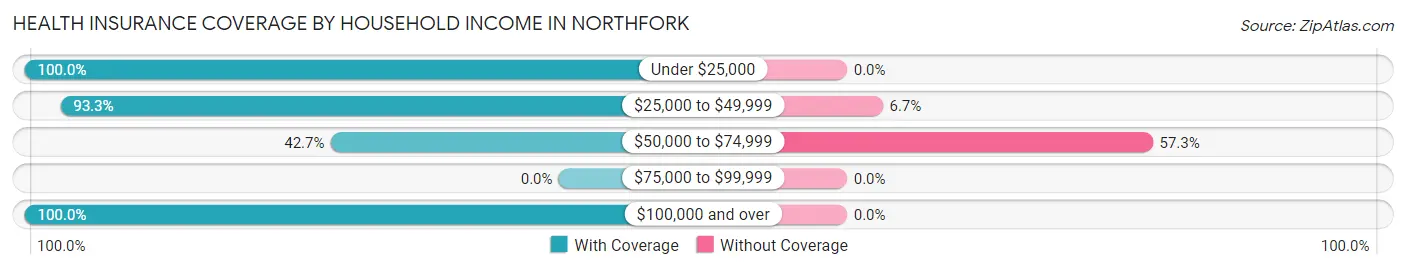
| Household Income | With Coverage | Without Coverage |
| Under $25,000 | 53 (100.0%) | 0 (0.0%) |
| $25,000 to $49,999 | 209 (93.3%) | 15 (6.7%) |
| $50,000 to $74,999 | 44 (42.7%) | 59 (57.3%) |
| $75,000 to $99,999 | 0 (0.0%) | 0 (0.0%) |
| $100,000 and over | 21 (100.0%) | 0 (0.0%) |
Public vs Private Health Insurance Coverage by Age in Northfork
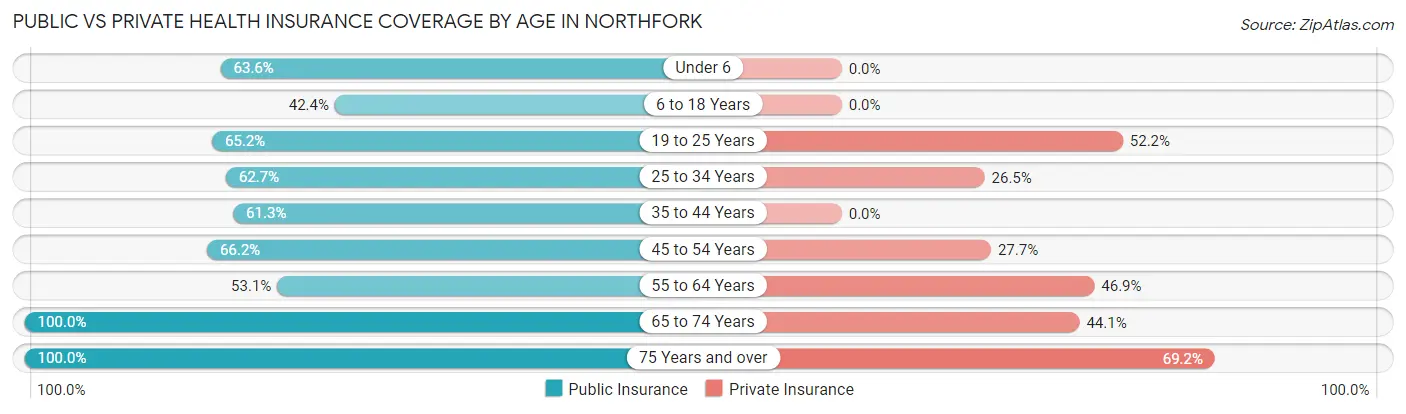
| Age Bracket | Public Insurance | Private Insurance |
| Under 6 | 14 (63.6%) | 0 (0.0%) |
| 6 to 18 Years | 28 (42.4%) | 0 (0.0%) |
| 19 to 25 Years | 15 (65.2%) | 12 (52.2%) |
| 25 to 34 Years | 52 (62.6%) | 22 (26.5%) |
| 35 to 44 Years | 19 (61.3%) | 0 (0.0%) |
| 45 to 54 Years | 43 (66.1%) | 18 (27.7%) |
| 55 to 64 Years | 34 (53.1%) | 30 (46.9%) |
| 65 to 74 Years | 34 (100.0%) | 15 (44.1%) |
| 75 Years and over | 13 (100.0%) | 9 (69.2%) |
| Total | 252 (62.8%) | 106 (26.4%) |
Disability Status by Sex by Age in Northfork
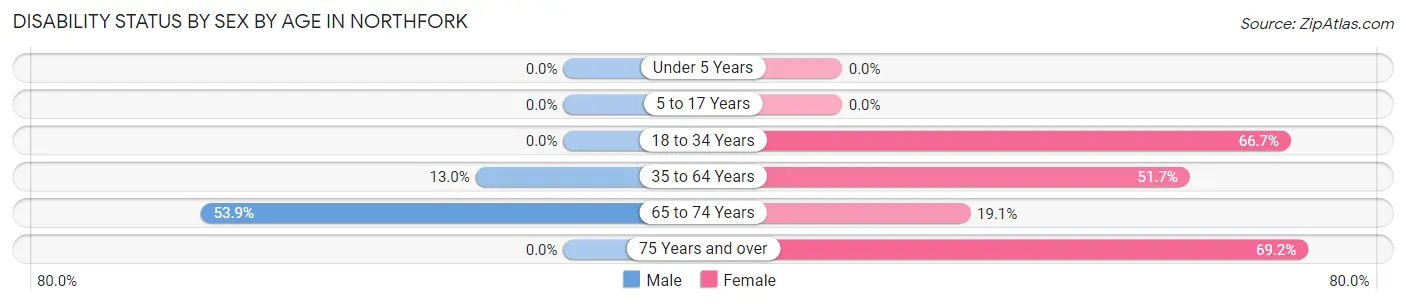
| Age Bracket | Male | Female |
| Under 5 Years | 0 (0.0%) | 0 (0.0%) |
| 5 to 17 Years | 0 (0.0%) | 0 (0.0%) |
| 18 to 34 Years | 0 (0.0%) | 68 (66.7%) |
| 35 to 64 Years | 9 (13.0%) | 47 (51.6%) |
| 65 to 74 Years | 7 (53.8%) | 4 (19.1%) |
| 75 Years and over | 0 (0.0%) | 9 (69.2%) |
Disability Class by Sex by Age in Northfork
Disability Class: Hearing Difficulty
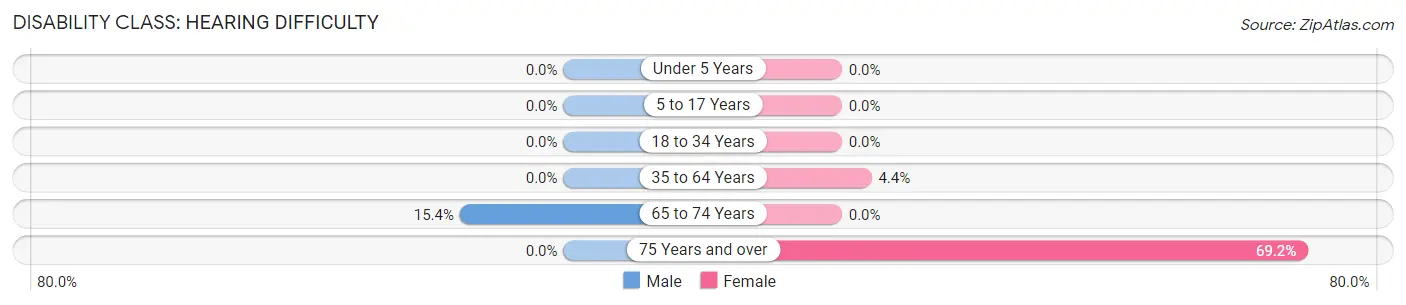
| Age Bracket | Male | Female |
| Under 5 Years | 0 (0.0%) | 0 (0.0%) |
| 5 to 17 Years | 0 (0.0%) | 0 (0.0%) |
| 18 to 34 Years | 0 (0.0%) | 0 (0.0%) |
| 35 to 64 Years | 0 (0.0%) | 4 (4.4%) |
| 65 to 74 Years | 2 (15.4%) | 0 (0.0%) |
| 75 Years and over | 0 (0.0%) | 9 (69.2%) |
Disability Class: Vision Difficulty
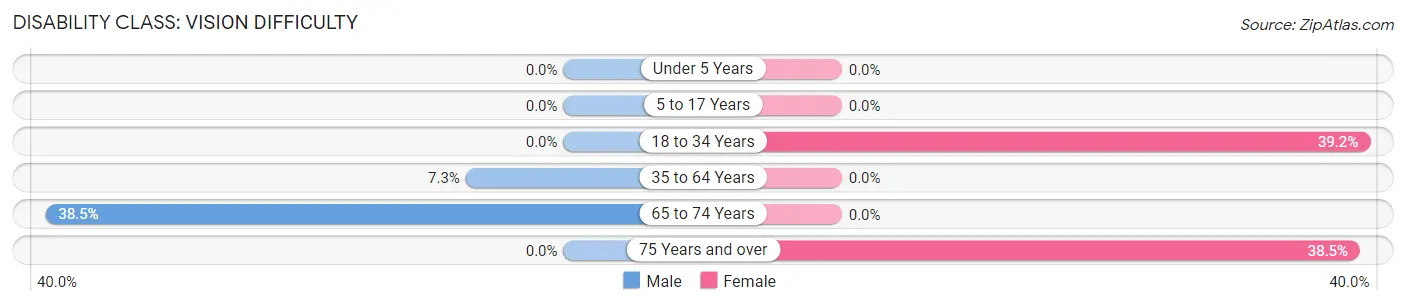
| Age Bracket | Male | Female |
| Under 5 Years | 0 (0.0%) | 0 (0.0%) |
| 5 to 17 Years | 0 (0.0%) | 0 (0.0%) |
| 18 to 34 Years | 0 (0.0%) | 40 (39.2%) |
| 35 to 64 Years | 5 (7.2%) | 0 (0.0%) |
| 65 to 74 Years | 5 (38.5%) | 0 (0.0%) |
| 75 Years and over | 0 (0.0%) | 5 (38.5%) |
Disability Class: Cognitive Difficulty
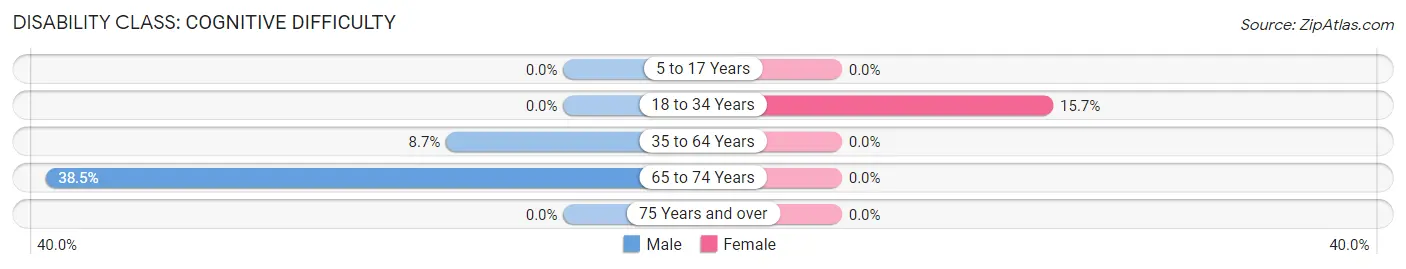
| Age Bracket | Male | Female |
| 5 to 17 Years | 0 (0.0%) | 0 (0.0%) |
| 18 to 34 Years | 0 (0.0%) | 16 (15.7%) |
| 35 to 64 Years | 6 (8.7%) | 0 (0.0%) |
| 65 to 74 Years | 5 (38.5%) | 0 (0.0%) |
| 75 Years and over | 0 (0.0%) | 0 (0.0%) |
Disability Class: Ambulatory Difficulty
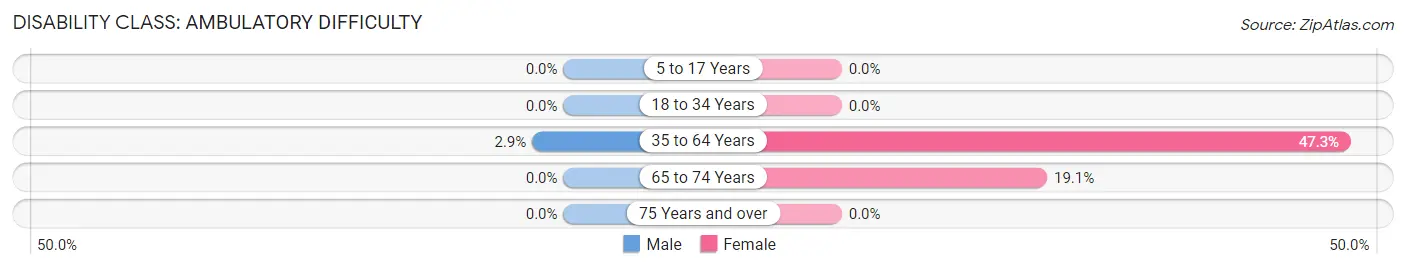
| Age Bracket | Male | Female |
| 5 to 17 Years | 0 (0.0%) | 0 (0.0%) |
| 18 to 34 Years | 0 (0.0%) | 0 (0.0%) |
| 35 to 64 Years | 2 (2.9%) | 43 (47.2%) |
| 65 to 74 Years | 0 (0.0%) | 4 (19.1%) |
| 75 Years and over | 0 (0.0%) | 0 (0.0%) |
Disability Class: Self-Care Difficulty
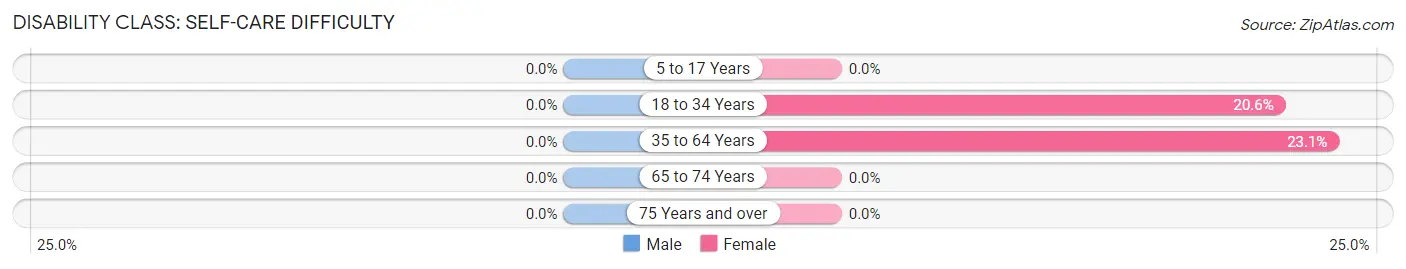
| Age Bracket | Male | Female |
| 5 to 17 Years | 0 (0.0%) | 0 (0.0%) |
| 18 to 34 Years | 0 (0.0%) | 21 (20.6%) |
| 35 to 64 Years | 0 (0.0%) | 21 (23.1%) |
| 65 to 74 Years | 0 (0.0%) | 0 (0.0%) |
| 75 Years and over | 0 (0.0%) | 0 (0.0%) |
Technology Access in Northfork
Computing Device Access in Northfork
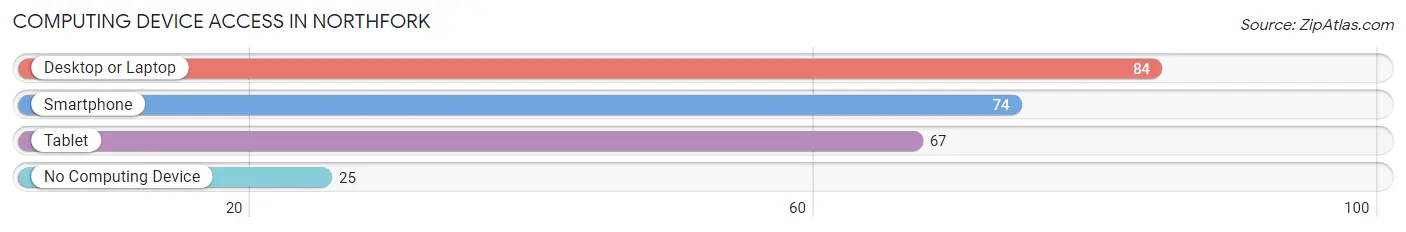
| Device Type | # Households | % Households |
| Desktop or Laptop | 84 | 72.4% |
| Smartphone | 74 | 63.8% |
| Tablet | 67 | 57.8% |
| No Computing Device | 25 | 21.5% |
| Total | 116 | 100.0% |
Internet Access in Northfork
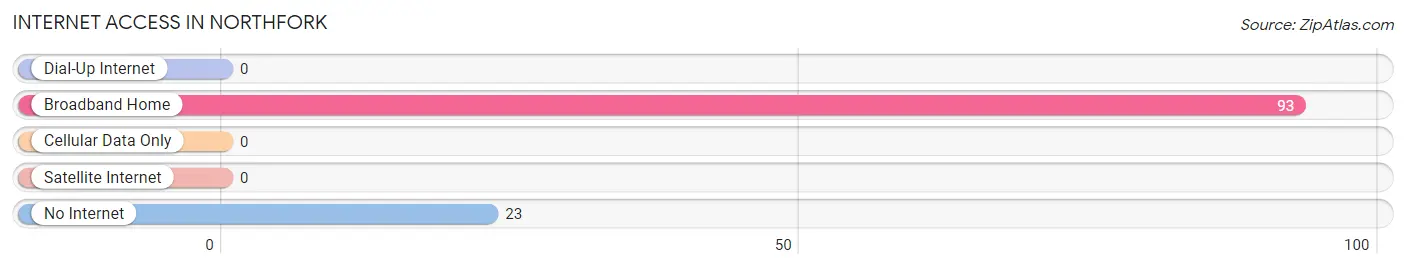
| Internet Type | # Households | % Households |
| Dial-Up Internet | 0 | 0.0% |
| Broadband Home | 93 | 80.2% |
| Cellular Data Only | 0 | 0.0% |
| Satellite Internet | 0 | 0.0% |
| No Internet | 23 | 19.8% |
| Total | 116 | 100.0% |
Northfork Summary
History
Northfork, West Virginia is a small town located in McDowell County. It was founded in 1891 and was originally known as North Fork. The town was named after the North Fork of the Elkhorn Creek, which runs through the town. The town was originally a coal mining town, and the coal industry was the main source of employment for the town’s residents.
The town was incorporated in 1895 and the first mayor was William H. Smith. The town grew rapidly in the early 1900s, and by 1910 the population had grown to over 1,000 people. The town was home to several coal mines, including the North Fork Coal Company, the North Fork Coal and Coke Company, and the North Fork Coal and Coke Company.
The town was also home to several churches, including the First Baptist Church, the Methodist Episcopal Church, and the Presbyterian Church. The town also had a school, a post office, a bank, and several stores.
In the 1920s, the coal industry began to decline and the town’s population began to decline as well. By 1930, the population had dropped to just over 500 people. The town continued to decline throughout the 20th century, and by 2000 the population had dropped to just over 300 people.
Geography
Northfork is located in the Appalachian Mountains of West Virginia. The town is situated in the Elkhorn Valley, which is surrounded by the Big Sandy River to the north, the Tug Fork River to the east, and the Guyandotte River to the south. The town is located at an elevation of 1,890 feet above sea level.
The town is located in a temperate climate, with hot summers and cold winters. The average annual temperature is around 50 degrees Fahrenheit. The average annual precipitation is around 40 inches.
Economy
The economy of Northfork is largely based on tourism. The town is home to several tourist attractions, including the North Fork Coal Mine Museum, the North Fork Coal and Coke Company Museum, and the North Fork Coal and Coke Company Store. The town is also home to several restaurants, shops, and other businesses.
The town is also home to several coal mines, which are still in operation. The coal industry is still a major source of employment for the town’s residents.
Demographics
As of the 2010 census, the population of Northfork was 304 people. The racial makeup of the town was 97.7% White, 0.7% African American, 0.3% Native American, 0.3% Asian, and 0.7% from other races. The median household income was $25,625, and the median family income was $30,000. The per capita income was $14,818.
The town is home to several churches, including the First Baptist Church, the Methodist Episcopal Church, and the Presbyterian Church. The town also has a school, a post office, a bank, and several stores.
Common Questions
What is Per Capita Income in Northfork?
Per Capita income in Northfork is $14,221.
What is the Median Family Income in Northfork?
Median Family Income in Northfork is $46,250.
What is the Median Household income in Northfork?
Median Household Income in Northfork is $37,059.
What is Inequality or Gini Index in Northfork?
Inequality or Gini Index in Northfork is 0.40.
What is the Total Population of Northfork?
Total Population of Northfork is 402.
What is the Total Male Population of Northfork?
Total Male Population of Northfork is 139.
What is the Total Female Population of Northfork?
Total Female Population of Northfork is 263.
What is the Ratio of Males per 100 Females in Northfork?
There are 52.85 Males per 100 Females in Northfork.
What is the Ratio of Females per 100 Males in Northfork?
There are 189.21 Females per 100 Males in Northfork.
What is the Median Population Age in Northfork?
Median Population Age in Northfork is 36.8 Years.
What is the Average Family Size in Northfork
Average Family Size in Northfork is 4.4 People.
What is the Average Household Size in Northfork
Average Household Size in Northfork is 3.5 People.
How Large is the Labor Force in Northfork?
There are 136 People in the Labor Forcein in Northfork.
What is the Percentage of People in the Labor Force in Northfork?
40.7% of People are in the Labor Force in Northfork.
What is the Unemployment Rate in Northfork?
Unemployment Rate in Northfork is 15.4%.