West Liberty, WV Map & Demographics
West Liberty Map
West Liberty Overview
$12,295
PER CAPITA INCOME
$69,375
AVG FAMILY INCOME
$39,181
AVG HOUSEHOLD INCOME
59.7%
WAGE / INCOME GAP [ % ]
40.3¢/ $1
WAGE / INCOME GAP [ $ ]
0.48
INEQUALITY / GINI INDEX
1,764
TOTAL POPULATION
679
MALE POPULATION
1,085
FEMALE POPULATION
62.58
MALES / 100 FEMALES
159.79
FEMALES / 100 MALES
20.6
MEDIAN AGE
3.1
AVG FAMILY SIZE
2.5
AVG HOUSEHOLD SIZE
907
LABOR FORCE [ PEOPLE ]
55.3%
PERCENT IN LABOR FORCE
4.1%
UNEMPLOYMENT RATE
West Liberty Zip Codes
West Liberty Area Codes
Income in West Liberty
Income Overview in West Liberty
Per Capita Income in West Liberty is $12,295, while median incomes of families and households are $69,375 and $39,181 respectively.
| Characteristic | Number | Measure |
| Per Capita Income | 1,764 | $12,295 |
| Median Family Income | 122 | $69,375 |
| Mean Family Income | 122 | $83,618 |
| Median Household Income | 273 | $39,181 |
| Mean Household Income | 273 | $52,847 |
| Income Deficit | 122 | $0 |
| Wage / Income Gap (%) | 1,764 | 59.73% |
| Wage / Income Gap ($) | 1,764 | 40.27¢ per $1 |
| Gini / Inequality Index | 1,764 | 0.48 |
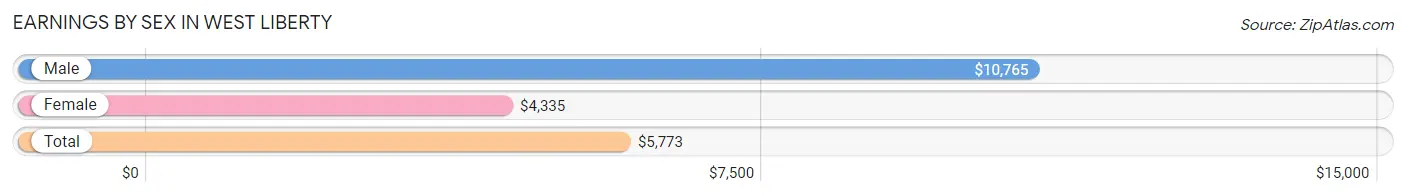
Earnings by Sex in West Liberty
Average Earnings in West Liberty are $5,773, $10,765 for men and $4,335 for women, a difference of 59.7%.
| Sex | Number | Average Earnings |
| Male | 505 (38.9%) | $10,765 |
| Female | 793 (61.1%) | $4,335 |
| Total | 1,298 (100.0%) | $5,773 |
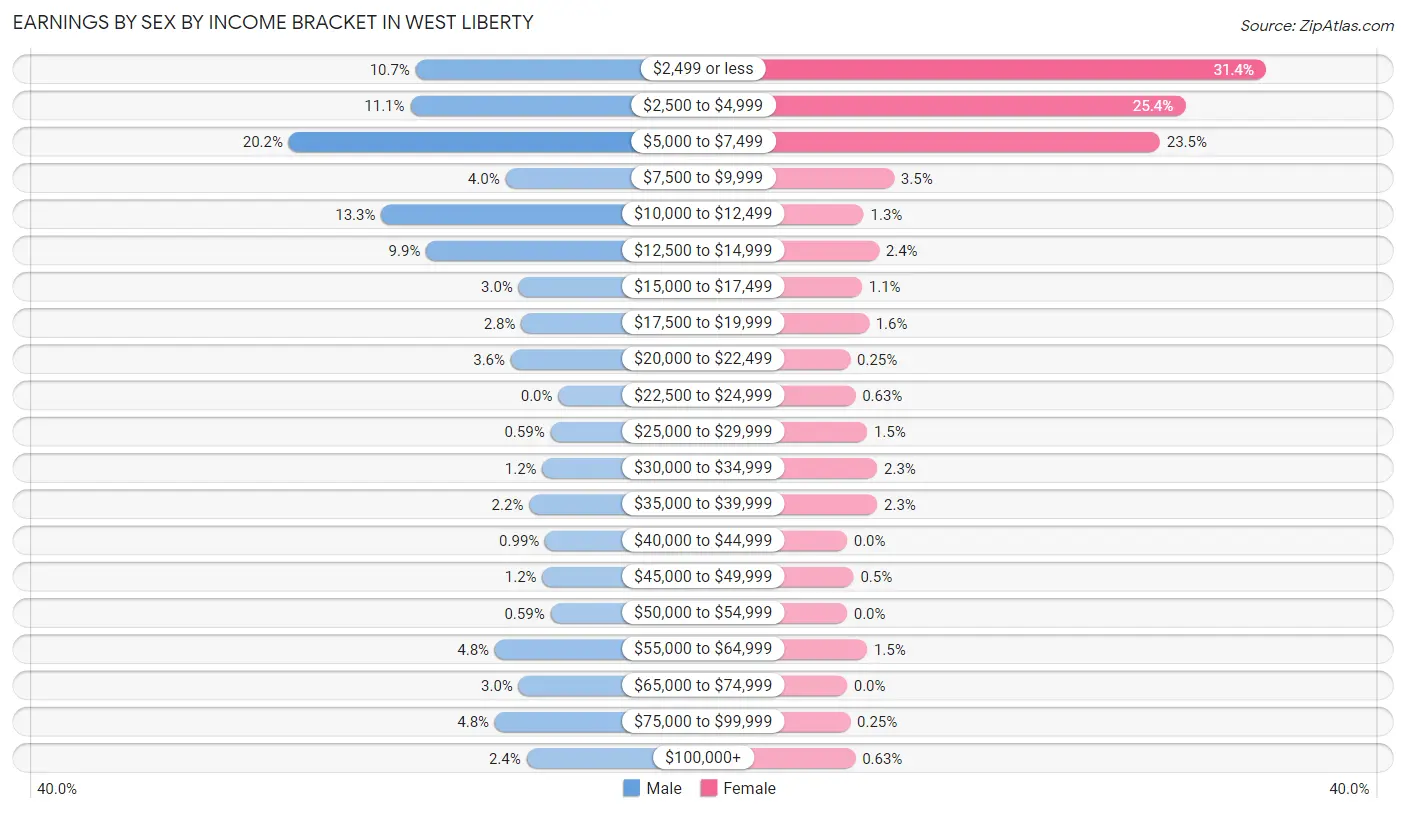
Earnings by Sex by Income Bracket in West Liberty
The most common earnings brackets in West Liberty are $5,000 to $7,499 for men (102 | 20.2%) and $2,499 or less for women (249 | 31.4%).
| Income | Male | Female |
| $2,499 or less | 54 (10.7%) | 249 (31.4%) |
| $2,500 to $4,999 | 56 (11.1%) | 201 (25.4%) |
| $5,000 to $7,499 | 102 (20.2%) | 186 (23.5%) |
| $7,500 to $9,999 | 20 (4.0%) | 28 (3.5%) |
| $10,000 to $12,499 | 67 (13.3%) | 10 (1.3%) |
| $12,500 to $14,999 | 50 (9.9%) | 19 (2.4%) |
| $15,000 to $17,499 | 15 (3.0%) | 9 (1.1%) |
| $17,500 to $19,999 | 14 (2.8%) | 13 (1.6%) |
| $20,000 to $22,499 | 18 (3.6%) | 2 (0.3%) |
| $22,500 to $24,999 | 0 (0.0%) | 5 (0.6%) |
| $25,000 to $29,999 | 3 (0.6%) | 12 (1.5%) |
| $30,000 to $34,999 | 6 (1.2%) | 18 (2.3%) |
| $35,000 to $39,999 | 11 (2.2%) | 18 (2.3%) |
| $40,000 to $44,999 | 5 (1.0%) | 0 (0.0%) |
| $45,000 to $49,999 | 6 (1.2%) | 4 (0.5%) |
| $50,000 to $54,999 | 3 (0.6%) | 0 (0.0%) |
| $55,000 to $64,999 | 24 (4.8%) | 12 (1.5%) |
| $65,000 to $74,999 | 15 (3.0%) | 0 (0.0%) |
| $75,000 to $99,999 | 24 (4.8%) | 2 (0.3%) |
| $100,000+ | 12 (2.4%) | 5 (0.6%) |
| Total | 505 (100.0%) | 793 (100.0%) |
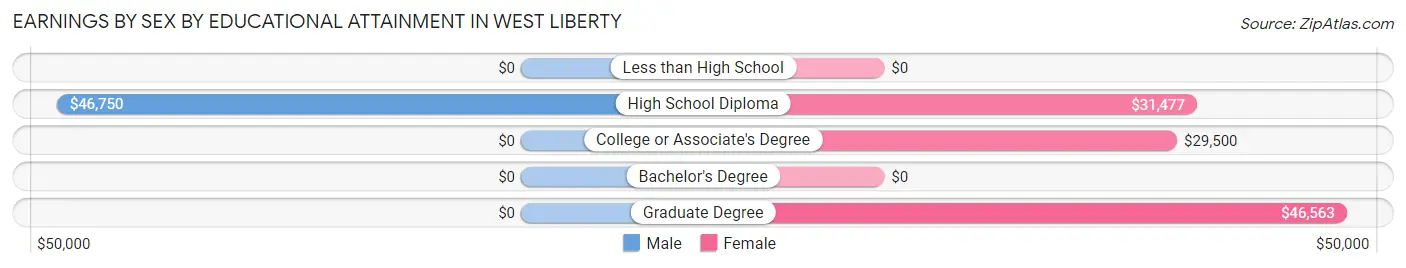
Earnings by Sex by Educational Attainment in West Liberty
Average earnings in West Liberty are $36,250 for men and $31,023 for women, a difference of 14.4%. Men with an educational attainment of high school diploma enjoy the highest average annual earnings of $46,750, while those with high school diploma education earn the least with $46,750. Women with an educational attainment of graduate degree earn the most with the average annual earnings of $46,563, while those with college or associate's degree education have the smallest earnings of $29,500.
| Educational Attainment | Male Income | Female Income |
| Less than High School | - | - |
| High School Diploma | $46,750 | $31,477 |
| College or Associate's Degree | - | - |
| Bachelor's Degree | - | - |
| Graduate Degree | - | - |
| Total | $36,250 | $31,023 |
Family Income in West Liberty
Family Income Brackets in West Liberty
According to the West Liberty family income data, there are 26 families falling into the $100,000 to $149,999 income range, which is the most common income bracket and makes up 21.3% of all families.
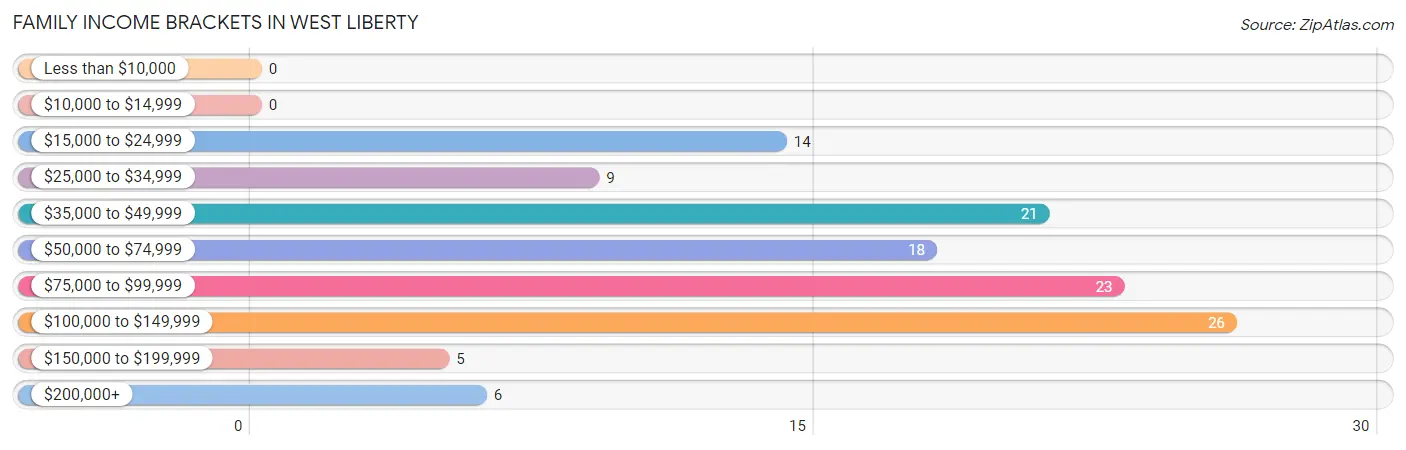
| Income Bracket | # Families | % Families |
| Less than $10,000 | 0 | 0.0% |
| $10,000 to $14,999 | 0 | 0.0% |
| $15,000 to $24,999 | 14 | 11.5% |
| $25,000 to $34,999 | 9 | 7.4% |
| $35,000 to $49,999 | 21 | 17.2% |
| $50,000 to $74,999 | 18 | 14.8% |
| $75,000 to $99,999 | 23 | 18.9% |
| $100,000 to $149,999 | 26 | 21.3% |
| $150,000 to $199,999 | 5 | 4.1% |
| $200,000+ | 6 | 4.9% |
Family Income by Famaliy Size in West Liberty
2-person families (74 | 60.7%) account for the highest median family income in West Liberty with $60,625 per family, while 2-person families (74 | 60.7%) have the highest median income of $30,312 per family member.
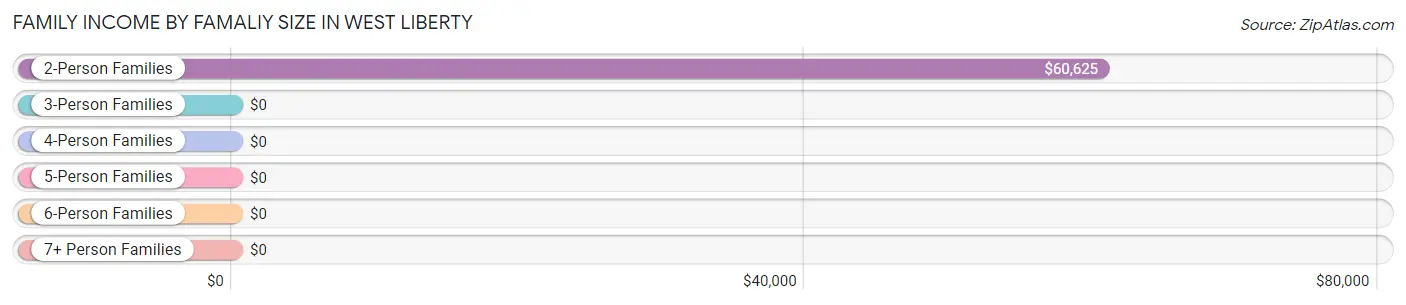
| Income Bracket | # Families | Median Income |
| 2-Person Families | 74 (60.7%) | $60,625 |
| 3-Person Families | 16 (13.1%) | $0 |
| 4-Person Families | 11 (9.0%) | $0 |
| 5-Person Families | 14 (11.5%) | $0 |
| 6-Person Families | 0 (0.0%) | $0 |
| 7+ Person Families | 7 (5.7%) | $0 |
| Total | 122 (100.0%) | $69,375 |
Family Income by Number of Earners in West Liberty
The median family income in West Liberty is $69,375, with families comprising 3+ earners (5) having the highest median family income of $117,917, while families with no earners (34) have the lowest median family income of $40,192, accounting for 4.1% and 27.9% of families, respectively.
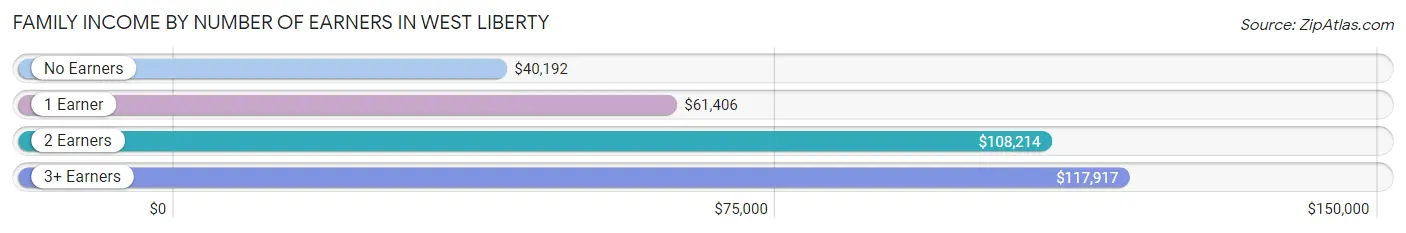
| Number of Earners | # Families | Median Income |
| No Earners | 34 (27.9%) | $40,192 |
| 1 Earner | 33 (27.1%) | $61,406 |
| 2 Earners | 50 (41.0%) | $108,214 |
| 3+ Earners | 5 (4.1%) | $117,917 |
| Total | 122 (100.0%) | $69,375 |
Household Income in West Liberty
Household Income Brackets in West Liberty
With 71 households falling in the category, the less than $10,000 income range is the most frequent in West Liberty, accounting for 26.0% of all households. In contrast, only 3 households (1.1%) fall into the $10,000 to $14,999 income bracket, making it the least populous group.
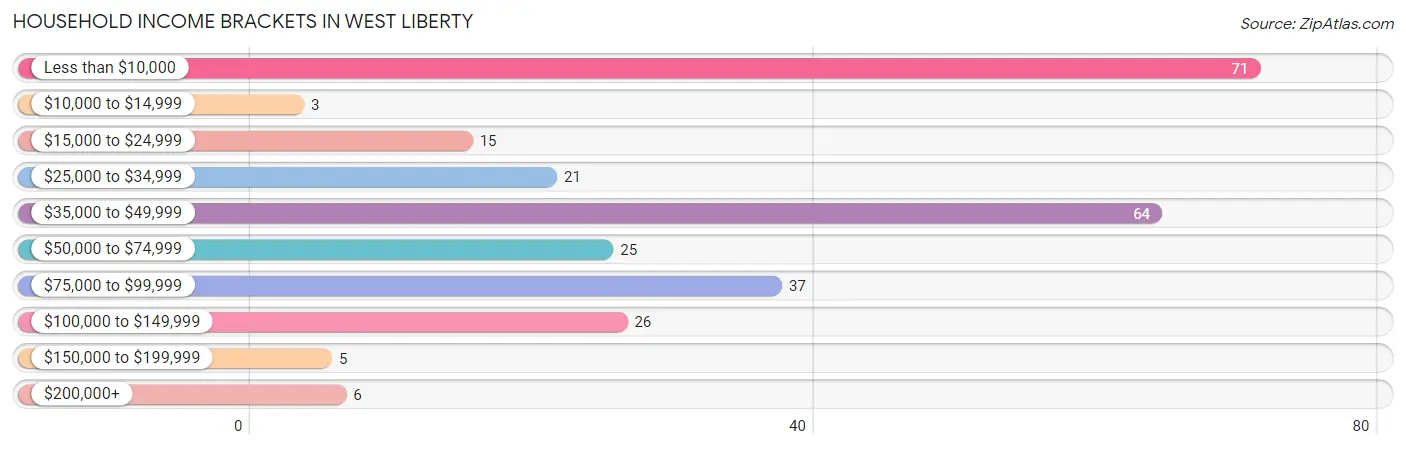
| Income Bracket | # Households | % Households |
| Less than $10,000 | 71 | 26.0% |
| $10,000 to $14,999 | 3 | 1.1% |
| $15,000 to $24,999 | 15 | 5.5% |
| $25,000 to $34,999 | 21 | 7.7% |
| $35,000 to $49,999 | 64 | 23.4% |
| $50,000 to $74,999 | 25 | 9.2% |
| $75,000 to $99,999 | 37 | 13.6% |
| $100,000 to $149,999 | 26 | 9.5% |
| $150,000 to $199,999 | 5 | 1.8% |
| $200,000+ | 6 | 2.2% |
Household Income by Householder Age in West Liberty
The median household income in West Liberty is $39,181, with the highest median household income of $90,909 found in the 45 to 64 years age bracket for the primary householder. A total of 50 households (18.3%) fall into this category. Meanwhile, the 15 to 24 years age bracket for the primary householder has the lowest median household income of $0, with 99 households (36.3%) in this group.

| Income Bracket | # Households | Median Income |
| 15 to 24 Years | 99 (36.3%) | $0 |
| 25 to 44 Years | 49 (17.9%) | $81,354 |
| 45 to 64 Years | 50 (18.3%) | $90,909 |
| 65+ Years | 75 (27.5%) | $40,250 |
| Total | 273 (100.0%) | $39,181 |
Poverty in West Liberty
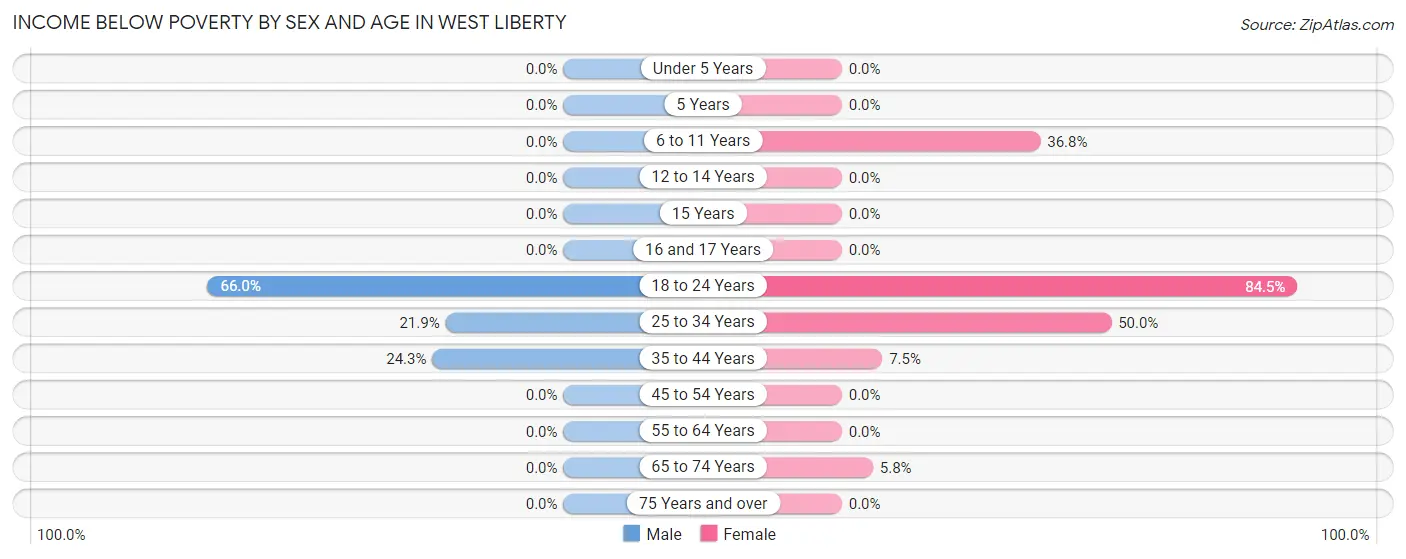
Income Below Poverty by Sex and Age in West Liberty
With 18.5% poverty level for males and 45.0% for females among the residents of West Liberty, 18 to 24 year old males and 18 to 24 year old females are the most vulnerable to poverty, with 35 males (66.0%) and 164 females (84.5%) in their respective age groups living below the poverty level.
| Age Bracket | Male | Female |
| Under 5 Years | 0 (0.0%) | 0 (0.0%) |
| 5 Years | 0 (0.0%) | 0 (0.0%) |
| 6 to 11 Years | 0 (0.0%) | 14 (36.8%) |
| 12 to 14 Years | 0 (0.0%) | 0 (0.0%) |
| 15 Years | 0 (0.0%) | 0 (0.0%) |
| 16 and 17 Years | 0 (0.0%) | 0 (0.0%) |
| 18 to 24 Years | 35 (66.0%) | 164 (84.5%) |
| 25 to 34 Years | 7 (21.9%) | 5 (50.0%) |
| 35 to 44 Years | 9 (24.3%) | 3 (7.5%) |
| 45 to 54 Years | 0 (0.0%) | 0 (0.0%) |
| 55 to 64 Years | 0 (0.0%) | 0 (0.0%) |
| 65 to 74 Years | 0 (0.0%) | 3 (5.8%) |
| 75 Years and over | 0 (0.0%) | 0 (0.0%) |
| Total | 51 (18.5%) | 189 (45.0%) |
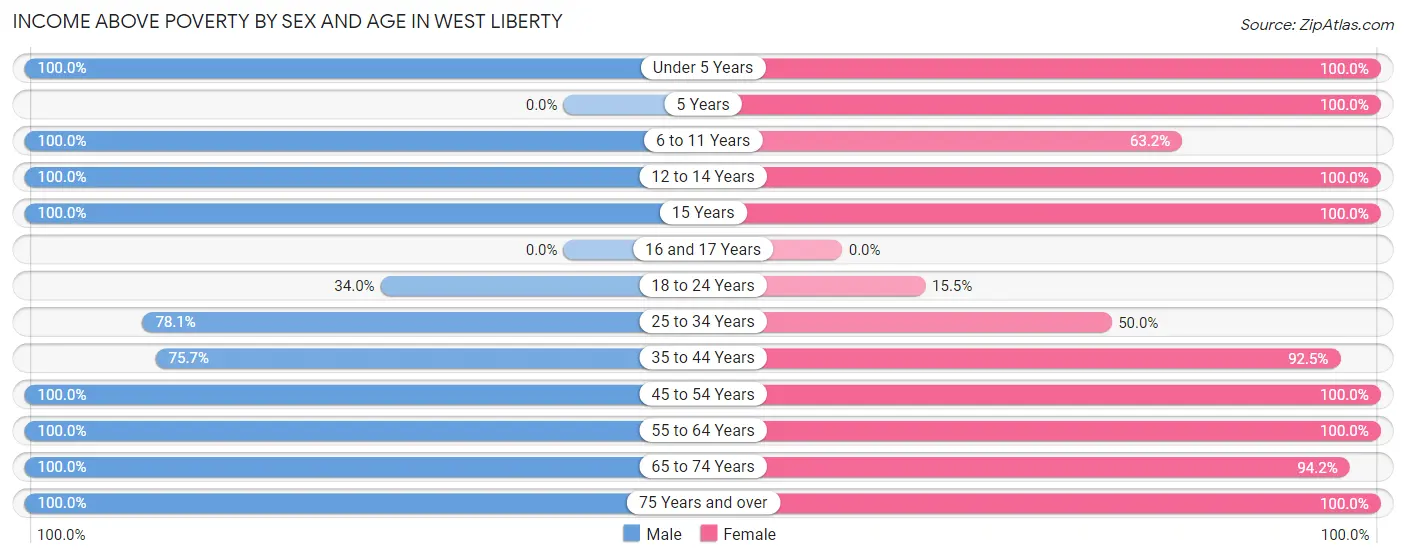
Income Above Poverty by Sex and Age in West Liberty
According to the poverty statistics in West Liberty, males aged under 5 years and females aged under 5 years are the age groups that are most secure financially, with 100.0% of males and 100.0% of females in these age groups living above the poverty line.
| Age Bracket | Male | Female |
| Under 5 Years | 12 (100.0%) | 6 (100.0%) |
| 5 Years | 0 (0.0%) | 15 (100.0%) |
| 6 to 11 Years | 13 (100.0%) | 24 (63.2%) |
| 12 to 14 Years | 24 (100.0%) | 5 (100.0%) |
| 15 Years | 6 (100.0%) | 4 (100.0%) |
| 16 and 17 Years | 0 (0.0%) | 0 (0.0%) |
| 18 to 24 Years | 18 (34.0%) | 30 (15.5%) |
| 25 to 34 Years | 25 (78.1%) | 5 (50.0%) |
| 35 to 44 Years | 28 (75.7%) | 37 (92.5%) |
| 45 to 54 Years | 24 (100.0%) | 32 (100.0%) |
| 55 to 64 Years | 31 (100.0%) | 11 (100.0%) |
| 65 to 74 Years | 23 (100.0%) | 49 (94.2%) |
| 75 Years and over | 20 (100.0%) | 13 (100.0%) |
| Total | 224 (81.5%) | 231 (55.0%) |
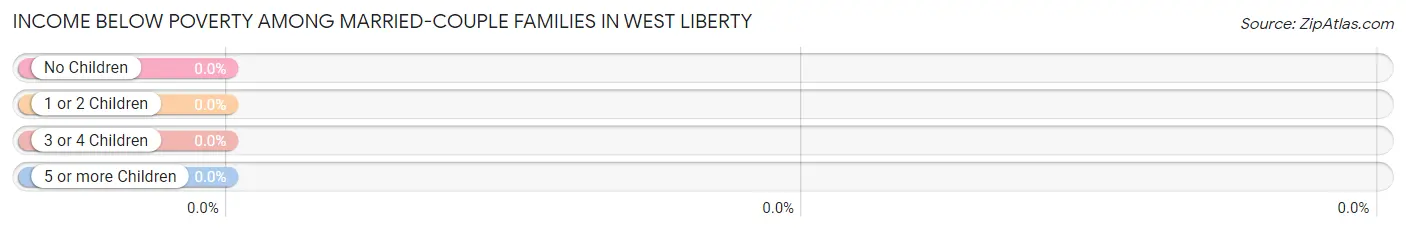
Income Below Poverty Among Married-Couple Families in West Liberty
| Children | Above Poverty | Below Poverty |
| No Children | 65 (100.0%) | 0 (0.0%) |
| 1 or 2 Children | 11 (100.0%) | 0 (0.0%) |
| 3 or 4 Children | 10 (100.0%) | 0 (0.0%) |
| 5 or more Children | 7 (100.0%) | 0 (0.0%) |
| Total | 93 (100.0%) | 0 (0.0%) |
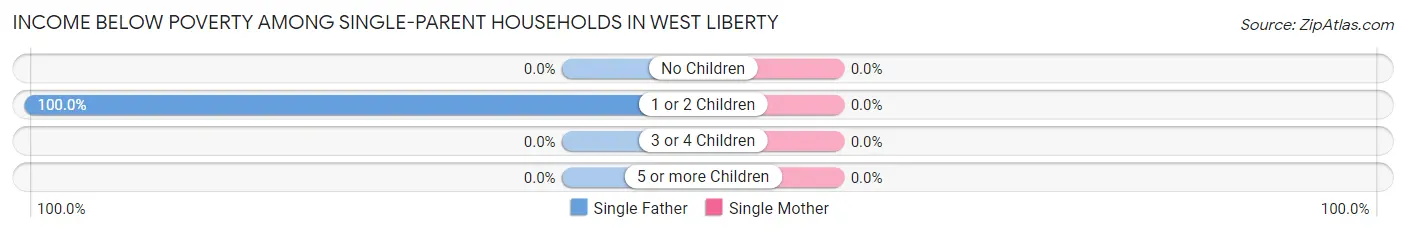
Income Below Poverty Among Single-Parent Households in West Liberty
| Children | Single Father | Single Mother |
| No Children | 0 (0.0%) | 0 (0.0%) |
| 1 or 2 Children | 9 (100.0%) | 0 (0.0%) |
| 3 or 4 Children | 0 (0.0%) | 0 (0.0%) |
| 5 or more Children | 0 (0.0%) | 0 (0.0%) |
| Total | 9 (100.0%) | 0 (0.0%) |
Income Below Poverty Among Married-Couple vs Single-Parent Households in West Liberty
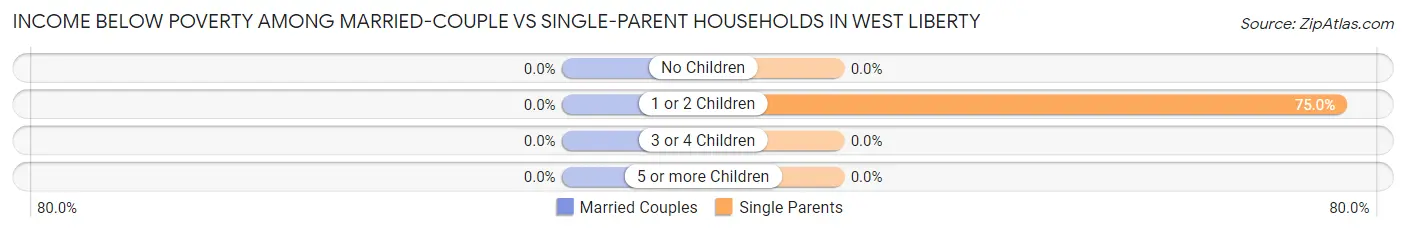
| Children | Married-Couple Families | Single-Parent Households |
| No Children | 0 (0.0%) | 0 (0.0%) |
| 1 or 2 Children | 0 (0.0%) | 9 (75.0%) |
| 3 or 4 Children | 0 (0.0%) | 0 (0.0%) |
| 5 or more Children | 0 (0.0%) | 0 (0.0%) |
| Total | 0 (0.0%) | 9 (31.0%) |
Race in West Liberty
The most populous races in West Liberty are White / Caucasian (1,593 | 90.3%), Hispanic or Latino (64 | 3.6%), and Some other Race (60 | 3.4%).
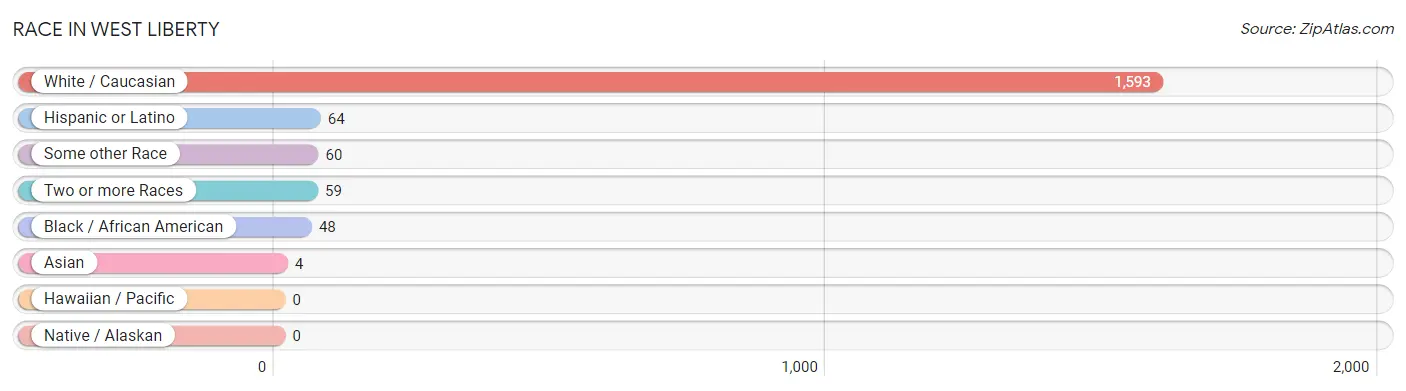
| Race | # Population | % Population |
| Asian | 4 | 0.2% |
| Black / African American | 48 | 2.7% |
| Hawaiian / Pacific | 0 | 0.0% |
| Hispanic or Latino | 64 | 3.6% |
| Native / Alaskan | 0 | 0.0% |
| White / Caucasian | 1,593 | 90.3% |
| Two or more Races | 59 | 3.3% |
| Some other Race | 60 | 3.4% |
| Total | 1,764 | 100.0% |
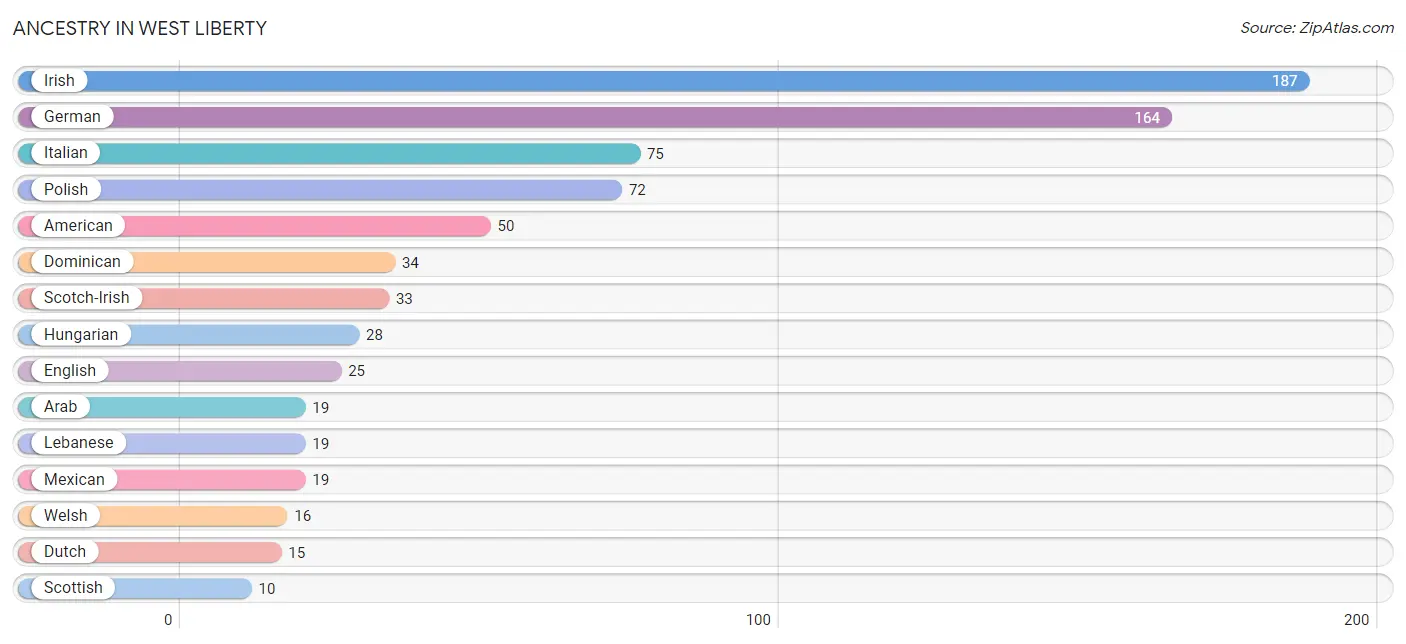
Ancestry in West Liberty
The most populous ancestries reported in West Liberty are Irish (187 | 10.6%), German (164 | 9.3%), Italian (75 | 4.3%), Polish (72 | 4.1%), and American (50 | 2.8%), together accounting for 31.1% of all West Liberty residents.
| Ancestry | # Population | % Population |
| American | 50 | 2.8% |
| Arab | 19 | 1.1% |
| Austrian | 2 | 0.1% |
| Colombian | 7 | 0.4% |
| Croatian | 5 | 0.3% |
| Dominican | 34 | 1.9% |
| Dutch | 15 | 0.9% |
| Eastern European | 7 | 0.4% |
| English | 25 | 1.4% |
| European | 4 | 0.2% |
| French | 7 | 0.4% |
| German | 164 | 9.3% |
| Hungarian | 28 | 1.6% |
| Irish | 187 | 10.6% |
| Italian | 75 | 4.3% |
| Korean | 1 | 0.1% |
| Lebanese | 19 | 1.1% |
| Mexican | 19 | 1.1% |
| Norwegian | 7 | 0.4% |
| Polish | 72 | 4.1% |
| Russian | 7 | 0.4% |
| Scotch-Irish | 33 | 1.9% |
| Scottish | 10 | 0.6% |
| Serbian | 5 | 0.3% |
| South American | 7 | 0.4% |
| Swiss | 8 | 0.4% |
| Welsh | 16 | 0.9% | View All 27 Rows |
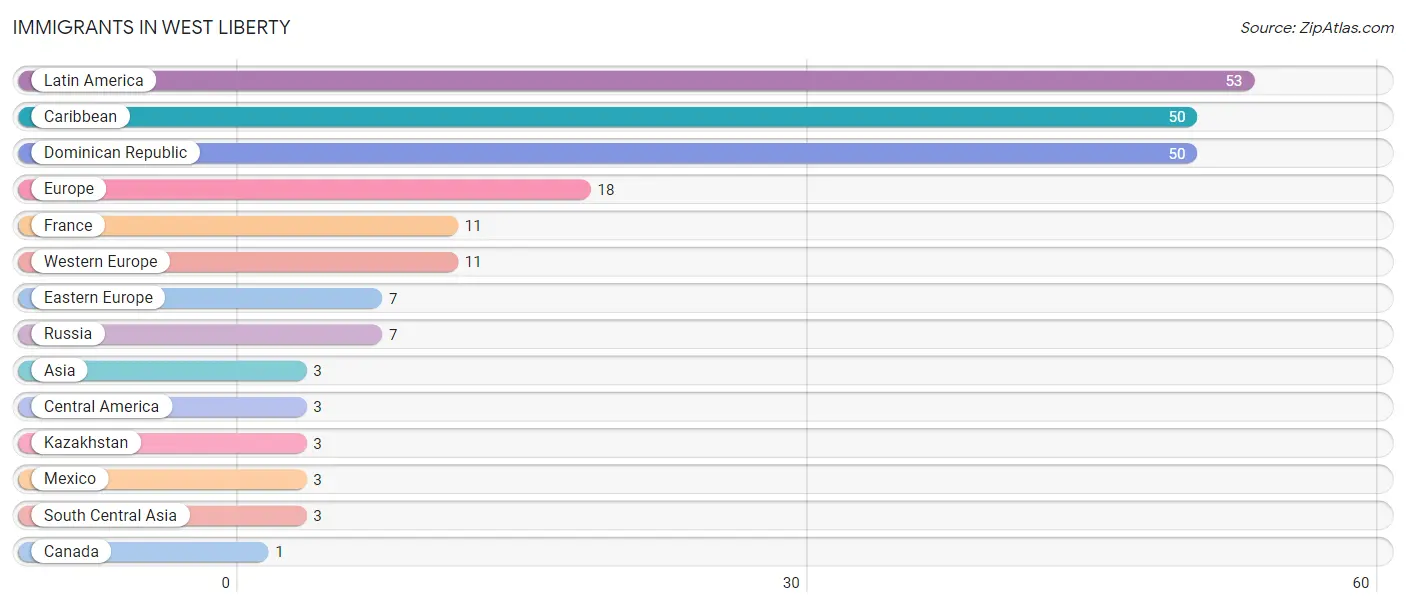
Immigrants in West Liberty
The most numerous immigrant groups reported in West Liberty came from Latin America (53 | 3.0%), Caribbean (50 | 2.8%), Dominican Republic (50 | 2.8%), Europe (18 | 1.0%), and France (11 | 0.6%), together accounting for 10.3% of all West Liberty residents.
| Immigration Origin | # Population | % Population |
| Asia | 3 | 0.2% |
| Canada | 1 | 0.1% |
| Caribbean | 50 | 2.8% |
| Central America | 3 | 0.2% |
| Dominican Republic | 50 | 2.8% |
| Eastern Europe | 7 | 0.4% |
| Europe | 18 | 1.0% |
| France | 11 | 0.6% |
| Kazakhstan | 3 | 0.2% |
| Latin America | 53 | 3.0% |
| Mexico | 3 | 0.2% |
| Russia | 7 | 0.4% |
| South Central Asia | 3 | 0.2% |
| Western Europe | 11 | 0.6% | View All 14 Rows |
Sex and Age in West Liberty
Sex and Age in West Liberty
The most populous age groups in West Liberty are 20 to 24 Years (263 | 38.7%) for men and 20 to 24 Years (478 | 44.1%) for women.
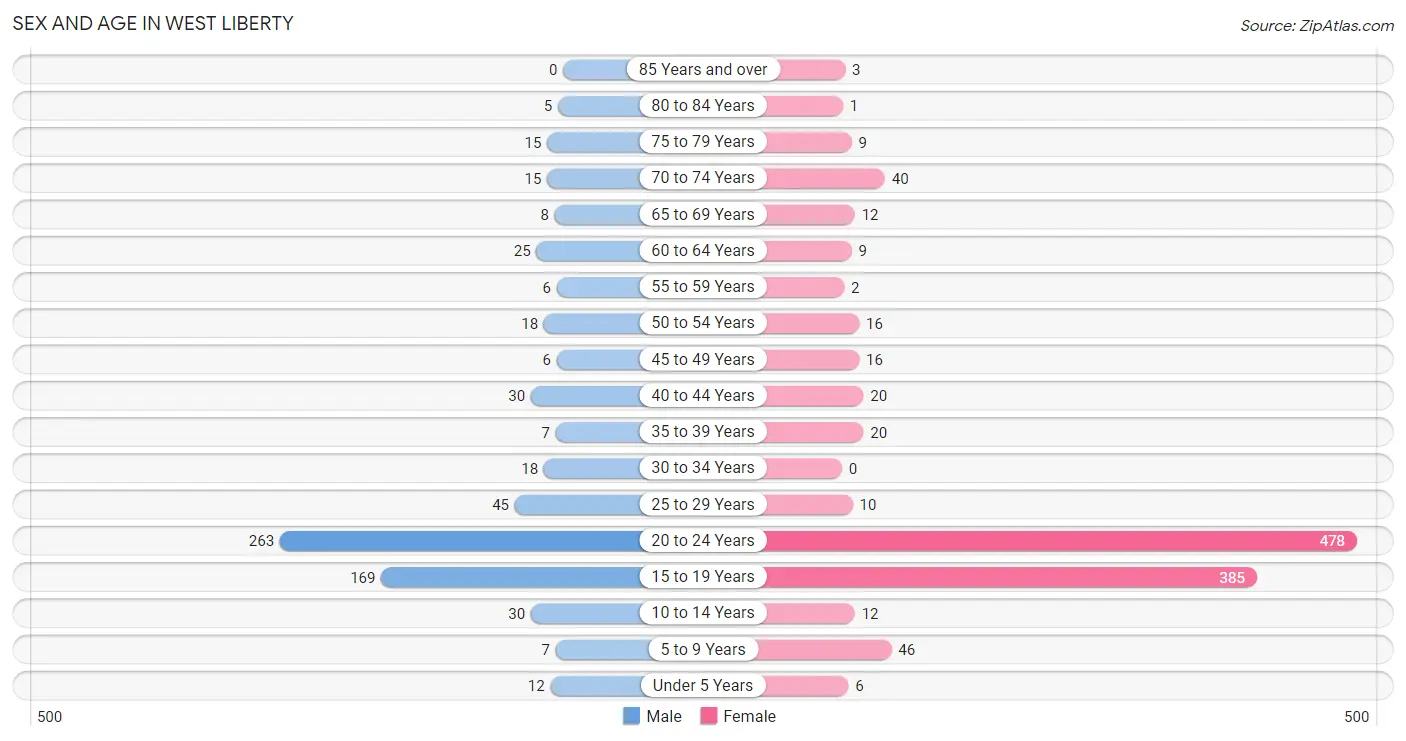
| Age Bracket | Male | Female |
| Under 5 Years | 12 (1.8%) | 6 (0.5%) |
| 5 to 9 Years | 7 (1.0%) | 46 (4.2%) |
| 10 to 14 Years | 30 (4.4%) | 12 (1.1%) |
| 15 to 19 Years | 169 (24.9%) | 385 (35.5%) |
| 20 to 24 Years | 263 (38.7%) | 478 (44.1%) |
| 25 to 29 Years | 45 (6.6%) | 10 (0.9%) |
| 30 to 34 Years | 18 (2.6%) | 0 (0.0%) |
| 35 to 39 Years | 7 (1.0%) | 20 (1.8%) |
| 40 to 44 Years | 30 (4.4%) | 20 (1.8%) |
| 45 to 49 Years | 6 (0.9%) | 16 (1.5%) |
| 50 to 54 Years | 18 (2.6%) | 16 (1.5%) |
| 55 to 59 Years | 6 (0.9%) | 2 (0.2%) |
| 60 to 64 Years | 25 (3.7%) | 9 (0.8%) |
| 65 to 69 Years | 8 (1.2%) | 12 (1.1%) |
| 70 to 74 Years | 15 (2.2%) | 40 (3.7%) |
| 75 to 79 Years | 15 (2.2%) | 9 (0.8%) |
| 80 to 84 Years | 5 (0.7%) | 1 (0.1%) |
| 85 Years and over | 0 (0.0%) | 3 (0.3%) |
| Total | 679 (100.0%) | 1,085 (100.0%) |
Families and Households in West Liberty
Median Family Size in West Liberty
The median family size in West Liberty is 3.11 persons per family, with married-couple families (93 | 76.2%) accounting for the largest median family size of 3.25 persons per family. On the other hand, single male/father families (9 | 7.4%) represent the smallest median family size with 2.56 persons per family.
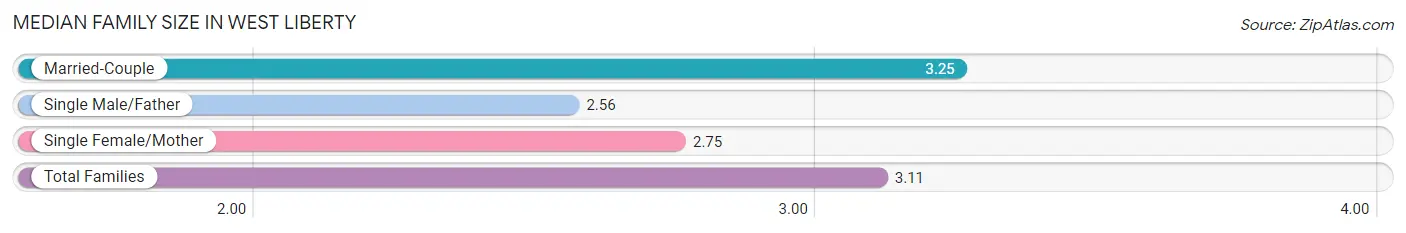
| Family Type | # Families | Family Size |
| Married-Couple | 93 (76.2%) | 3.25 |
| Single Male/Father | 9 (7.4%) | 2.56 |
| Single Female/Mother | 20 (16.4%) | 2.75 |
| Total Families | 122 (100.0%) | 3.11 |
Median Household Size in West Liberty
The median household size in West Liberty is 2.53 persons per household, with single male/father households (9 | 3.3%) accounting for the largest median household size of 3.33 persons per household. non-family households (151 | 55.3%) represent the smallest median household size with 2.02 persons per household.
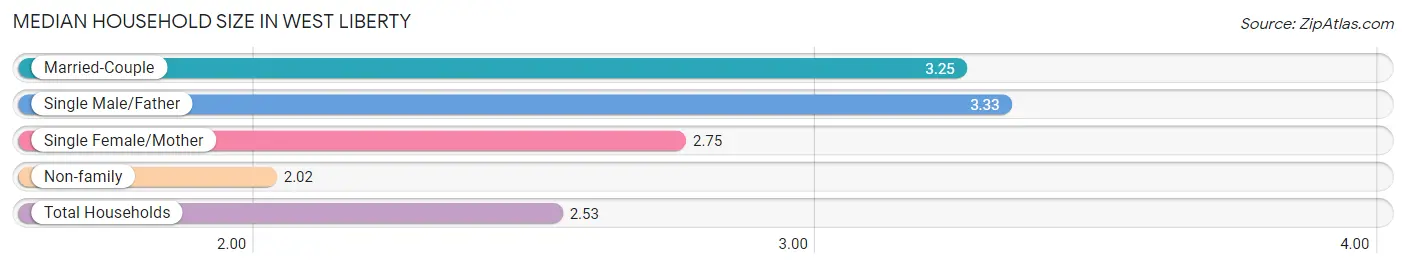
| Household Type | # Households | Household Size |
| Married-Couple | 93 (34.1%) | 3.25 |
| Single Male/Father | 9 (3.3%) | 3.33 |
| Single Female/Mother | 20 (7.3%) | 2.75 |
| Non-family | 151 (55.3%) | 2.02 |
| Total Households | 273 (100.0%) | 2.53 |
Household Size by Marriage Status in West Liberty
Out of a total of 273 households in West Liberty, 122 (44.7%) are family households, while 151 (55.3%) are nonfamily households. The most numerous type of family households are 2-person households, comprising 74, and the most common type of nonfamily households are 2-person households, comprising 90.
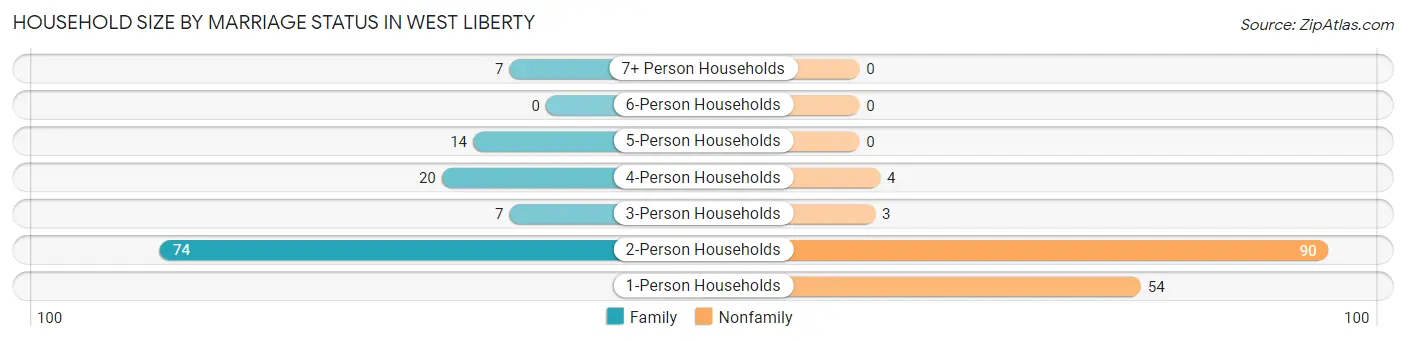
| Household Size | Family Households | Nonfamily Households |
| 1-Person Households | - | 54 (19.8%) |
| 2-Person Households | 74 (27.1%) | 90 (33.0%) |
| 3-Person Households | 7 (2.6%) | 3 (1.1%) |
| 4-Person Households | 20 (7.3%) | 4 (1.5%) |
| 5-Person Households | 14 (5.1%) | 0 (0.0%) |
| 6-Person Households | 0 (0.0%) | 0 (0.0%) |
| 7+ Person Households | 7 (2.6%) | 0 (0.0%) |
| Total | 122 (44.7%) | 151 (55.3%) |
Female Fertility in West Liberty
Fertility by Age in West Liberty
| Age Bracket | Women with Births | Births / 1,000 Women |
| 15 to 19 years | 0 (0.0%) | 0.0 |
| 20 to 34 years | 0 (0.0%) | 0.0 |
| 35 to 50 years | 0 (0.0%) | 0.0 |
| Total | 0 (0.0%) | 0.0 |
Fertility by Age by Marriage Status in West Liberty
| Age Bracket | Married | Unmarried |
| 15 to 19 years | 0 (0.0%) | 0 (0.0%) |
| 20 to 34 years | 0 (0.0%) | 0 (0.0%) |
| 35 to 50 years | 0 (0.0%) | 0 (0.0%) |
| Total | 0 (0.0%) | 0 (0.0%) |
Fertility by Education in West Liberty
| Educational Attainment | Women with Births | Births / 1,000 Women |
| Less than High School | 0 (0.0%) | 0.0 |
| High School Diploma | 0 (0.0%) | 0.0 |
| College or Associate's Degree | 0 (0.0%) | 0.0 |
| Bachelor's Degree | 0 (0.0%) | 0.0 |
| Graduate Degree | 0 (0.0%) | 0.0 |
| Total | 0 (0.0%) | 0.0 |
Fertility by Education by Marriage Status in West Liberty
| Educational Attainment | Married | Unmarried |
| Less than High School | 0 (0.0%) | 0 (0.0%) |
| High School Diploma | 0 (0.0%) | 0 (0.0%) |
| College or Associate's Degree | 0 (0.0%) | 0 (0.0%) |
| Bachelor's Degree | 0 (0.0%) | 0 (0.0%) |
| Graduate Degree | 0 (0.0%) | 0 (0.0%) |
| Total | 0 (0.0%) | 0 (0.0%) |
Employment Characteristics in West Liberty
Employment by Class of Employer in West Liberty
Among the 750 employed individuals in West Liberty, private company employees (577 | 76.9%), not-for-profit organizations (85 | 11.3%), and state government employees (49 | 6.5%) make up the most common classes of employment.
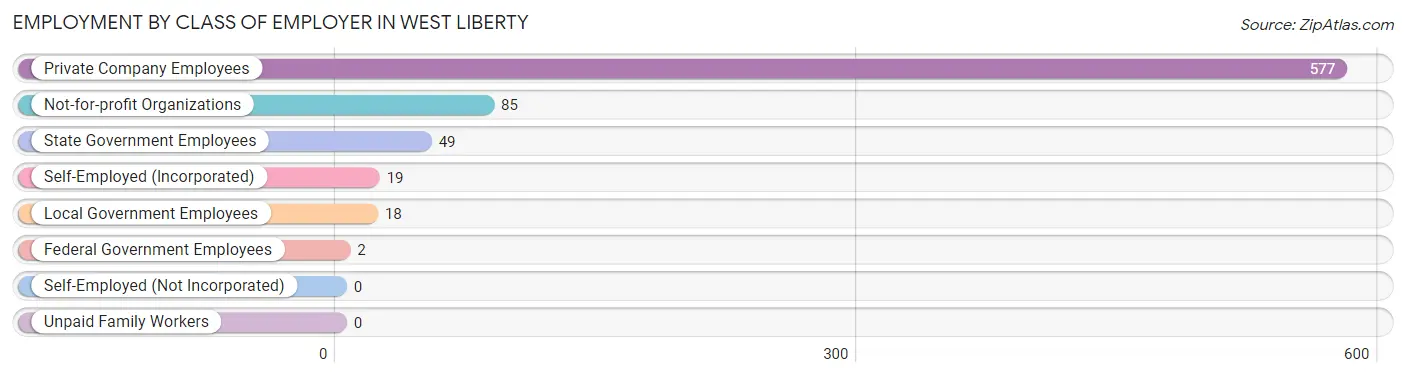
| Employer Class | # Employees | % Employees |
| Private Company Employees | 577 | 76.9% |
| Self-Employed (Incorporated) | 19 | 2.5% |
| Self-Employed (Not Incorporated) | 0 | 0.0% |
| Not-for-profit Organizations | 85 | 11.3% |
| Local Government Employees | 18 | 2.4% |
| State Government Employees | 49 | 6.5% |
| Federal Government Employees | 2 | 0.3% |
| Unpaid Family Workers | 0 | 0.0% |
| Total | 750 | 100.0% |
Employment Status by Age in West Liberty
According to the labor force statistics for West Liberty, out of the total population over 16 years of age (1,641), 55.3% or 907 individuals are in the labor force, with 4.1% or 37 of them unemployed. The age group with the highest labor force participation rate is 30 to 34 years, with 100.0% or 18 individuals in the labor force. Within the labor force, the 16 to 19 years age range has the highest percentage of unemployed individuals, with 9.0% or 22 of them being unemployed.
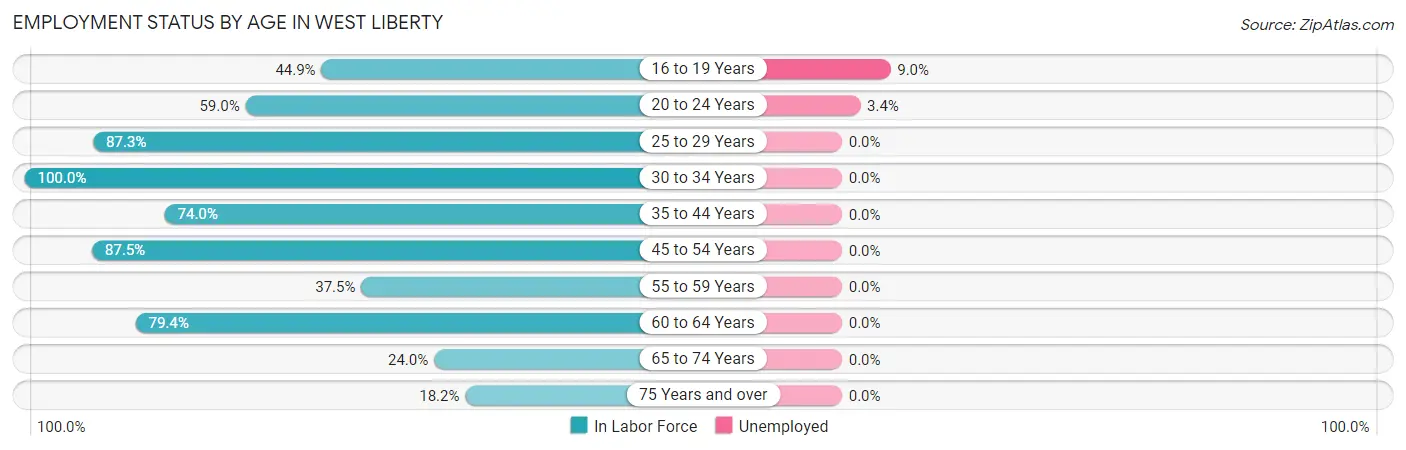
| Age Bracket | In Labor Force | Unemployed |
| 16 to 19 Years | 244 (44.9%) | 22 (9.0%) |
| 20 to 24 Years | 437 (59.0%) | 15 (3.4%) |
| 25 to 29 Years | 48 (87.3%) | 0 (0.0%) |
| 30 to 34 Years | 18 (100.0%) | 0 (0.0%) |
| 35 to 44 Years | 57 (74.0%) | 0 (0.0%) |
| 45 to 54 Years | 49 (87.5%) | 0 (0.0%) |
| 55 to 59 Years | 3 (37.5%) | 0 (0.0%) |
| 60 to 64 Years | 27 (79.4%) | 0 (0.0%) |
| 65 to 74 Years | 18 (24.0%) | 0 (0.0%) |
| 75 Years and over | 6 (18.2%) | 0 (0.0%) |
| Total | 907 (55.3%) | 37 (4.1%) |
Employment Status by Educational Attainment in West Liberty
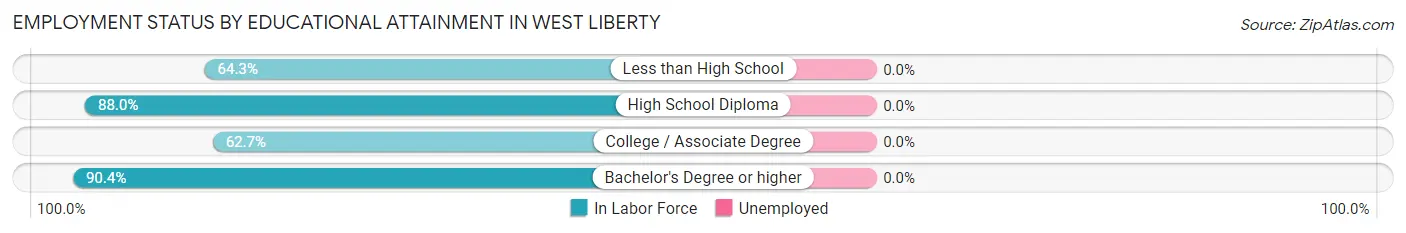
| Educational Attainment | In Labor Force | Unemployed |
| Less than High School | 9 (64.3%) | 0 (0.0%) |
| High School Diploma | 81 (88.0%) | 0 (0.0%) |
| College / Associate Degree | 37 (62.7%) | 0 (0.0%) |
| Bachelor's Degree or higher | 75 (90.4%) | 0 (0.0%) |
| Total | 202 (81.5%) | 0 (0.0%) |
Employment Occupations by Sex in West Liberty
Management, Business, Science and Arts Occupations
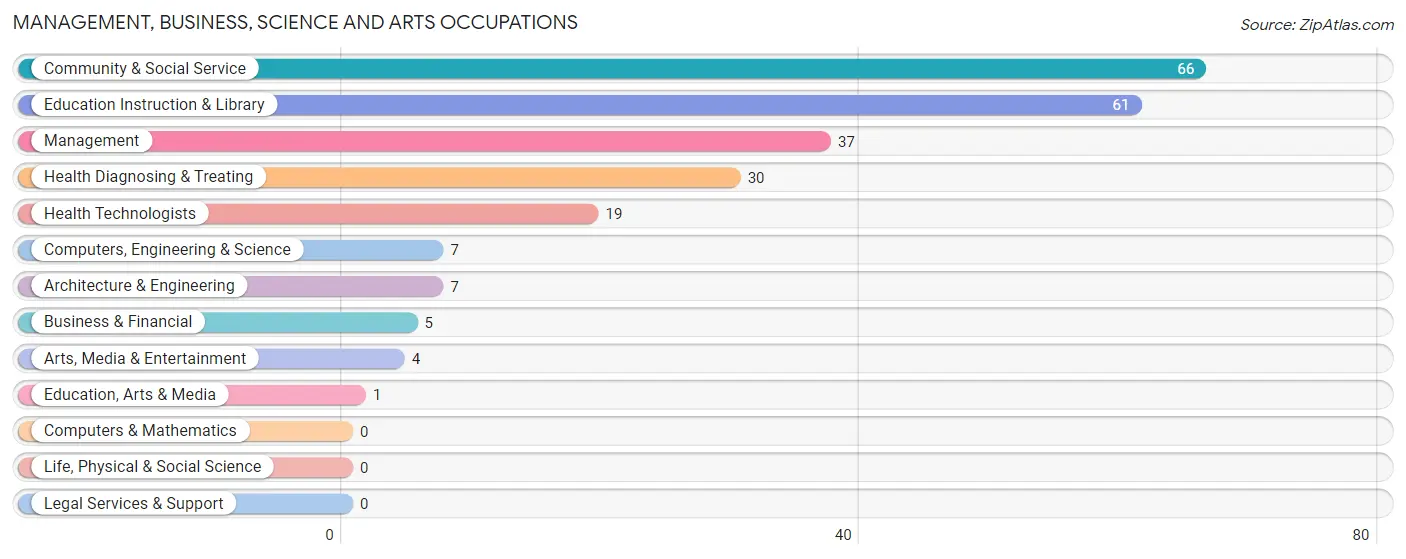
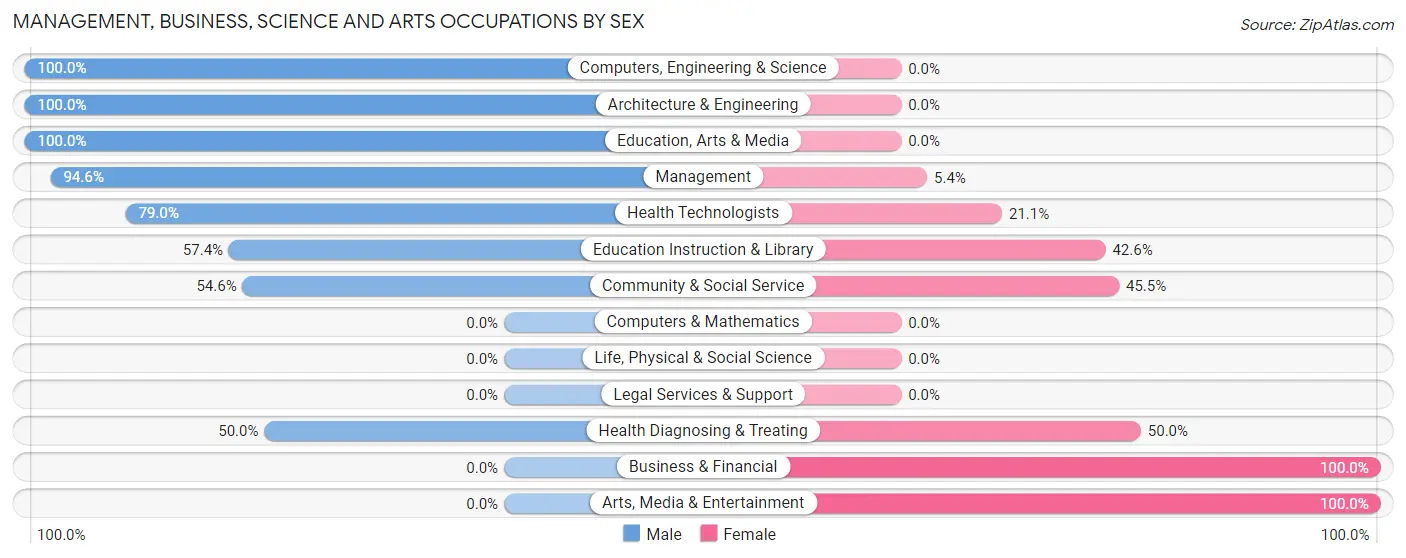
The most common Management, Business, Science and Arts occupations in West Liberty are Community & Social Service (66 | 7.6%), Education Instruction & Library (61 | 7.0%), Management (37 | 4.3%), Health Diagnosing & Treating (30 | 3.5%), and Health Technologists (19 | 2.2%).
Management, Business, Science and Arts Occupations by Sex
Within the Management, Business, Science and Arts occupations in West Liberty, the most male-oriented occupations are Computers, Engineering & Science (100.0%), Architecture & Engineering (100.0%), and Education, Arts & Media (100.0%), while the most female-oriented occupations are Business & Financial (100.0%), Arts, Media & Entertainment (100.0%), and Health Diagnosing & Treating (50.0%).
| Occupation | Male | Female |
| Management | 35 (94.6%) | 2 (5.4%) |
| Business & Financial | 0 (0.0%) | 5 (100.0%) |
| Computers, Engineering & Science | 7 (100.0%) | 0 (0.0%) |
| Computers & Mathematics | 0 (0.0%) | 0 (0.0%) |
| Architecture & Engineering | 7 (100.0%) | 0 (0.0%) |
| Life, Physical & Social Science | 0 (0.0%) | 0 (0.0%) |
| Community & Social Service | 36 (54.5%) | 30 (45.5%) |
| Education, Arts & Media | 1 (100.0%) | 0 (0.0%) |
| Legal Services & Support | 0 (0.0%) | 0 (0.0%) |
| Education Instruction & Library | 35 (57.4%) | 26 (42.6%) |
| Arts, Media & Entertainment | 0 (0.0%) | 4 (100.0%) |
| Health Diagnosing & Treating | 15 (50.0%) | 15 (50.0%) |
| Health Technologists | 15 (78.9%) | 4 (21.0%) |
| Total (Category) | 93 (64.1%) | 52 (35.9%) |
| Total (Overall) | 354 (40.7%) | 516 (59.3%) |
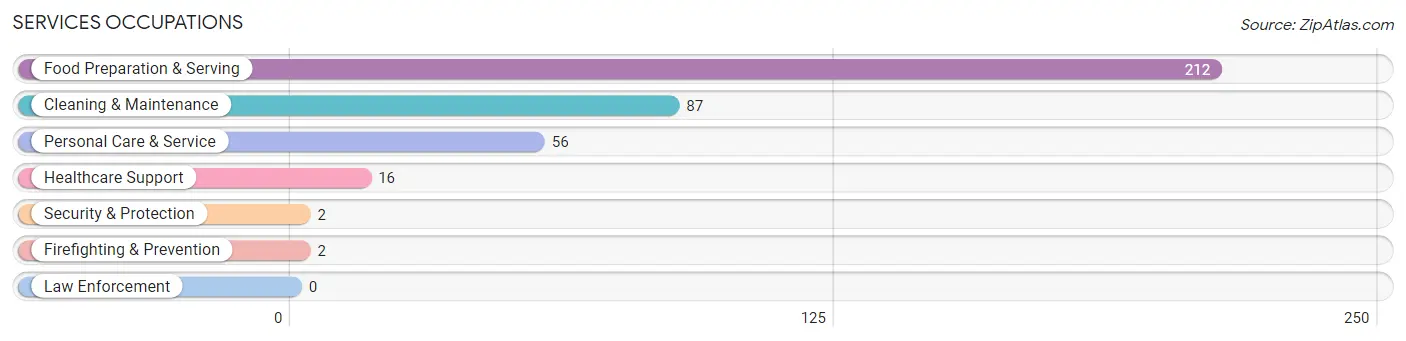
Services Occupations
The most common Services occupations in West Liberty are Food Preparation & Serving (212 | 24.4%), Cleaning & Maintenance (87 | 10.0%), Personal Care & Service (56 | 6.4%), Healthcare Support (16 | 1.8%), and Security & Protection (2 | 0.2%).
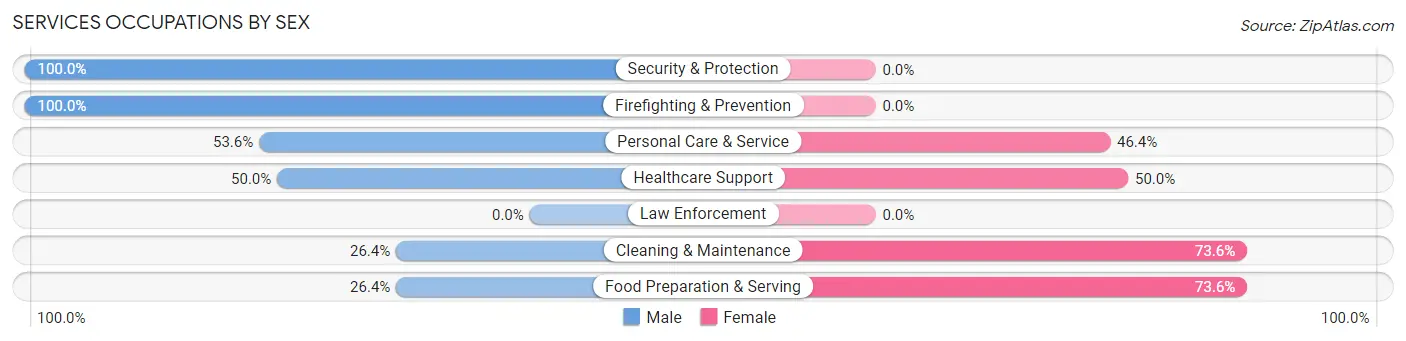
Services Occupations by Sex
Within the Services occupations in West Liberty, the most male-oriented occupations are Security & Protection (100.0%), Firefighting & Prevention (100.0%), and Personal Care & Service (53.6%), while the most female-oriented occupations are Food Preparation & Serving (73.6%), Cleaning & Maintenance (73.6%), and Healthcare Support (50.0%).
| Occupation | Male | Female |
| Healthcare Support | 8 (50.0%) | 8 (50.0%) |
| Security & Protection | 2 (100.0%) | 0 (0.0%) |
| Firefighting & Prevention | 2 (100.0%) | 0 (0.0%) |
| Law Enforcement | 0 (0.0%) | 0 (0.0%) |
| Food Preparation & Serving | 56 (26.4%) | 156 (73.6%) |
| Cleaning & Maintenance | 23 (26.4%) | 64 (73.6%) |
| Personal Care & Service | 30 (53.6%) | 26 (46.4%) |
| Total (Category) | 119 (31.9%) | 254 (68.1%) |
| Total (Overall) | 354 (40.7%) | 516 (59.3%) |
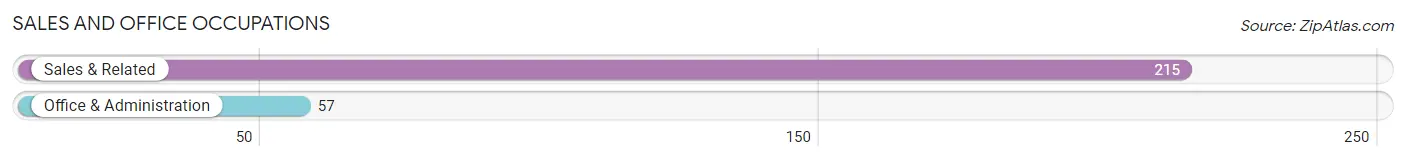
Sales and Office Occupations
The most common Sales and Office occupations in West Liberty are Sales & Related (215 | 24.7%), and Office & Administration (57 | 6.6%).
Sales and Office Occupations by Sex
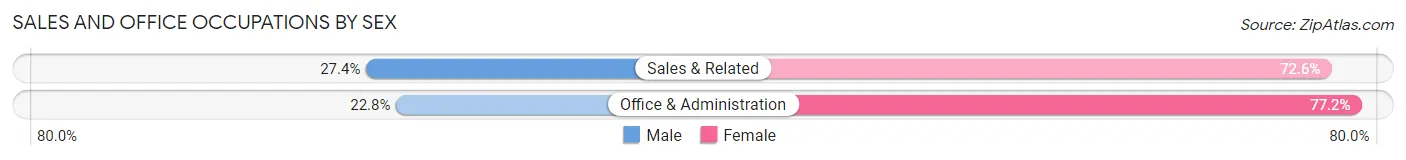
| Occupation | Male | Female |
| Sales & Related | 59 (27.4%) | 156 (72.6%) |
| Office & Administration | 13 (22.8%) | 44 (77.2%) |
| Total (Category) | 72 (26.5%) | 200 (73.5%) |
| Total (Overall) | 354 (40.7%) | 516 (59.3%) |
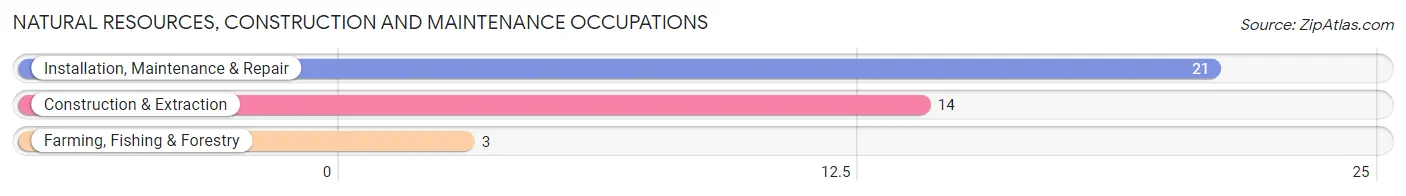
Natural Resources, Construction and Maintenance Occupations
The most common Natural Resources, Construction and Maintenance occupations in West Liberty are Installation, Maintenance & Repair (21 | 2.4%), Construction & Extraction (14 | 1.6%), and Farming, Fishing & Forestry (3 | 0.3%).
Natural Resources, Construction and Maintenance Occupations by Sex
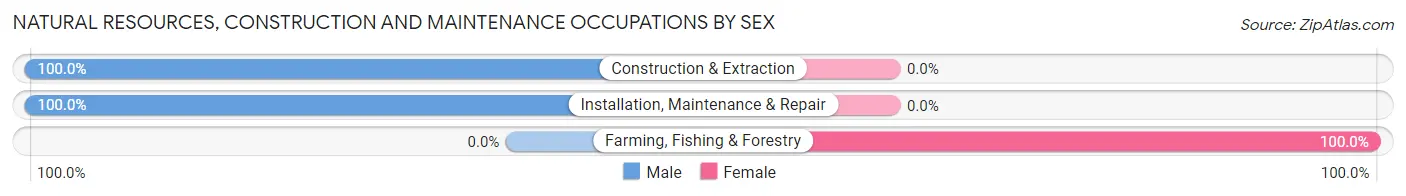
| Occupation | Male | Female |
| Farming, Fishing & Forestry | 0 (0.0%) | 3 (100.0%) |
| Construction & Extraction | 14 (100.0%) | 0 (0.0%) |
| Installation, Maintenance & Repair | 21 (100.0%) | 0 (0.0%) |
| Total (Category) | 35 (92.1%) | 3 (7.9%) |
| Total (Overall) | 354 (40.7%) | 516 (59.3%) |
Production, Transportation and Moving Occupations
The most common Production, Transportation and Moving occupations in West Liberty are Production (21 | 2.4%), Transportation (14 | 1.6%), and Material Moving (7 | 0.8%).
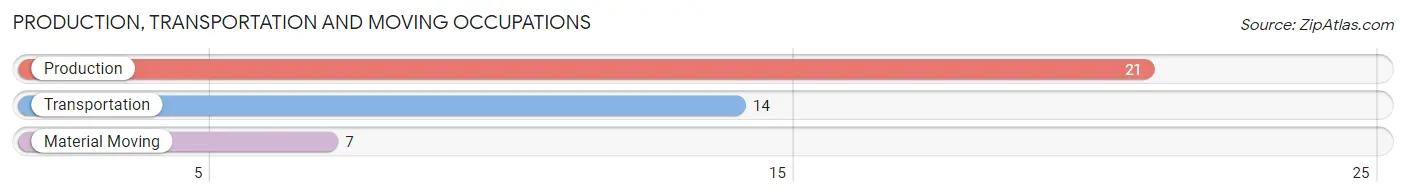
Production, Transportation and Moving Occupations by Sex
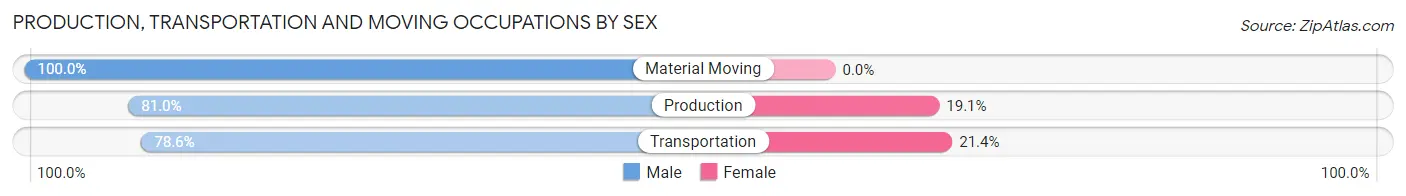
| Occupation | Male | Female |
| Production | 17 (80.9%) | 4 (19.1%) |
| Transportation | 11 (78.6%) | 3 (21.4%) |
| Material Moving | 7 (100.0%) | 0 (0.0%) |
| Total (Category) | 35 (83.3%) | 7 (16.7%) |
| Total (Overall) | 354 (40.7%) | 516 (59.3%) |
Employment Industries by Sex in West Liberty
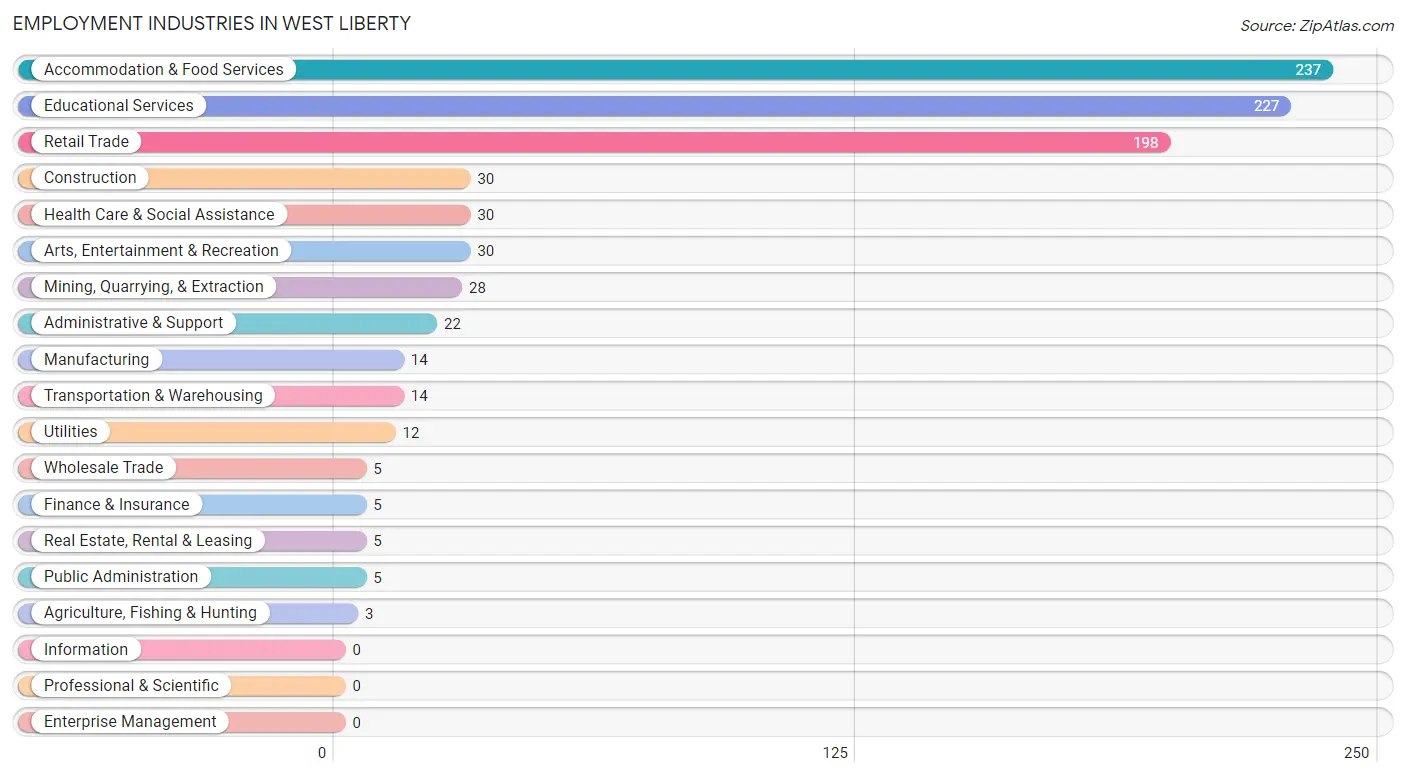
Employment Industries in West Liberty
The major employment industries in West Liberty include Accommodation & Food Services (237 | 27.2%), Educational Services (227 | 26.1%), Retail Trade (198 | 22.8%), Construction (30 | 3.5%), and Health Care & Social Assistance (30 | 3.5%).
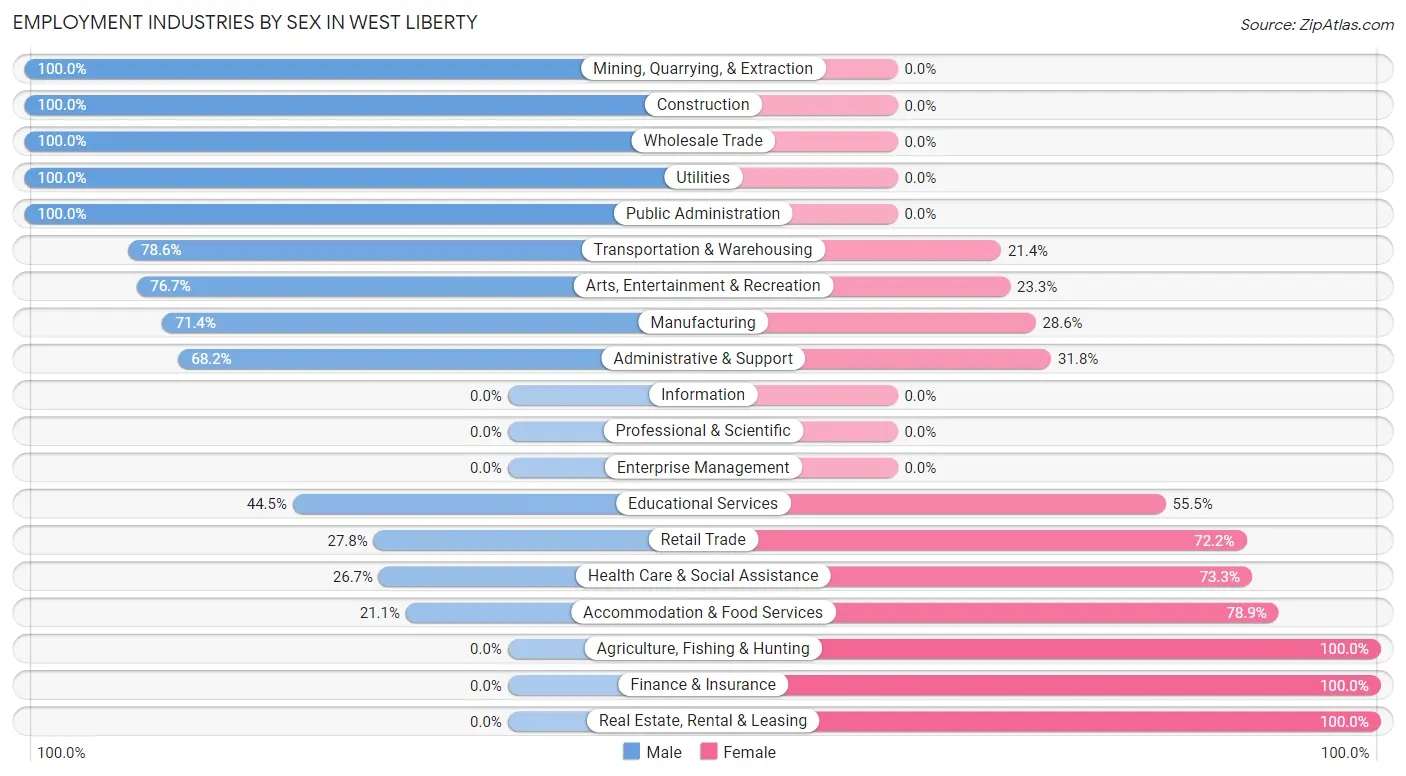
Employment Industries by Sex in West Liberty
The West Liberty industries that see more men than women are Mining, Quarrying, & Extraction (100.0%), Construction (100.0%), and Wholesale Trade (100.0%), whereas the industries that tend to have a higher number of women are Agriculture, Fishing & Hunting (100.0%), Finance & Insurance (100.0%), and Real Estate, Rental & Leasing (100.0%).
| Industry | Male | Female |
| Agriculture, Fishing & Hunting | 0 (0.0%) | 3 (100.0%) |
| Mining, Quarrying, & Extraction | 28 (100.0%) | 0 (0.0%) |
| Construction | 30 (100.0%) | 0 (0.0%) |
| Manufacturing | 10 (71.4%) | 4 (28.6%) |
| Wholesale Trade | 5 (100.0%) | 0 (0.0%) |
| Retail Trade | 55 (27.8%) | 143 (72.2%) |
| Transportation & Warehousing | 11 (78.6%) | 3 (21.4%) |
| Utilities | 12 (100.0%) | 0 (0.0%) |
| Information | 0 (0.0%) | 0 (0.0%) |
| Finance & Insurance | 0 (0.0%) | 5 (100.0%) |
| Real Estate, Rental & Leasing | 0 (0.0%) | 5 (100.0%) |
| Professional & Scientific | 0 (0.0%) | 0 (0.0%) |
| Enterprise Management | 0 (0.0%) | 0 (0.0%) |
| Administrative & Support | 15 (68.2%) | 7 (31.8%) |
| Educational Services | 101 (44.5%) | 126 (55.5%) |
| Health Care & Social Assistance | 8 (26.7%) | 22 (73.3%) |
| Arts, Entertainment & Recreation | 23 (76.7%) | 7 (23.3%) |
| Accommodation & Food Services | 50 (21.1%) | 187 (78.9%) |
| Public Administration | 5 (100.0%) | 0 (0.0%) |
| Total | 354 (40.7%) | 516 (59.3%) |
Education in West Liberty
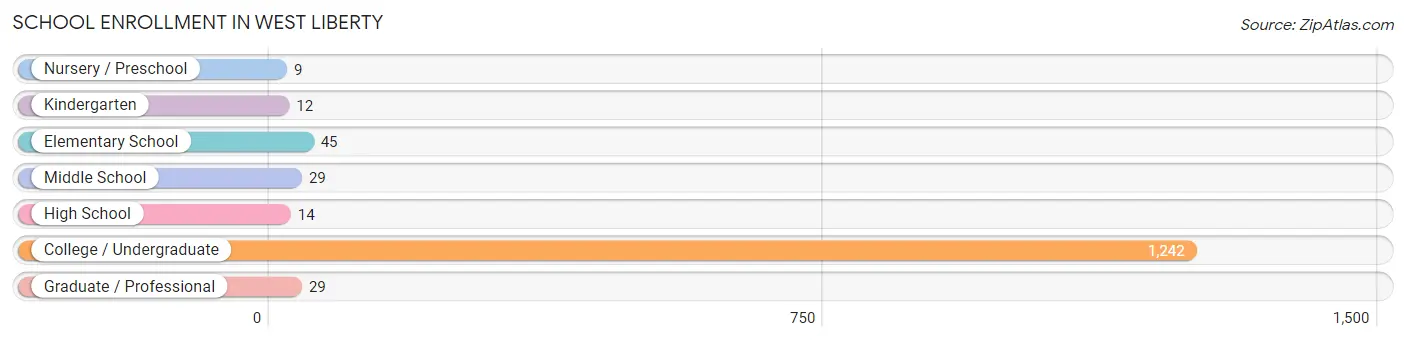
School Enrollment in West Liberty
The most common levels of schooling among the 1,380 students in West Liberty are college / undergraduate (1,242 | 90.0%), elementary school (45 | 3.3%), and middle school (29 | 2.1%).
| School Level | # Students | % Students |
| Nursery / Preschool | 9 | 0.6% |
| Kindergarten | 12 | 0.9% |
| Elementary School | 45 | 3.3% |
| Middle School | 29 | 2.1% |
| High School | 14 | 1.0% |
| College / Undergraduate | 1,242 | 90.0% |
| Graduate / Professional | 29 | 2.1% |
| Total | 1,380 | 100.0% |
School Enrollment by Age by Funding Source in West Liberty
Out of a total of 1,380 students who are enrolled in schools in West Liberty, 105 (7.6%) attend a private institution, while the remaining 1,275 (92.4%) are enrolled in public schools. The age group of 25 to 34 year olds has the highest likelihood of being enrolled in private schools, with 8 (22.2% in the age bracket) enrolled. Conversely, the age group of 5 to 9 year old has the lowest likelihood of being enrolled in a private school, with 53 (100.0% in the age bracket) attending a public institution.
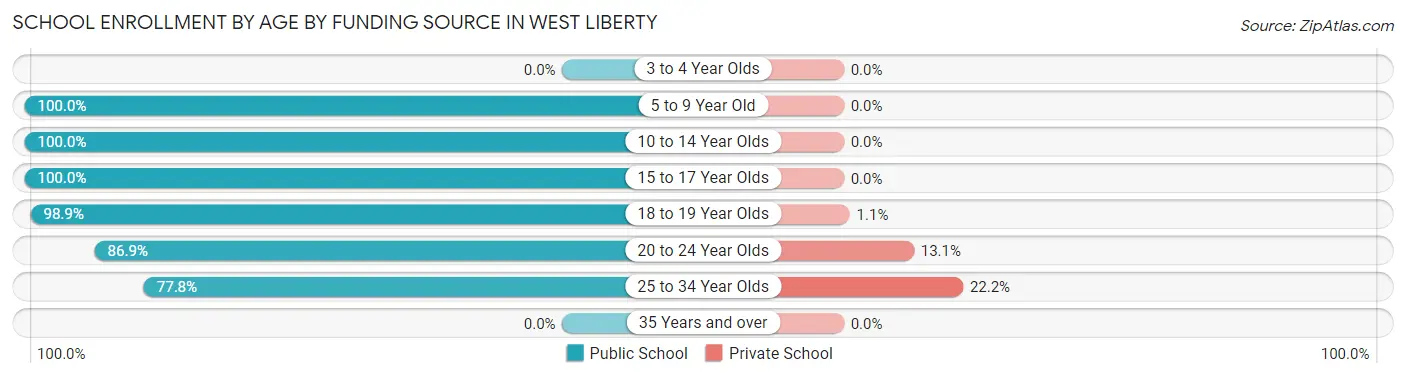
| Age Bracket | Public School | Private School |
| 3 to 4 Year Olds | 0 (0.0%) | 0 (0.0%) |
| 5 to 9 Year Old | 53 (100.0%) | 0 (0.0%) |
| 10 to 14 Year Olds | 42 (100.0%) | 0 (0.0%) |
| 15 to 17 Year Olds | 10 (100.0%) | 0 (0.0%) |
| 18 to 19 Year Olds | 536 (98.9%) | 6 (1.1%) |
| 20 to 24 Year Olds | 606 (86.9%) | 91 (13.1%) |
| 25 to 34 Year Olds | 28 (77.8%) | 8 (22.2%) |
| 35 Years and over | 0 (0.0%) | 0 (0.0%) |
| Total | 1,275 (92.4%) | 105 (7.6%) |
Educational Attainment by Field of Study in West Liberty
Education (43 | 31.4%), business (35 | 25.6%), bio, nature & agricultural (15 | 11.0%), social sciences (11 | 8.0%), and science & technology (8 | 5.8%) are the most common fields of study among 137 individuals in West Liberty who have obtained a bachelor's degree or higher.
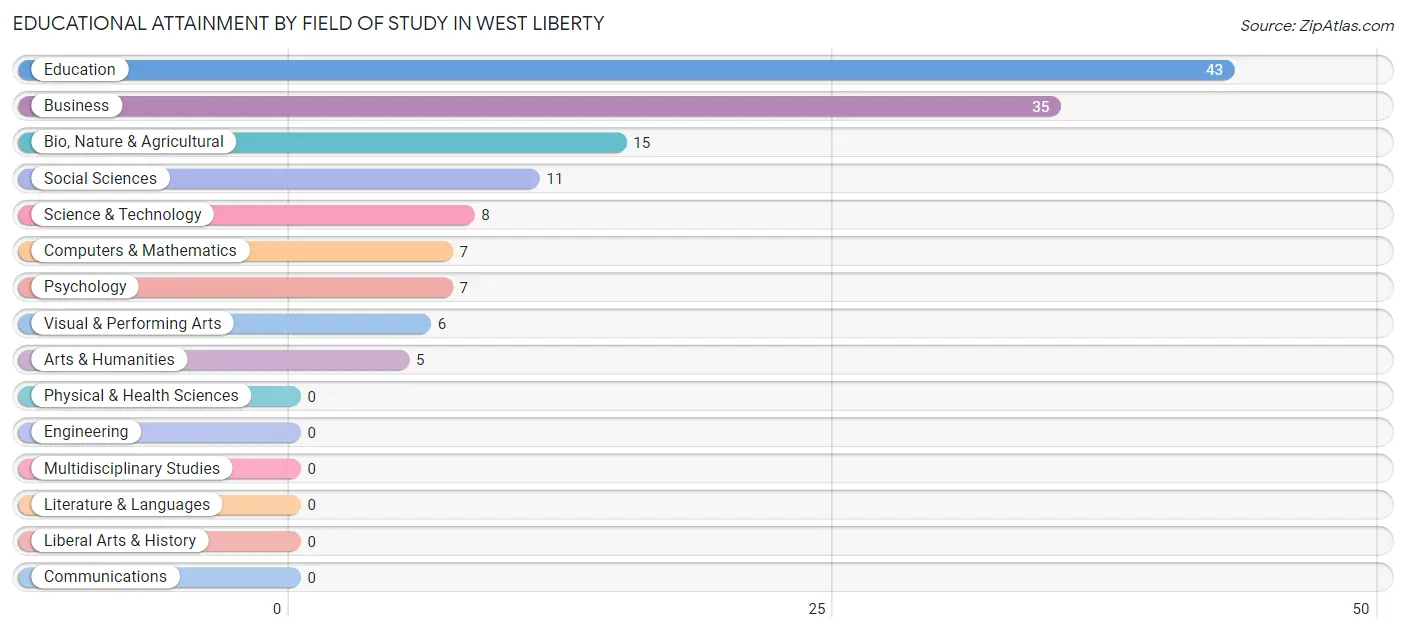
| Field of Study | # Graduates | % Graduates |
| Computers & Mathematics | 7 | 5.1% |
| Bio, Nature & Agricultural | 15 | 11.0% |
| Physical & Health Sciences | 0 | 0.0% |
| Psychology | 7 | 5.1% |
| Social Sciences | 11 | 8.0% |
| Engineering | 0 | 0.0% |
| Multidisciplinary Studies | 0 | 0.0% |
| Science & Technology | 8 | 5.8% |
| Business | 35 | 25.6% |
| Education | 43 | 31.4% |
| Literature & Languages | 0 | 0.0% |
| Liberal Arts & History | 0 | 0.0% |
| Visual & Performing Arts | 6 | 4.4% |
| Communications | 0 | 0.0% |
| Arts & Humanities | 5 | 3.6% |
| Total | 137 | 100.0% |
Transportation & Commute in West Liberty
Vehicle Availability by Sex in West Liberty
The most prevalent vehicle ownership categories in West Liberty are males with 1 vehicle (50, accounting for 35.7%) and females with 1 vehicle (20, making up 26.2%).
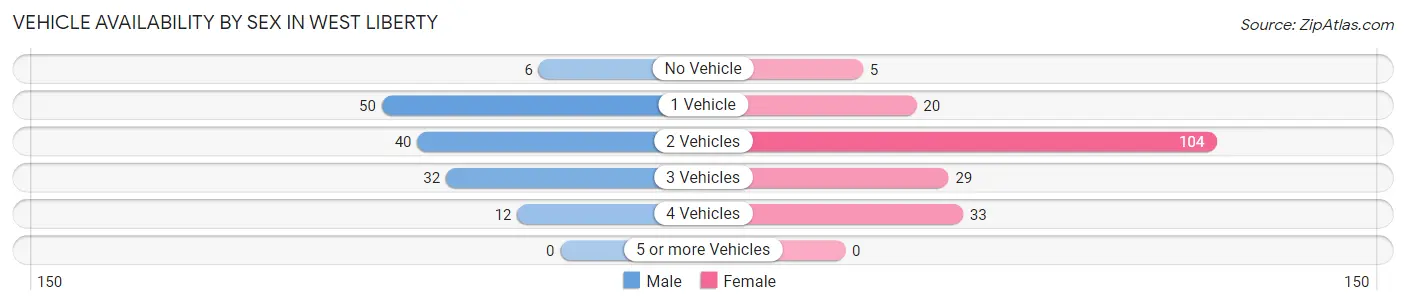
| Vehicles Available | Male | Female |
| No Vehicle | 6 (4.3%) | 5 (2.6%) |
| 1 Vehicle | 50 (35.7%) | 20 (10.5%) |
| 2 Vehicles | 40 (28.6%) | 104 (54.4%) |
| 3 Vehicles | 32 (22.9%) | 29 (15.2%) |
| 4 Vehicles | 12 (8.6%) | 33 (17.3%) |
| 5 or more Vehicles | 0 (0.0%) | 0 (0.0%) |
| Total | 140 (100.0%) | 191 (100.0%) |
Commute Time in West Liberty
The most frequently occuring commute durations in West Liberty are 15 to 19 minutes (134 commuters, 18.9%), 5 to 9 minutes (133 commuters, 18.7%), and less than 5 minutes (93 commuters, 13.1%).
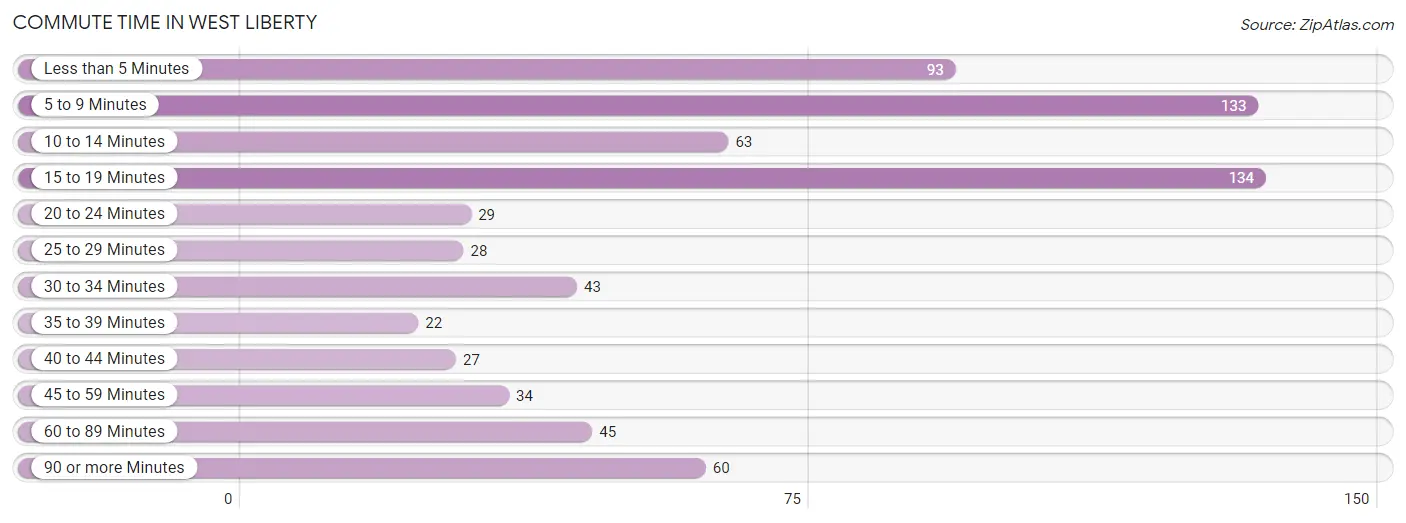
| Commute Time | # Commuters | % Commuters |
| Less than 5 Minutes | 93 | 13.1% |
| 5 to 9 Minutes | 133 | 18.7% |
| 10 to 14 Minutes | 63 | 8.9% |
| 15 to 19 Minutes | 134 | 18.9% |
| 20 to 24 Minutes | 29 | 4.1% |
| 25 to 29 Minutes | 28 | 3.9% |
| 30 to 34 Minutes | 43 | 6.0% |
| 35 to 39 Minutes | 22 | 3.1% |
| 40 to 44 Minutes | 27 | 3.8% |
| 45 to 59 Minutes | 34 | 4.8% |
| 60 to 89 Minutes | 45 | 6.3% |
| 90 or more Minutes | 60 | 8.4% |
Commute Time by Sex in West Liberty
The most common commute times in West Liberty are 5 to 9 minutes (63 commuters, 20.2%) for males and 15 to 19 minutes (82 commuters, 20.5%) for females.
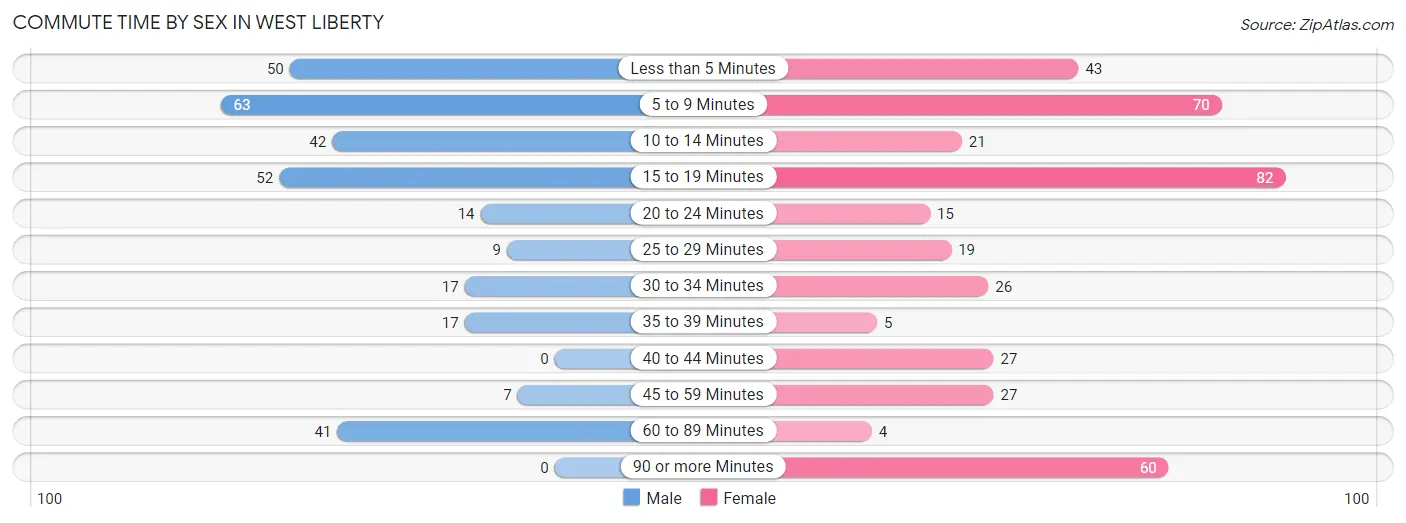
| Commute Time | Male | Female |
| Less than 5 Minutes | 50 (16.0%) | 43 (10.8%) |
| 5 to 9 Minutes | 63 (20.2%) | 70 (17.5%) |
| 10 to 14 Minutes | 42 (13.5%) | 21 (5.3%) |
| 15 to 19 Minutes | 52 (16.7%) | 82 (20.5%) |
| 20 to 24 Minutes | 14 (4.5%) | 15 (3.8%) |
| 25 to 29 Minutes | 9 (2.9%) | 19 (4.8%) |
| 30 to 34 Minutes | 17 (5.4%) | 26 (6.5%) |
| 35 to 39 Minutes | 17 (5.4%) | 5 (1.3%) |
| 40 to 44 Minutes | 0 (0.0%) | 27 (6.8%) |
| 45 to 59 Minutes | 7 (2.2%) | 27 (6.8%) |
| 60 to 89 Minutes | 41 (13.1%) | 4 (1.0%) |
| 90 or more Minutes | 0 (0.0%) | 60 (15.0%) |
Time of Departure to Work by Sex in West Liberty
The most frequent times of departure to work in West Liberty are 4:00 PM to 11:59 PM (62, 19.9%) for males and 7:30 AM to 7:59 AM (120, 30.1%) for females.
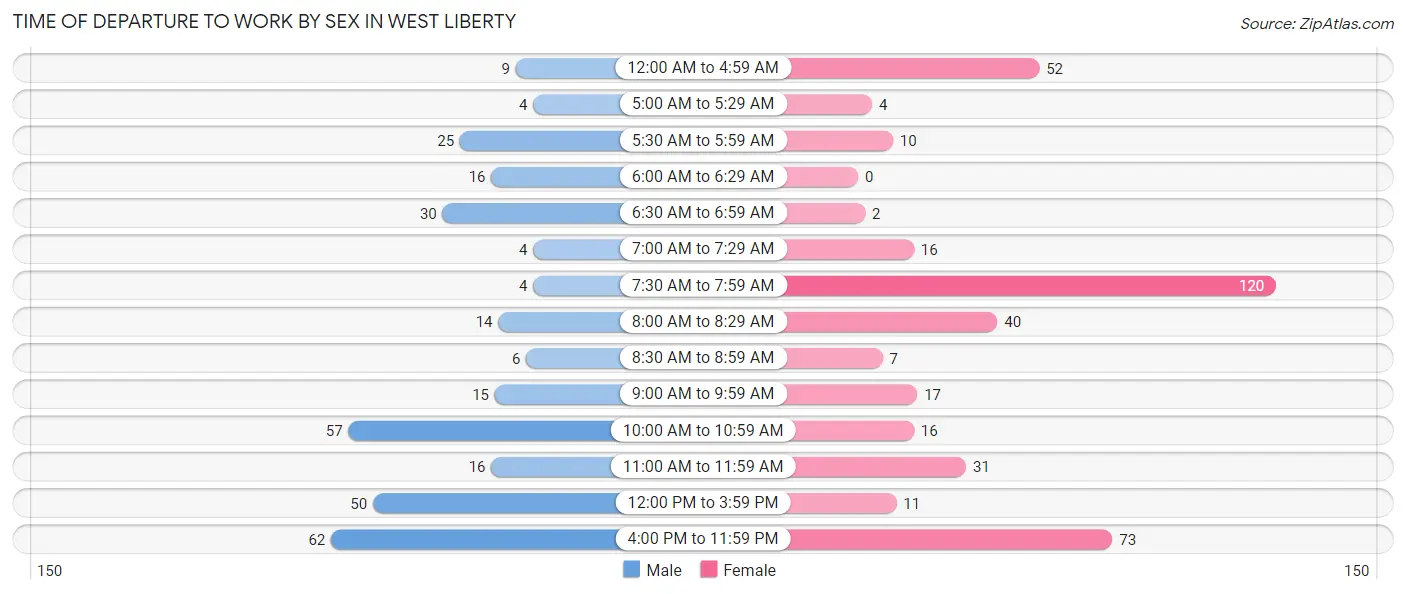
| Time of Departure | Male | Female |
| 12:00 AM to 4:59 AM | 9 (2.9%) | 52 (13.0%) |
| 5:00 AM to 5:29 AM | 4 (1.3%) | 4 (1.0%) |
| 5:30 AM to 5:59 AM | 25 (8.0%) | 10 (2.5%) |
| 6:00 AM to 6:29 AM | 16 (5.1%) | 0 (0.0%) |
| 6:30 AM to 6:59 AM | 30 (9.6%) | 2 (0.5%) |
| 7:00 AM to 7:29 AM | 4 (1.3%) | 16 (4.0%) |
| 7:30 AM to 7:59 AM | 4 (1.3%) | 120 (30.1%) |
| 8:00 AM to 8:29 AM | 14 (4.5%) | 40 (10.0%) |
| 8:30 AM to 8:59 AM | 6 (1.9%) | 7 (1.8%) |
| 9:00 AM to 9:59 AM | 15 (4.8%) | 17 (4.3%) |
| 10:00 AM to 10:59 AM | 57 (18.3%) | 16 (4.0%) |
| 11:00 AM to 11:59 AM | 16 (5.1%) | 31 (7.8%) |
| 12:00 PM to 3:59 PM | 50 (16.0%) | 11 (2.8%) |
| 4:00 PM to 11:59 PM | 62 (19.9%) | 73 (18.3%) |
| Total | 312 (100.0%) | 399 (100.0%) |
Housing Occupancy in West Liberty
Occupancy by Ownership in West Liberty
Of the total 273 dwellings in West Liberty, owner-occupied units account for 153 (56.0%), while renter-occupied units make up 120 (44.0%).
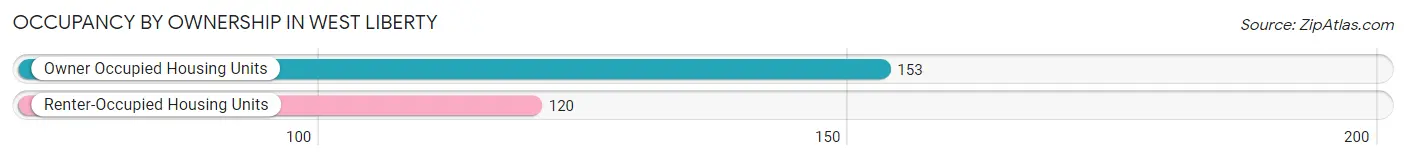
| Occupancy | # Housing Units | % Housing Units |
| Owner Occupied Housing Units | 153 | 56.0% |
| Renter-Occupied Housing Units | 120 | 44.0% |
| Total Occupied Housing Units | 273 | 100.0% |
Occupancy by Household Size in West Liberty
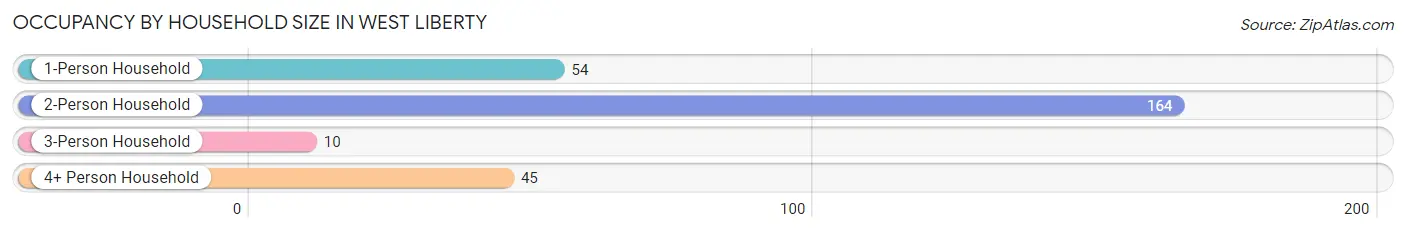
| Household Size | # Housing Units | % Housing Units |
| 1-Person Household | 54 | 19.8% |
| 2-Person Household | 164 | 60.1% |
| 3-Person Household | 10 | 3.7% |
| 4+ Person Household | 45 | 16.5% |
| Total Housing Units | 273 | 100.0% |
Occupancy by Ownership by Household Size in West Liberty
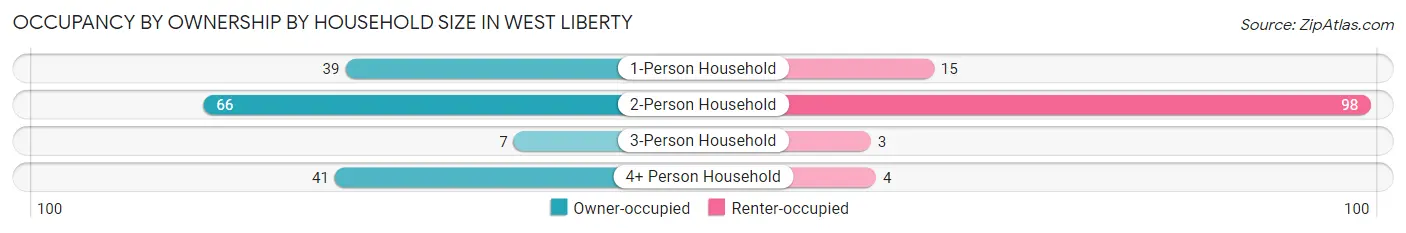
| Household Size | Owner-occupied | Renter-occupied |
| 1-Person Household | 39 (72.2%) | 15 (27.8%) |
| 2-Person Household | 66 (40.2%) | 98 (59.8%) |
| 3-Person Household | 7 (70.0%) | 3 (30.0%) |
| 4+ Person Household | 41 (91.1%) | 4 (8.9%) |
| Total Housing Units | 153 (56.0%) | 120 (44.0%) |
Occupancy by Educational Attainment in West Liberty
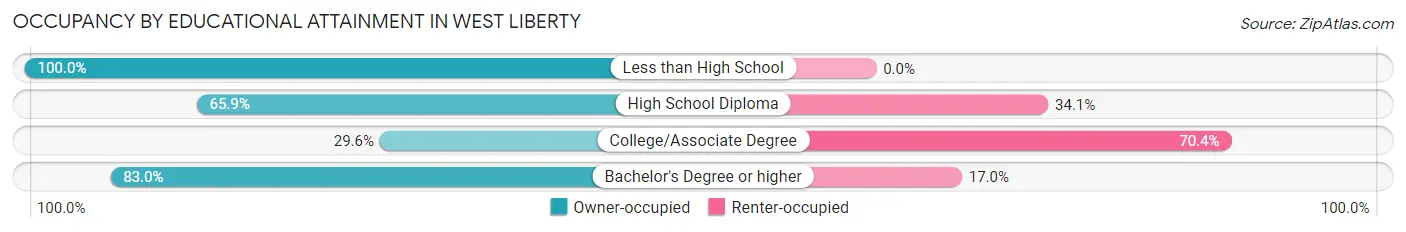
| Household Size | Owner-occupied | Renter-occupied |
| Less than High School | 17 (100.0%) | 0 (0.0%) |
| High School Diploma | 58 (65.9%) | 30 (34.1%) |
| College/Associate Degree | 34 (29.6%) | 81 (70.4%) |
| Bachelor's Degree or higher | 44 (83.0%) | 9 (17.0%) |
Occupancy by Age of Householder in West Liberty
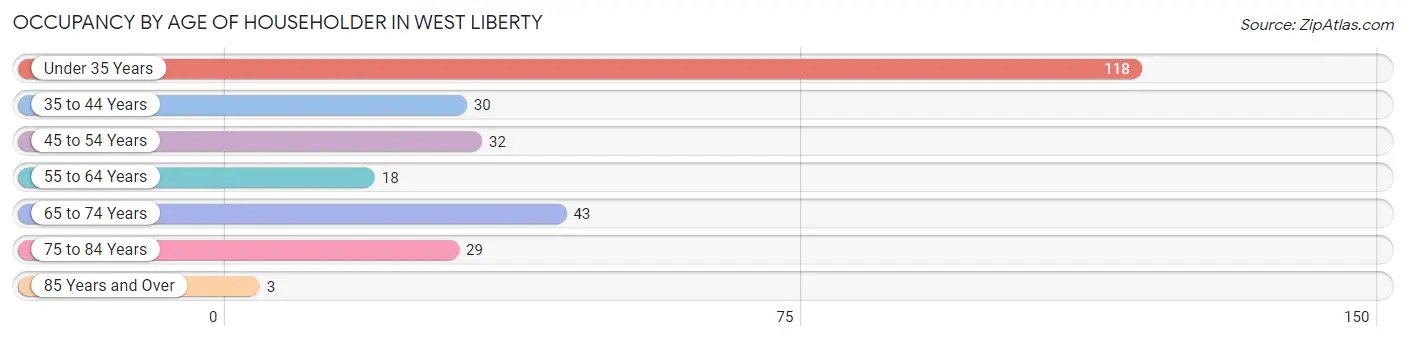
| Age Bracket | # Households | % Households |
| Under 35 Years | 118 | 43.2% |
| 35 to 44 Years | 30 | 11.0% |
| 45 to 54 Years | 32 | 11.7% |
| 55 to 64 Years | 18 | 6.6% |
| 65 to 74 Years | 43 | 15.8% |
| 75 to 84 Years | 29 | 10.6% |
| 85 Years and Over | 3 | 1.1% |
| Total | 273 | 100.0% |
Housing Finances in West Liberty
Median Income by Occupancy in West Liberty
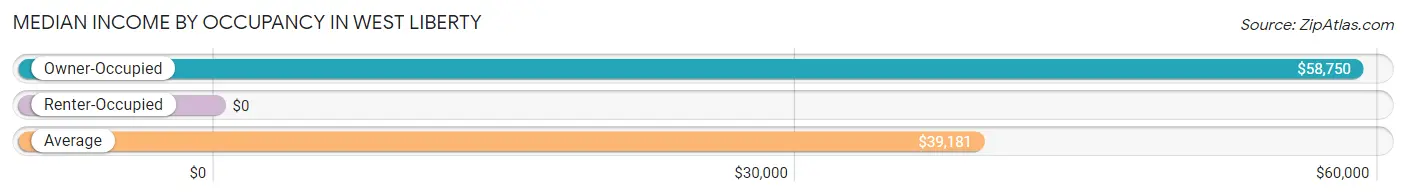
| Occupancy Type | # Households | Median Income |
| Owner-Occupied | 153 (56.0%) | $58,750 |
| Renter-Occupied | 120 (44.0%) | $0 |
| Average | 273 (100.0%) | $39,181 |
Occupancy by Householder Income Bracket in West Liberty
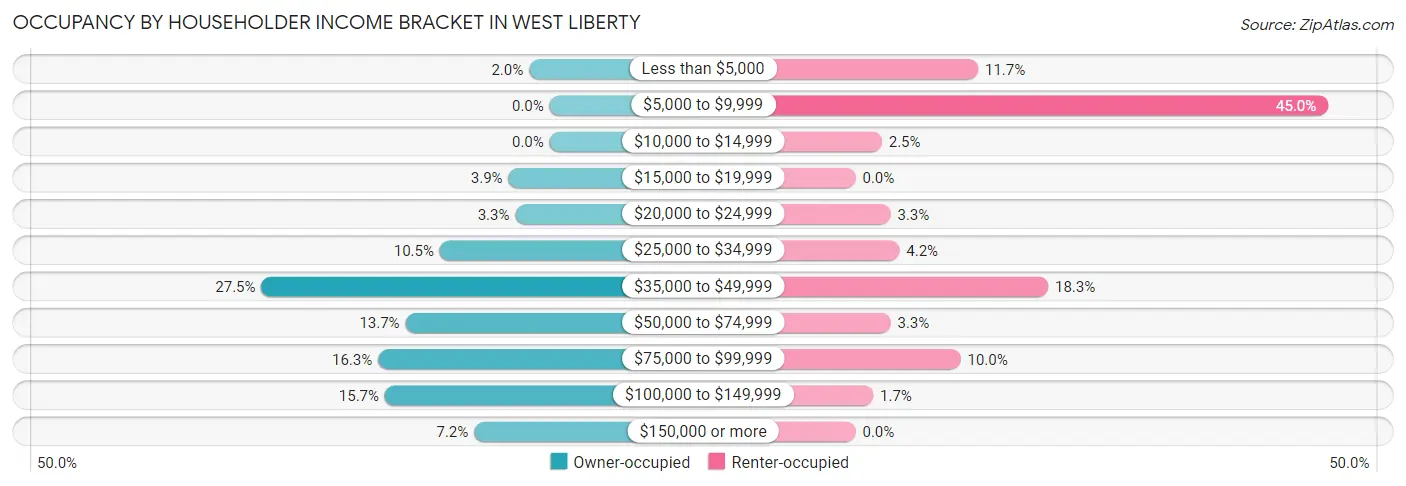
| Income Bracket | Owner-occupied | Renter-occupied |
| Less than $5,000 | 3 (2.0%) | 14 (11.7%) |
| $5,000 to $9,999 | 0 (0.0%) | 54 (45.0%) |
| $10,000 to $14,999 | 0 (0.0%) | 3 (2.5%) |
| $15,000 to $19,999 | 6 (3.9%) | 0 (0.0%) |
| $20,000 to $24,999 | 5 (3.3%) | 4 (3.3%) |
| $25,000 to $34,999 | 16 (10.5%) | 5 (4.2%) |
| $35,000 to $49,999 | 42 (27.5%) | 22 (18.3%) |
| $50,000 to $74,999 | 21 (13.7%) | 4 (3.3%) |
| $75,000 to $99,999 | 25 (16.3%) | 12 (10.0%) |
| $100,000 to $149,999 | 24 (15.7%) | 2 (1.7%) |
| $150,000 or more | 11 (7.2%) | 0 (0.0%) |
| Total | 153 (100.0%) | 120 (100.0%) |
Monthly Housing Cost Tiers in West Liberty
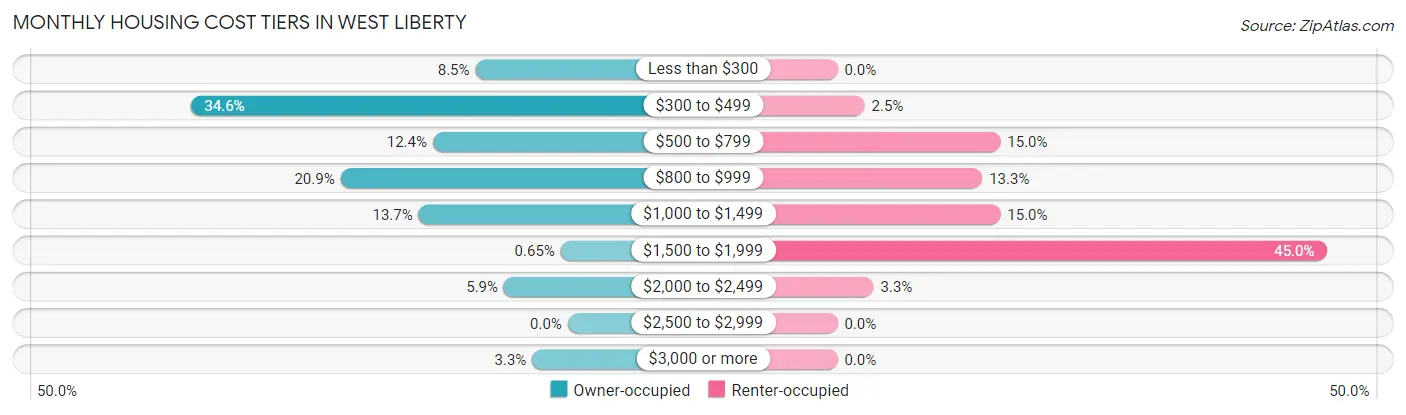
| Monthly Cost | Owner-occupied | Renter-occupied |
| Less than $300 | 13 (8.5%) | 0 (0.0%) |
| $300 to $499 | 53 (34.6%) | 3 (2.5%) |
| $500 to $799 | 19 (12.4%) | 18 (15.0%) |
| $800 to $999 | 32 (20.9%) | 16 (13.3%) |
| $1,000 to $1,499 | 21 (13.7%) | 18 (15.0%) |
| $1,500 to $1,999 | 1 (0.6%) | 54 (45.0%) |
| $2,000 to $2,499 | 9 (5.9%) | 4 (3.3%) |
| $2,500 to $2,999 | 0 (0.0%) | 0 (0.0%) |
| $3,000 or more | 5 (3.3%) | 0 (0.0%) |
| Total | 153 (100.0%) | 120 (100.0%) |
Physical Housing Characteristics in West Liberty
Housing Structures in West Liberty
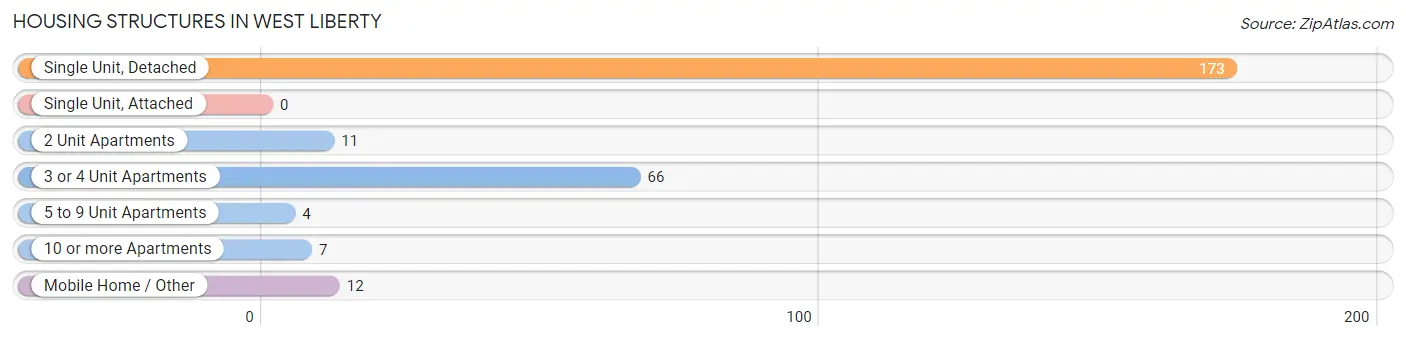
| Structure Type | # Housing Units | % Housing Units |
| Single Unit, Detached | 173 | 63.4% |
| Single Unit, Attached | 0 | 0.0% |
| 2 Unit Apartments | 11 | 4.0% |
| 3 or 4 Unit Apartments | 66 | 24.2% |
| 5 to 9 Unit Apartments | 4 | 1.5% |
| 10 or more Apartments | 7 | 2.6% |
| Mobile Home / Other | 12 | 4.4% |
| Total | 273 | 100.0% |
Housing Structures by Occupancy in West Liberty
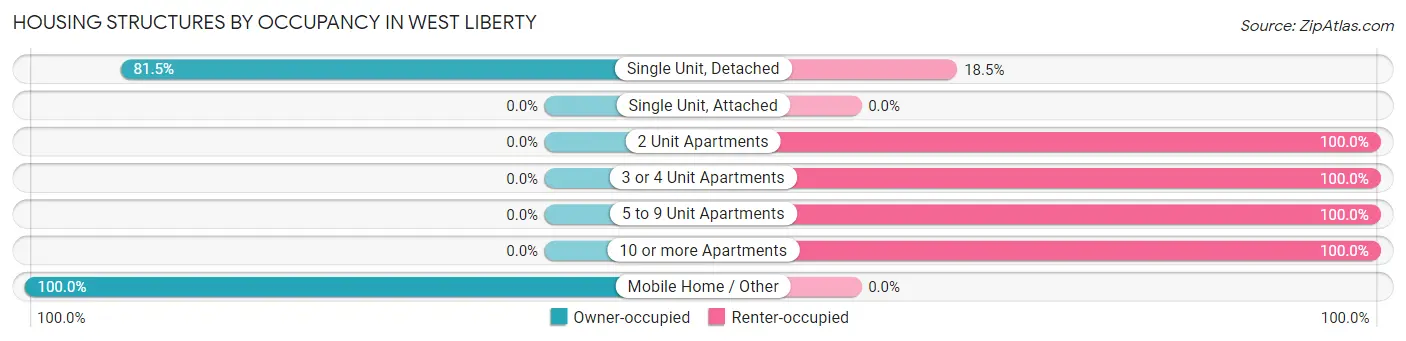
| Structure Type | Owner-occupied | Renter-occupied |
| Single Unit, Detached | 141 (81.5%) | 32 (18.5%) |
| Single Unit, Attached | 0 (0.0%) | 0 (0.0%) |
| 2 Unit Apartments | 0 (0.0%) | 11 (100.0%) |
| 3 or 4 Unit Apartments | 0 (0.0%) | 66 (100.0%) |
| 5 to 9 Unit Apartments | 0 (0.0%) | 4 (100.0%) |
| 10 or more Apartments | 0 (0.0%) | 7 (100.0%) |
| Mobile Home / Other | 12 (100.0%) | 0 (0.0%) |
| Total | 153 (56.0%) | 120 (44.0%) |
Housing Structures by Number of Rooms in West Liberty
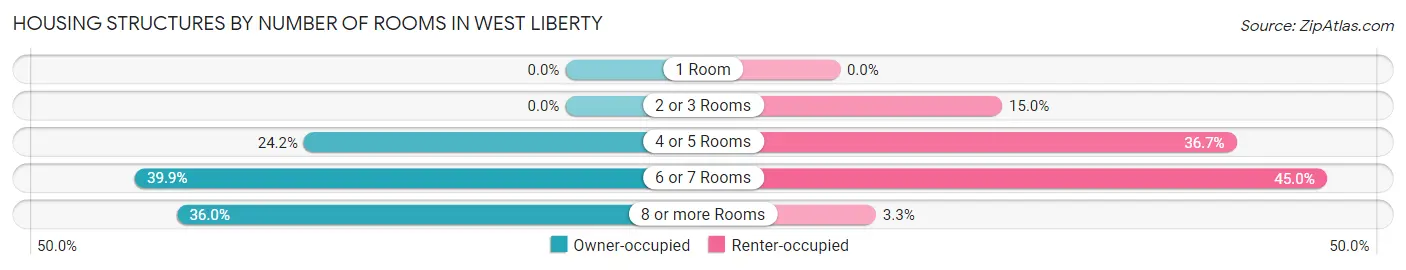
| Number of Rooms | Owner-occupied | Renter-occupied |
| 1 Room | 0 (0.0%) | 0 (0.0%) |
| 2 or 3 Rooms | 0 (0.0%) | 18 (15.0%) |
| 4 or 5 Rooms | 37 (24.2%) | 44 (36.7%) |
| 6 or 7 Rooms | 61 (39.9%) | 54 (45.0%) |
| 8 or more Rooms | 55 (35.9%) | 4 (3.3%) |
| Total | 153 (100.0%) | 120 (100.0%) |
Housing Structure by Heating Type in West Liberty
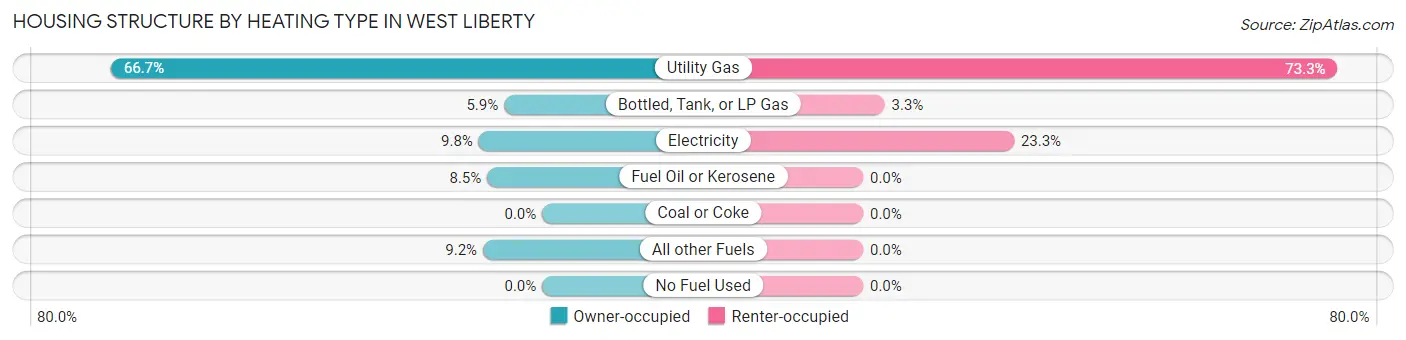
| Heating Type | Owner-occupied | Renter-occupied |
| Utility Gas | 102 (66.7%) | 88 (73.3%) |
| Bottled, Tank, or LP Gas | 9 (5.9%) | 4 (3.3%) |
| Electricity | 15 (9.8%) | 28 (23.3%) |
| Fuel Oil or Kerosene | 13 (8.5%) | 0 (0.0%) |
| Coal or Coke | 0 (0.0%) | 0 (0.0%) |
| All other Fuels | 14 (9.1%) | 0 (0.0%) |
| No Fuel Used | 0 (0.0%) | 0 (0.0%) |
| Total | 153 (100.0%) | 120 (100.0%) |
Household Vehicle Usage in West Liberty
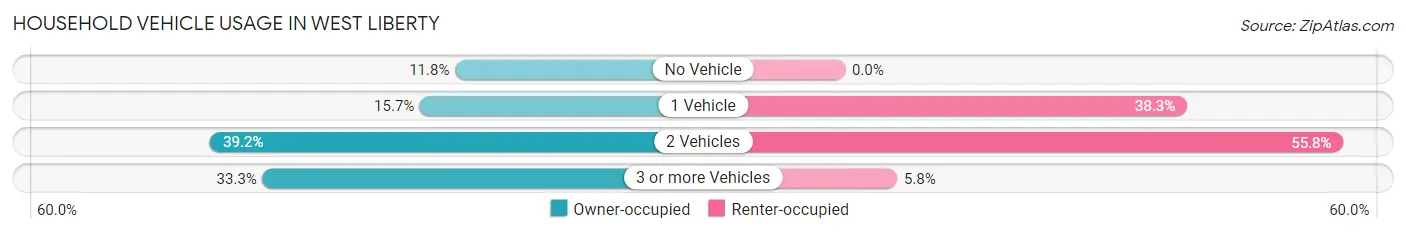
| Vehicles per Household | Owner-occupied | Renter-occupied |
| No Vehicle | 18 (11.8%) | 0 (0.0%) |
| 1 Vehicle | 24 (15.7%) | 46 (38.3%) |
| 2 Vehicles | 60 (39.2%) | 67 (55.8%) |
| 3 or more Vehicles | 51 (33.3%) | 7 (5.8%) |
| Total | 153 (100.0%) | 120 (100.0%) |
Real Estate & Mortgages in West Liberty
Real Estate and Mortgage Overview in West Liberty
| Characteristic | Without Mortgage | With Mortgage |
| Housing Units | 91 | 62 |
| Median Property Value | $97,300 | $141,700 |
| Median Household Income | $43,194 | $11 |
| Monthly Housing Costs | $431 | $5 |
| Real Estate Taxes | $683 | $7 |
Property Value by Mortgage Status in West Liberty
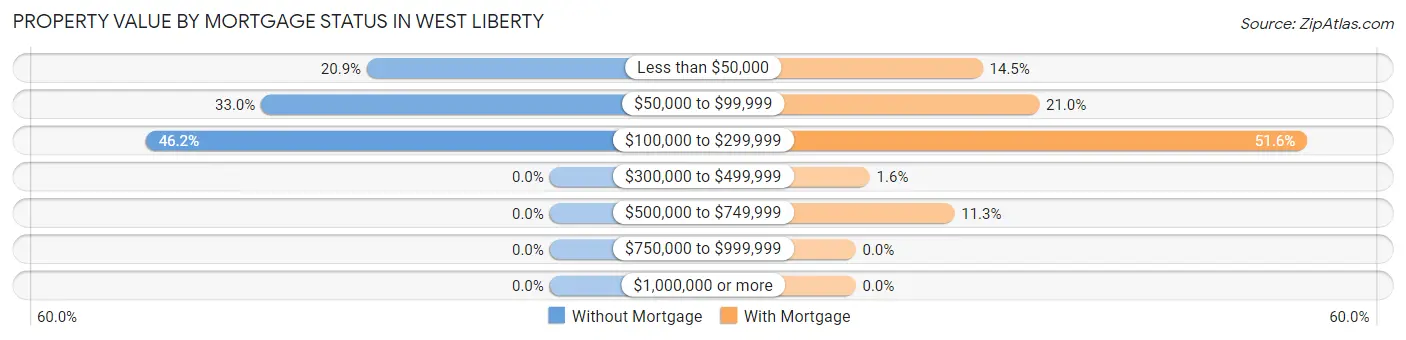
| Property Value | Without Mortgage | With Mortgage |
| Less than $50,000 | 19 (20.9%) | 9 (14.5%) |
| $50,000 to $99,999 | 30 (33.0%) | 13 (21.0%) |
| $100,000 to $299,999 | 42 (46.2%) | 32 (51.6%) |
| $300,000 to $499,999 | 0 (0.0%) | 1 (1.6%) |
| $500,000 to $749,999 | 0 (0.0%) | 7 (11.3%) |
| $750,000 to $999,999 | 0 (0.0%) | 0 (0.0%) |
| $1,000,000 or more | 0 (0.0%) | 0 (0.0%) |
| Total | 91 (100.0%) | 62 (100.0%) |
Household Income by Mortgage Status in West Liberty
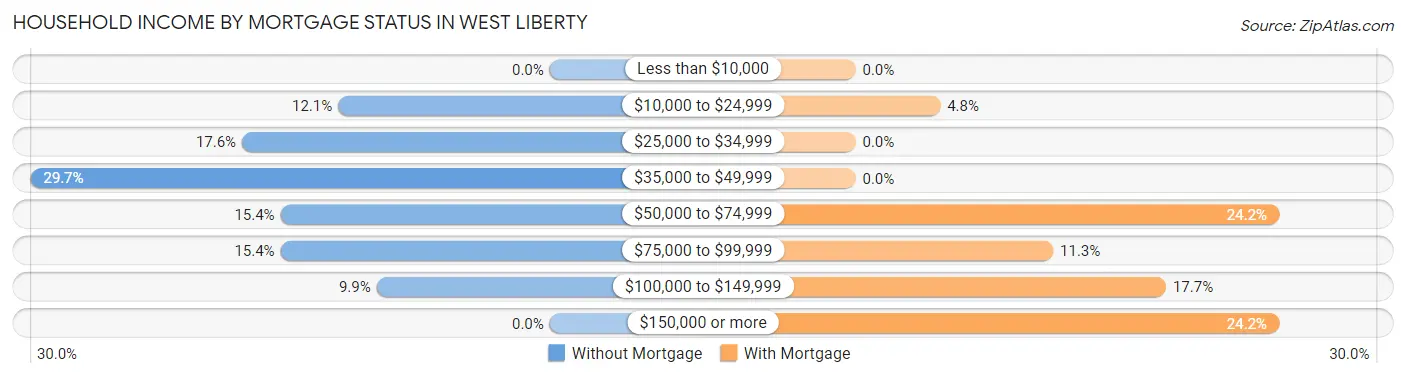
| Household Income | Without Mortgage | With Mortgage |
| Less than $10,000 | 0 (0.0%) | 0 (0.0%) |
| $10,000 to $24,999 | 11 (12.1%) | 3 (4.8%) |
| $25,000 to $34,999 | 16 (17.6%) | 0 (0.0%) |
| $35,000 to $49,999 | 27 (29.7%) | 0 (0.0%) |
| $50,000 to $74,999 | 14 (15.4%) | 15 (24.2%) |
| $75,000 to $99,999 | 14 (15.4%) | 7 (11.3%) |
| $100,000 to $149,999 | 9 (9.9%) | 11 (17.7%) |
| $150,000 or more | 0 (0.0%) | 15 (24.2%) |
| Total | 91 (100.0%) | 62 (100.0%) |
Property Value to Household Income Ratio in West Liberty
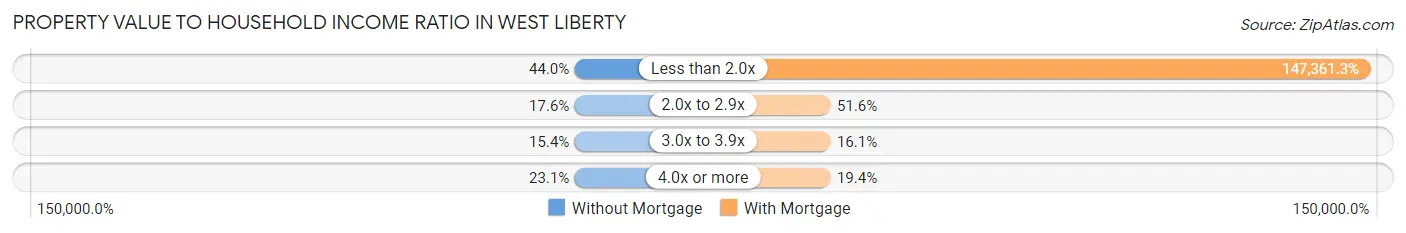
| Value-to-Income Ratio | Without Mortgage | With Mortgage |
| Less than 2.0x | 40 (44.0%) | 91,364 (147,361.3%) |
| 2.0x to 2.9x | 16 (17.6%) | 32 (51.6%) |
| 3.0x to 3.9x | 14 (15.4%) | 10 (16.1%) |
| 4.0x or more | 21 (23.1%) | 12 (19.4%) |
| Total | 91 (100.0%) | 62 (100.0%) |
Real Estate Taxes by Mortgage Status in West Liberty
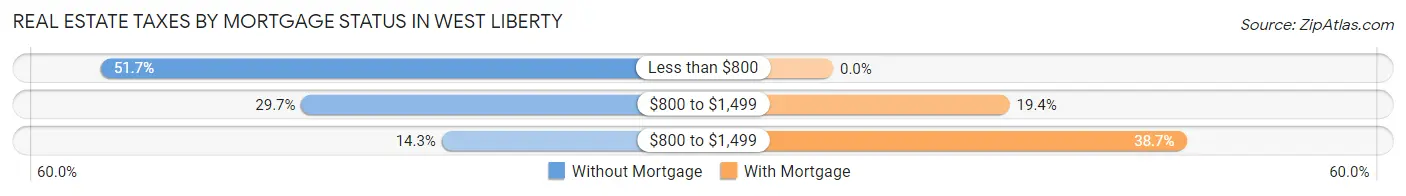
| Property Taxes | Without Mortgage | With Mortgage |
| Less than $800 | 47 (51.6%) | 0 (0.0%) |
| $800 to $1,499 | 27 (29.7%) | 12 (19.4%) |
| $800 to $1,499 | 13 (14.3%) | 24 (38.7%) |
| Total | 91 (100.0%) | 62 (100.0%) |
Health & Disability in West Liberty
Health Insurance Coverage by Age in West Liberty
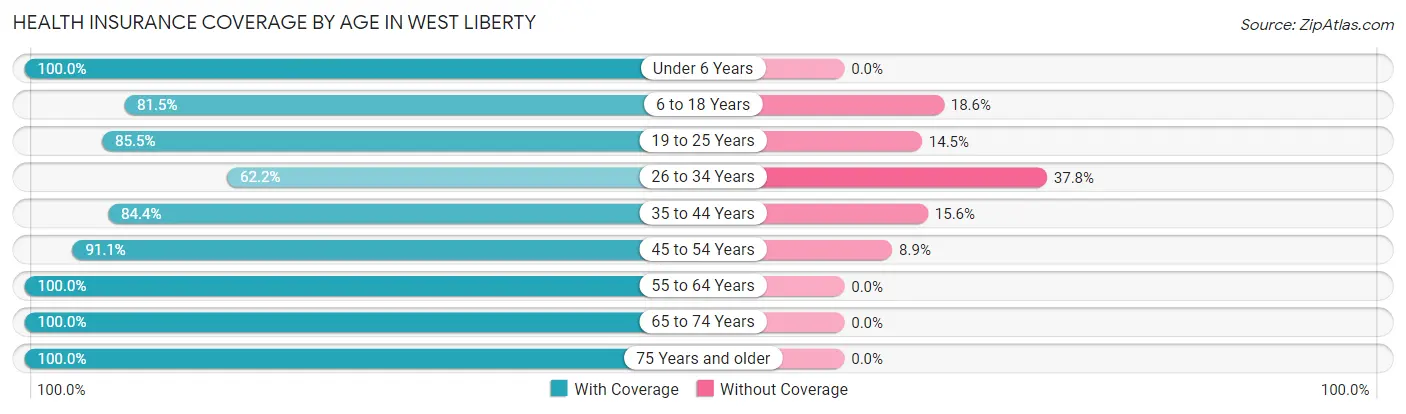
| Age Bracket | With Coverage | Without Coverage |
| Under 6 Years | 33 (100.0%) | 0 (0.0%) |
| 6 to 18 Years | 281 (81.5%) | 64 (18.5%) |
| 19 to 25 Years | 905 (85.5%) | 153 (14.5%) |
| 26 to 34 Years | 28 (62.2%) | 17 (37.8%) |
| 35 to 44 Years | 65 (84.4%) | 12 (15.6%) |
| 45 to 54 Years | 51 (91.1%) | 5 (8.9%) |
| 55 to 64 Years | 42 (100.0%) | 0 (0.0%) |
| 65 to 74 Years | 75 (100.0%) | 0 (0.0%) |
| 75 Years and older | 33 (100.0%) | 0 (0.0%) |
| Total | 1,513 (85.8%) | 251 (14.2%) |
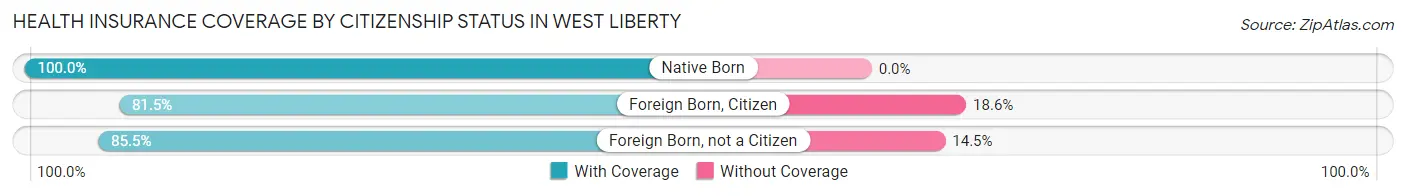
Health Insurance Coverage by Citizenship Status in West Liberty
| Citizenship Status | With Coverage | Without Coverage |
| Native Born | 33 (100.0%) | 0 (0.0%) |
| Foreign Born, Citizen | 281 (81.5%) | 64 (18.5%) |
| Foreign Born, not a Citizen | 905 (85.5%) | 153 (14.5%) |
Health Insurance Coverage by Household Income in West Liberty
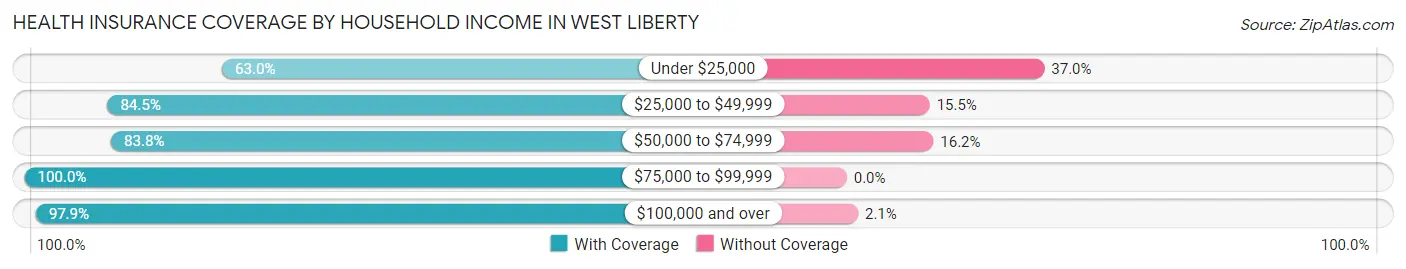
| Household Income | With Coverage | Without Coverage |
| Under $25,000 | 131 (63.0%) | 77 (37.0%) |
| $25,000 to $49,999 | 136 (84.5%) | 25 (15.5%) |
| $50,000 to $74,999 | 62 (83.8%) | 12 (16.2%) |
| $75,000 to $99,999 | 107 (100.0%) | 0 (0.0%) |
| $100,000 and over | 139 (97.9%) | 3 (2.1%) |
Public vs Private Health Insurance Coverage by Age in West Liberty
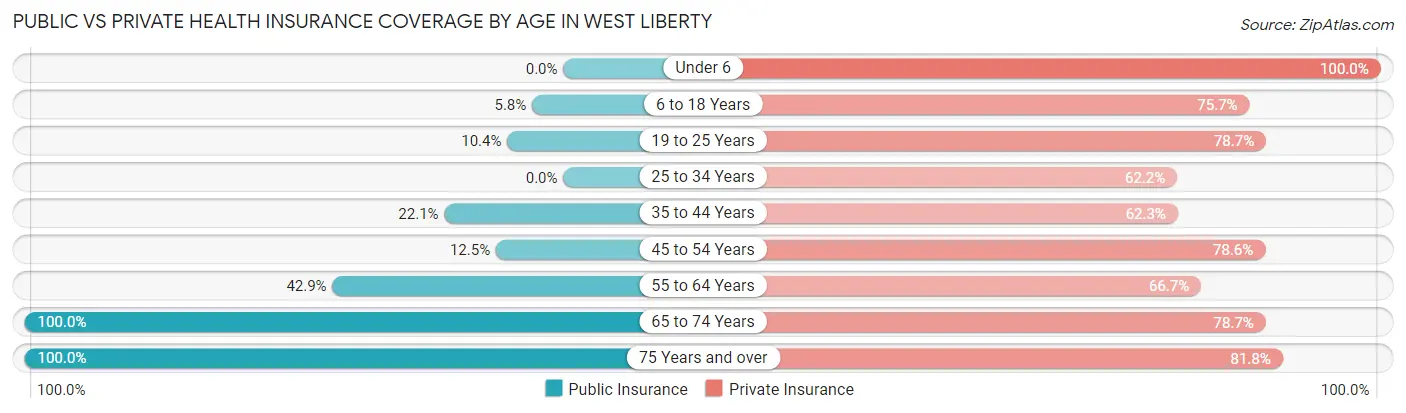
| Age Bracket | Public Insurance | Private Insurance |
| Under 6 | 0 (0.0%) | 33 (100.0%) |
| 6 to 18 Years | 20 (5.8%) | 261 (75.6%) |
| 19 to 25 Years | 110 (10.4%) | 833 (78.7%) |
| 25 to 34 Years | 0 (0.0%) | 28 (62.2%) |
| 35 to 44 Years | 17 (22.1%) | 48 (62.3%) |
| 45 to 54 Years | 7 (12.5%) | 44 (78.6%) |
| 55 to 64 Years | 18 (42.9%) | 28 (66.7%) |
| 65 to 74 Years | 75 (100.0%) | 59 (78.7%) |
| 75 Years and over | 33 (100.0%) | 27 (81.8%) |
| Total | 280 (15.9%) | 1,361 (77.1%) |
Disability Status by Sex by Age in West Liberty
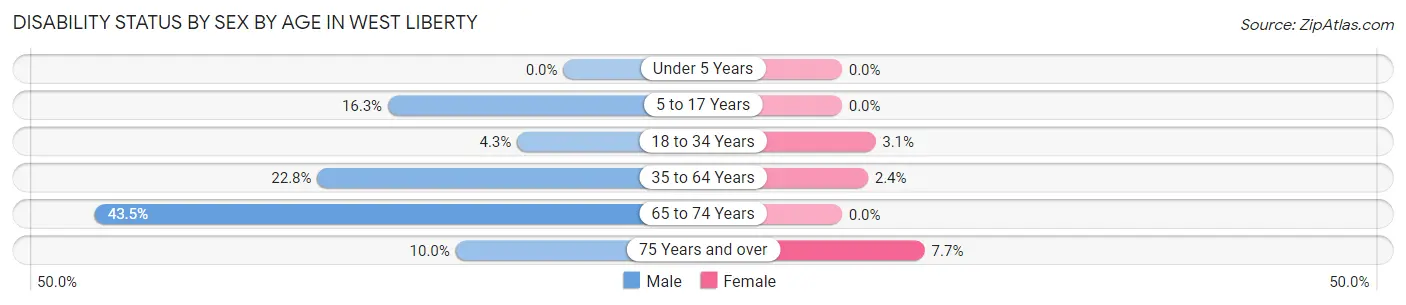
| Age Bracket | Male | Female |
| Under 5 Years | 0 (0.0%) | 0 (0.0%) |
| 5 to 17 Years | 7 (16.3%) | 0 (0.0%) |
| 18 to 34 Years | 21 (4.3%) | 27 (3.1%) |
| 35 to 64 Years | 21 (22.8%) | 2 (2.4%) |
| 65 to 74 Years | 10 (43.5%) | 0 (0.0%) |
| 75 Years and over | 2 (10.0%) | 1 (7.7%) |
Disability Class by Sex by Age in West Liberty
Disability Class: Hearing Difficulty
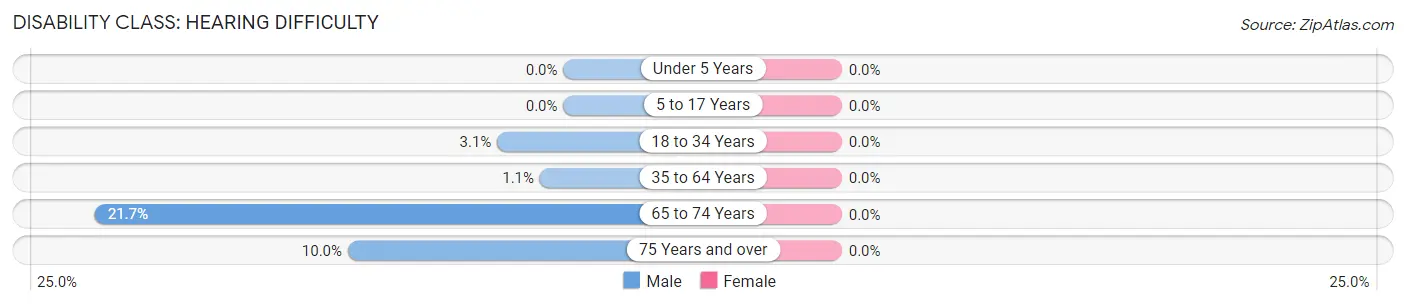
| Age Bracket | Male | Female |
| Under 5 Years | 0 (0.0%) | 0 (0.0%) |
| 5 to 17 Years | 0 (0.0%) | 0 (0.0%) |
| 18 to 34 Years | 15 (3.1%) | 0 (0.0%) |
| 35 to 64 Years | 1 (1.1%) | 0 (0.0%) |
| 65 to 74 Years | 5 (21.7%) | 0 (0.0%) |
| 75 Years and over | 2 (10.0%) | 0 (0.0%) |
Disability Class: Vision Difficulty
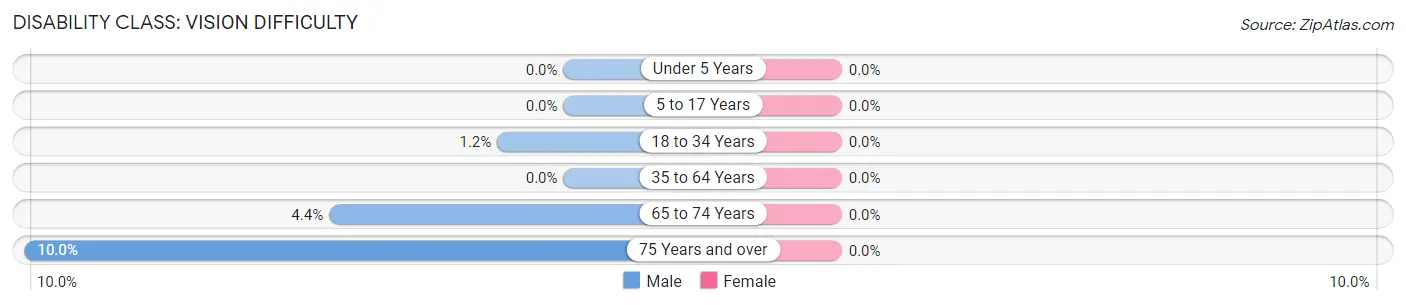
| Age Bracket | Male | Female |
| Under 5 Years | 0 (0.0%) | 0 (0.0%) |
| 5 to 17 Years | 0 (0.0%) | 0 (0.0%) |
| 18 to 34 Years | 6 (1.2%) | 0 (0.0%) |
| 35 to 64 Years | 0 (0.0%) | 0 (0.0%) |
| 65 to 74 Years | 1 (4.3%) | 0 (0.0%) |
| 75 Years and over | 2 (10.0%) | 0 (0.0%) |
Disability Class: Cognitive Difficulty
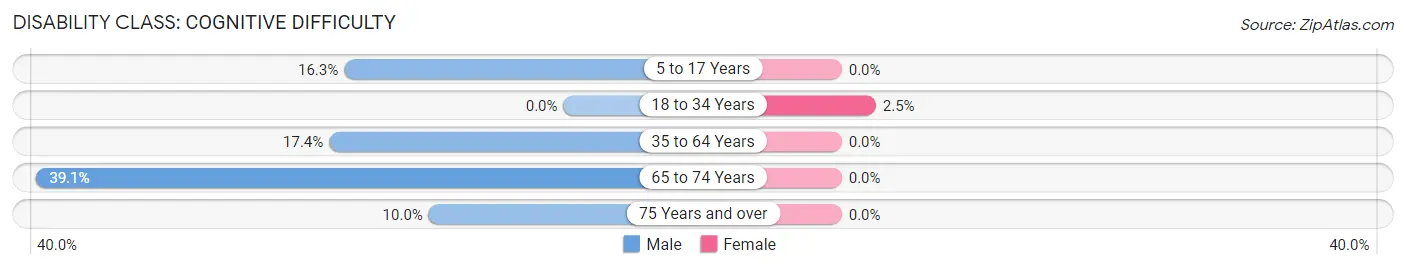
| Age Bracket | Male | Female |
| 5 to 17 Years | 7 (16.3%) | 0 (0.0%) |
| 18 to 34 Years | 0 (0.0%) | 22 (2.5%) |
| 35 to 64 Years | 16 (17.4%) | 0 (0.0%) |
| 65 to 74 Years | 9 (39.1%) | 0 (0.0%) |
| 75 Years and over | 2 (10.0%) | 0 (0.0%) |
Disability Class: Ambulatory Difficulty
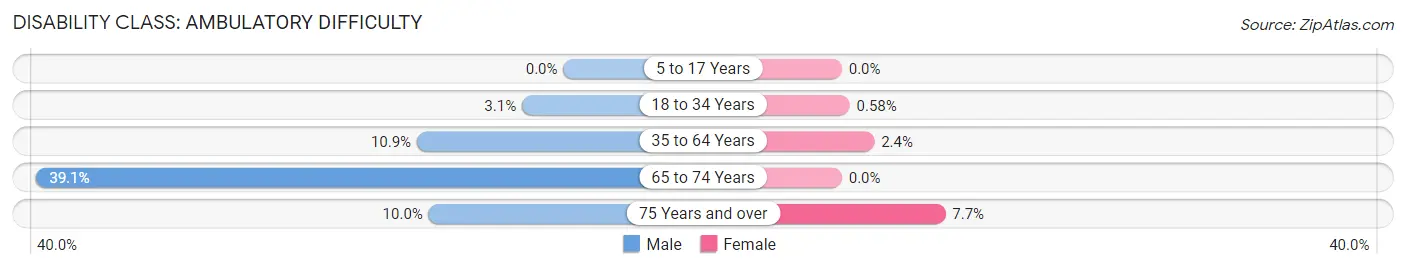
| Age Bracket | Male | Female |
| 5 to 17 Years | 0 (0.0%) | 0 (0.0%) |
| 18 to 34 Years | 15 (3.1%) | 5 (0.6%) |
| 35 to 64 Years | 10 (10.9%) | 2 (2.4%) |
| 65 to 74 Years | 9 (39.1%) | 0 (0.0%) |
| 75 Years and over | 2 (10.0%) | 1 (7.7%) |
Disability Class: Self-Care Difficulty
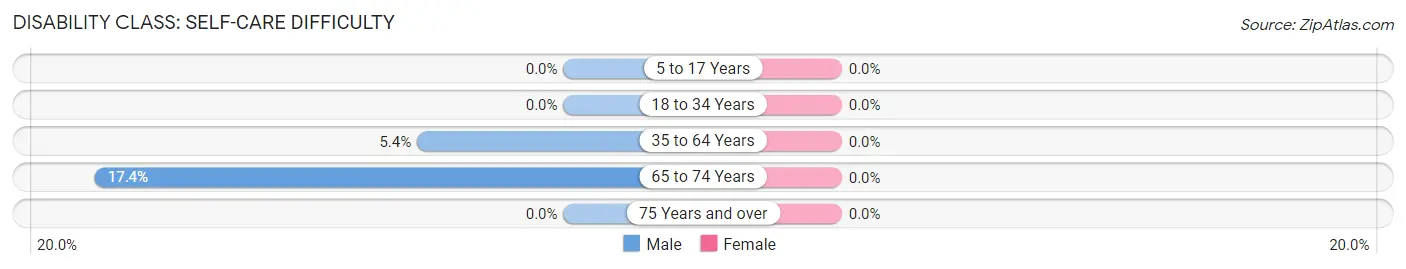
| Age Bracket | Male | Female |
| 5 to 17 Years | 0 (0.0%) | 0 (0.0%) |
| 18 to 34 Years | 0 (0.0%) | 0 (0.0%) |
| 35 to 64 Years | 5 (5.4%) | 0 (0.0%) |
| 65 to 74 Years | 4 (17.4%) | 0 (0.0%) |
| 75 Years and over | 0 (0.0%) | 0 (0.0%) |
Technology Access in West Liberty
Computing Device Access in West Liberty
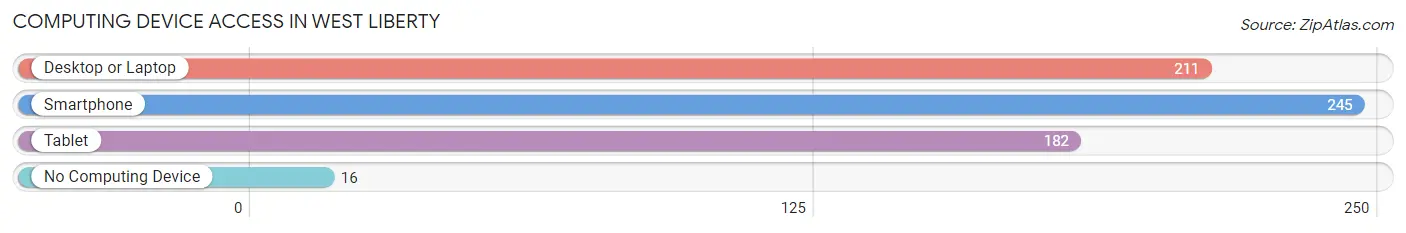
| Device Type | # Households | % Households |
| Desktop or Laptop | 211 | 77.3% |
| Smartphone | 245 | 89.7% |
| Tablet | 182 | 66.7% |
| No Computing Device | 16 | 5.9% |
| Total | 273 | 100.0% |
Internet Access in West Liberty
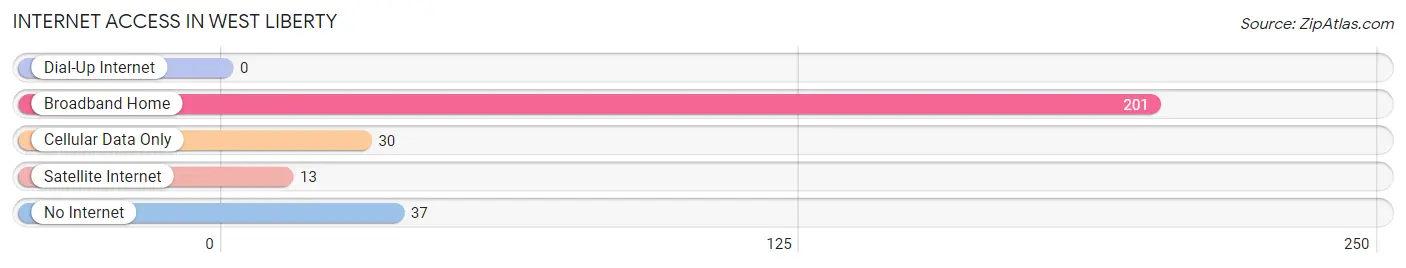
| Internet Type | # Households | % Households |
| Dial-Up Internet | 0 | 0.0% |
| Broadband Home | 201 | 73.6% |
| Cellular Data Only | 30 | 11.0% |
| Satellite Internet | 13 | 4.8% |
| No Internet | 37 | 13.6% |
| Total | 273 | 100.0% |
West Liberty Summary
West Liberty, West Virginia is a small town located in the northern part of the state, just outside of Wheeling. It is a part of Ohio County and is home to approximately 4,000 people. The town was founded in 1837 and has a rich history that is still evident today.
Geography
West Liberty is located in the northern part of West Virginia, just outside of Wheeling. It is situated in the Ohio Valley, which is a region of the Appalachian Mountains. The town is located on the banks of the Ohio River and is surrounded by rolling hills and forests. The climate in West Liberty is humid continental, with hot summers and cold winters.
Economy
West Liberty’s economy is largely based on agriculture and manufacturing. The town is home to several small businesses, including a grocery store, a hardware store, and a few restaurants. The town also has a few larger employers, such as a steel mill and a paper mill. The town is also home to West Liberty University, which provides a variety of educational opportunities for students.
Demographics
As of the 2010 census, West Liberty had a population of 4,042 people. The racial makeup of the town was 95.3% White, 1.3% African American, 0.3% Native American, 0.7% Asian, 0.1% Pacific Islander, and 1.3% from other races. The median household income was $35,938, and the median family income was $45,938.
History
West Liberty was founded in 1837 by a group of settlers from Pennsylvania. The town was named after the Liberty Party, which was a political party that was active in the area at the time. The town quickly grew and became a center of commerce and industry. In the late 19th century, the town was home to several factories, including a steel mill and a paper mill.
West Liberty was also home to a number of educational institutions, including West Liberty Academy, which was founded in 1837. The academy was later renamed West Liberty University and is still in operation today.
West Liberty has a long and rich history that is still evident today. The town is home to several historic buildings, including the West Liberty Opera House, which was built in 1891. The town also has several parks and recreational areas, including the West Liberty State Park, which was established in 1933.
Conclusion
West Liberty, West Virginia is a small town with a rich history and a vibrant economy. The town is located in the northern part of the state, just outside of Wheeling, and is home to approximately 4,000 people. The town’s economy is largely based on agriculture and manufacturing, and the town is home to several small businesses and larger employers. West Liberty is also home to West Liberty University, which provides a variety of educational opportunities for students. The town has a long and rich history that is still evident today, and it is home to several historic buildings and parks.
Common Questions
What is Per Capita Income in West Liberty?
Per Capita income in West Liberty is $12,295.
What is the Median Family Income in West Liberty?
Median Family Income in West Liberty is $69,375.
What is the Median Household income in West Liberty?
Median Household Income in West Liberty is $39,181.
What is Income or Wage Gap in West Liberty?
Income or Wage Gap in West Liberty is 59.7%.
Women in West Liberty earn 40.3 cents for every dollar earned by a man.
What is Inequality or Gini Index in West Liberty?
Inequality or Gini Index in West Liberty is 0.48.
What is the Total Population of West Liberty?
Total Population of West Liberty is 1,764.
What is the Total Male Population of West Liberty?
Total Male Population of West Liberty is 679.
What is the Total Female Population of West Liberty?
Total Female Population of West Liberty is 1,085.
What is the Ratio of Males per 100 Females in West Liberty?
There are 62.58 Males per 100 Females in West Liberty.
What is the Ratio of Females per 100 Males in West Liberty?
There are 159.79 Females per 100 Males in West Liberty.
What is the Median Population Age in West Liberty?
Median Population Age in West Liberty is 20.6 Years.
What is the Average Family Size in West Liberty
Average Family Size in West Liberty is 3.1 People.
What is the Average Household Size in West Liberty
Average Household Size in West Liberty is 2.5 People.
How Large is the Labor Force in West Liberty?
There are 907 People in the Labor Forcein in West Liberty.
What is the Percentage of People in the Labor Force in West Liberty?
55.3% of People are in the Labor Force in West Liberty.
What is the Unemployment Rate in West Liberty?
Unemployment Rate in West Liberty is 4.1%.