Pratt, WV Map & Demographics
Pratt Map
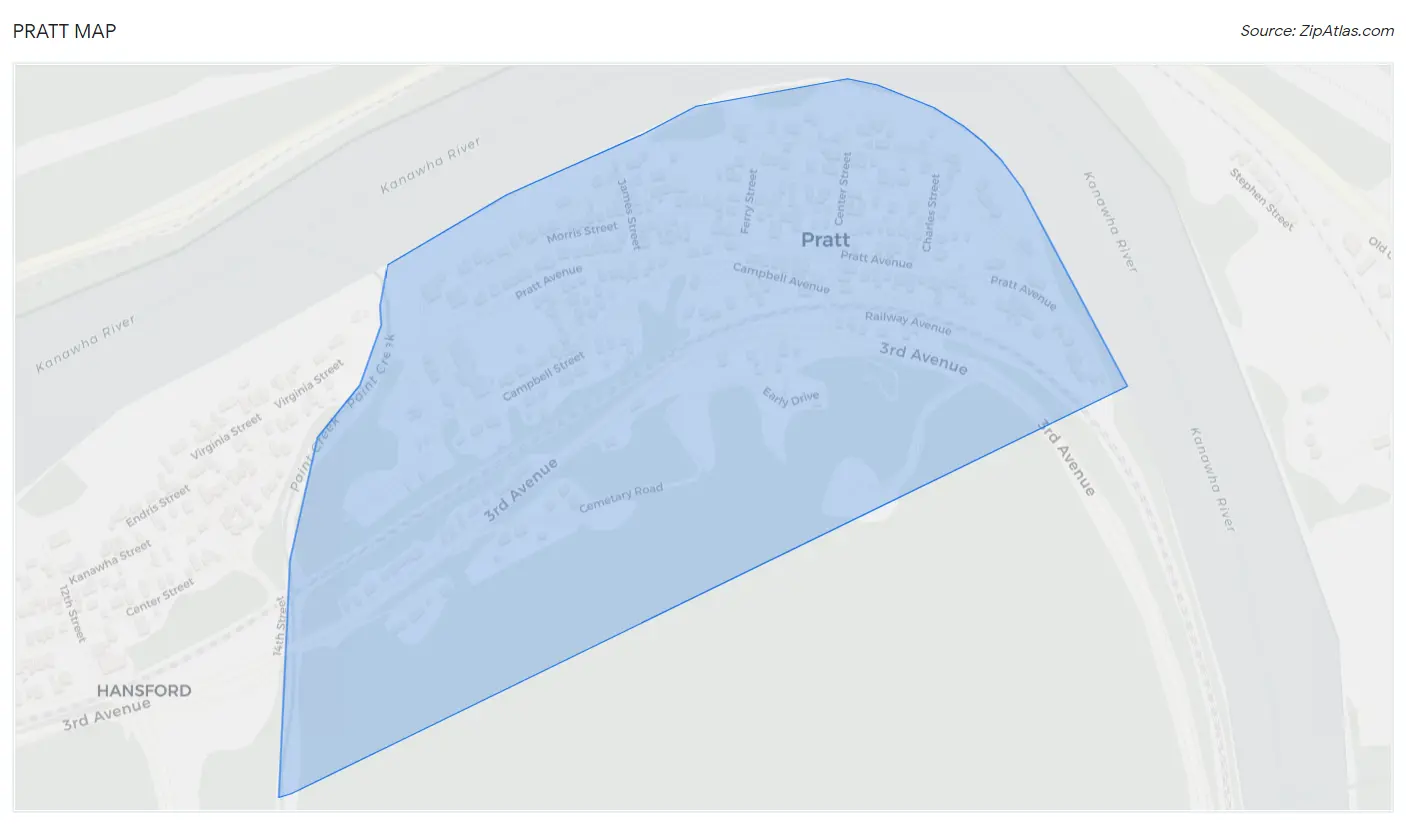
Pratt Overview
$28,684
PER CAPITA INCOME
$76,146
AVG FAMILY INCOME
$67,679
AVG HOUSEHOLD INCOME
5.8%
WAGE / INCOME GAP [ % ]
94.2¢/ $1
WAGE / INCOME GAP [ $ ]
0.40
INEQUALITY / GINI INDEX
423
TOTAL POPULATION
225
MALE POPULATION
198
FEMALE POPULATION
113.64
MALES / 100 FEMALES
88.00
FEMALES / 100 MALES
44.6
MEDIAN AGE
3.3
AVG FAMILY SIZE
2.9
AVG HOUSEHOLD SIZE
180
LABOR FORCE [ PEOPLE ]
52.6%
PERCENT IN LABOR FORCE
10.9%
UNEMPLOYMENT RATE
Pratt Zip Codes
Pratt Area Codes
Income in Pratt
Income Overview in Pratt
Per Capita Income in Pratt is $28,684, while median incomes of families and households are $76,146 and $67,679 respectively.
| Characteristic | Number | Measure |
| Per Capita Income | 423 | $28,684 |
| Median Family Income | 117 | $76,146 |
| Mean Family Income | 117 | $90,058 |
| Median Household Income | 145 | $67,679 |
| Mean Household Income | 145 | $78,903 |
| Income Deficit | 117 | $0 |
| Wage / Income Gap (%) | 423 | 5.80% |
| Wage / Income Gap ($) | 423 | 94.20¢ per $1 |
| Gini / Inequality Index | 423 | 0.40 |
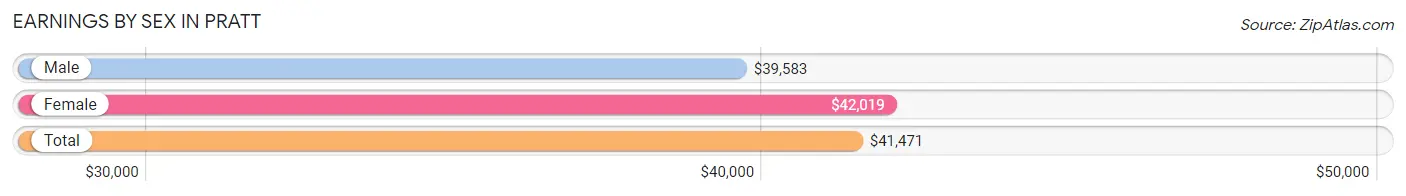
Earnings by Sex in Pratt
Average Earnings in Pratt are $41,471, $39,583 for men and $42,019 for women, a difference of 5.8%.
| Sex | Number | Average Earnings |
| Male | 91 (53.5%) | $39,583 |
| Female | 79 (46.5%) | $42,019 |
| Total | 170 (100.0%) | $41,471 |
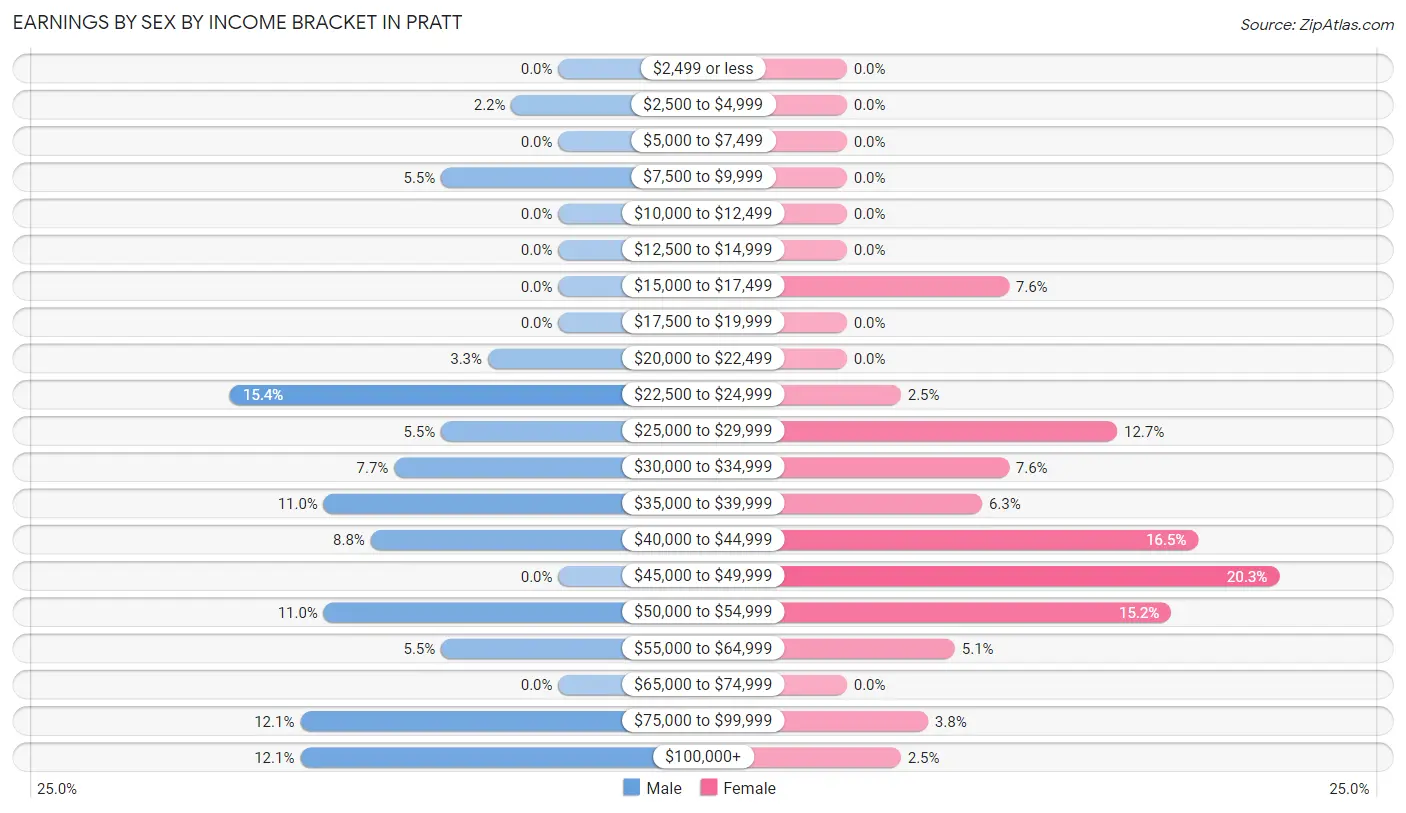
Earnings by Sex by Income Bracket in Pratt
The most common earnings brackets in Pratt are $22,500 to $24,999 for men (14 | 15.4%) and $45,000 to $49,999 for women (16 | 20.3%).
| Income | Male | Female |
| $2,499 or less | 0 (0.0%) | 0 (0.0%) |
| $2,500 to $4,999 | 2 (2.2%) | 0 (0.0%) |
| $5,000 to $7,499 | 0 (0.0%) | 0 (0.0%) |
| $7,500 to $9,999 | 5 (5.5%) | 0 (0.0%) |
| $10,000 to $12,499 | 0 (0.0%) | 0 (0.0%) |
| $12,500 to $14,999 | 0 (0.0%) | 0 (0.0%) |
| $15,000 to $17,499 | 0 (0.0%) | 6 (7.6%) |
| $17,500 to $19,999 | 0 (0.0%) | 0 (0.0%) |
| $20,000 to $22,499 | 3 (3.3%) | 0 (0.0%) |
| $22,500 to $24,999 | 14 (15.4%) | 2 (2.5%) |
| $25,000 to $29,999 | 5 (5.5%) | 10 (12.7%) |
| $30,000 to $34,999 | 7 (7.7%) | 6 (7.6%) |
| $35,000 to $39,999 | 10 (11.0%) | 5 (6.3%) |
| $40,000 to $44,999 | 8 (8.8%) | 13 (16.5%) |
| $45,000 to $49,999 | 0 (0.0%) | 16 (20.3%) |
| $50,000 to $54,999 | 10 (11.0%) | 12 (15.2%) |
| $55,000 to $64,999 | 5 (5.5%) | 4 (5.1%) |
| $65,000 to $74,999 | 0 (0.0%) | 0 (0.0%) |
| $75,000 to $99,999 | 11 (12.1%) | 3 (3.8%) |
| $100,000+ | 11 (12.1%) | 2 (2.5%) |
| Total | 91 (100.0%) | 79 (100.0%) |
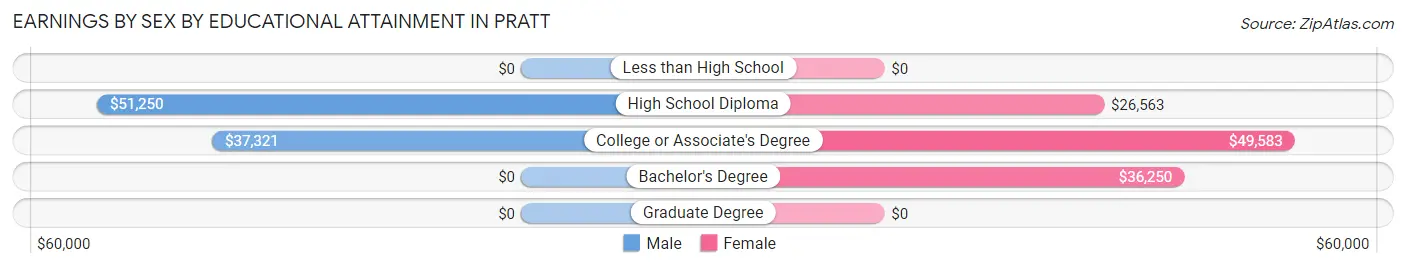
Earnings by Sex by Educational Attainment in Pratt
Average earnings in Pratt are $51,750 for men and $42,308 for women, a difference of 18.2%. Men with an educational attainment of high school diploma enjoy the highest average annual earnings of $51,250, while those with college or associate's degree education earn the least with $37,321. Women with an educational attainment of college or associate's degree earn the most with the average annual earnings of $49,583, while those with high school diploma education have the smallest earnings of $26,563.
| Educational Attainment | Male Income | Female Income |
| Less than High School | - | - |
| High School Diploma | $51,250 | $26,563 |
| College or Associate's Degree | $37,321 | $49,583 |
| Bachelor's Degree | - | - |
| Graduate Degree | - | - |
| Total | $51,750 | $42,308 |
Family Income in Pratt
Family Income Brackets in Pratt
According to the Pratt family income data, there are 31 families falling into the $50,000 to $74,999 income range, which is the most common income bracket and makes up 26.5% of all families.
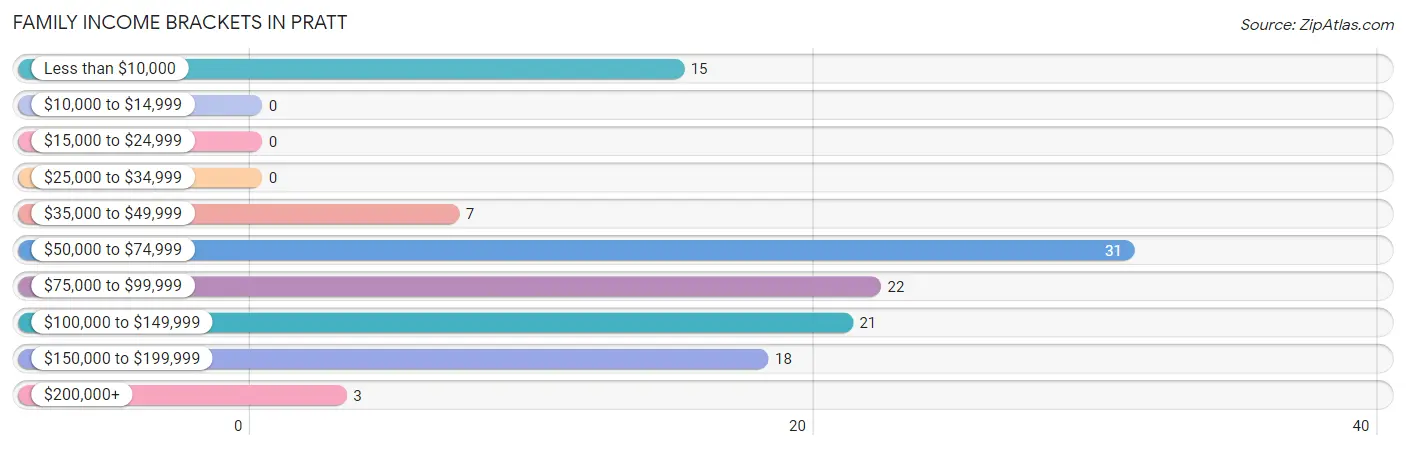
| Income Bracket | # Families | % Families |
| Less than $10,000 | 15 | 12.8% |
| $10,000 to $14,999 | 0 | 0.0% |
| $15,000 to $24,999 | 0 | 0.0% |
| $25,000 to $34,999 | 0 | 0.0% |
| $35,000 to $49,999 | 7 | 6.0% |
| $50,000 to $74,999 | 31 | 26.5% |
| $75,000 to $99,999 | 22 | 18.8% |
| $100,000 to $149,999 | 21 | 17.9% |
| $150,000 to $199,999 | 18 | 15.4% |
| $200,000+ | 3 | 2.6% |
Family Income by Famaliy Size in Pratt
5-person families (14 | 12.0%) account for the highest median family income in Pratt with $83,750 per family, while 2-person families (67 | 57.3%) have the highest median income of $41,354 per family member.
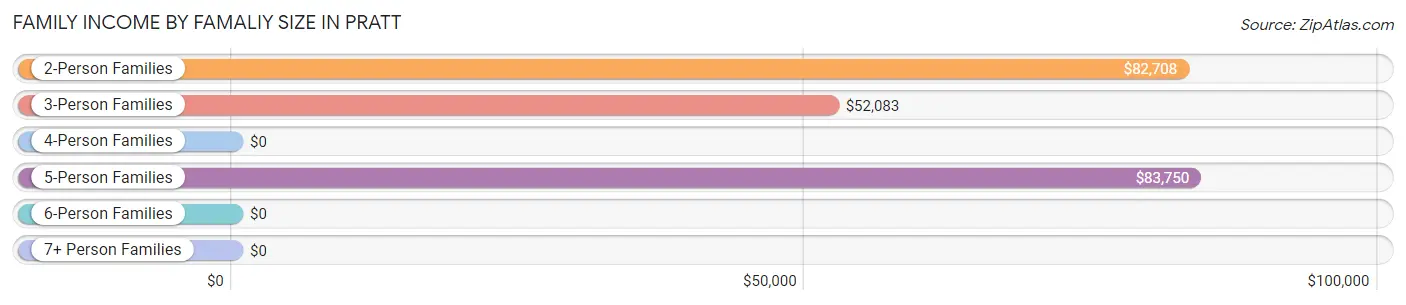
| Income Bracket | # Families | Median Income |
| 2-Person Families | 67 (57.3%) | $82,708 |
| 3-Person Families | 20 (17.1%) | $52,083 |
| 4-Person Families | 10 (8.6%) | $0 |
| 5-Person Families | 14 (12.0%) | $83,750 |
| 6-Person Families | 2 (1.7%) | $0 |
| 7+ Person Families | 4 (3.4%) | $0 |
| Total | 117 (100.0%) | $76,146 |
Family Income by Number of Earners in Pratt
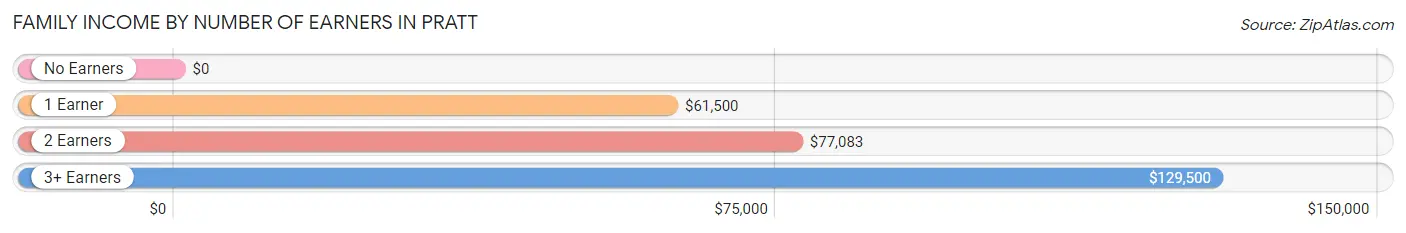
| Number of Earners | # Families | Median Income |
| No Earners | 31 (26.5%) | $0 |
| 1 Earner | 28 (23.9%) | $61,500 |
| 2 Earners | 42 (35.9%) | $77,083 |
| 3+ Earners | 16 (13.7%) | $129,500 |
| Total | 117 (100.0%) | $76,146 |
Household Income in Pratt
Household Income Brackets in Pratt
With 34 households falling in the category, the $50,000 to $74,999 income range is the most frequent in Pratt, accounting for 23.4% of all households.
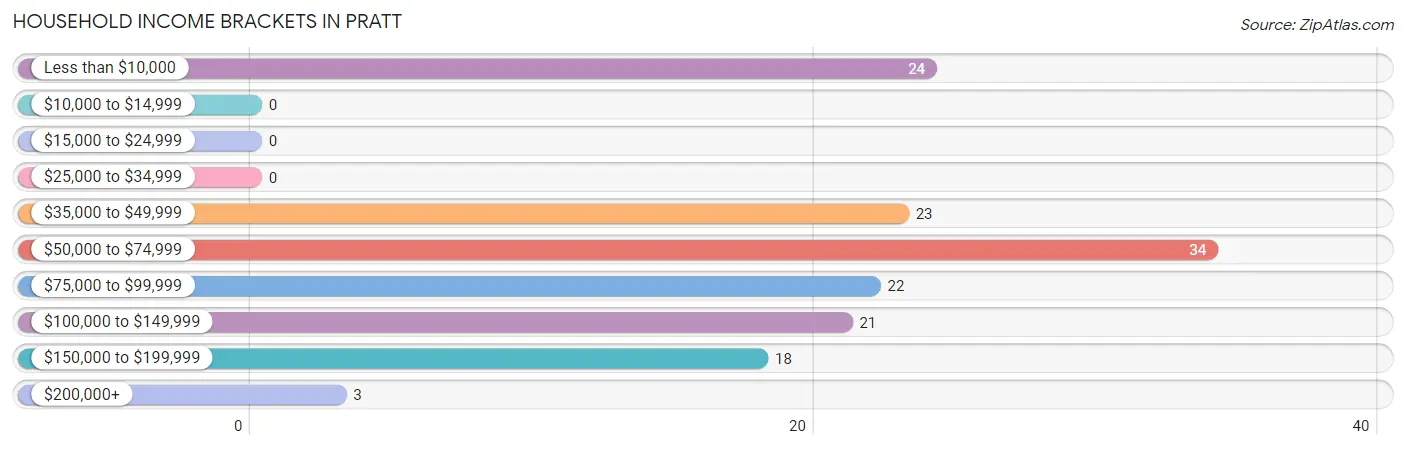
| Income Bracket | # Households | % Households |
| Less than $10,000 | 24 | 16.6% |
| $10,000 to $14,999 | 0 | 0.0% |
| $15,000 to $24,999 | 0 | 0.0% |
| $25,000 to $34,999 | 0 | 0.0% |
| $35,000 to $49,999 | 23 | 15.9% |
| $50,000 to $74,999 | 34 | 23.4% |
| $75,000 to $99,999 | 22 | 15.2% |
| $100,000 to $149,999 | 21 | 14.5% |
| $150,000 to $199,999 | 18 | 12.4% |
| $200,000+ | 3 | 2.1% |
Household Income by Householder Age in Pratt
The median household income in Pratt is $67,679, with the highest median household income of $118,393 found in the 45 to 64 years age bracket for the primary householder. A total of 49 households (33.8%) fall into this category. Meanwhile, the 15 to 24 years age bracket for the primary householder has the lowest median household income of $0, with 3 households (2.1%) in this group.
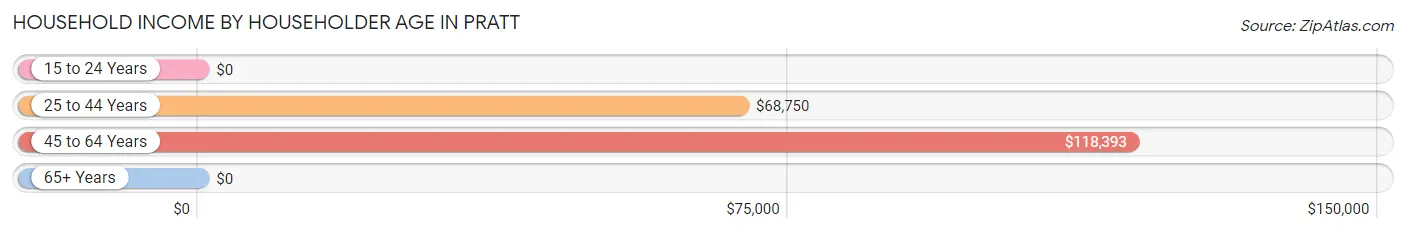
| Income Bracket | # Households | Median Income |
| 15 to 24 Years | 3 (2.1%) | $0 |
| 25 to 44 Years | 38 (26.2%) | $68,750 |
| 45 to 64 Years | 49 (33.8%) | $118,393 |
| 65+ Years | 55 (37.9%) | $0 |
| Total | 145 (100.0%) | $67,679 |
Poverty in Pratt
Income Below Poverty by Sex and Age in Pratt
With 16.9% poverty level for males and 23.7% for females among the residents of Pratt, 75 year old and over males and 16 and 17 year old females are the most vulnerable to poverty, with 6 males (60.0%) and 5 females (100.0%) in their respective age groups living below the poverty level.
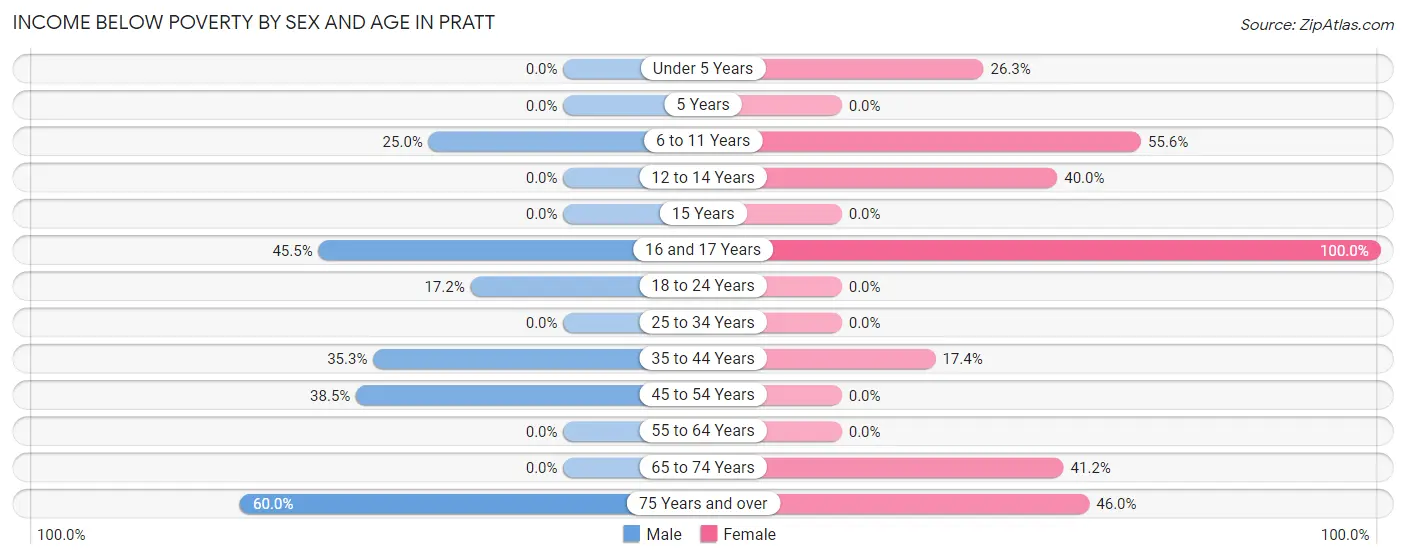
| Age Bracket | Male | Female |
| Under 5 Years | 0 (0.0%) | 5 (26.3%) |
| 5 Years | 0 (0.0%) | 0 (0.0%) |
| 6 to 11 Years | 6 (25.0%) | 5 (55.6%) |
| 12 to 14 Years | 0 (0.0%) | 4 (40.0%) |
| 15 Years | 0 (0.0%) | 0 (0.0%) |
| 16 and 17 Years | 5 (45.5%) | 5 (100.0%) |
| 18 to 24 Years | 5 (17.2%) | 0 (0.0%) |
| 25 to 34 Years | 0 (0.0%) | 0 (0.0%) |
| 35 to 44 Years | 6 (35.3%) | 4 (17.4%) |
| 45 to 54 Years | 10 (38.5%) | 0 (0.0%) |
| 55 to 64 Years | 0 (0.0%) | 0 (0.0%) |
| 65 to 74 Years | 0 (0.0%) | 7 (41.2%) |
| 75 Years and over | 6 (60.0%) | 17 (46.0%) |
| Total | 38 (16.9%) | 47 (23.7%) |
Income Above Poverty by Sex and Age in Pratt
According to the poverty statistics in Pratt, males aged under 5 years and females aged 15 years are the age groups that are most secure financially, with 100.0% of males and 100.0% of females in these age groups living above the poverty line.
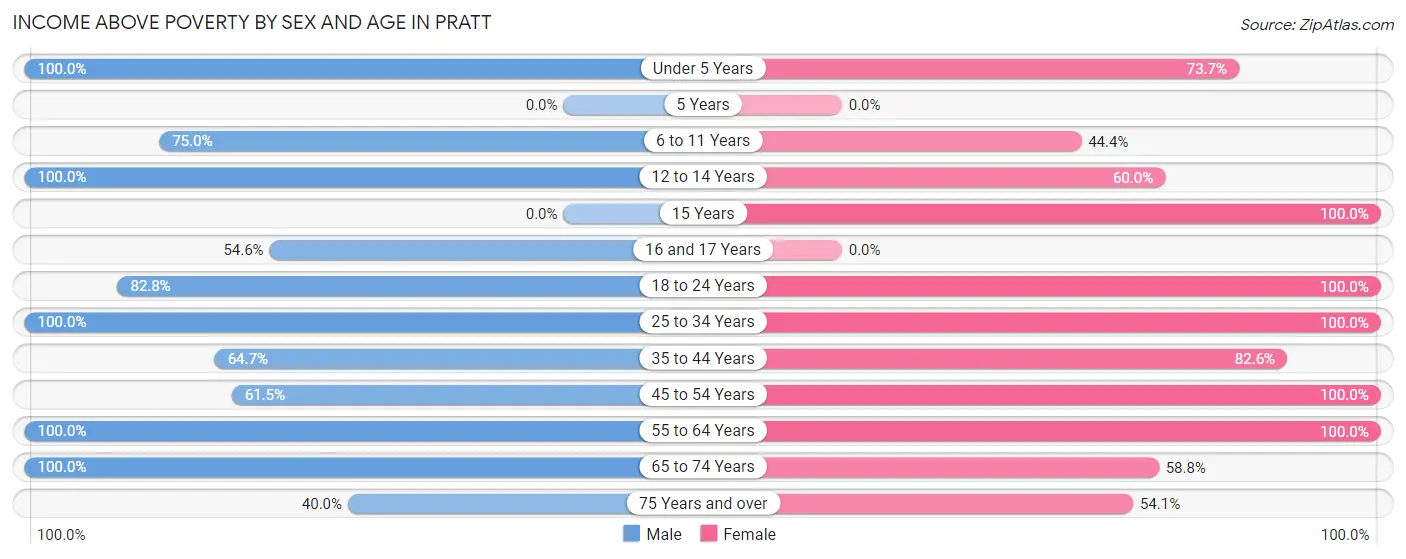
| Age Bracket | Male | Female |
| Under 5 Years | 10 (100.0%) | 14 (73.7%) |
| 5 Years | 0 (0.0%) | 0 (0.0%) |
| 6 to 11 Years | 18 (75.0%) | 4 (44.4%) |
| 12 to 14 Years | 8 (100.0%) | 6 (60.0%) |
| 15 Years | 0 (0.0%) | 1 (100.0%) |
| 16 and 17 Years | 6 (54.5%) | 0 (0.0%) |
| 18 to 24 Years | 24 (82.8%) | 3 (100.0%) |
| 25 to 34 Years | 31 (100.0%) | 16 (100.0%) |
| 35 to 44 Years | 11 (64.7%) | 19 (82.6%) |
| 45 to 54 Years | 16 (61.5%) | 38 (100.0%) |
| 55 to 64 Years | 19 (100.0%) | 20 (100.0%) |
| 65 to 74 Years | 40 (100.0%) | 10 (58.8%) |
| 75 Years and over | 4 (40.0%) | 20 (54.0%) |
| Total | 187 (83.1%) | 151 (76.3%) |
Income Below Poverty Among Married-Couple Families in Pratt
The poverty statistics for married-couple families in Pratt show that 13.5% or 12 of the total 89 families live below the poverty line. Families with 5 or more children have the highest poverty rate of 100.0%, comprising of 4 families. On the other hand, families with 1 or 2 children have the lowest poverty rate of 0.0%, which includes 0 families.
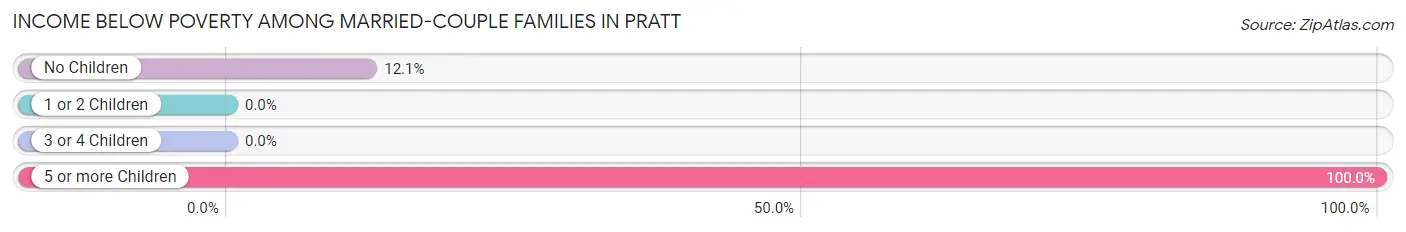
| Children | Above Poverty | Below Poverty |
| No Children | 58 (87.9%) | 8 (12.1%) |
| 1 or 2 Children | 12 (100.0%) | 0 (0.0%) |
| 3 or 4 Children | 7 (100.0%) | 0 (0.0%) |
| 5 or more Children | 0 (0.0%) | 4 (100.0%) |
| Total | 77 (86.5%) | 12 (13.5%) |
Income Below Poverty Among Single-Parent Households in Pratt
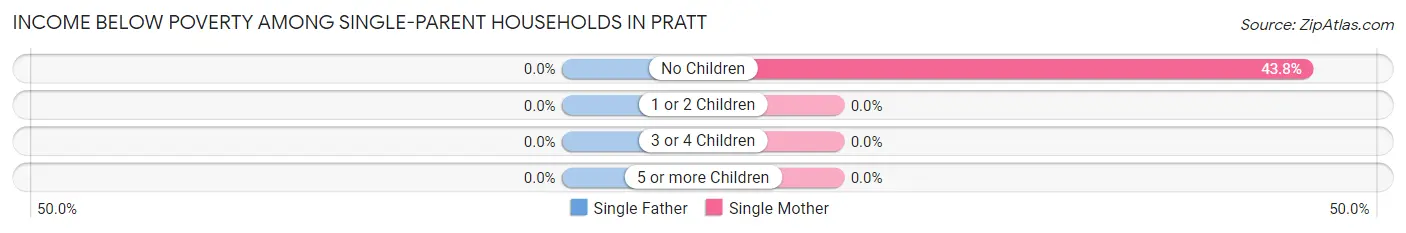
| Children | Single Father | Single Mother |
| No Children | 0 (0.0%) | 7 (43.8%) |
| 1 or 2 Children | 0 (0.0%) | 0 (0.0%) |
| 3 or 4 Children | 0 (0.0%) | 0 (0.0%) |
| 5 or more Children | 0 (0.0%) | 0 (0.0%) |
| Total | 0 (0.0%) | 7 (26.9%) |
Income Below Poverty Among Married-Couple vs Single-Parent Households in Pratt
The poverty data for Pratt shows that 12 of the married-couple family households (13.5%) and 7 of the single-parent households (25.0%) are living below the poverty level. Within the married-couple family households, those with 5 or more children have the highest poverty rate, with 4 households (100.0%) falling below the poverty line. Among the single-parent households, those with no children have the highest poverty rate, with 7 household (43.8%) living below poverty.
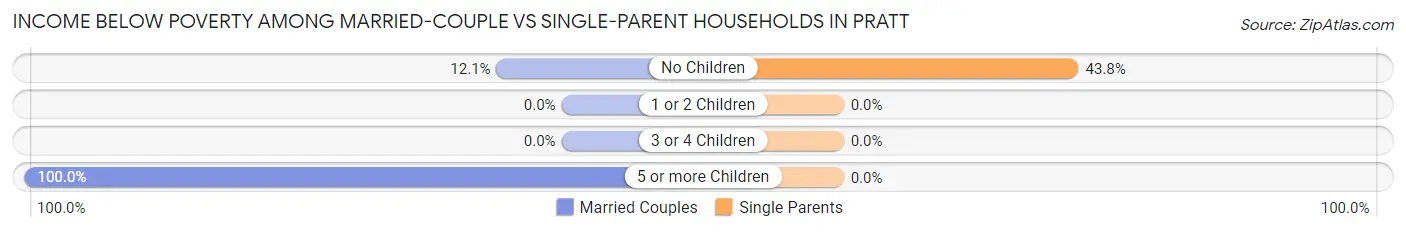
| Children | Married-Couple Families | Single-Parent Households |
| No Children | 8 (12.1%) | 7 (43.8%) |
| 1 or 2 Children | 0 (0.0%) | 0 (0.0%) |
| 3 or 4 Children | 0 (0.0%) | 0 (0.0%) |
| 5 or more Children | 4 (100.0%) | 0 (0.0%) |
| Total | 12 (13.5%) | 7 (25.0%) |
Race in Pratt
The most populous races in Pratt are White / Caucasian (404 | 95.5%), Two or more Races (16 | 3.8%), and Black / African American (3 | 0.7%).
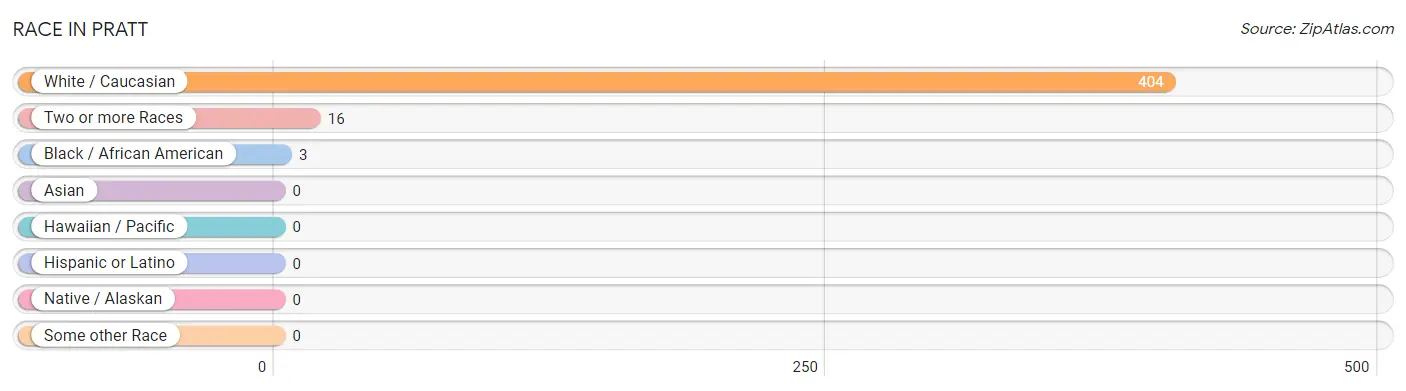
| Race | # Population | % Population |
| Asian | 0 | 0.0% |
| Black / African American | 3 | 0.7% |
| Hawaiian / Pacific | 0 | 0.0% |
| Hispanic or Latino | 0 | 0.0% |
| Native / Alaskan | 0 | 0.0% |
| White / Caucasian | 404 | 95.5% |
| Two or more Races | 16 | 3.8% |
| Some other Race | 0 | 0.0% |
| Total | 423 | 100.0% |
Ancestry in Pratt
The most populous ancestries reported in Pratt are English (180 | 42.5%), German (61 | 14.4%), Irish (50 | 11.8%), Italian (33 | 7.8%), and British (21 | 5.0%), together accounting for 81.5% of all Pratt residents.
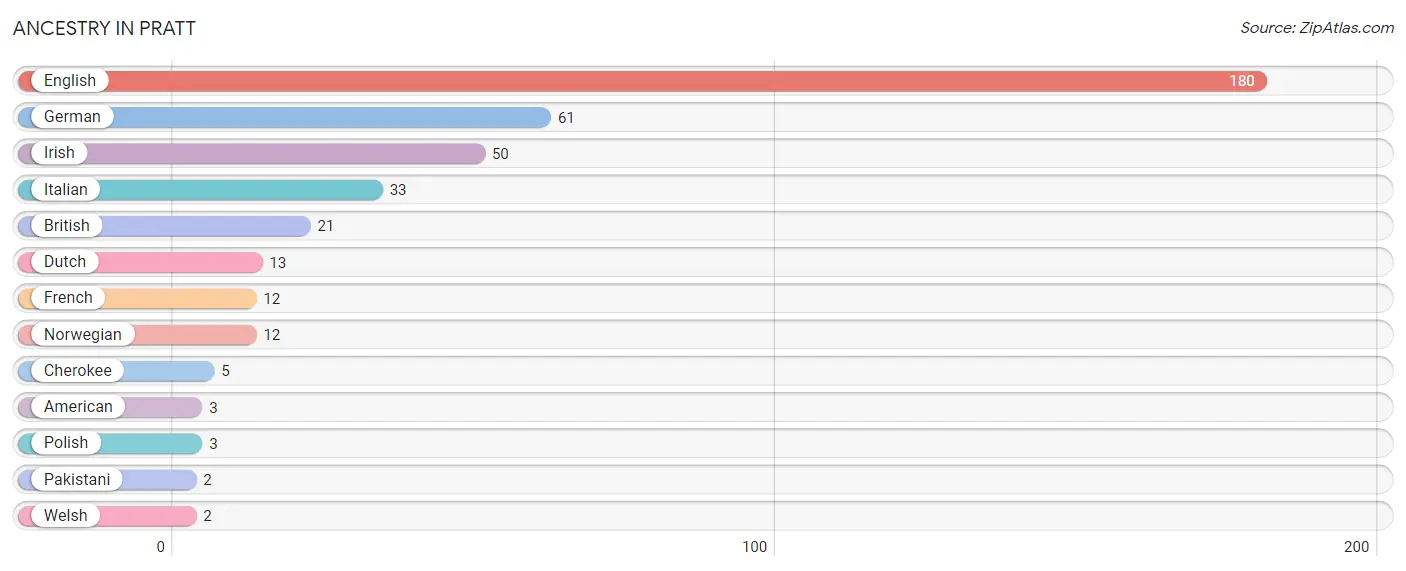
| Ancestry | # Population | % Population |
| American | 3 | 0.7% |
| British | 21 | 5.0% |
| Cherokee | 5 | 1.2% |
| Dutch | 13 | 3.1% |
| English | 180 | 42.5% |
| French | 12 | 2.8% |
| German | 61 | 14.4% |
| Irish | 50 | 11.8% |
| Italian | 33 | 7.8% |
| Norwegian | 12 | 2.8% |
| Pakistani | 2 | 0.5% |
| Polish | 3 | 0.7% |
| Welsh | 2 | 0.5% | View All 13 Rows |
Immigrants in Pratt

| Immigration Origin | # Population | % Population | View All 0 Rows |
Sex and Age in Pratt
Sex and Age in Pratt
The most populous age groups in Pratt are 70 to 74 Years (33 | 14.7%) for men and 50 to 54 Years (30 | 15.1%) for women.
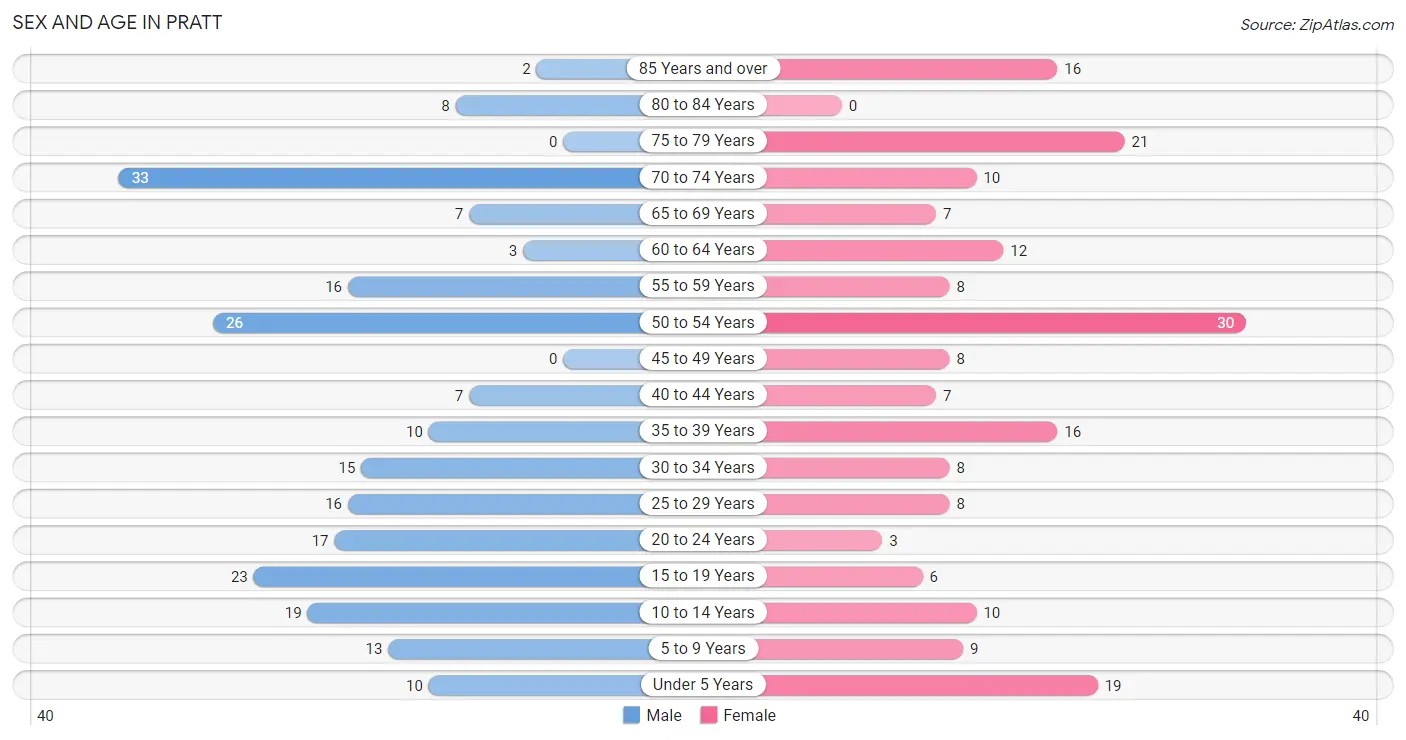
| Age Bracket | Male | Female |
| Under 5 Years | 10 (4.4%) | 19 (9.6%) |
| 5 to 9 Years | 13 (5.8%) | 9 (4.5%) |
| 10 to 14 Years | 19 (8.4%) | 10 (5.1%) |
| 15 to 19 Years | 23 (10.2%) | 6 (3.0%) |
| 20 to 24 Years | 17 (7.6%) | 3 (1.5%) |
| 25 to 29 Years | 16 (7.1%) | 8 (4.0%) |
| 30 to 34 Years | 15 (6.7%) | 8 (4.0%) |
| 35 to 39 Years | 10 (4.4%) | 16 (8.1%) |
| 40 to 44 Years | 7 (3.1%) | 7 (3.5%) |
| 45 to 49 Years | 0 (0.0%) | 8 (4.0%) |
| 50 to 54 Years | 26 (11.6%) | 30 (15.1%) |
| 55 to 59 Years | 16 (7.1%) | 8 (4.0%) |
| 60 to 64 Years | 3 (1.3%) | 12 (6.1%) |
| 65 to 69 Years | 7 (3.1%) | 7 (3.5%) |
| 70 to 74 Years | 33 (14.7%) | 10 (5.1%) |
| 75 to 79 Years | 0 (0.0%) | 21 (10.6%) |
| 80 to 84 Years | 8 (3.6%) | 0 (0.0%) |
| 85 Years and over | 2 (0.9%) | 16 (8.1%) |
| Total | 225 (100.0%) | 198 (100.0%) |
Families and Households in Pratt
Median Family Size in Pratt
The median family size in Pratt is 3.33 persons per family, with single male/father families (2 | 1.7%) accounting for the largest median family size of 6 persons per family. On the other hand, single female/mother families (26 | 22.2%) represent the smallest median family size with 2.65 persons per family.
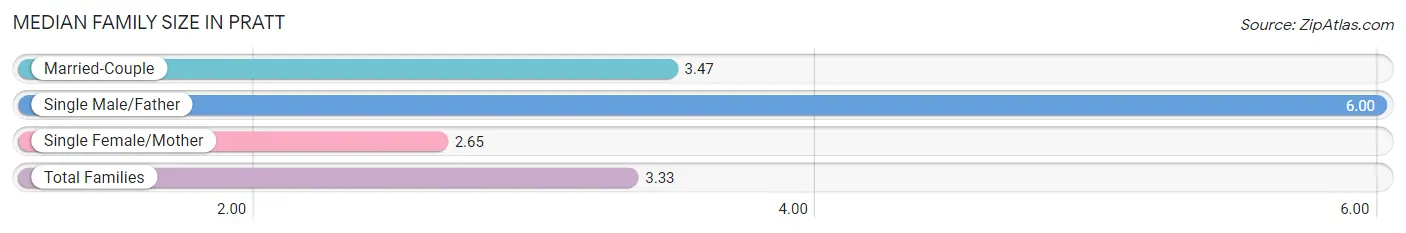
| Family Type | # Families | Family Size |
| Married-Couple | 89 (76.1%) | 3.47 |
| Single Male/Father | 2 (1.7%) | 6.00 |
| Single Female/Mother | 26 (22.2%) | 2.65 |
| Total Families | 117 (100.0%) | 3.33 |
Median Household Size in Pratt
The median household size in Pratt is 2.92 persons per household, with single male/father households (2 | 1.4%) accounting for the largest median household size of 6 persons per household. non-family households (28 | 19.3%) represent the smallest median household size with 1.07 persons per household.
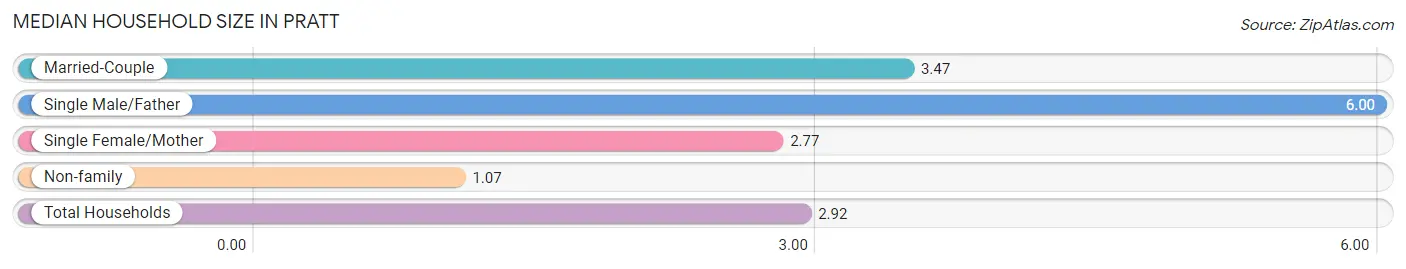
| Household Type | # Households | Household Size |
| Married-Couple | 89 (61.4%) | 3.47 |
| Single Male/Father | 2 (1.4%) | 6.00 |
| Single Female/Mother | 26 (17.9%) | 2.77 |
| Non-family | 28 (19.3%) | 1.07 |
| Total Households | 145 (100.0%) | 2.92 |
Household Size by Marriage Status in Pratt
Out of a total of 145 households in Pratt, 117 (80.7%) are family households, while 28 (19.3%) are nonfamily households. The most numerous type of family households are 2-person households, comprising 67, and the most common type of nonfamily households are 1-person households, comprising 26.
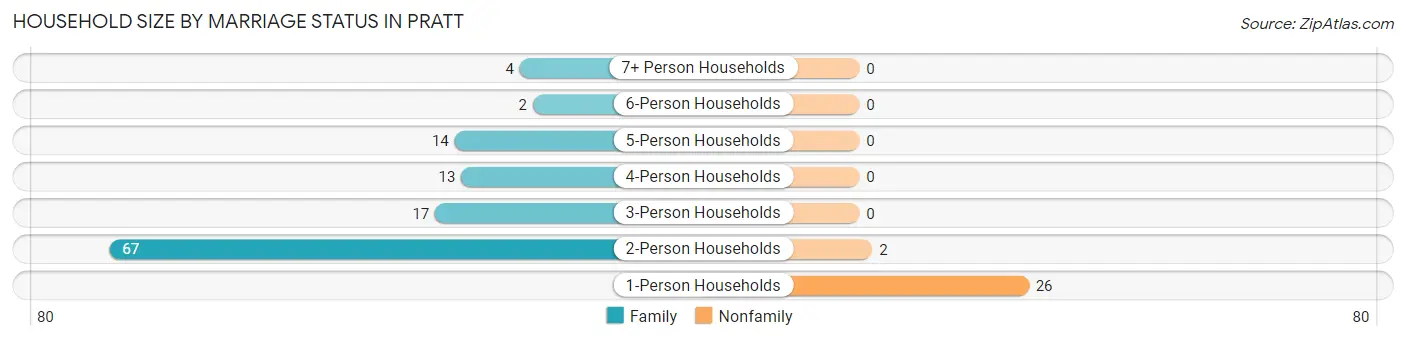
| Household Size | Family Households | Nonfamily Households |
| 1-Person Households | - | 26 (17.9%) |
| 2-Person Households | 67 (46.2%) | 2 (1.4%) |
| 3-Person Households | 17 (11.7%) | 0 (0.0%) |
| 4-Person Households | 13 (9.0%) | 0 (0.0%) |
| 5-Person Households | 14 (9.7%) | 0 (0.0%) |
| 6-Person Households | 2 (1.4%) | 0 (0.0%) |
| 7+ Person Households | 4 (2.8%) | 0 (0.0%) |
| Total | 117 (80.7%) | 28 (19.3%) |
Female Fertility in Pratt
Fertility by Age in Pratt
Average fertility rate in Pratt is 36.0 births per 1,000 women. Women in the age bracket of 20 to 34 years have the highest fertility rate with 105.0 births per 1,000 women. Women in the age bracket of 20 to 34 years acount for 100.0% of all women with births.
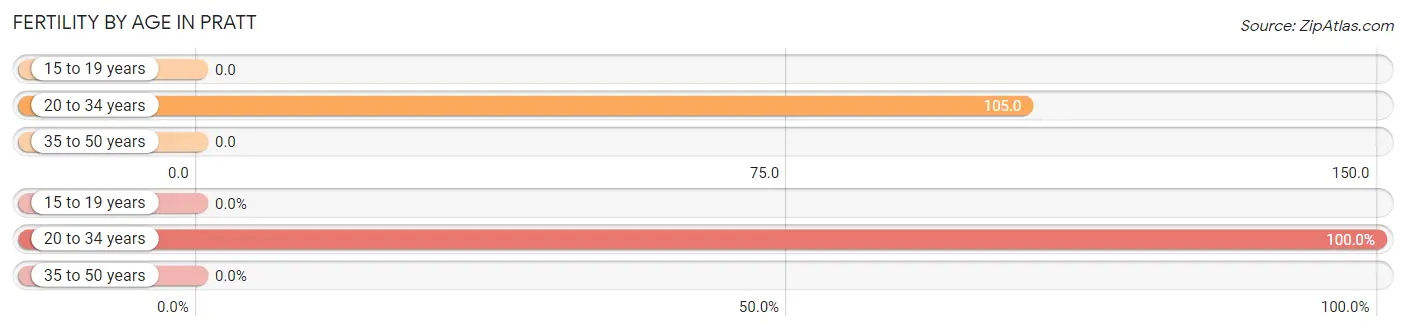
| Age Bracket | Women with Births | Births / 1,000 Women |
| 15 to 19 years | 0 (0.0%) | 0.0 |
| 20 to 34 years | 2 (100.0%) | 105.0 |
| 35 to 50 years | 0 (0.0%) | 0.0 |
| Total | 2 (100.0%) | 36.0 |
Fertility by Age by Marriage Status in Pratt
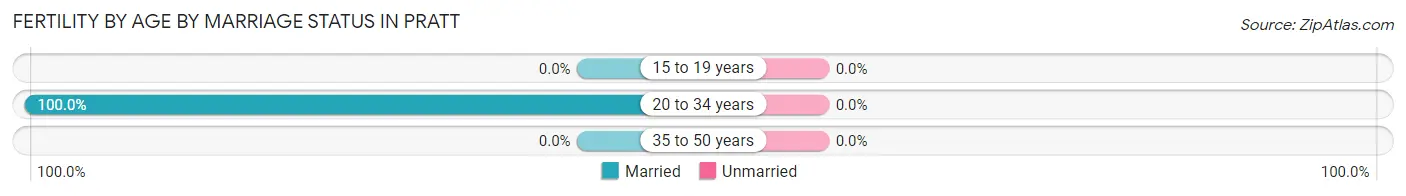
| Age Bracket | Married | Unmarried |
| 15 to 19 years | 0 (0.0%) | 0 (0.0%) |
| 20 to 34 years | 2 (100.0%) | 0 (0.0%) |
| 35 to 50 years | 0 (0.0%) | 0 (0.0%) |
| Total | 2 (100.0%) | 0 (0.0%) |
Fertility by Education in Pratt
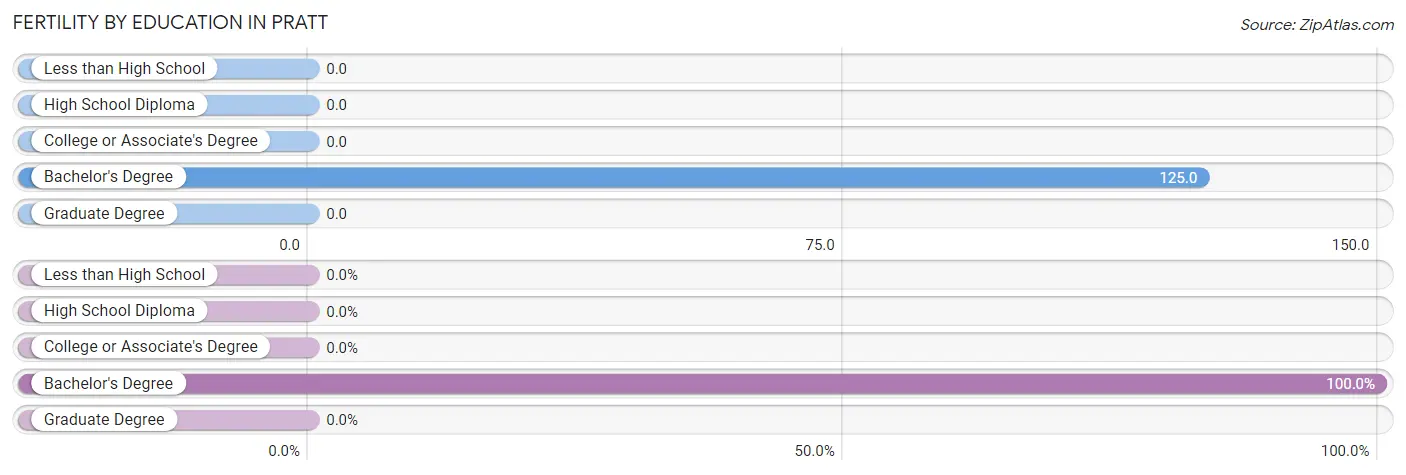
| Educational Attainment | Women with Births | Births / 1,000 Women |
| Less than High School | 0 (0.0%) | 0.0 |
| High School Diploma | 0 (0.0%) | 0.0 |
| College or Associate's Degree | 0 (0.0%) | 0.0 |
| Bachelor's Degree | 2 (100.0%) | 125.0 |
| Graduate Degree | 0 (0.0%) | 0.0 |
| Total | 2 (100.0%) | 36.0 |
Fertility by Education by Marriage Status in Pratt
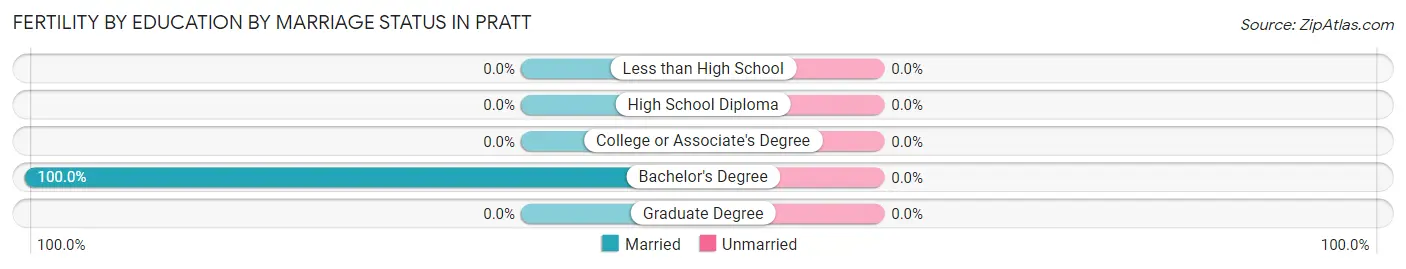
| Educational Attainment | Married | Unmarried |
| Less than High School | 0 (0.0%) | 0 (0.0%) |
| High School Diploma | 0 (0.0%) | 0 (0.0%) |
| College or Associate's Degree | 0 (0.0%) | 0 (0.0%) |
| Bachelor's Degree | 2 (100.0%) | 0 (0.0%) |
| Graduate Degree | 0 (0.0%) | 0 (0.0%) |
| Total | 2 (100.0%) | 0 (0.0%) |
Employment Characteristics in Pratt
Employment by Class of Employer in Pratt
Among the 158 employed individuals in Pratt, private company employees (103 | 65.2%), local government employees (16 | 10.1%), and not-for-profit organizations (14 | 8.9%) make up the most common classes of employment.
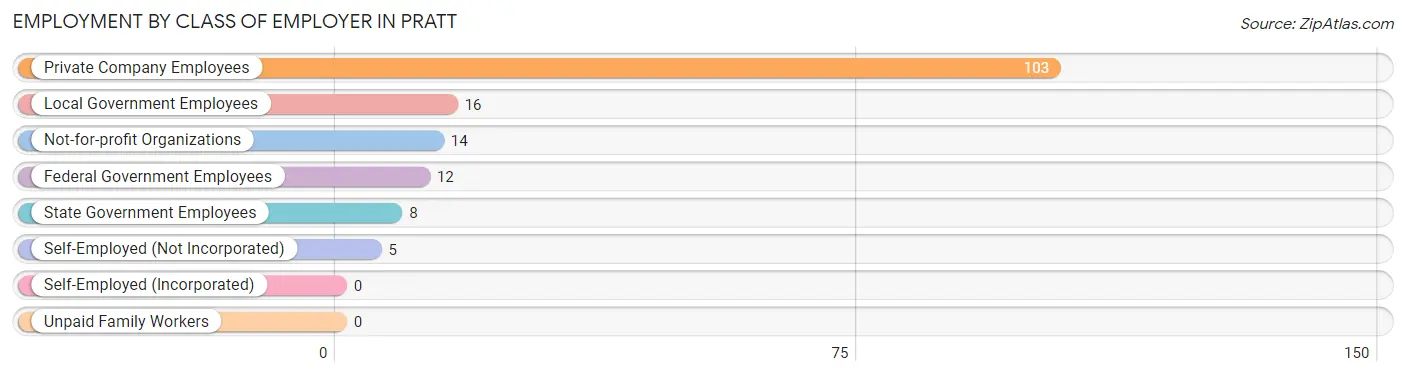
| Employer Class | # Employees | % Employees |
| Private Company Employees | 103 | 65.2% |
| Self-Employed (Incorporated) | 0 | 0.0% |
| Self-Employed (Not Incorporated) | 5 | 3.2% |
| Not-for-profit Organizations | 14 | 8.9% |
| Local Government Employees | 16 | 10.1% |
| State Government Employees | 8 | 5.1% |
| Federal Government Employees | 12 | 7.6% |
| Unpaid Family Workers | 0 | 0.0% |
| Total | 158 | 100.0% |
Employment Status by Age in Pratt
According to the labor force statistics for Pratt, out of the total population over 16 years of age (342), 52.6% or 180 individuals are in the labor force, with 10.9% or 20 of them unemployed. The age group with the highest labor force participation rate is 20 to 24 years, with 100.0% or 20 individuals in the labor force. Within the labor force, the 25 to 29 years age range has the highest percentage of unemployed individuals, with 38.9% or 9 of them being unemployed.
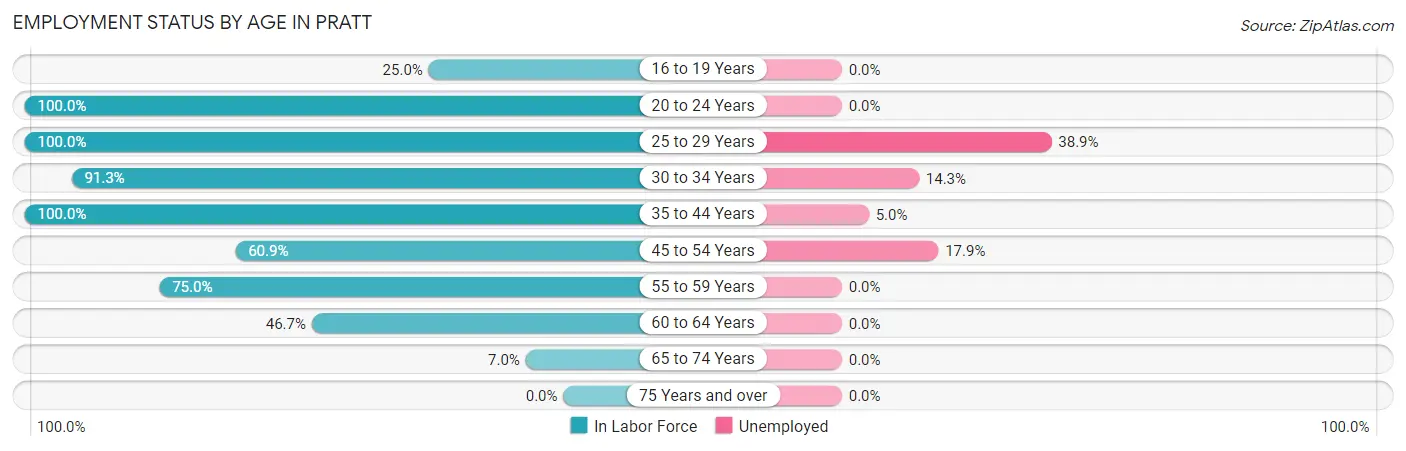
| Age Bracket | In Labor Force | Unemployed |
| 16 to 19 Years | 7 (25.0%) | 0 (0.0%) |
| 20 to 24 Years | 20 (100.0%) | 0 (0.0%) |
| 25 to 29 Years | 24 (100.0%) | 9 (38.9%) |
| 30 to 34 Years | 21 (91.3%) | 3 (14.3%) |
| 35 to 44 Years | 40 (100.0%) | 2 (5.0%) |
| 45 to 54 Years | 39 (60.9%) | 7 (17.9%) |
| 55 to 59 Years | 18 (75.0%) | 0 (0.0%) |
| 60 to 64 Years | 7 (46.7%) | 0 (0.0%) |
| 65 to 74 Years | 4 (7.0%) | 0 (0.0%) |
| 75 Years and over | 0 (0.0%) | 0 (0.0%) |
| Total | 180 (52.6%) | 20 (10.9%) |
Employment Status by Educational Attainment in Pratt
According to labor force statistics for Pratt, 78.4% of individuals (149) out of the total population between 25 and 64 years of age (190) are in the labor force, with 13.3% or 20 of them being unemployed. The group with the highest labor force participation rate are those with the educational attainment of bachelor's degree or higher, with 100.0% or 27 individuals in the labor force. Within the labor force, individuals with high school diploma education have the highest percentage of unemployment, with 31.5% or 17 of them being unemployed.
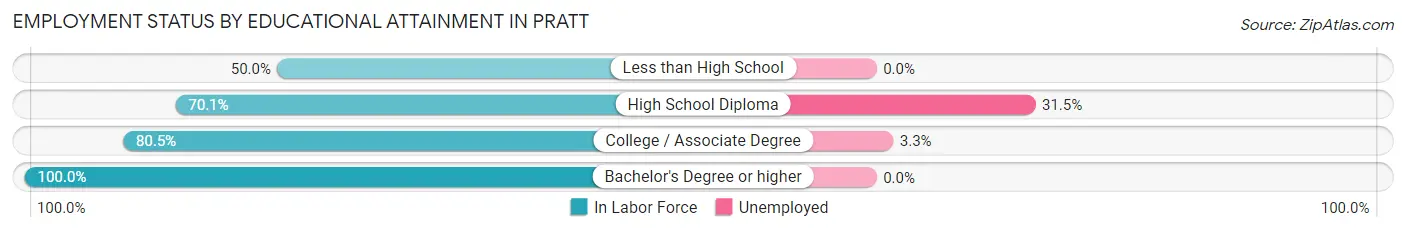
| Educational Attainment | In Labor Force | Unemployed |
| Less than High School | 2 (50.0%) | 0 (0.0%) |
| High School Diploma | 54 (70.1%) | 24 (31.5%) |
| College / Associate Degree | 66 (80.5%) | 3 (3.3%) |
| Bachelor's Degree or higher | 27 (100.0%) | 0 (0.0%) |
| Total | 149 (78.4%) | 25 (13.3%) |
Employment Occupations by Sex in Pratt
Management, Business, Science and Arts Occupations
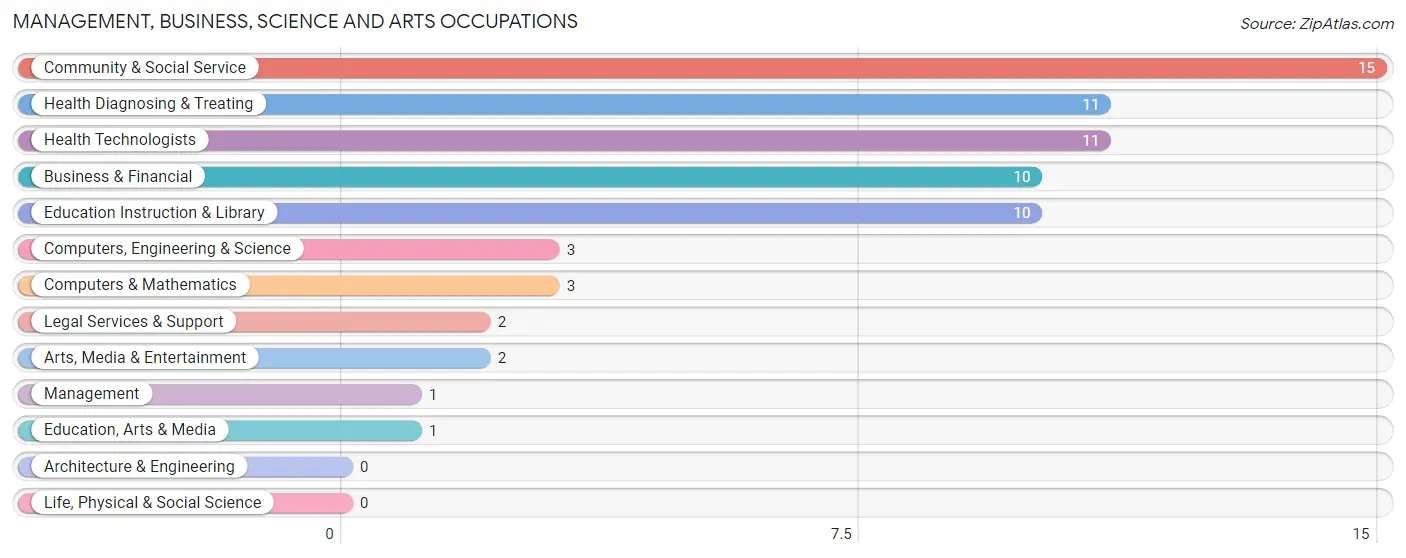
The most common Management, Business, Science and Arts occupations in Pratt are Community & Social Service (15 | 9.7%), Health Diagnosing & Treating (11 | 7.1%), Health Technologists (11 | 7.1%), Business & Financial (10 | 6.5%), and Education Instruction & Library (10 | 6.5%).
Management, Business, Science and Arts Occupations by Sex
Within the Management, Business, Science and Arts occupations in Pratt, the most male-oriented occupations are Arts, Media & Entertainment (100.0%), Business & Financial (80.0%), and Community & Social Service (13.3%), while the most female-oriented occupations are Management (100.0%), Computers, Engineering & Science (100.0%), and Computers & Mathematics (100.0%).
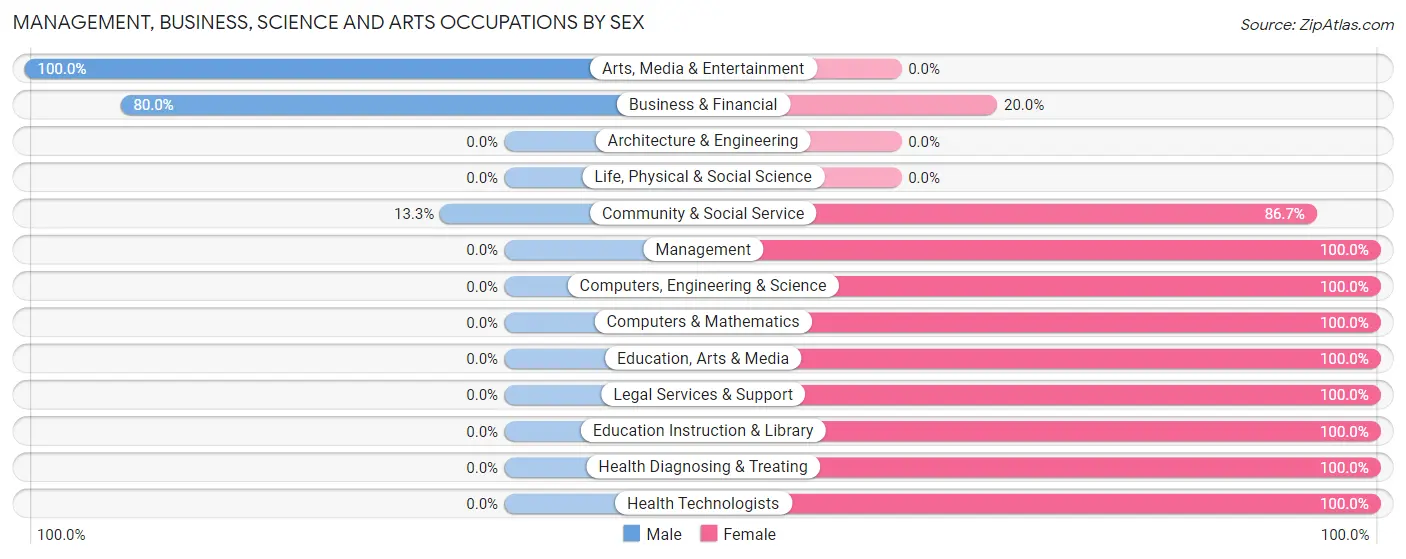
| Occupation | Male | Female |
| Management | 0 (0.0%) | 1 (100.0%) |
| Business & Financial | 8 (80.0%) | 2 (20.0%) |
| Computers, Engineering & Science | 0 (0.0%) | 3 (100.0%) |
| Computers & Mathematics | 0 (0.0%) | 3 (100.0%) |
| Architecture & Engineering | 0 (0.0%) | 0 (0.0%) |
| Life, Physical & Social Science | 0 (0.0%) | 0 (0.0%) |
| Community & Social Service | 2 (13.3%) | 13 (86.7%) |
| Education, Arts & Media | 0 (0.0%) | 1 (100.0%) |
| Legal Services & Support | 0 (0.0%) | 2 (100.0%) |
| Education Instruction & Library | 0 (0.0%) | 10 (100.0%) |
| Arts, Media & Entertainment | 2 (100.0%) | 0 (0.0%) |
| Health Diagnosing & Treating | 0 (0.0%) | 11 (100.0%) |
| Health Technologists | 0 (0.0%) | 11 (100.0%) |
| Total (Category) | 10 (25.0%) | 30 (75.0%) |
| Total (Overall) | 83 (53.5%) | 72 (46.5%) |
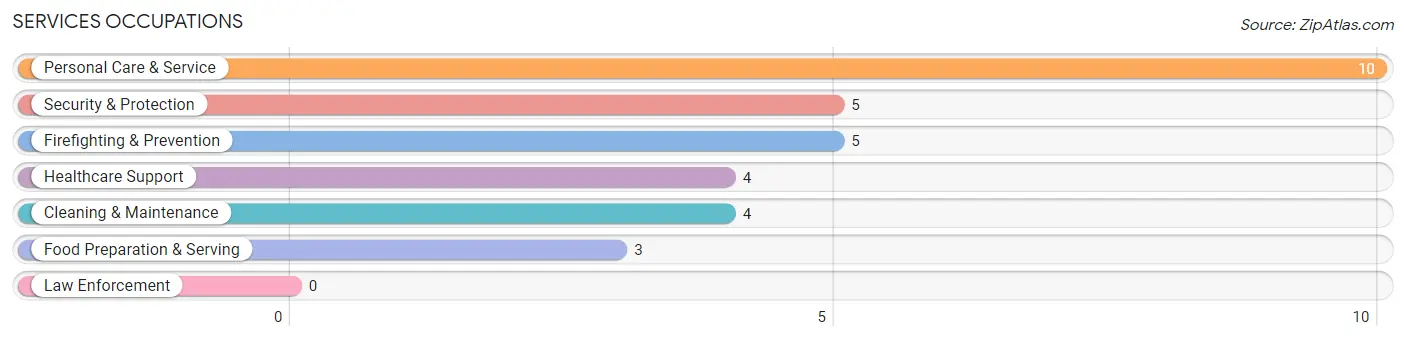
Services Occupations
The most common Services occupations in Pratt are Personal Care & Service (10 | 6.5%), Security & Protection (5 | 3.2%), Firefighting & Prevention (5 | 3.2%), Healthcare Support (4 | 2.6%), and Cleaning & Maintenance (4 | 2.6%).
Services Occupations by Sex
Within the Services occupations in Pratt, the most male-oriented occupations are Security & Protection (100.0%), Firefighting & Prevention (100.0%), and Food Preparation & Serving (100.0%), while the most female-oriented occupations are Healthcare Support (100.0%), and Personal Care & Service (90.0%).
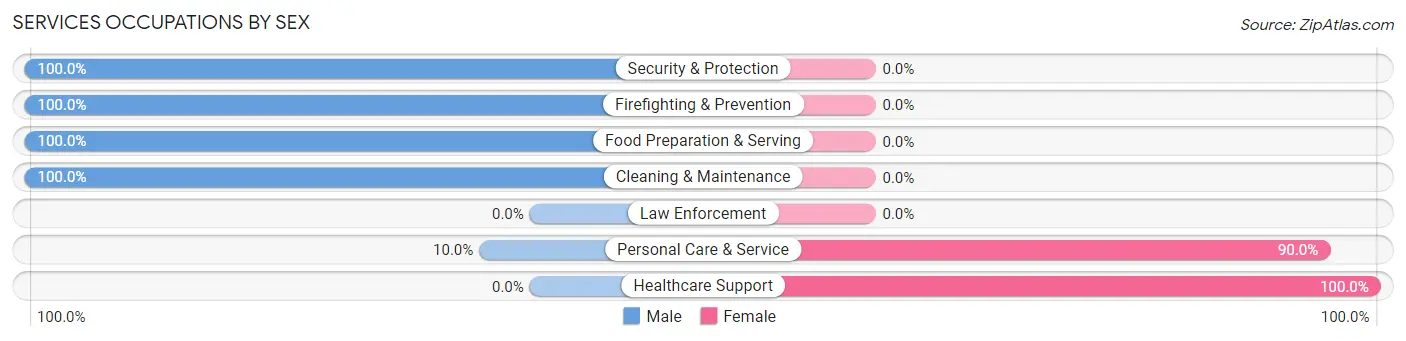
| Occupation | Male | Female |
| Healthcare Support | 0 (0.0%) | 4 (100.0%) |
| Security & Protection | 5 (100.0%) | 0 (0.0%) |
| Firefighting & Prevention | 5 (100.0%) | 0 (0.0%) |
| Law Enforcement | 0 (0.0%) | 0 (0.0%) |
| Food Preparation & Serving | 3 (100.0%) | 0 (0.0%) |
| Cleaning & Maintenance | 4 (100.0%) | 0 (0.0%) |
| Personal Care & Service | 1 (10.0%) | 9 (90.0%) |
| Total (Category) | 13 (50.0%) | 13 (50.0%) |
| Total (Overall) | 83 (53.5%) | 72 (46.5%) |
Sales and Office Occupations
The most common Sales and Office occupations in Pratt are Office & Administration (31 | 20.0%), and Sales & Related (19 | 12.3%).
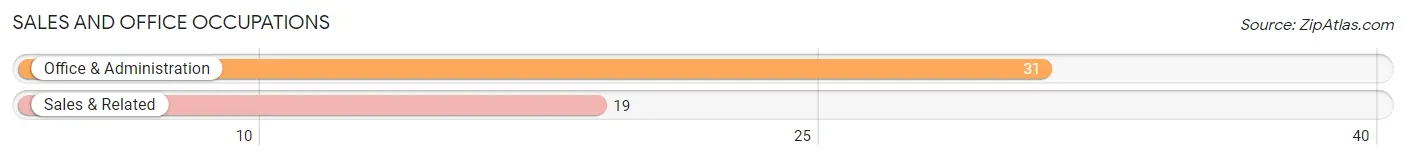
Sales and Office Occupations by Sex
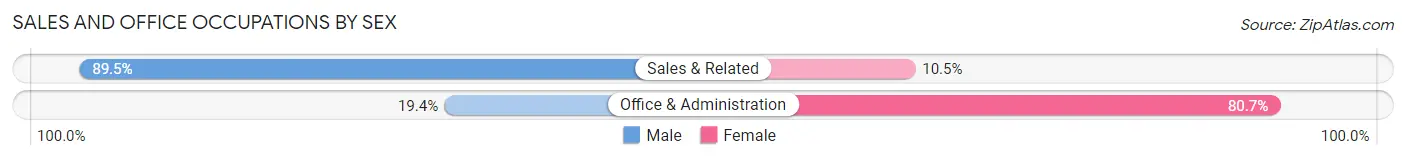
| Occupation | Male | Female |
| Sales & Related | 17 (89.5%) | 2 (10.5%) |
| Office & Administration | 6 (19.4%) | 25 (80.6%) |
| Total (Category) | 23 (46.0%) | 27 (54.0%) |
| Total (Overall) | 83 (53.5%) | 72 (46.5%) |
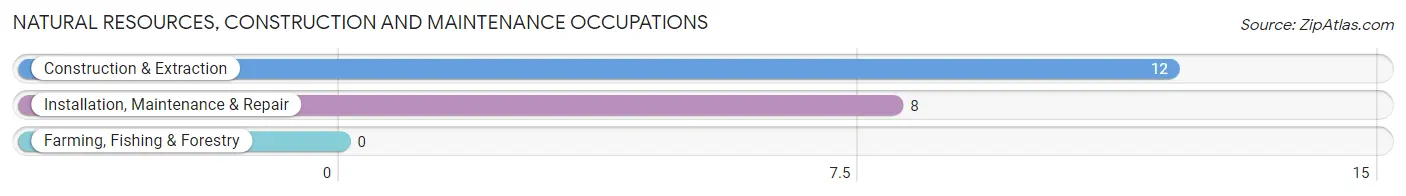
Natural Resources, Construction and Maintenance Occupations
The most common Natural Resources, Construction and Maintenance occupations in Pratt are Construction & Extraction (12 | 7.7%), and Installation, Maintenance & Repair (8 | 5.2%).
Natural Resources, Construction and Maintenance Occupations by Sex
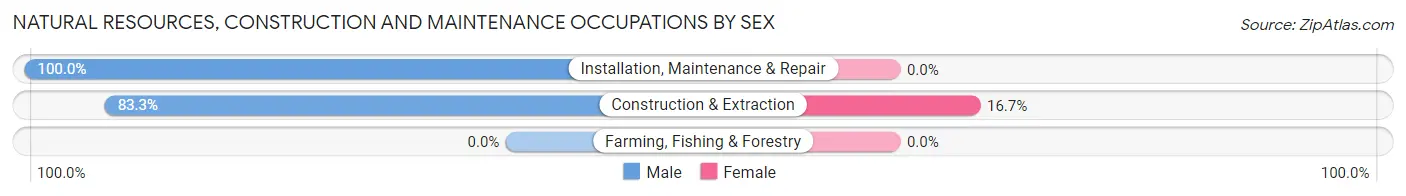
| Occupation | Male | Female |
| Farming, Fishing & Forestry | 0 (0.0%) | 0 (0.0%) |
| Construction & Extraction | 10 (83.3%) | 2 (16.7%) |
| Installation, Maintenance & Repair | 8 (100.0%) | 0 (0.0%) |
| Total (Category) | 18 (90.0%) | 2 (10.0%) |
| Total (Overall) | 83 (53.5%) | 72 (46.5%) |
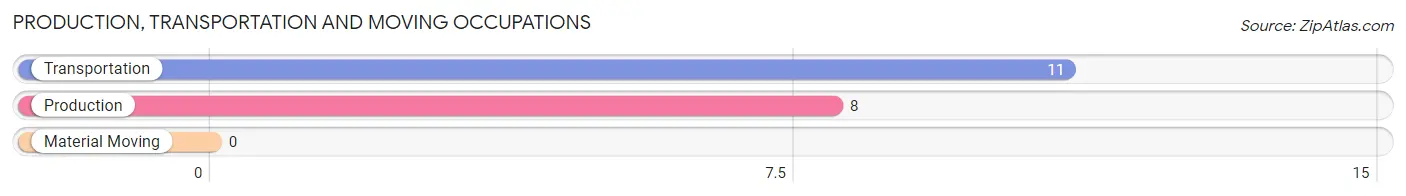
Production, Transportation and Moving Occupations
The most common Production, Transportation and Moving occupations in Pratt are Transportation (11 | 7.1%), and Production (8 | 5.2%).
Production, Transportation and Moving Occupations by Sex
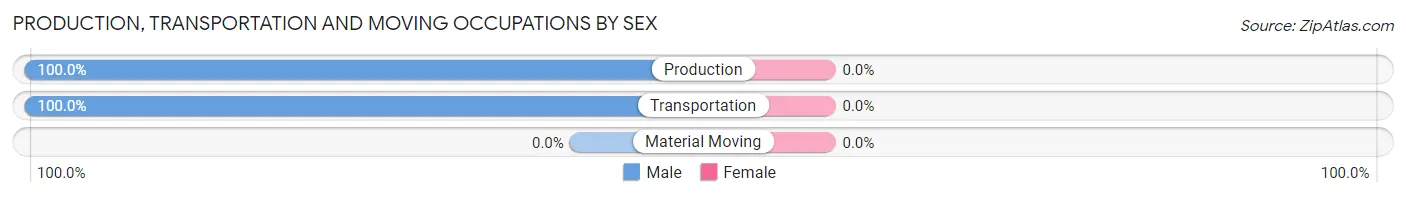
| Occupation | Male | Female |
| Production | 8 (100.0%) | 0 (0.0%) |
| Transportation | 11 (100.0%) | 0 (0.0%) |
| Material Moving | 0 (0.0%) | 0 (0.0%) |
| Total (Category) | 19 (100.0%) | 0 (0.0%) |
| Total (Overall) | 83 (53.5%) | 72 (46.5%) |
Employment Industries by Sex in Pratt
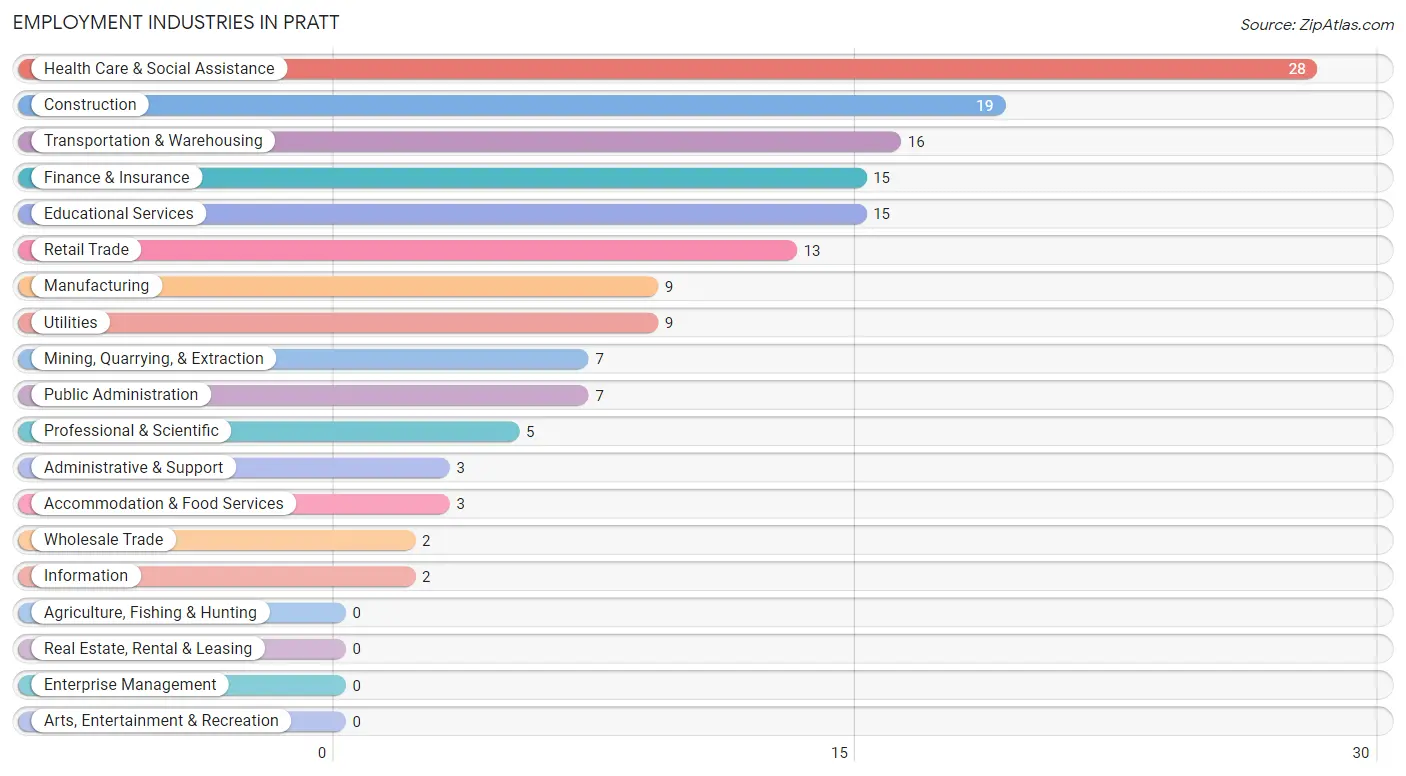
Employment Industries in Pratt
The major employment industries in Pratt include Health Care & Social Assistance (28 | 18.1%), Construction (19 | 12.3%), Transportation & Warehousing (16 | 10.3%), Finance & Insurance (15 | 9.7%), and Educational Services (15 | 9.7%).
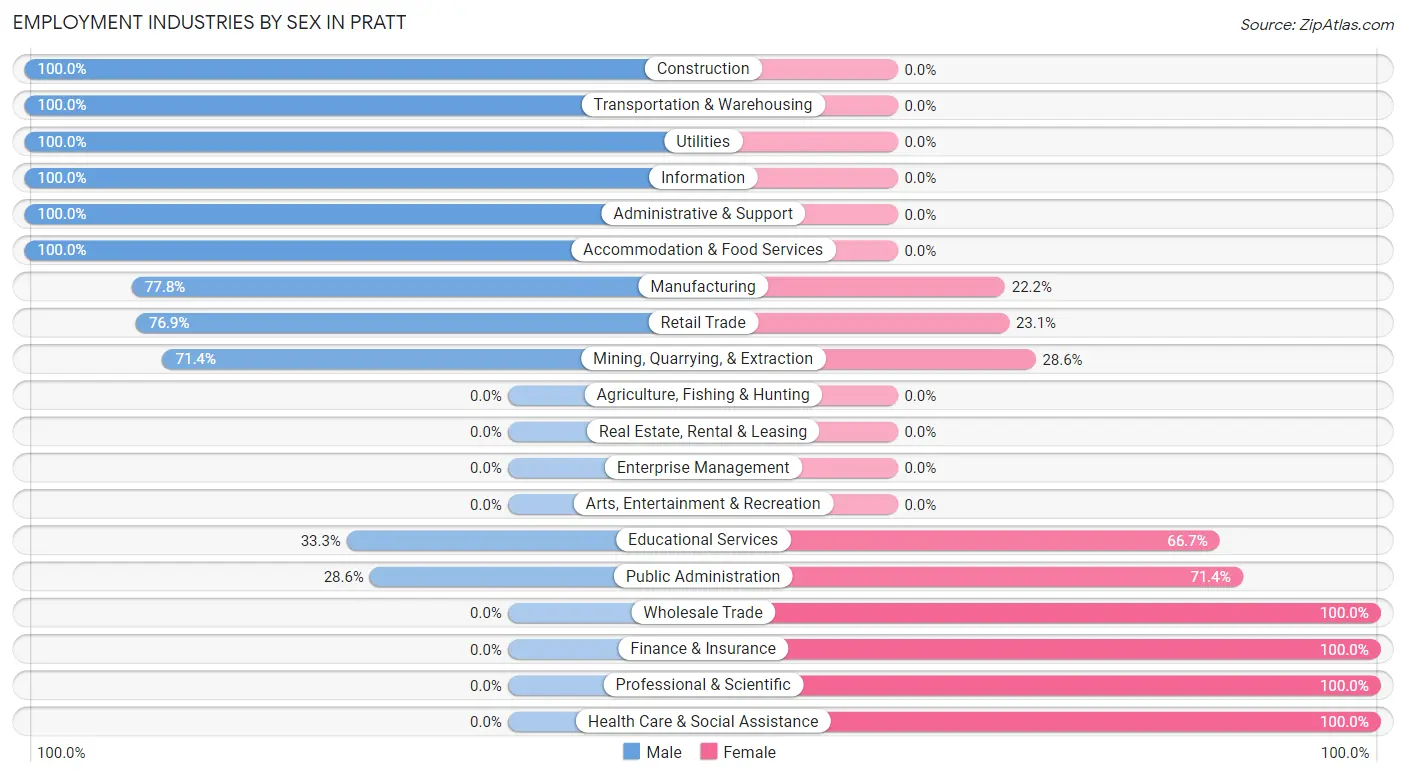
Employment Industries by Sex in Pratt
The Pratt industries that see more men than women are Construction (100.0%), Transportation & Warehousing (100.0%), and Utilities (100.0%), whereas the industries that tend to have a higher number of women are Wholesale Trade (100.0%), Finance & Insurance (100.0%), and Professional & Scientific (100.0%).
| Industry | Male | Female |
| Agriculture, Fishing & Hunting | 0 (0.0%) | 0 (0.0%) |
| Mining, Quarrying, & Extraction | 5 (71.4%) | 2 (28.6%) |
| Construction | 19 (100.0%) | 0 (0.0%) |
| Manufacturing | 7 (77.8%) | 2 (22.2%) |
| Wholesale Trade | 0 (0.0%) | 2 (100.0%) |
| Retail Trade | 10 (76.9%) | 3 (23.1%) |
| Transportation & Warehousing | 16 (100.0%) | 0 (0.0%) |
| Utilities | 9 (100.0%) | 0 (0.0%) |
| Information | 2 (100.0%) | 0 (0.0%) |
| Finance & Insurance | 0 (0.0%) | 15 (100.0%) |
| Real Estate, Rental & Leasing | 0 (0.0%) | 0 (0.0%) |
| Professional & Scientific | 0 (0.0%) | 5 (100.0%) |
| Enterprise Management | 0 (0.0%) | 0 (0.0%) |
| Administrative & Support | 3 (100.0%) | 0 (0.0%) |
| Educational Services | 5 (33.3%) | 10 (66.7%) |
| Health Care & Social Assistance | 0 (0.0%) | 28 (100.0%) |
| Arts, Entertainment & Recreation | 0 (0.0%) | 0 (0.0%) |
| Accommodation & Food Services | 3 (100.0%) | 0 (0.0%) |
| Public Administration | 2 (28.6%) | 5 (71.4%) |
| Total | 83 (53.5%) | 72 (46.5%) |
Education in Pratt
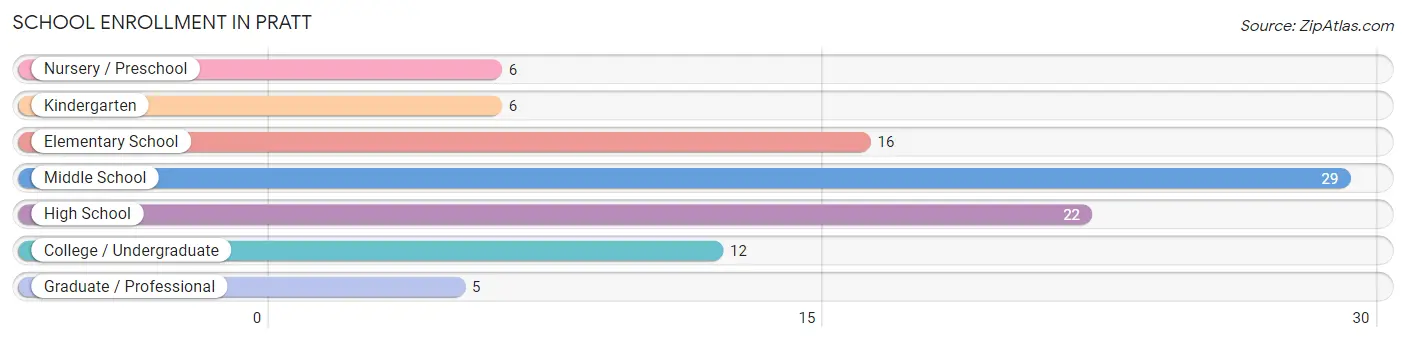
School Enrollment in Pratt
The most common levels of schooling among the 96 students in Pratt are middle school (29 | 30.2%), high school (22 | 22.9%), and elementary school (16 | 16.7%).
| School Level | # Students | % Students |
| Nursery / Preschool | 6 | 6.2% |
| Kindergarten | 6 | 6.2% |
| Elementary School | 16 | 16.7% |
| Middle School | 29 | 30.2% |
| High School | 22 | 22.9% |
| College / Undergraduate | 12 | 12.5% |
| Graduate / Professional | 5 | 5.2% |
| Total | 96 | 100.0% |
School Enrollment by Age by Funding Source in Pratt
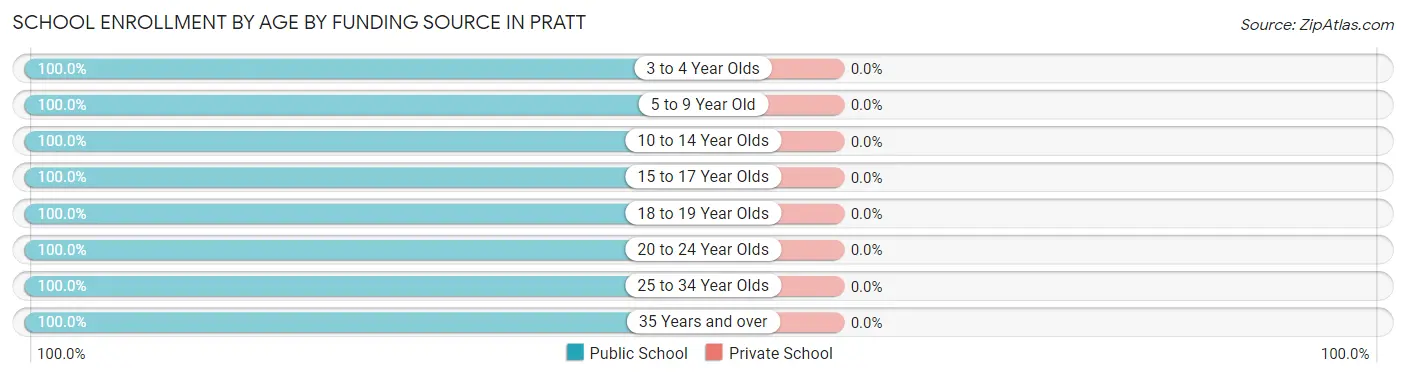
| Age Bracket | Public School | Private School |
| 3 to 4 Year Olds | 6 (100.0%) | 0 (0.0%) |
| 5 to 9 Year Old | 22 (100.0%) | 0 (0.0%) |
| 10 to 14 Year Olds | 29 (100.0%) | 0 (0.0%) |
| 15 to 17 Year Olds | 17 (100.0%) | 0 (0.0%) |
| 18 to 19 Year Olds | 5 (100.0%) | 0 (0.0%) |
| 20 to 24 Year Olds | 3 (100.0%) | 0 (0.0%) |
| 25 to 34 Year Olds | 3 (100.0%) | 0 (0.0%) |
| 35 Years and over | 11 (100.0%) | 0 (0.0%) |
| Total | 96 (100.0%) | 0 (0.0%) |
Educational Attainment by Field of Study in Pratt
Liberal arts & history (16 | 34.0%), business (7 | 14.9%), psychology (6 | 12.8%), education (6 | 12.8%), and science & technology (5 | 10.6%) are the most common fields of study among 47 individuals in Pratt who have obtained a bachelor's degree or higher.
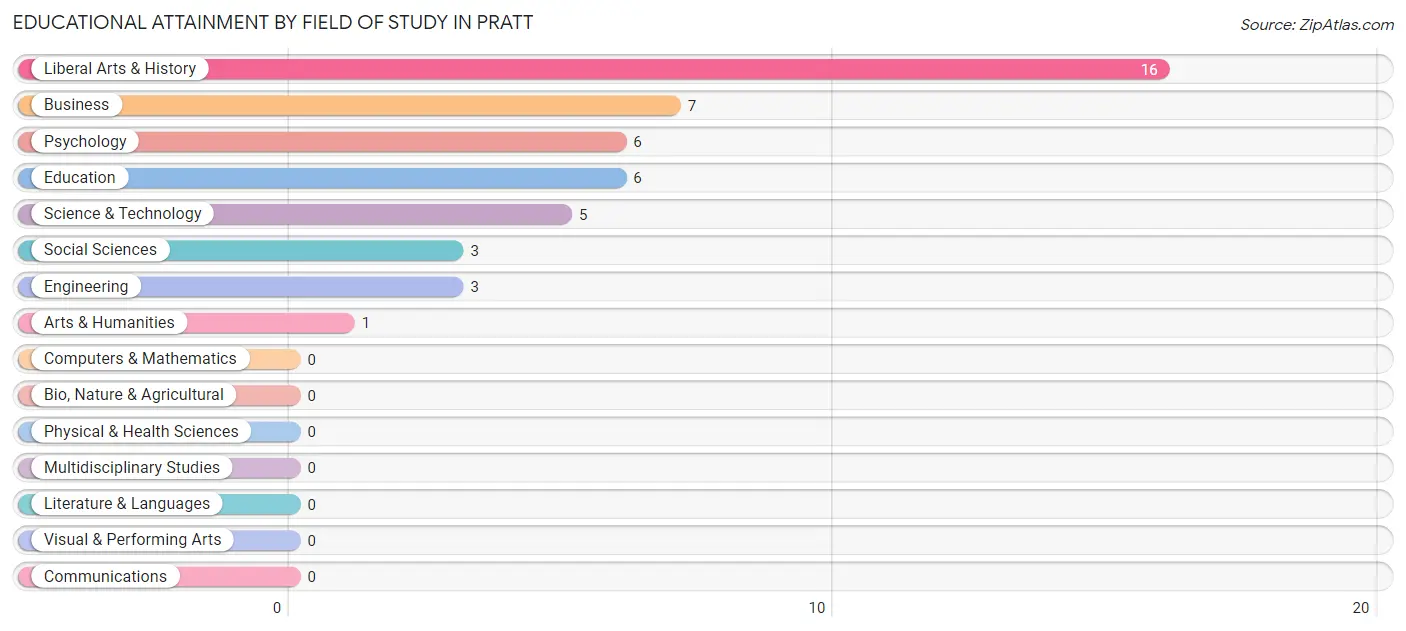
| Field of Study | # Graduates | % Graduates |
| Computers & Mathematics | 0 | 0.0% |
| Bio, Nature & Agricultural | 0 | 0.0% |
| Physical & Health Sciences | 0 | 0.0% |
| Psychology | 6 | 12.8% |
| Social Sciences | 3 | 6.4% |
| Engineering | 3 | 6.4% |
| Multidisciplinary Studies | 0 | 0.0% |
| Science & Technology | 5 | 10.6% |
| Business | 7 | 14.9% |
| Education | 6 | 12.8% |
| Literature & Languages | 0 | 0.0% |
| Liberal Arts & History | 16 | 34.0% |
| Visual & Performing Arts | 0 | 0.0% |
| Communications | 0 | 0.0% |
| Arts & Humanities | 1 | 2.1% |
| Total | 47 | 100.0% |
Transportation & Commute in Pratt
Vehicle Availability by Sex in Pratt
The most prevalent vehicle ownership categories in Pratt are males with 3 vehicles (21, accounting for 24.4%) and females with 3 vehicles (10, making up 29.2%).
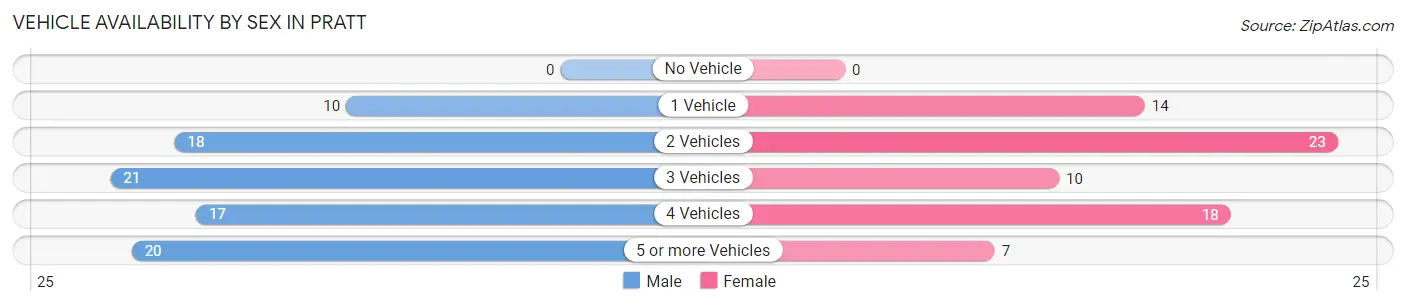
| Vehicles Available | Male | Female |
| No Vehicle | 0 (0.0%) | 0 (0.0%) |
| 1 Vehicle | 10 (11.6%) | 14 (19.4%) |
| 2 Vehicles | 18 (20.9%) | 23 (31.9%) |
| 3 Vehicles | 21 (24.4%) | 10 (13.9%) |
| 4 Vehicles | 17 (19.8%) | 18 (25.0%) |
| 5 or more Vehicles | 20 (23.3%) | 7 (9.7%) |
| Total | 86 (100.0%) | 72 (100.0%) |
Commute Time in Pratt
The most frequently occuring commute durations in Pratt are 30 to 34 minutes (33 commuters, 22.3%), 45 to 59 minutes (25 commuters, 16.9%), and 20 to 24 minutes (16 commuters, 10.8%).
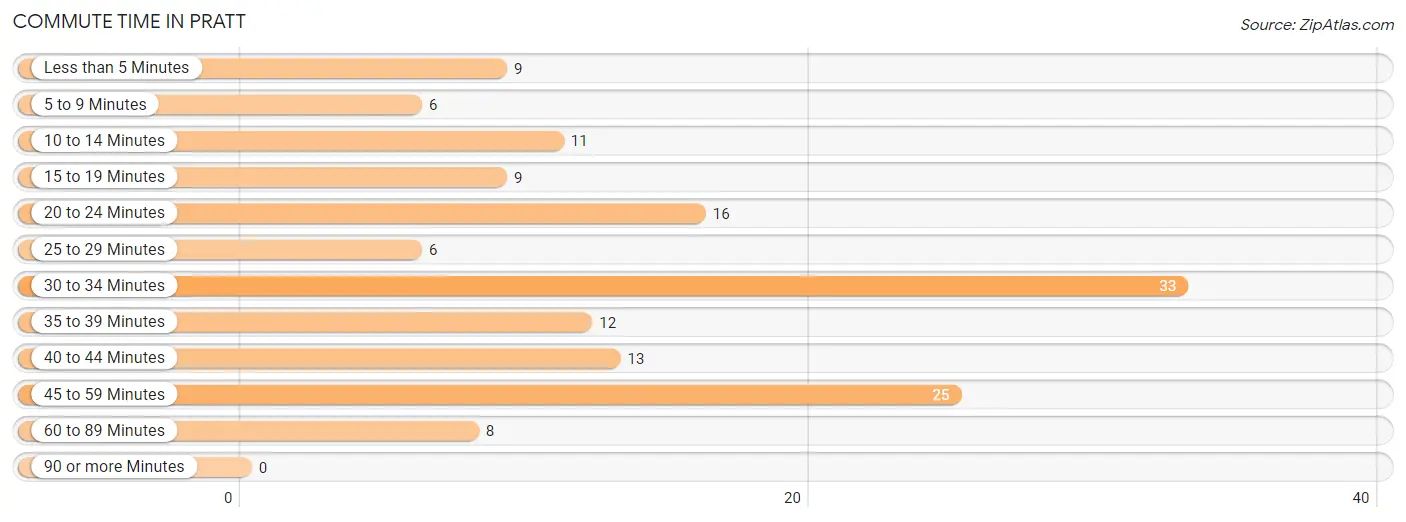
| Commute Time | # Commuters | % Commuters |
| Less than 5 Minutes | 9 | 6.1% |
| 5 to 9 Minutes | 6 | 4.1% |
| 10 to 14 Minutes | 11 | 7.4% |
| 15 to 19 Minutes | 9 | 6.1% |
| 20 to 24 Minutes | 16 | 10.8% |
| 25 to 29 Minutes | 6 | 4.1% |
| 30 to 34 Minutes | 33 | 22.3% |
| 35 to 39 Minutes | 12 | 8.1% |
| 40 to 44 Minutes | 13 | 8.8% |
| 45 to 59 Minutes | 25 | 16.9% |
| 60 to 89 Minutes | 8 | 5.4% |
| 90 or more Minutes | 0 | 0.0% |
Commute Time by Sex in Pratt
The most common commute times in Pratt are 30 to 34 minutes (19 commuters, 22.9%) for males and 30 to 34 minutes (14 commuters, 21.5%) for females.
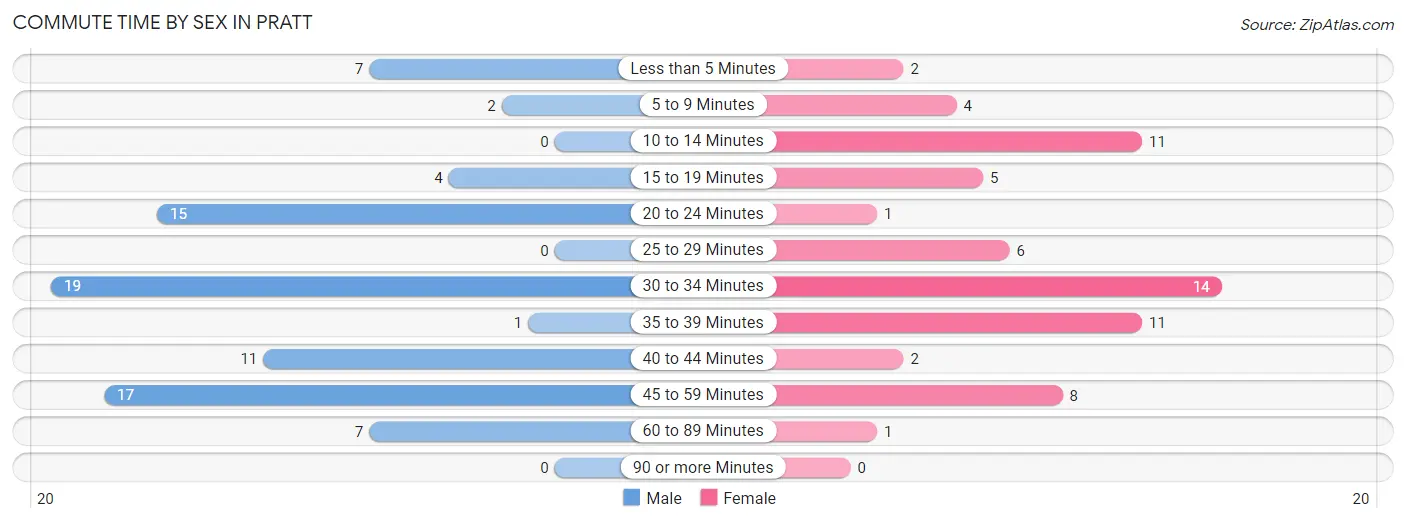
| Commute Time | Male | Female |
| Less than 5 Minutes | 7 (8.4%) | 2 (3.1%) |
| 5 to 9 Minutes | 2 (2.4%) | 4 (6.1%) |
| 10 to 14 Minutes | 0 (0.0%) | 11 (16.9%) |
| 15 to 19 Minutes | 4 (4.8%) | 5 (7.7%) |
| 20 to 24 Minutes | 15 (18.1%) | 1 (1.5%) |
| 25 to 29 Minutes | 0 (0.0%) | 6 (9.2%) |
| 30 to 34 Minutes | 19 (22.9%) | 14 (21.5%) |
| 35 to 39 Minutes | 1 (1.2%) | 11 (16.9%) |
| 40 to 44 Minutes | 11 (13.3%) | 2 (3.1%) |
| 45 to 59 Minutes | 17 (20.5%) | 8 (12.3%) |
| 60 to 89 Minutes | 7 (8.4%) | 1 (1.5%) |
| 90 or more Minutes | 0 (0.0%) | 0 (0.0%) |
Time of Departure to Work by Sex in Pratt
The most frequent times of departure to work in Pratt are 12:00 AM to 4:59 AM (26, 31.3%) for males and 7:30 AM to 7:59 AM (20, 30.8%) for females.
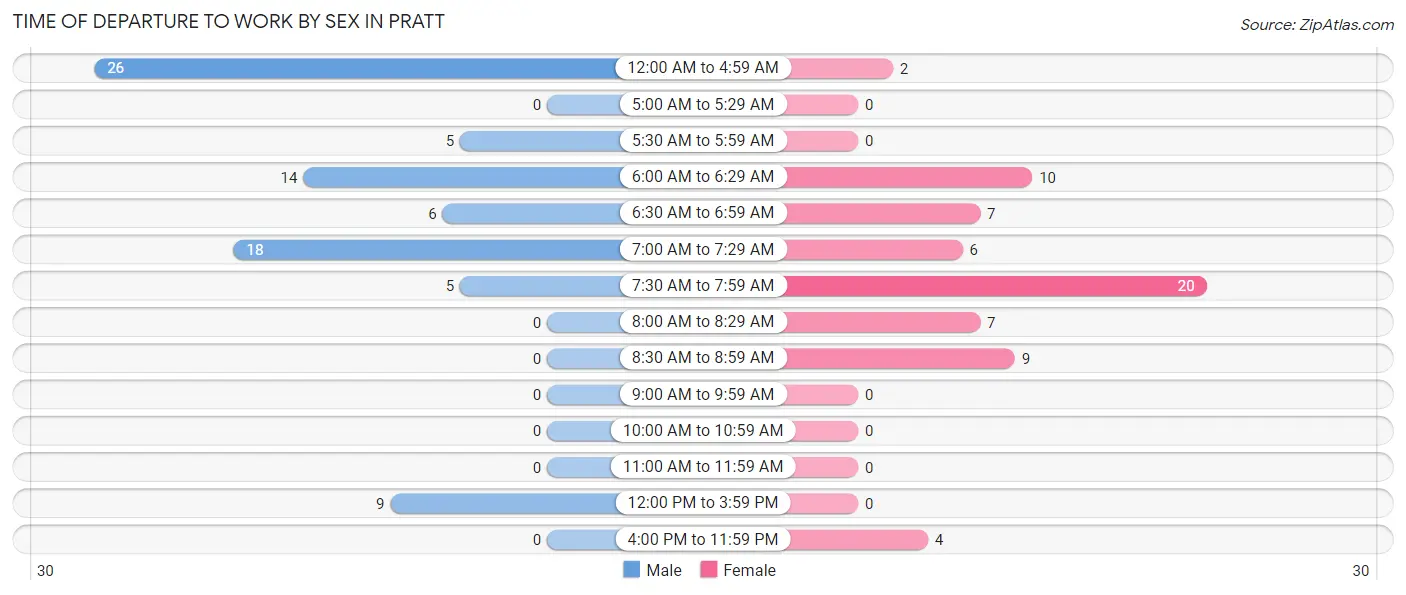
| Time of Departure | Male | Female |
| 12:00 AM to 4:59 AM | 26 (31.3%) | 2 (3.1%) |
| 5:00 AM to 5:29 AM | 0 (0.0%) | 0 (0.0%) |
| 5:30 AM to 5:59 AM | 5 (6.0%) | 0 (0.0%) |
| 6:00 AM to 6:29 AM | 14 (16.9%) | 10 (15.4%) |
| 6:30 AM to 6:59 AM | 6 (7.2%) | 7 (10.8%) |
| 7:00 AM to 7:29 AM | 18 (21.7%) | 6 (9.2%) |
| 7:30 AM to 7:59 AM | 5 (6.0%) | 20 (30.8%) |
| 8:00 AM to 8:29 AM | 0 (0.0%) | 7 (10.8%) |
| 8:30 AM to 8:59 AM | 0 (0.0%) | 9 (13.9%) |
| 9:00 AM to 9:59 AM | 0 (0.0%) | 0 (0.0%) |
| 10:00 AM to 10:59 AM | 0 (0.0%) | 0 (0.0%) |
| 11:00 AM to 11:59 AM | 0 (0.0%) | 0 (0.0%) |
| 12:00 PM to 3:59 PM | 9 (10.8%) | 0 (0.0%) |
| 4:00 PM to 11:59 PM | 0 (0.0%) | 4 (6.1%) |
| Total | 83 (100.0%) | 65 (100.0%) |
Housing Occupancy in Pratt
Occupancy by Ownership in Pratt
Of the total 145 dwellings in Pratt, owner-occupied units account for 110 (75.9%), while renter-occupied units make up 35 (24.1%).
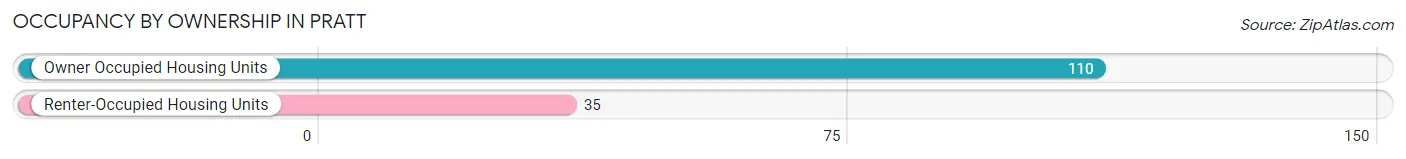
| Occupancy | # Housing Units | % Housing Units |
| Owner Occupied Housing Units | 110 | 75.9% |
| Renter-Occupied Housing Units | 35 | 24.1% |
| Total Occupied Housing Units | 145 | 100.0% |
Occupancy by Household Size in Pratt
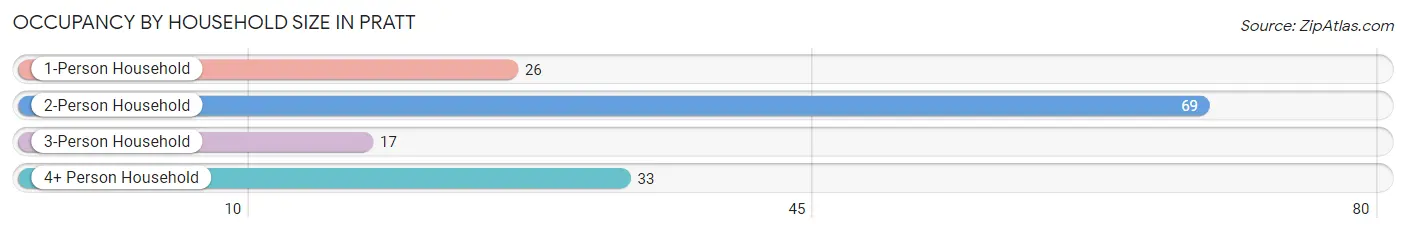
| Household Size | # Housing Units | % Housing Units |
| 1-Person Household | 26 | 17.9% |
| 2-Person Household | 69 | 47.6% |
| 3-Person Household | 17 | 11.7% |
| 4+ Person Household | 33 | 22.8% |
| Total Housing Units | 145 | 100.0% |
Occupancy by Ownership by Household Size in Pratt
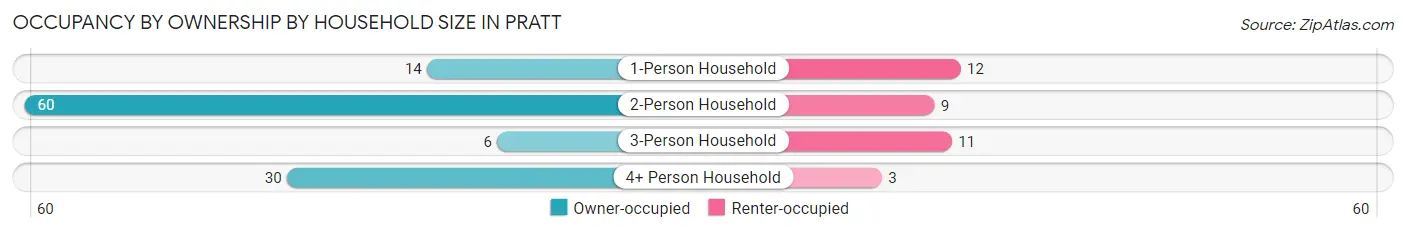
| Household Size | Owner-occupied | Renter-occupied |
| 1-Person Household | 14 (53.8%) | 12 (46.2%) |
| 2-Person Household | 60 (87.0%) | 9 (13.0%) |
| 3-Person Household | 6 (35.3%) | 11 (64.7%) |
| 4+ Person Household | 30 (90.9%) | 3 (9.1%) |
| Total Housing Units | 110 (75.9%) | 35 (24.1%) |
Occupancy by Educational Attainment in Pratt
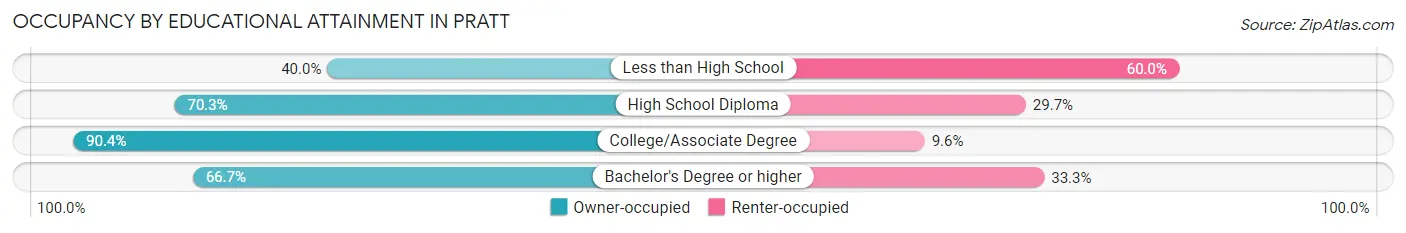
| Household Size | Owner-occupied | Renter-occupied |
| Less than High School | 2 (40.0%) | 3 (60.0%) |
| High School Diploma | 45 (70.3%) | 19 (29.7%) |
| College/Associate Degree | 47 (90.4%) | 5 (9.6%) |
| Bachelor's Degree or higher | 16 (66.7%) | 8 (33.3%) |
Occupancy by Age of Householder in Pratt
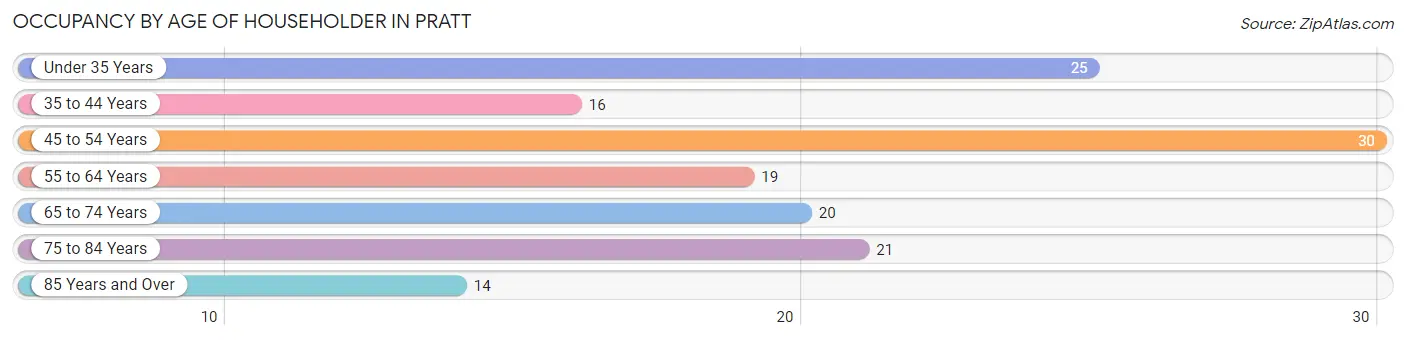
| Age Bracket | # Households | % Households |
| Under 35 Years | 25 | 17.2% |
| 35 to 44 Years | 16 | 11.0% |
| 45 to 54 Years | 30 | 20.7% |
| 55 to 64 Years | 19 | 13.1% |
| 65 to 74 Years | 20 | 13.8% |
| 75 to 84 Years | 21 | 14.5% |
| 85 Years and Over | 14 | 9.7% |
| Total | 145 | 100.0% |
Housing Finances in Pratt
Median Income by Occupancy in Pratt
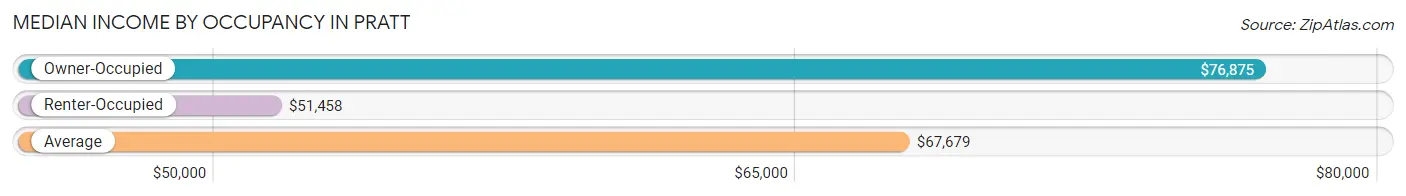
| Occupancy Type | # Households | Median Income |
| Owner-Occupied | 110 (75.9%) | $76,875 |
| Renter-Occupied | 35 (24.1%) | $51,458 |
| Average | 145 (100.0%) | $67,679 |
Occupancy by Householder Income Bracket in Pratt
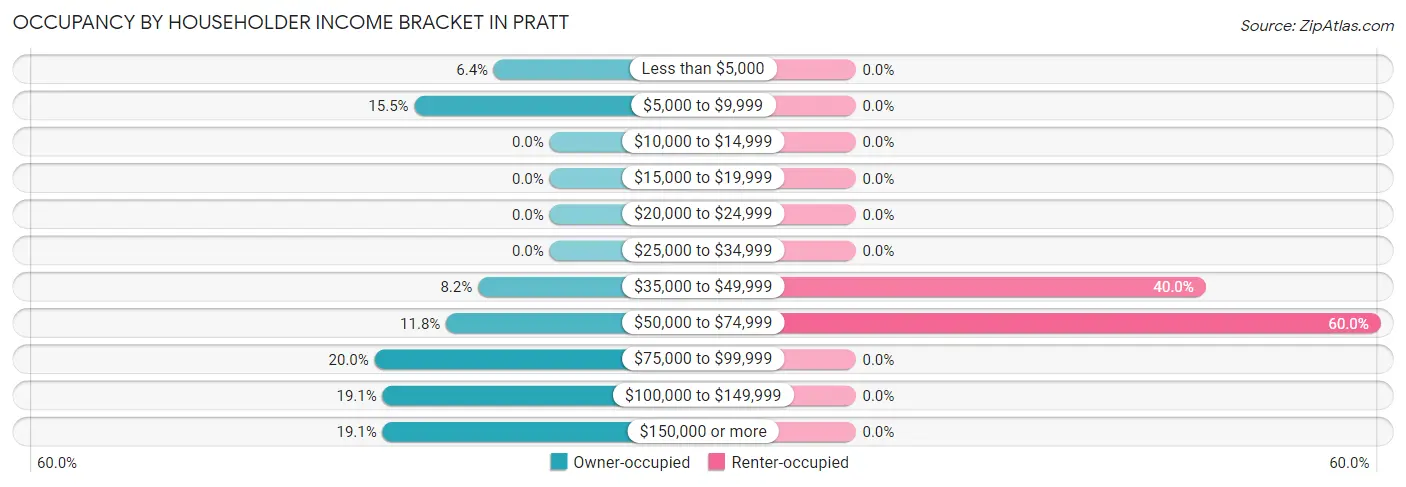
| Income Bracket | Owner-occupied | Renter-occupied |
| Less than $5,000 | 7 (6.4%) | 0 (0.0%) |
| $5,000 to $9,999 | 17 (15.4%) | 0 (0.0%) |
| $10,000 to $14,999 | 0 (0.0%) | 0 (0.0%) |
| $15,000 to $19,999 | 0 (0.0%) | 0 (0.0%) |
| $20,000 to $24,999 | 0 (0.0%) | 0 (0.0%) |
| $25,000 to $34,999 | 0 (0.0%) | 0 (0.0%) |
| $35,000 to $49,999 | 9 (8.2%) | 14 (40.0%) |
| $50,000 to $74,999 | 13 (11.8%) | 21 (60.0%) |
| $75,000 to $99,999 | 22 (20.0%) | 0 (0.0%) |
| $100,000 to $149,999 | 21 (19.1%) | 0 (0.0%) |
| $150,000 or more | 21 (19.1%) | 0 (0.0%) |
| Total | 110 (100.0%) | 35 (100.0%) |
Monthly Housing Cost Tiers in Pratt
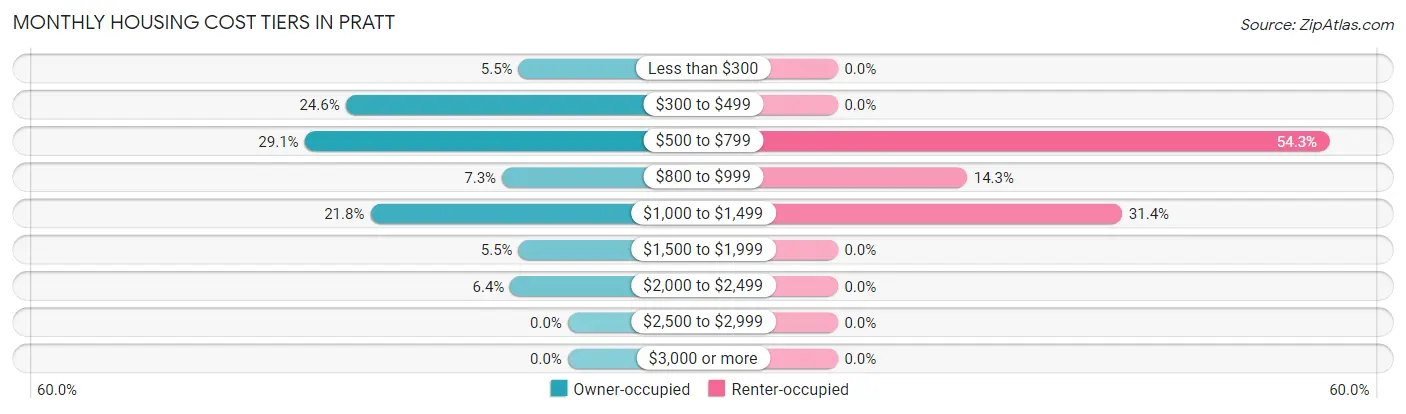
| Monthly Cost | Owner-occupied | Renter-occupied |
| Less than $300 | 6 (5.4%) | 0 (0.0%) |
| $300 to $499 | 27 (24.5%) | 0 (0.0%) |
| $500 to $799 | 32 (29.1%) | 19 (54.3%) |
| $800 to $999 | 8 (7.3%) | 5 (14.3%) |
| $1,000 to $1,499 | 24 (21.8%) | 11 (31.4%) |
| $1,500 to $1,999 | 6 (5.4%) | 0 (0.0%) |
| $2,000 to $2,499 | 7 (6.4%) | 0 (0.0%) |
| $2,500 to $2,999 | 0 (0.0%) | 0 (0.0%) |
| $3,000 or more | 0 (0.0%) | 0 (0.0%) |
| Total | 110 (100.0%) | 35 (100.0%) |
Physical Housing Characteristics in Pratt
Housing Structures in Pratt
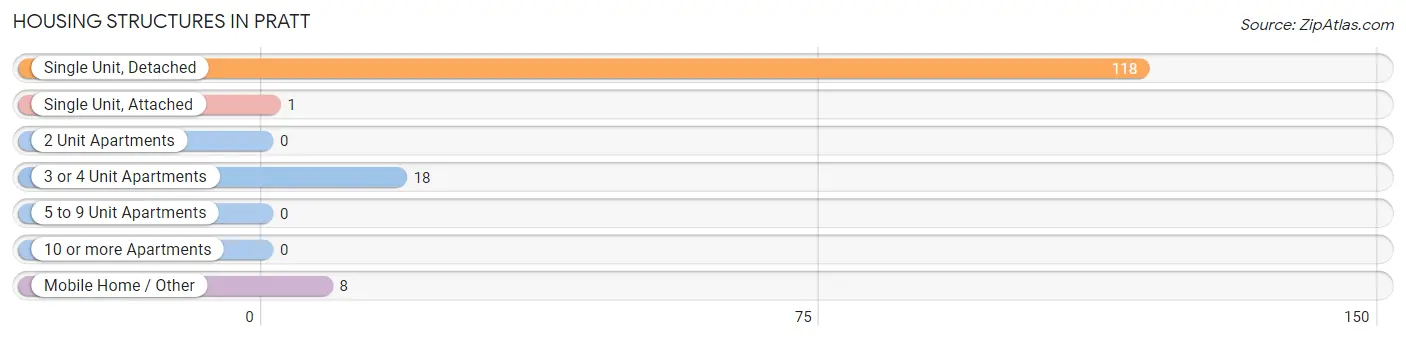
| Structure Type | # Housing Units | % Housing Units |
| Single Unit, Detached | 118 | 81.4% |
| Single Unit, Attached | 1 | 0.7% |
| 2 Unit Apartments | 0 | 0.0% |
| 3 or 4 Unit Apartments | 18 | 12.4% |
| 5 to 9 Unit Apartments | 0 | 0.0% |
| 10 or more Apartments | 0 | 0.0% |
| Mobile Home / Other | 8 | 5.5% |
| Total | 145 | 100.0% |
Housing Structures by Occupancy in Pratt
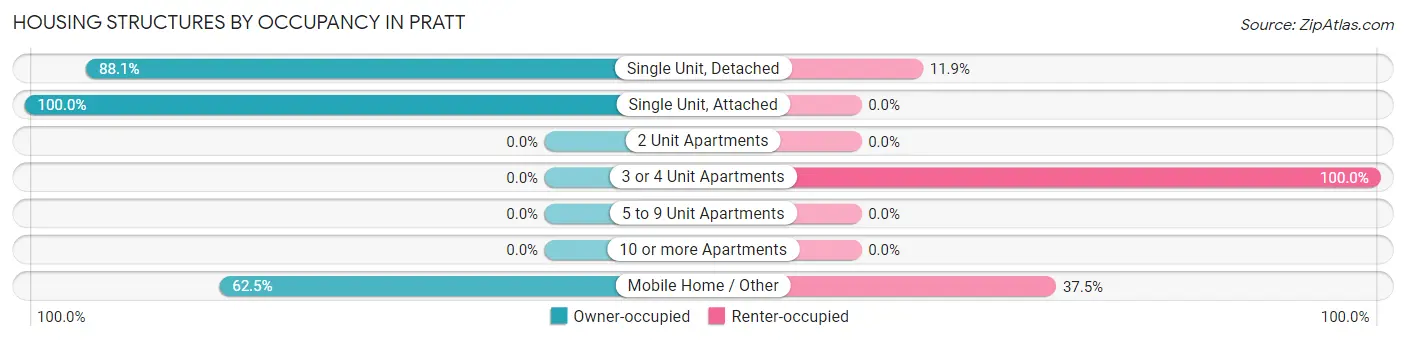
| Structure Type | Owner-occupied | Renter-occupied |
| Single Unit, Detached | 104 (88.1%) | 14 (11.9%) |
| Single Unit, Attached | 1 (100.0%) | 0 (0.0%) |
| 2 Unit Apartments | 0 (0.0%) | 0 (0.0%) |
| 3 or 4 Unit Apartments | 0 (0.0%) | 18 (100.0%) |
| 5 to 9 Unit Apartments | 0 (0.0%) | 0 (0.0%) |
| 10 or more Apartments | 0 (0.0%) | 0 (0.0%) |
| Mobile Home / Other | 5 (62.5%) | 3 (37.5%) |
| Total | 110 (75.9%) | 35 (24.1%) |
Housing Structures by Number of Rooms in Pratt
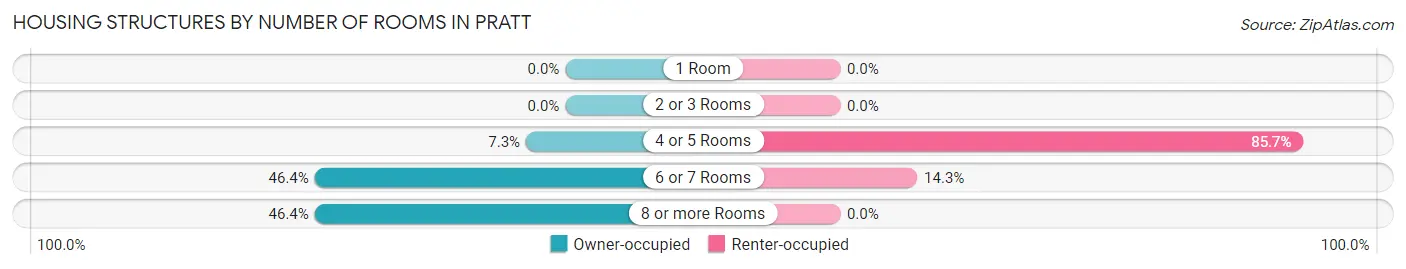
| Number of Rooms | Owner-occupied | Renter-occupied |
| 1 Room | 0 (0.0%) | 0 (0.0%) |
| 2 or 3 Rooms | 0 (0.0%) | 0 (0.0%) |
| 4 or 5 Rooms | 8 (7.3%) | 30 (85.7%) |
| 6 or 7 Rooms | 51 (46.4%) | 5 (14.3%) |
| 8 or more Rooms | 51 (46.4%) | 0 (0.0%) |
| Total | 110 (100.0%) | 35 (100.0%) |
Housing Structure by Heating Type in Pratt
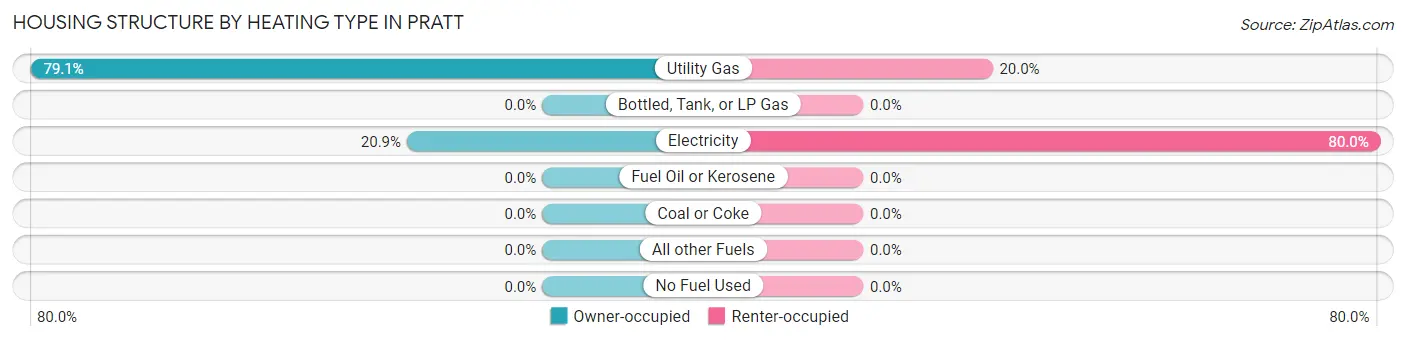
| Heating Type | Owner-occupied | Renter-occupied |
| Utility Gas | 87 (79.1%) | 7 (20.0%) |
| Bottled, Tank, or LP Gas | 0 (0.0%) | 0 (0.0%) |
| Electricity | 23 (20.9%) | 28 (80.0%) |
| Fuel Oil or Kerosene | 0 (0.0%) | 0 (0.0%) |
| Coal or Coke | 0 (0.0%) | 0 (0.0%) |
| All other Fuels | 0 (0.0%) | 0 (0.0%) |
| No Fuel Used | 0 (0.0%) | 0 (0.0%) |
| Total | 110 (100.0%) | 35 (100.0%) |
Household Vehicle Usage in Pratt
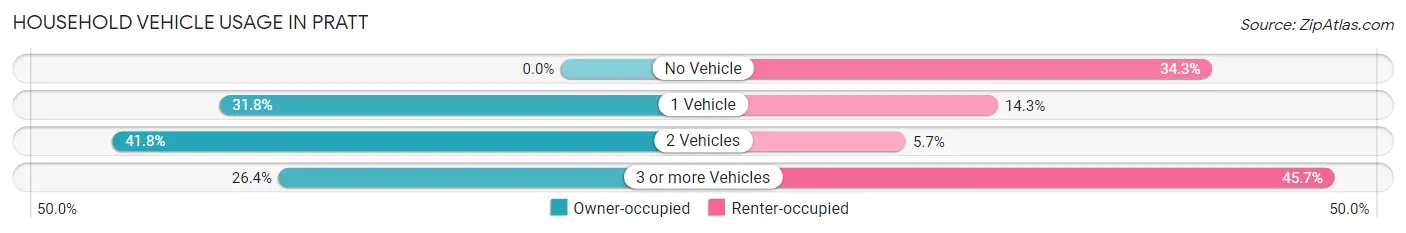
| Vehicles per Household | Owner-occupied | Renter-occupied |
| No Vehicle | 0 (0.0%) | 12 (34.3%) |
| 1 Vehicle | 35 (31.8%) | 5 (14.3%) |
| 2 Vehicles | 46 (41.8%) | 2 (5.7%) |
| 3 or more Vehicles | 29 (26.4%) | 16 (45.7%) |
| Total | 110 (100.0%) | 35 (100.0%) |
Real Estate & Mortgages in Pratt
Real Estate and Mortgage Overview in Pratt
| Characteristic | Without Mortgage | With Mortgage |
| Housing Units | 64 | 46 |
| Median Property Value | $118,300 | $0 |
| Median Household Income | $75,500 | $9 |
| Monthly Housing Costs | $493 | $0 |
| Real Estate Taxes | $710 | $0 |
Property Value by Mortgage Status in Pratt
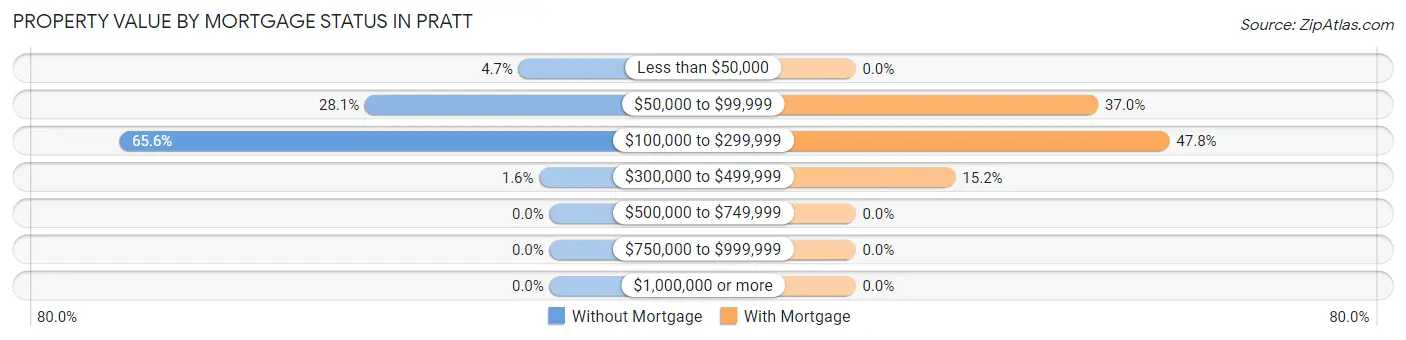
| Property Value | Without Mortgage | With Mortgage |
| Less than $50,000 | 3 (4.7%) | 0 (0.0%) |
| $50,000 to $99,999 | 18 (28.1%) | 17 (37.0%) |
| $100,000 to $299,999 | 42 (65.6%) | 22 (47.8%) |
| $300,000 to $499,999 | 1 (1.6%) | 7 (15.2%) |
| $500,000 to $749,999 | 0 (0.0%) | 0 (0.0%) |
| $750,000 to $999,999 | 0 (0.0%) | 0 (0.0%) |
| $1,000,000 or more | 0 (0.0%) | 0 (0.0%) |
| Total | 64 (100.0%) | 46 (100.0%) |
Household Income by Mortgage Status in Pratt
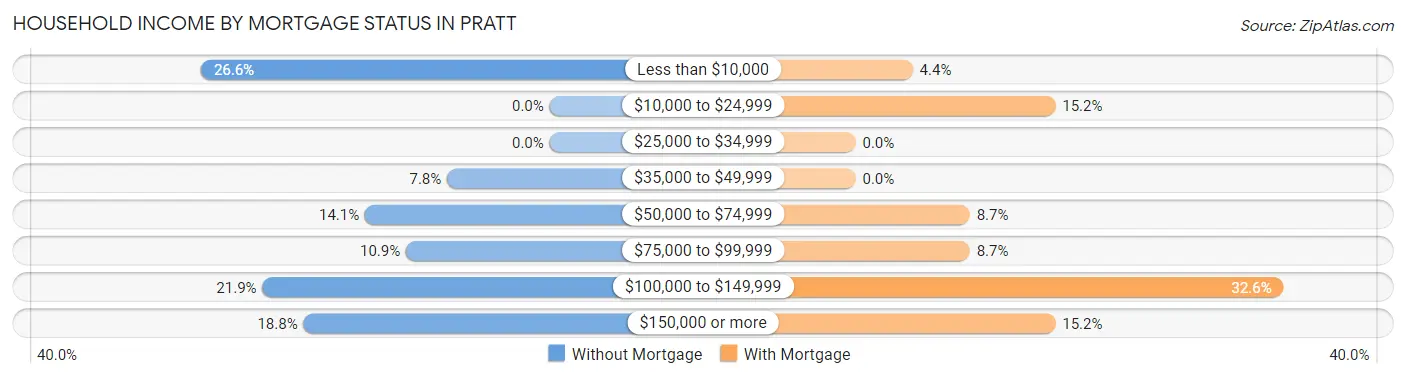
| Household Income | Without Mortgage | With Mortgage |
| Less than $10,000 | 17 (26.6%) | 2 (4.3%) |
| $10,000 to $24,999 | 0 (0.0%) | 7 (15.2%) |
| $25,000 to $34,999 | 0 (0.0%) | 0 (0.0%) |
| $35,000 to $49,999 | 5 (7.8%) | 0 (0.0%) |
| $50,000 to $74,999 | 9 (14.1%) | 4 (8.7%) |
| $75,000 to $99,999 | 7 (10.9%) | 4 (8.7%) |
| $100,000 to $149,999 | 14 (21.9%) | 15 (32.6%) |
| $150,000 or more | 12 (18.8%) | 7 (15.2%) |
| Total | 64 (100.0%) | 46 (100.0%) |
Property Value to Household Income Ratio in Pratt
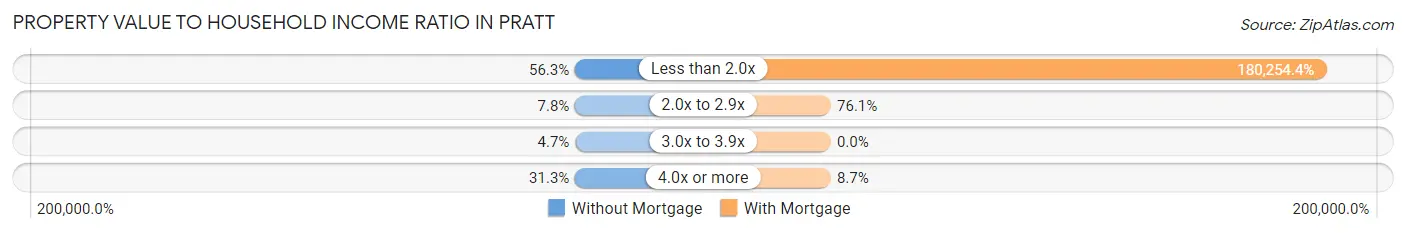
| Value-to-Income Ratio | Without Mortgage | With Mortgage |
| Less than 2.0x | 36 (56.2%) | 82,917 (180,254.3%) |
| 2.0x to 2.9x | 5 (7.8%) | 35 (76.1%) |
| 3.0x to 3.9x | 3 (4.7%) | 0 (0.0%) |
| 4.0x or more | 20 (31.2%) | 4 (8.7%) |
| Total | 64 (100.0%) | 46 (100.0%) |
Real Estate Taxes by Mortgage Status in Pratt
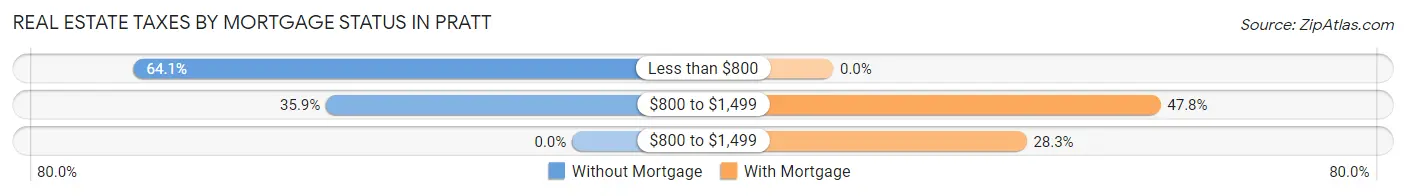
| Property Taxes | Without Mortgage | With Mortgage |
| Less than $800 | 41 (64.1%) | 0 (0.0%) |
| $800 to $1,499 | 23 (35.9%) | 22 (47.8%) |
| $800 to $1,499 | 0 (0.0%) | 13 (28.3%) |
| Total | 64 (100.0%) | 46 (100.0%) |
Health & Disability in Pratt
Health Insurance Coverage by Age in Pratt
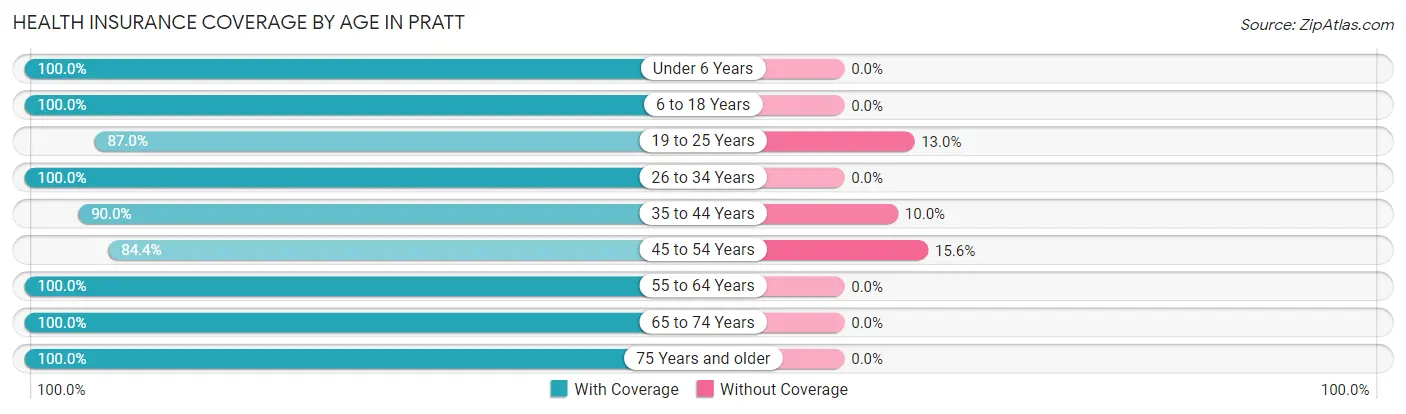
| Age Bracket | With Coverage | Without Coverage |
| Under 6 Years | 29 (100.0%) | 0 (0.0%) |
| 6 to 18 Years | 77 (100.0%) | 0 (0.0%) |
| 19 to 25 Years | 20 (87.0%) | 3 (13.0%) |
| 26 to 34 Years | 41 (100.0%) | 0 (0.0%) |
| 35 to 44 Years | 36 (90.0%) | 4 (10.0%) |
| 45 to 54 Years | 54 (84.4%) | 10 (15.6%) |
| 55 to 64 Years | 39 (100.0%) | 0 (0.0%) |
| 65 to 74 Years | 57 (100.0%) | 0 (0.0%) |
| 75 Years and older | 47 (100.0%) | 0 (0.0%) |
| Total | 400 (95.9%) | 17 (4.1%) |
Health Insurance Coverage by Citizenship Status in Pratt
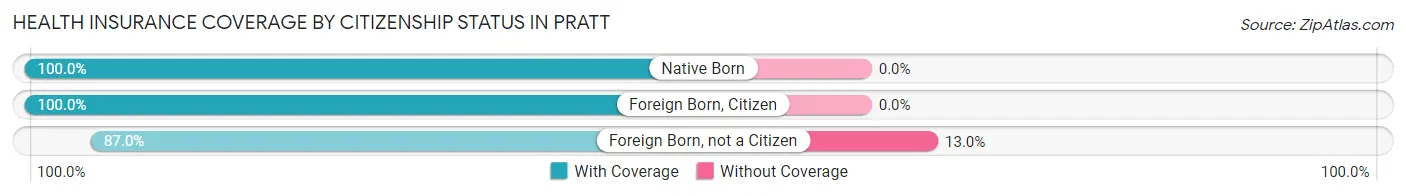
| Citizenship Status | With Coverage | Without Coverage |
| Native Born | 29 (100.0%) | 0 (0.0%) |
| Foreign Born, Citizen | 77 (100.0%) | 0 (0.0%) |
| Foreign Born, not a Citizen | 20 (87.0%) | 3 (13.0%) |
Health Insurance Coverage by Household Income in Pratt
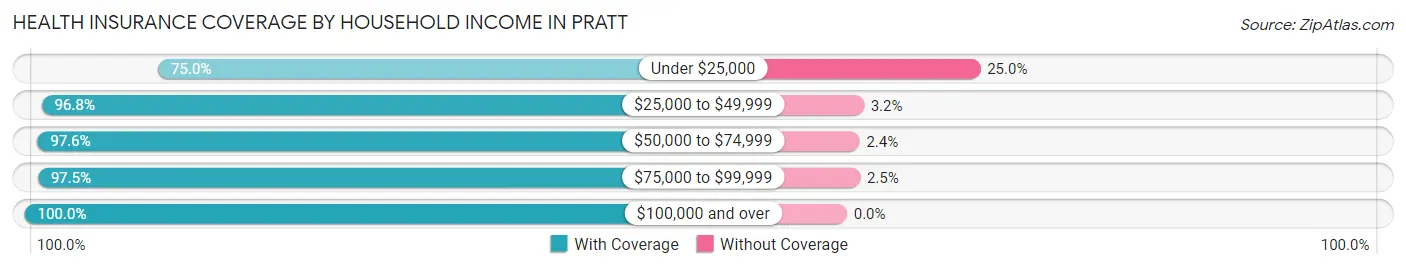
| Household Income | With Coverage | Without Coverage |
| Under $25,000 | 30 (75.0%) | 10 (25.0%) |
| $25,000 to $49,999 | 61 (96.8%) | 2 (3.2%) |
| $50,000 to $74,999 | 123 (97.6%) | 3 (2.4%) |
| $75,000 to $99,999 | 79 (97.5%) | 2 (2.5%) |
| $100,000 and over | 107 (100.0%) | 0 (0.0%) |
Public vs Private Health Insurance Coverage by Age in Pratt
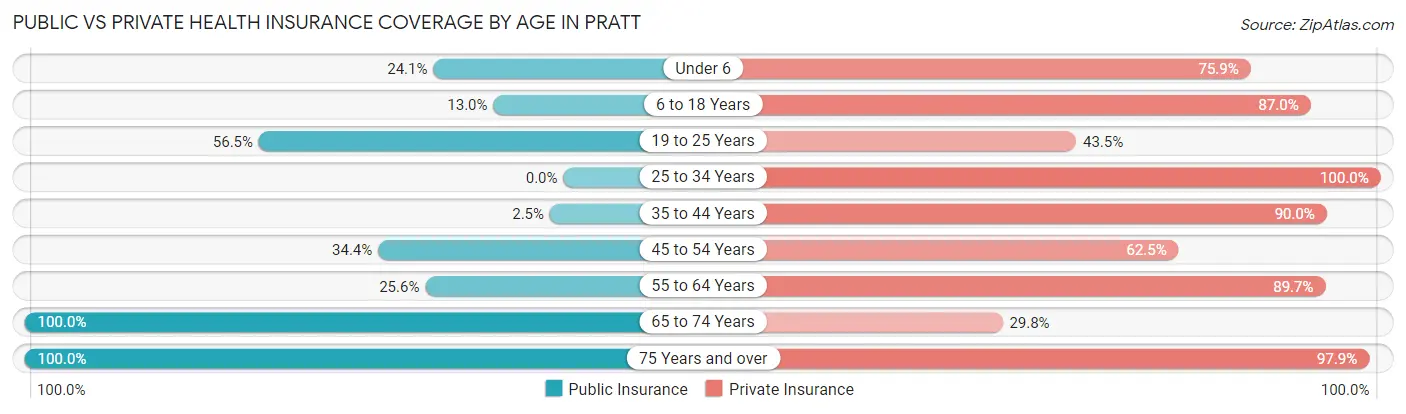
| Age Bracket | Public Insurance | Private Insurance |
| Under 6 | 7 (24.1%) | 22 (75.9%) |
| 6 to 18 Years | 10 (13.0%) | 67 (87.0%) |
| 19 to 25 Years | 13 (56.5%) | 10 (43.5%) |
| 25 to 34 Years | 0 (0.0%) | 41 (100.0%) |
| 35 to 44 Years | 1 (2.5%) | 36 (90.0%) |
| 45 to 54 Years | 22 (34.4%) | 40 (62.5%) |
| 55 to 64 Years | 10 (25.6%) | 35 (89.7%) |
| 65 to 74 Years | 57 (100.0%) | 17 (29.8%) |
| 75 Years and over | 47 (100.0%) | 46 (97.9%) |
| Total | 167 (40.1%) | 314 (75.3%) |
Disability Status by Sex by Age in Pratt
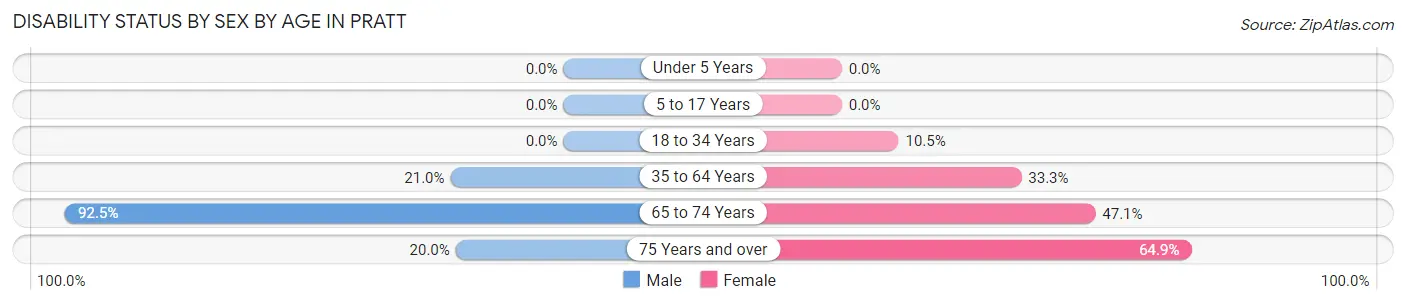
| Age Bracket | Male | Female |
| Under 5 Years | 0 (0.0%) | 0 (0.0%) |
| 5 to 17 Years | 0 (0.0%) | 0 (0.0%) |
| 18 to 34 Years | 0 (0.0%) | 2 (10.5%) |
| 35 to 64 Years | 13 (21.0%) | 27 (33.3%) |
| 65 to 74 Years | 37 (92.5%) | 8 (47.1%) |
| 75 Years and over | 2 (20.0%) | 24 (64.9%) |
Disability Class by Sex by Age in Pratt
Disability Class: Hearing Difficulty
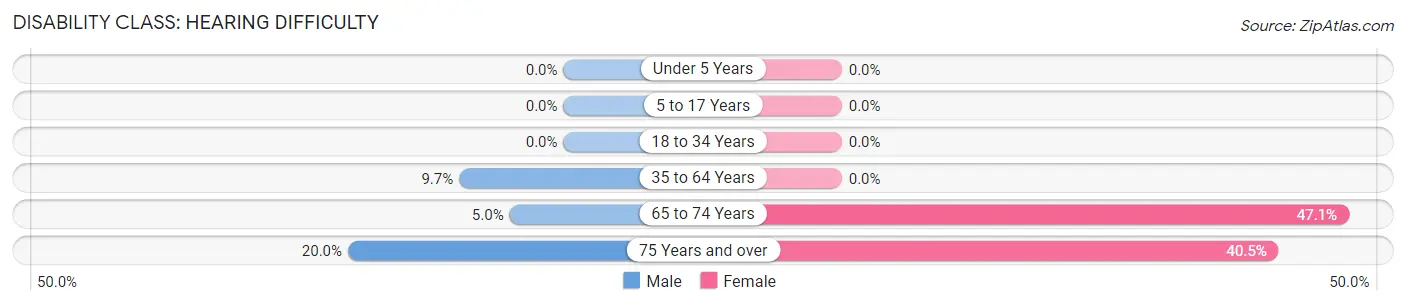
| Age Bracket | Male | Female |
| Under 5 Years | 0 (0.0%) | 0 (0.0%) |
| 5 to 17 Years | 0 (0.0%) | 0 (0.0%) |
| 18 to 34 Years | 0 (0.0%) | 0 (0.0%) |
| 35 to 64 Years | 6 (9.7%) | 0 (0.0%) |
| 65 to 74 Years | 2 (5.0%) | 8 (47.1%) |
| 75 Years and over | 2 (20.0%) | 15 (40.5%) |
Disability Class: Vision Difficulty
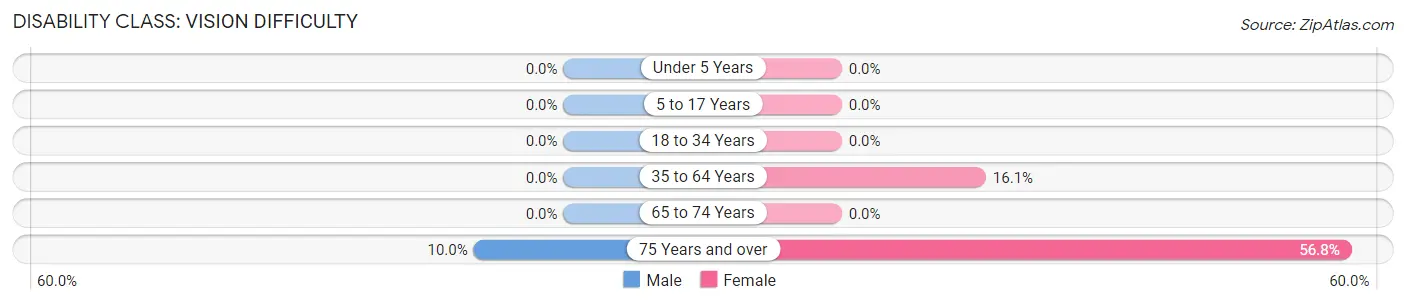
| Age Bracket | Male | Female |
| Under 5 Years | 0 (0.0%) | 0 (0.0%) |
| 5 to 17 Years | 0 (0.0%) | 0 (0.0%) |
| 18 to 34 Years | 0 (0.0%) | 0 (0.0%) |
| 35 to 64 Years | 0 (0.0%) | 13 (16.1%) |
| 65 to 74 Years | 0 (0.0%) | 0 (0.0%) |
| 75 Years and over | 1 (10.0%) | 21 (56.8%) |
Disability Class: Cognitive Difficulty
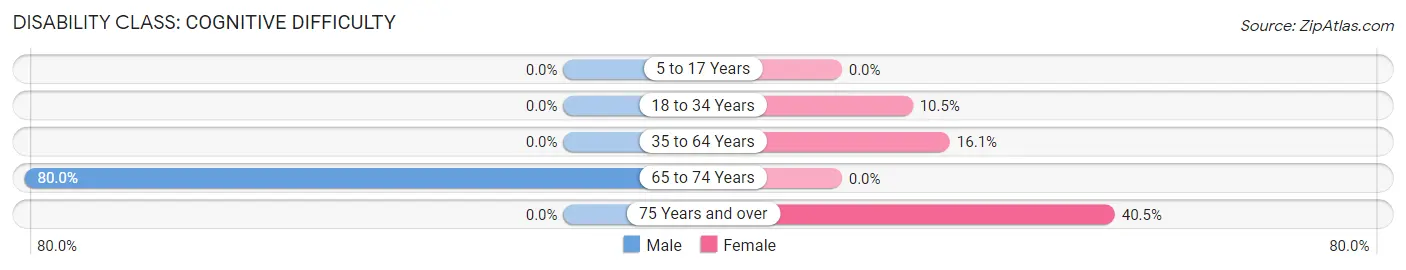
| Age Bracket | Male | Female |
| 5 to 17 Years | 0 (0.0%) | 0 (0.0%) |
| 18 to 34 Years | 0 (0.0%) | 2 (10.5%) |
| 35 to 64 Years | 0 (0.0%) | 13 (16.1%) |
| 65 to 74 Years | 32 (80.0%) | 0 (0.0%) |
| 75 Years and over | 0 (0.0%) | 15 (40.5%) |
Disability Class: Ambulatory Difficulty
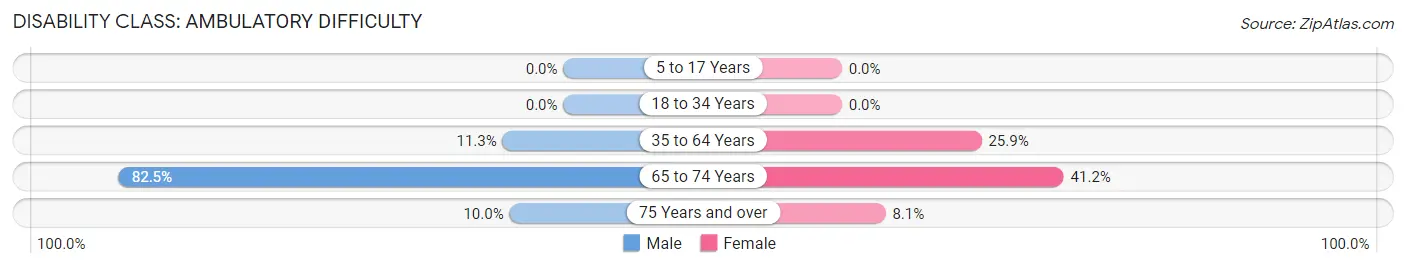
| Age Bracket | Male | Female |
| 5 to 17 Years | 0 (0.0%) | 0 (0.0%) |
| 18 to 34 Years | 0 (0.0%) | 0 (0.0%) |
| 35 to 64 Years | 7 (11.3%) | 21 (25.9%) |
| 65 to 74 Years | 33 (82.5%) | 7 (41.2%) |
| 75 Years and over | 1 (10.0%) | 3 (8.1%) |
Disability Class: Self-Care Difficulty
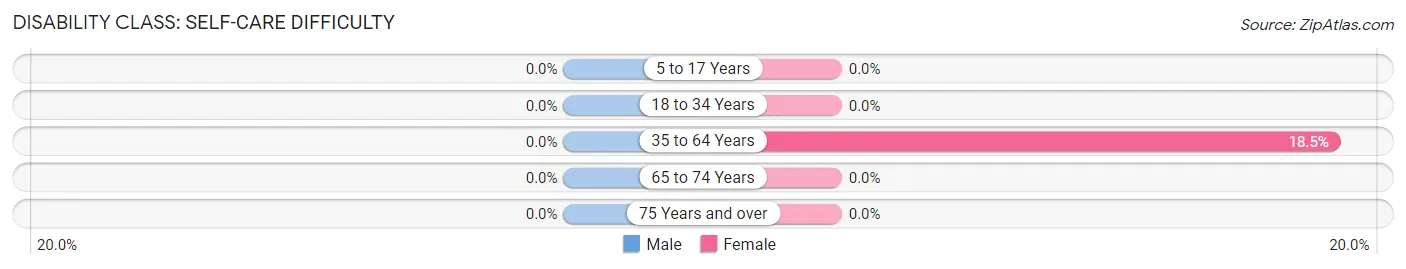
| Age Bracket | Male | Female |
| 5 to 17 Years | 0 (0.0%) | 0 (0.0%) |
| 18 to 34 Years | 0 (0.0%) | 0 (0.0%) |
| 35 to 64 Years | 0 (0.0%) | 15 (18.5%) |
| 65 to 74 Years | 0 (0.0%) | 0 (0.0%) |
| 75 Years and over | 0 (0.0%) | 0 (0.0%) |
Technology Access in Pratt
Computing Device Access in Pratt
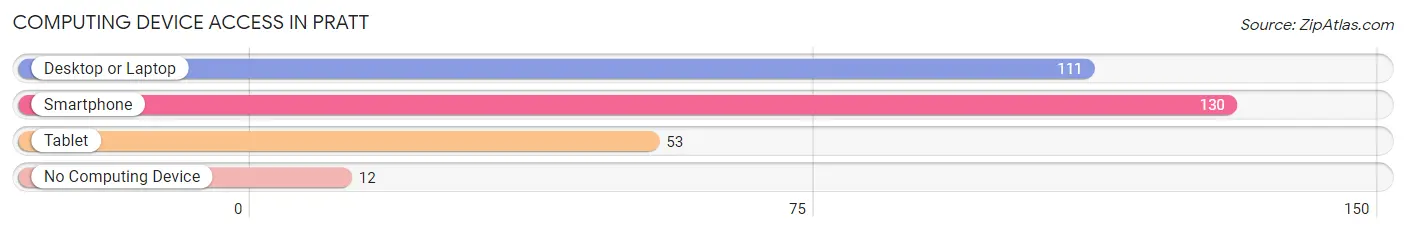
| Device Type | # Households | % Households |
| Desktop or Laptop | 111 | 76.5% |
| Smartphone | 130 | 89.7% |
| Tablet | 53 | 36.5% |
| No Computing Device | 12 | 8.3% |
| Total | 145 | 100.0% |
Internet Access in Pratt
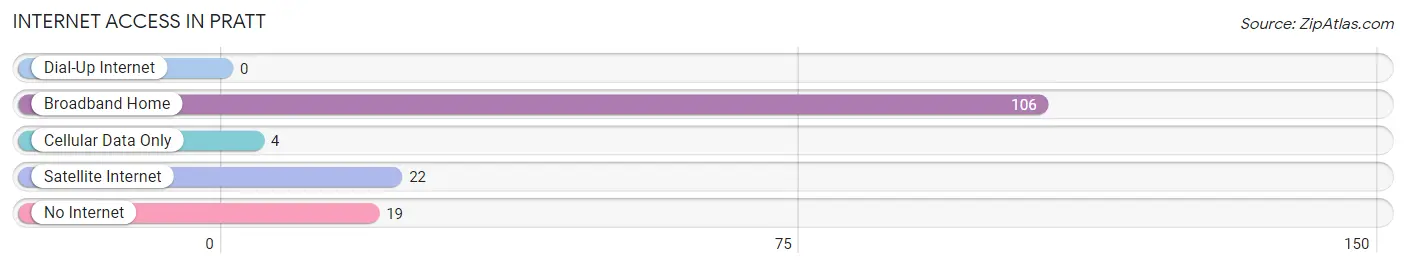
| Internet Type | # Households | % Households |
| Dial-Up Internet | 0 | 0.0% |
| Broadband Home | 106 | 73.1% |
| Cellular Data Only | 4 | 2.8% |
| Satellite Internet | 22 | 15.2% |
| No Internet | 19 | 13.1% |
| Total | 145 | 100.0% |
Pratt Summary
Pratt, West Virginia is a small town located in the Appalachian Mountains of West Virginia. It is situated in the southeastern corner of the state, near the border of Virginia. The town was founded in 1883 and is named after John Pratt, a local landowner. The population of Pratt was 1,845 as of the 2010 census.
Geography
Pratt is located in the Appalachian Mountains of West Virginia, in the southeastern corner of the state. It is situated in the Appalachian Plateau region, which is characterized by rolling hills and valleys. The town is located in the Appalachian Plateau physiographic province, which is part of the larger Appalachian Mountains physiographic region. The town is located in the Appalachian Plateau ecoregion, which is characterized by a temperate climate and abundant natural resources.
The town is located in the Appalachian Plateau ecoregion, which is characterized by a temperate climate and abundant natural resources. The town is located in the Appalachian Plateau ecoregion, which is characterized by a temperate climate and abundant natural resources. The town is located in the Appalachian Plateau ecoregion, which is characterized by a temperate climate and abundant natural resources. The town is located in the Appalachian Plateau ecoregion, which is characterized by a temperate climate and abundant natural resources.
The town is located in the Appalachian Plateau ecoregion, which is characterized by a temperate climate and abundant natural resources. The town is located in the Appalachian Plateau ecoregion, which is characterized by a temperate climate and abundant natural resources. The town is located in the Appalachian Plateau ecoregion, which is characterized by a temperate climate and abundant natural resources. The town is located in the Appalachian Plateau ecoregion, which is characterized by a temperate climate and abundant natural resources.
The town is located in the Appalachian Plateau ecoregion, which is characterized by a temperate climate and abundant natural resources. The town is located in the Appalachian Plateau ecoregion, which is characterized by a temperate climate and abundant natural resources. The town is located in the Appalachian Plateau ecoregion, which is characterized by a temperate climate and abundant natural resources. The town is located in the Appalachian Plateau ecoregion, which is characterized by a temperate climate and abundant natural resources.
Economy
Pratt is a small town with a limited economy. The town is primarily supported by the coal mining industry, which has been a major source of employment for the town since its founding. The town is also home to several small businesses, including a grocery store, a hardware store, and a few restaurants. The town is also home to a small manufacturing plant, which produces plastic products.
The town is also home to a small manufacturing plant, which produces plastic products. The town is also home to a small manufacturing plant, which produces plastic products. The town is also home to a small manufacturing plant, which produces plastic products. The town is also home to a small manufacturing plant, which produces plastic products.
Demographics
As of the 2010 census, the population of Pratt was 1,845. The town is predominantly white, with a population that is 97.3% white and 2.7% African American. The median household income in Pratt is $30,938, which is lower than the national median of $50,046. The median age in Pratt is 41.7, which is slightly higher than the national median of 37.7.
Conclusion
Pratt, West Virginia is a small town located in the Appalachian Mountains of West Virginia. It is situated in the southeastern corner of the state, near the border of Virginia. The town was founded in 1883 and is named after John Pratt, a local landowner. The population of Pratt was 1,845 as of the 2010 census. The town is primarily supported by the coal mining industry, which has been a major source of employment for the town since its founding. The town is also home to several small businesses, including a grocery store, a hardware store, and a few restaurants. The town is predominantly white, with a population that is 97.3% white and 2.7% African American. The median household income in Pratt is $30,938, which is lower than the national median of $50,046. The median age in Pratt is 41.7, which is slightly higher than the national median of 37.7.
Common Questions
What is Per Capita Income in Pratt?
Per Capita income in Pratt is $28,684.
What is the Median Family Income in Pratt?
Median Family Income in Pratt is $76,146.
What is the Median Household income in Pratt?
Median Household Income in Pratt is $67,679.
What is Income or Wage Gap in Pratt?
Income or Wage Gap in Pratt is 5.8%.
Women in Pratt earn 94.2 cents for every dollar earned by a man.
What is Inequality or Gini Index in Pratt?
Inequality or Gini Index in Pratt is 0.40.
What is the Total Population of Pratt?
Total Population of Pratt is 423.
What is the Total Male Population of Pratt?
Total Male Population of Pratt is 225.
What is the Total Female Population of Pratt?
Total Female Population of Pratt is 198.
What is the Ratio of Males per 100 Females in Pratt?
There are 113.64 Males per 100 Females in Pratt.
What is the Ratio of Females per 100 Males in Pratt?
There are 88.00 Females per 100 Males in Pratt.
What is the Median Population Age in Pratt?
Median Population Age in Pratt is 44.6 Years.
What is the Average Family Size in Pratt
Average Family Size in Pratt is 3.3 People.
What is the Average Household Size in Pratt
Average Household Size in Pratt is 2.9 People.
How Large is the Labor Force in Pratt?
There are 180 People in the Labor Forcein in Pratt.
What is the Percentage of People in the Labor Force in Pratt?
52.6% of People are in the Labor Force in Pratt.
What is the Unemployment Rate in Pratt?
Unemployment Rate in Pratt is 10.9%.