Beverly, WV Map & Demographics
Beverly Map
Beverly Overview
$18,141
PER CAPITA INCOME
$39,141
AVG FAMILY INCOME
$30,000
AVG HOUSEHOLD INCOME
48.0%
WAGE / INCOME GAP [ % ]
52.0¢/ $1
WAGE / INCOME GAP [ $ ]
0.48
INEQUALITY / GINI INDEX
681
TOTAL POPULATION
336
MALE POPULATION
345
FEMALE POPULATION
97.39
MALES / 100 FEMALES
102.68
FEMALES / 100 MALES
41.7
MEDIAN AGE
2.9
AVG FAMILY SIZE
2.2
AVG HOUSEHOLD SIZE
199
LABOR FORCE [ PEOPLE ]
38.0%
PERCENT IN LABOR FORCE
7.0%
UNEMPLOYMENT RATE
Beverly Zip Codes
Beverly Area Codes
Income in Beverly
Income Overview in Beverly
Per Capita Income in Beverly is $18,141, while median incomes of families and households are $39,141 and $30,000 respectively.
| Characteristic | Number | Measure |
| Per Capita Income | 681 | $18,141 |
| Median Family Income | 175 | $39,141 |
| Mean Family Income | 175 | $44,467 |
| Median Household Income | 292 | $30,000 |
| Mean Household Income | 292 | $37,262 |
| Income Deficit | 175 | $0 |
| Wage / Income Gap (%) | 681 | 48.02% |
| Wage / Income Gap ($) | 681 | 51.98¢ per $1 |
| Gini / Inequality Index | 681 | 0.48 |
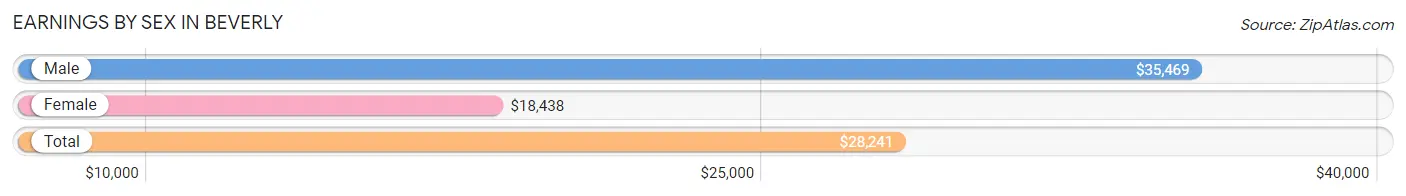
Earnings by Sex in Beverly
Average Earnings in Beverly are $28,241, $35,469 for men and $18,438 for women, a difference of 48.0%.
| Sex | Number | Average Earnings |
| Male | 113 (52.8%) | $35,469 |
| Female | 101 (47.2%) | $18,438 |
| Total | 214 (100.0%) | $28,241 |
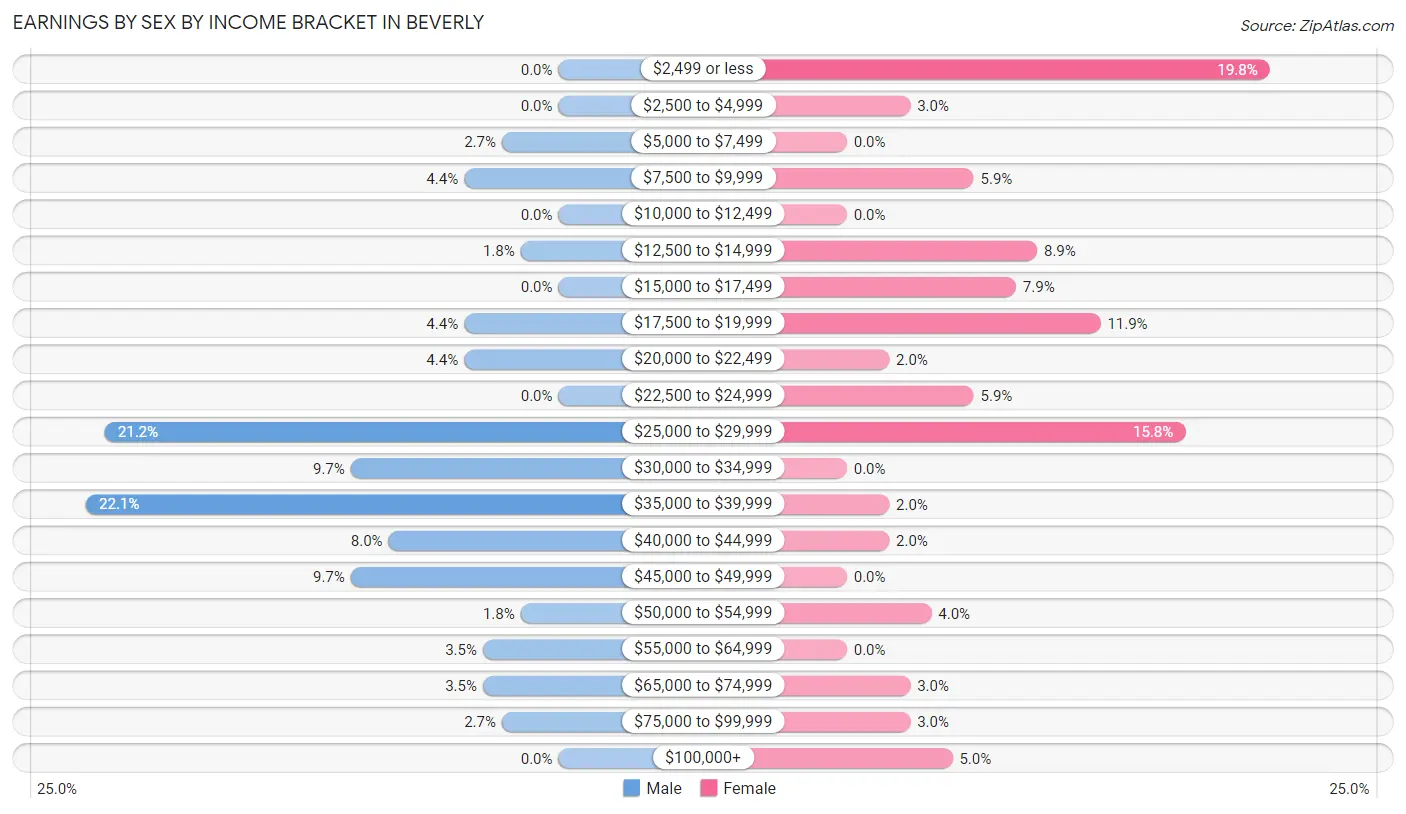
Earnings by Sex by Income Bracket in Beverly
The most common earnings brackets in Beverly are $35,000 to $39,999 for men (25 | 22.1%) and $2,499 or less for women (20 | 19.8%).
| Income | Male | Female |
| $2,499 or less | 0 (0.0%) | 20 (19.8%) |
| $2,500 to $4,999 | 0 (0.0%) | 3 (3.0%) |
| $5,000 to $7,499 | 3 (2.6%) | 0 (0.0%) |
| $7,500 to $9,999 | 5 (4.4%) | 6 (5.9%) |
| $10,000 to $12,499 | 0 (0.0%) | 0 (0.0%) |
| $12,500 to $14,999 | 2 (1.8%) | 9 (8.9%) |
| $15,000 to $17,499 | 0 (0.0%) | 8 (7.9%) |
| $17,500 to $19,999 | 5 (4.4%) | 12 (11.9%) |
| $20,000 to $22,499 | 5 (4.4%) | 2 (2.0%) |
| $22,500 to $24,999 | 0 (0.0%) | 6 (5.9%) |
| $25,000 to $29,999 | 24 (21.2%) | 16 (15.8%) |
| $30,000 to $34,999 | 11 (9.7%) | 0 (0.0%) |
| $35,000 to $39,999 | 25 (22.1%) | 2 (2.0%) |
| $40,000 to $44,999 | 9 (8.0%) | 2 (2.0%) |
| $45,000 to $49,999 | 11 (9.7%) | 0 (0.0%) |
| $50,000 to $54,999 | 2 (1.8%) | 4 (4.0%) |
| $55,000 to $64,999 | 4 (3.5%) | 0 (0.0%) |
| $65,000 to $74,999 | 4 (3.5%) | 3 (3.0%) |
| $75,000 to $99,999 | 3 (2.6%) | 3 (3.0%) |
| $100,000+ | 0 (0.0%) | 5 (5.0%) |
| Total | 113 (100.0%) | 101 (100.0%) |
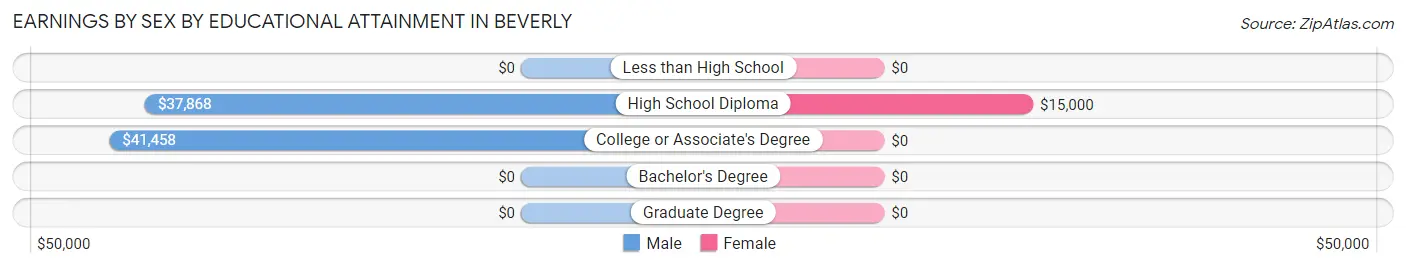
Earnings by Sex by Educational Attainment in Beverly
Average earnings in Beverly are $38,750 for men and $19,583 for women, a difference of 49.5%. Men with an educational attainment of college or associate's degree enjoy the highest average annual earnings of $41,458, while those with high school diploma education earn the least with $37,868. Women with an educational attainment of high school diploma earn the most with the average annual earnings of $15,000, while those with high school diploma education have the smallest earnings of $15,000.
| Educational Attainment | Male Income | Female Income |
| Less than High School | - | - |
| High School Diploma | $37,868 | $15,000 |
| College or Associate's Degree | $41,458 | $0 |
| Bachelor's Degree | - | - |
| Graduate Degree | - | - |
| Total | $38,750 | $19,583 |
Family Income in Beverly
Family Income Brackets in Beverly
According to the Beverly family income data, there are 40 families falling into the less than $10,000 income range, which is the most common income bracket and makes up 22.9% of all families.
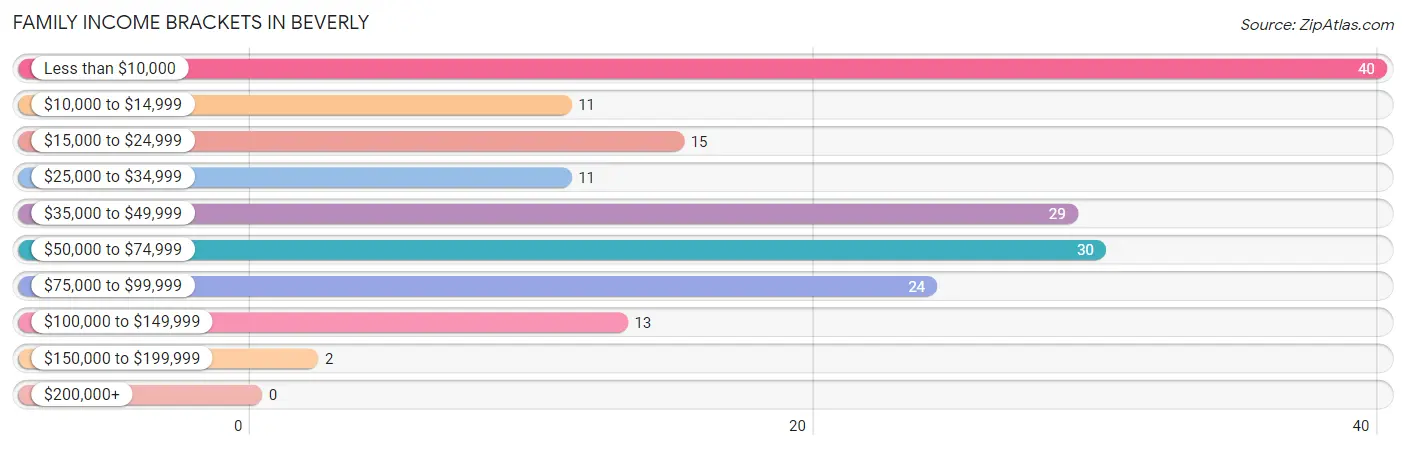
| Income Bracket | # Families | % Families |
| Less than $10,000 | 40 | 22.9% |
| $10,000 to $14,999 | 11 | 6.3% |
| $15,000 to $24,999 | 15 | 8.6% |
| $25,000 to $34,999 | 11 | 6.3% |
| $35,000 to $49,999 | 29 | 16.6% |
| $50,000 to $74,999 | 30 | 17.1% |
| $75,000 to $99,999 | 24 | 13.7% |
| $100,000 to $149,999 | 13 | 7.4% |
| $150,000 to $199,999 | 2 | 1.1% |
| $200,000+ | 0 | 0.0% |
Family Income by Famaliy Size in Beverly
2-person families (112 | 64.0%) account for the highest median family income in Beverly with $39,219 per family, while 2-person families (112 | 64.0%) have the highest median income of $19,610 per family member.
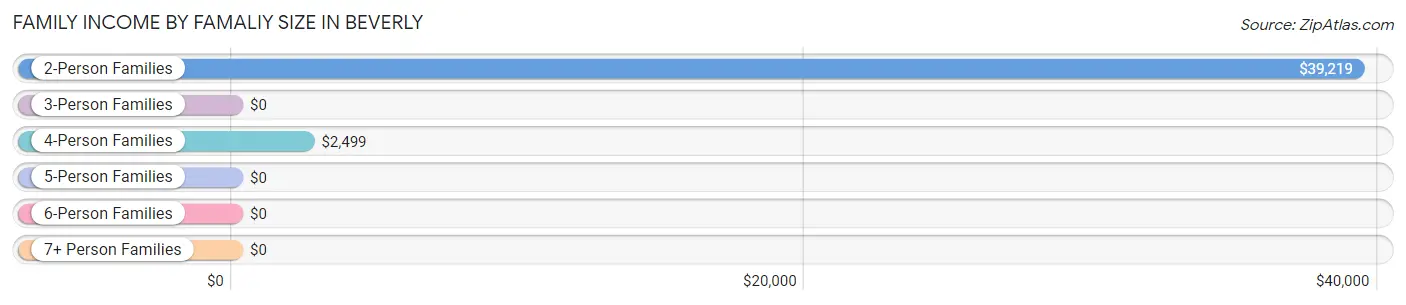
| Income Bracket | # Families | Median Income |
| 2-Person Families | 112 (64.0%) | $39,219 |
| 3-Person Families | 31 (17.7%) | $0 |
| 4-Person Families | 18 (10.3%) | $2,499 |
| 5-Person Families | 11 (6.3%) | $0 |
| 6-Person Families | 3 (1.7%) | $0 |
| 7+ Person Families | 0 (0.0%) | $0 |
| Total | 175 (100.0%) | $39,141 |
Family Income by Number of Earners in Beverly
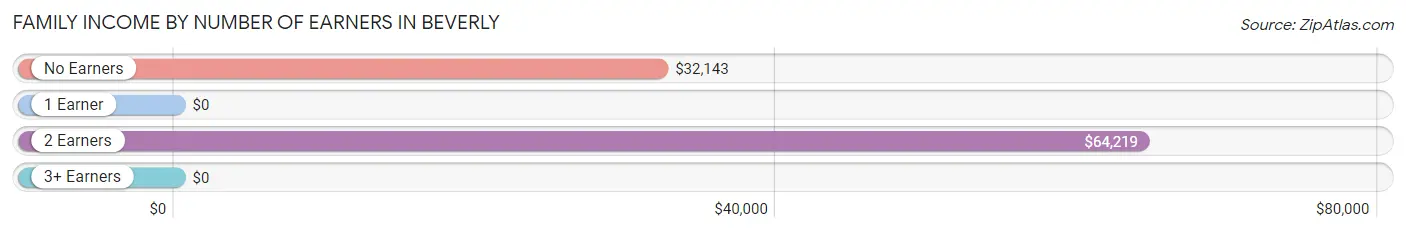
| Number of Earners | # Families | Median Income |
| No Earners | 68 (38.9%) | $32,143 |
| 1 Earner | 70 (40.0%) | $0 |
| 2 Earners | 37 (21.1%) | $64,219 |
| 3+ Earners | 0 (0.0%) | $0 |
| Total | 175 (100.0%) | $39,141 |
Household Income in Beverly
Household Income Brackets in Beverly
With 77 households falling in the category, the less than $10,000 income range is the most frequent in Beverly, accounting for 26.4% of all households.
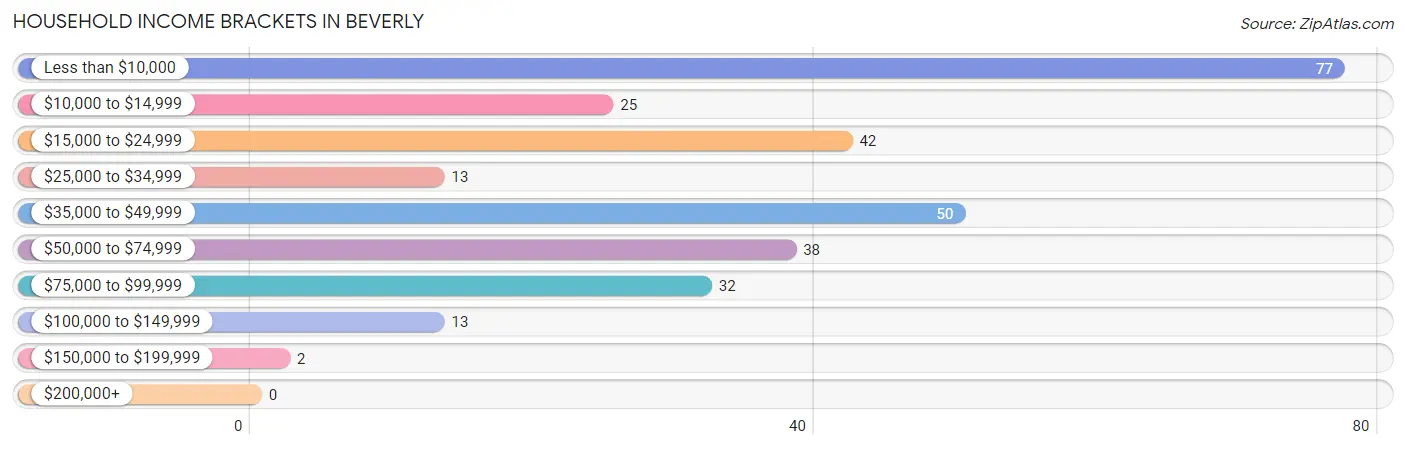
| Income Bracket | # Households | % Households |
| Less than $10,000 | 77 | 26.4% |
| $10,000 to $14,999 | 25 | 8.6% |
| $15,000 to $24,999 | 42 | 14.4% |
| $25,000 to $34,999 | 13 | 4.5% |
| $35,000 to $49,999 | 50 | 17.1% |
| $50,000 to $74,999 | 38 | 13.0% |
| $75,000 to $99,999 | 32 | 11.0% |
| $100,000 to $149,999 | 13 | 4.5% |
| $150,000 to $199,999 | 2 | 0.7% |
| $200,000+ | 0 | 0.0% |
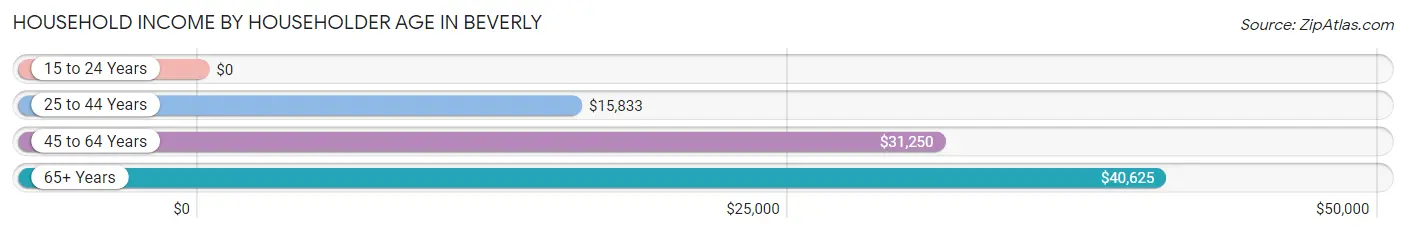
Household Income by Householder Age in Beverly
The median household income in Beverly is $30,000, with the highest median household income of $40,625 found in the 65+ years age bracket for the primary householder. A total of 104 households (35.6%) fall into this category. Meanwhile, the 15 to 24 years age bracket for the primary householder has the lowest median household income of $0, with 20 households (6.9%) in this group.
| Income Bracket | # Households | Median Income |
| 15 to 24 Years | 20 (6.9%) | $0 |
| 25 to 44 Years | 88 (30.1%) | $15,833 |
| 45 to 64 Years | 80 (27.4%) | $31,250 |
| 65+ Years | 104 (35.6%) | $40,625 |
| Total | 292 (100.0%) | $30,000 |
Poverty in Beverly
Income Below Poverty by Sex and Age in Beverly
With 34.8% poverty level for males and 48.9% for females among the residents of Beverly, 5 year old males and under 5 year old females are the most vulnerable to poverty, with 16 males (94.1%) and 16 females (100.0%) in their respective age groups living below the poverty level.
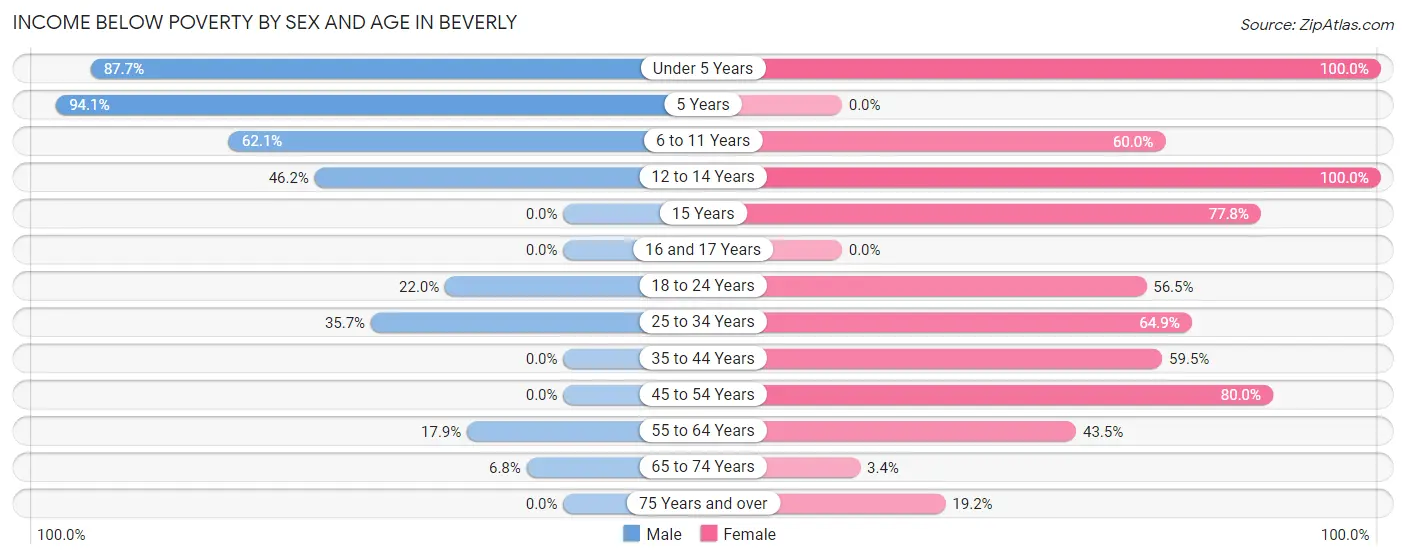
| Age Bracket | Male | Female |
| Under 5 Years | 50 (87.7%) | 16 (100.0%) |
| 5 Years | 16 (94.1%) | 0 (0.0%) |
| 6 to 11 Years | 18 (62.1%) | 3 (60.0%) |
| 12 to 14 Years | 6 (46.2%) | 8 (100.0%) |
| 15 Years | 0 (0.0%) | 7 (77.8%) |
| 16 and 17 Years | 0 (0.0%) | 0 (0.0%) |
| 18 to 24 Years | 9 (22.0%) | 13 (56.5%) |
| 25 to 34 Years | 5 (35.7%) | 37 (64.9%) |
| 35 to 44 Years | 0 (0.0%) | 22 (59.5%) |
| 45 to 54 Years | 0 (0.0%) | 20 (80.0%) |
| 55 to 64 Years | 5 (17.9%) | 20 (43.5%) |
| 65 to 74 Years | 3 (6.8%) | 2 (3.4%) |
| 75 Years and over | 0 (0.0%) | 5 (19.2%) |
| Total | 112 (34.8%) | 153 (48.9%) |
Income Above Poverty by Sex and Age in Beverly
According to the poverty statistics in Beverly, males aged 15 years and females aged 5 years are the age groups that are most secure financially, with 100.0% of males and 100.0% of females in these age groups living above the poverty line.
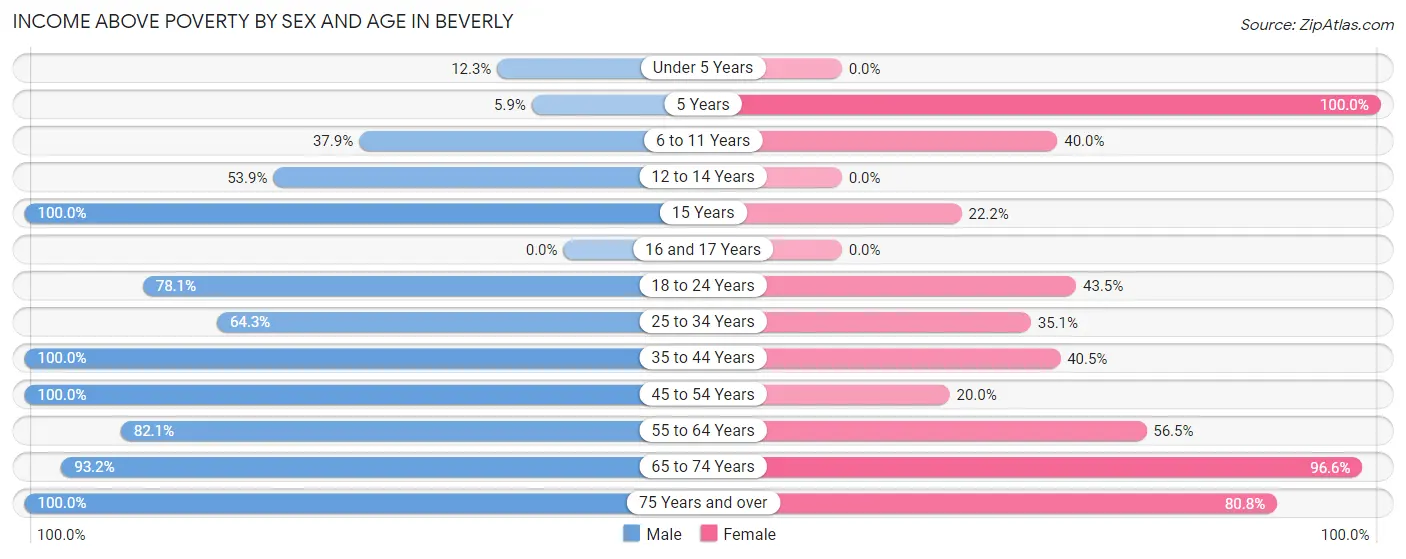
| Age Bracket | Male | Female |
| Under 5 Years | 7 (12.3%) | 0 (0.0%) |
| 5 Years | 1 (5.9%) | 2 (100.0%) |
| 6 to 11 Years | 11 (37.9%) | 2 (40.0%) |
| 12 to 14 Years | 7 (53.8%) | 0 (0.0%) |
| 15 Years | 2 (100.0%) | 2 (22.2%) |
| 16 and 17 Years | 0 (0.0%) | 0 (0.0%) |
| 18 to 24 Years | 32 (78.0%) | 10 (43.5%) |
| 25 to 34 Years | 9 (64.3%) | 20 (35.1%) |
| 35 to 44 Years | 24 (100.0%) | 15 (40.5%) |
| 45 to 54 Years | 23 (100.0%) | 5 (20.0%) |
| 55 to 64 Years | 23 (82.1%) | 26 (56.5%) |
| 65 to 74 Years | 41 (93.2%) | 57 (96.6%) |
| 75 Years and over | 30 (100.0%) | 21 (80.8%) |
| Total | 210 (65.2%) | 160 (51.1%) |
Income Below Poverty Among Married-Couple Families in Beverly
The poverty statistics for married-couple families in Beverly show that 3.1% or 3 of the total 98 families live below the poverty line. Families with no children have the highest poverty rate of 3.6%, comprising of 3 families. On the other hand, families with 1 or 2 children have the lowest poverty rate of 0.0%, which includes 0 families.
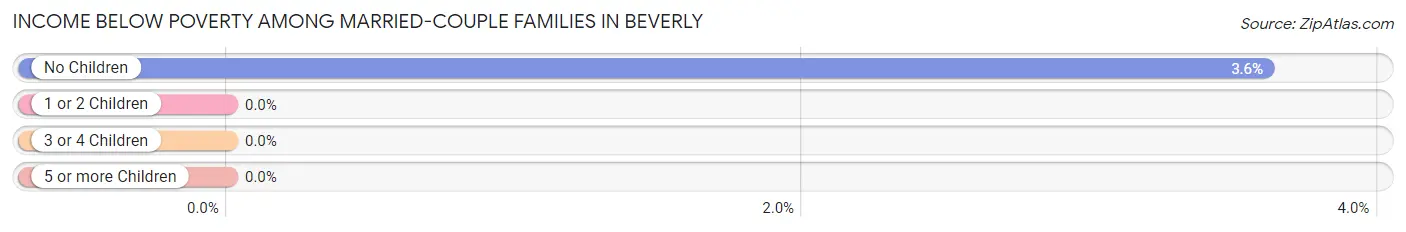
| Children | Above Poverty | Below Poverty |
| No Children | 80 (96.4%) | 3 (3.6%) |
| 1 or 2 Children | 7 (100.0%) | 0 (0.0%) |
| 3 or 4 Children | 8 (100.0%) | 0 (0.0%) |
| 5 or more Children | 0 (0.0%) | 0 (0.0%) |
| Total | 95 (96.9%) | 3 (3.1%) |
Income Below Poverty Among Single-Parent Households in Beverly
According to the poverty data in Beverly, 33.3% or 5 single-father households and 96.8% or 60 single-mother households are living below the poverty line. Among single-father households, those with no children have the highest poverty rate, with 5 households (100.0%) experiencing poverty. Likewise, among single-mother households, those with 1 or 2 children have the highest poverty rate, with 34 households (100.0%) falling below the poverty line.
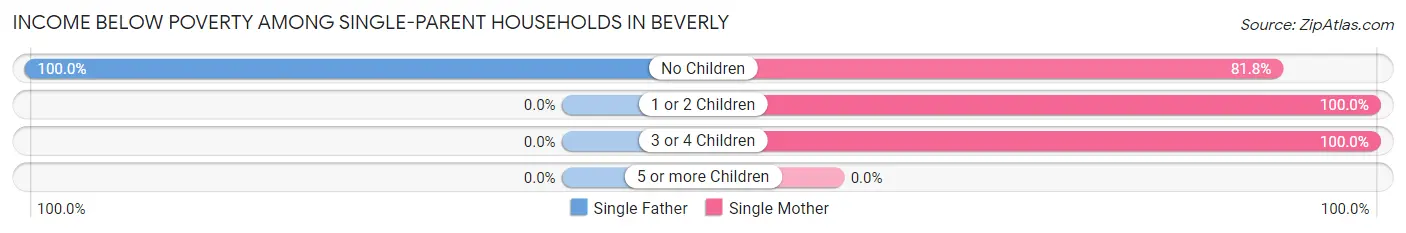
| Children | Single Father | Single Mother |
| No Children | 5 (100.0%) | 9 (81.8%) |
| 1 or 2 Children | 0 (0.0%) | 34 (100.0%) |
| 3 or 4 Children | 0 (0.0%) | 17 (100.0%) |
| 5 or more Children | 0 (0.0%) | 0 (0.0%) |
| Total | 5 (33.3%) | 60 (96.8%) |
Income Below Poverty Among Married-Couple vs Single-Parent Households in Beverly
The poverty data for Beverly shows that 3 of the married-couple family households (3.1%) and 65 of the single-parent households (84.4%) are living below the poverty level. Within the married-couple family households, those with no children have the highest poverty rate, with 3 households (3.6%) falling below the poverty line. Among the single-parent households, those with 3 or 4 children have the highest poverty rate, with 17 household (100.0%) living below poverty.
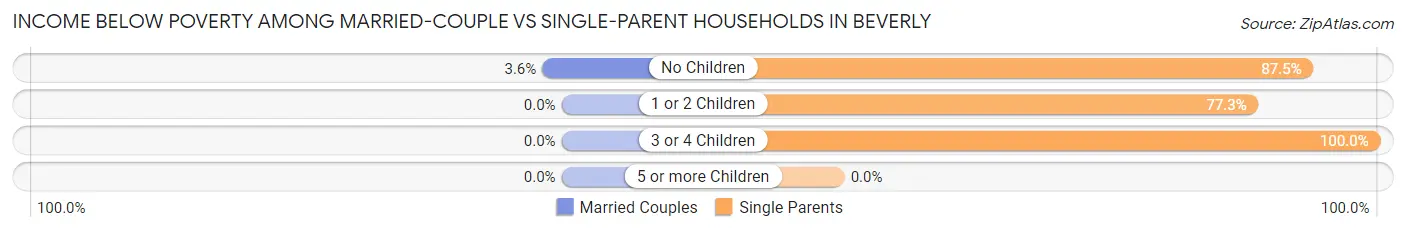
| Children | Married-Couple Families | Single-Parent Households |
| No Children | 3 (3.6%) | 14 (87.5%) |
| 1 or 2 Children | 0 (0.0%) | 34 (77.3%) |
| 3 or 4 Children | 0 (0.0%) | 17 (100.0%) |
| 5 or more Children | 0 (0.0%) | 0 (0.0%) |
| Total | 3 (3.1%) | 65 (84.4%) |
Race in Beverly
The most populous races in Beverly are White / Caucasian (600 | 88.1%), Two or more Races (62 | 9.1%), and Hispanic or Latino (16 | 2.4%).
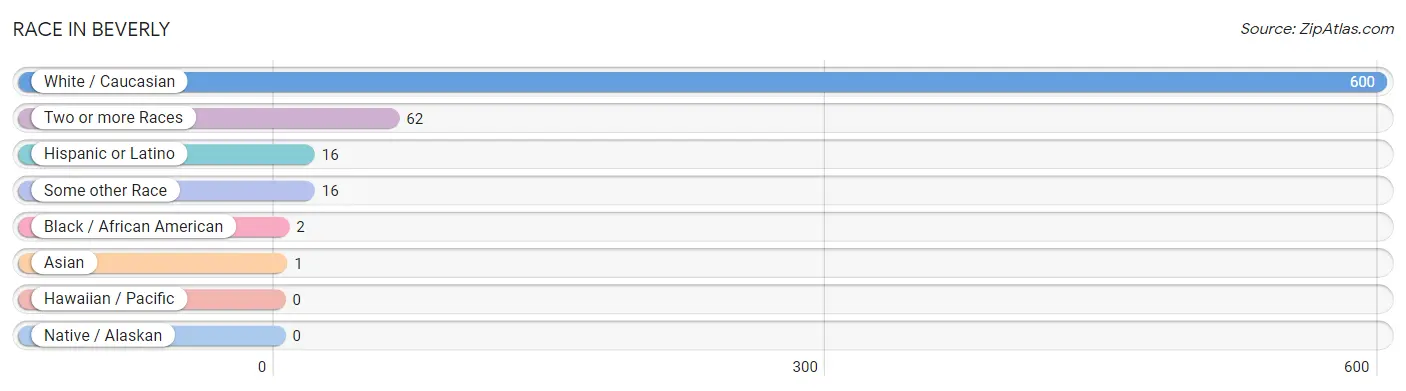
| Race | # Population | % Population |
| Asian | 1 | 0.2% |
| Black / African American | 2 | 0.3% |
| Hawaiian / Pacific | 0 | 0.0% |
| Hispanic or Latino | 16 | 2.4% |
| Native / Alaskan | 0 | 0.0% |
| White / Caucasian | 600 | 88.1% |
| Two or more Races | 62 | 9.1% |
| Some other Race | 16 | 2.4% |
| Total | 681 | 100.0% |
Ancestry in Beverly
The most populous ancestries reported in Beverly are German (122 | 17.9%), Irish (116 | 17.0%), English (41 | 6.0%), American (36 | 5.3%), and Dutch (24 | 3.5%), together accounting for 49.8% of all Beverly residents.
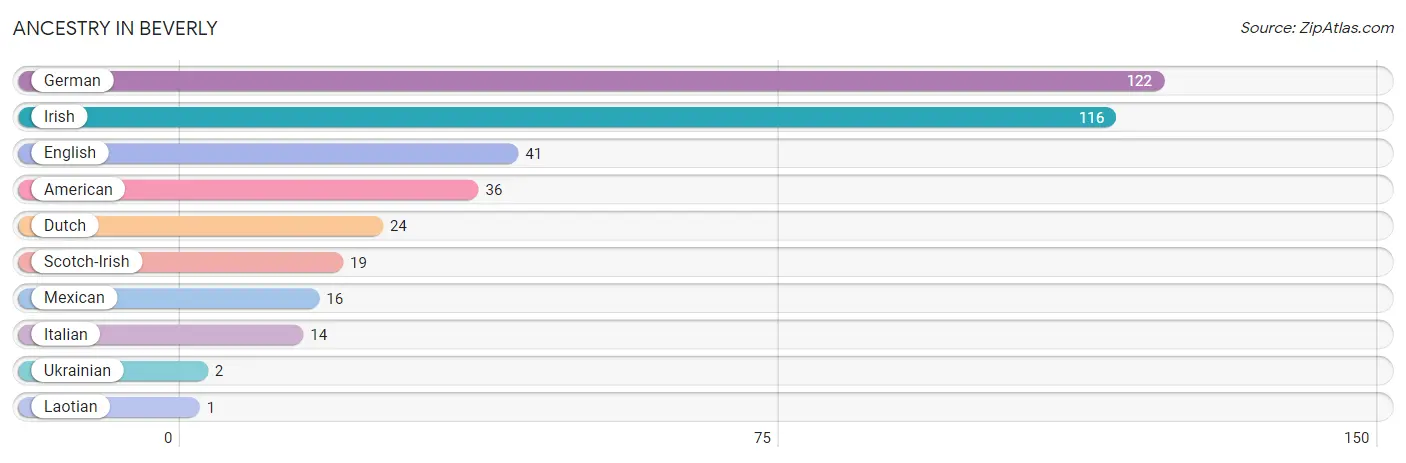
| Ancestry | # Population | % Population |
| American | 36 | 5.3% |
| Dutch | 24 | 3.5% |
| English | 41 | 6.0% |
| German | 122 | 17.9% |
| Irish | 116 | 17.0% |
| Italian | 14 | 2.1% |
| Laotian | 1 | 0.2% |
| Mexican | 16 | 2.4% |
| Scotch-Irish | 19 | 2.8% |
| Ukrainian | 2 | 0.3% | View All 10 Rows |
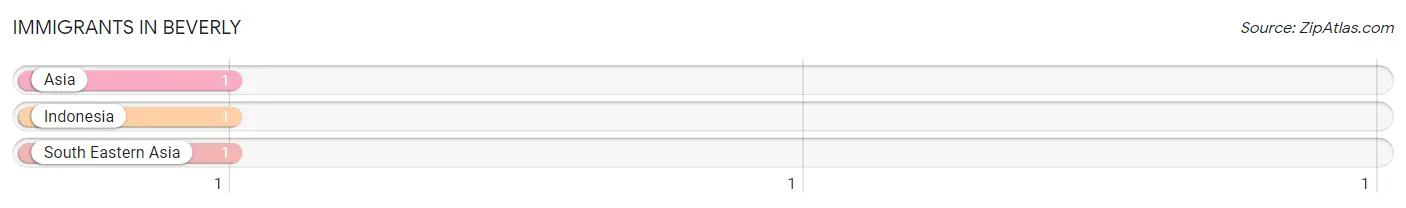
Immigrants in Beverly
The most numerous immigrant groups reported in Beverly came from Asia (1 | 0.2%), Indonesia (1 | 0.2%), and South Eastern Asia (1 | 0.2%), together accounting for 0.5% of all Beverly residents.
| Immigration Origin | # Population | % Population |
| Asia | 1 | 0.2% |
| Indonesia | 1 | 0.2% |
| South Eastern Asia | 1 | 0.2% | View All 3 Rows |
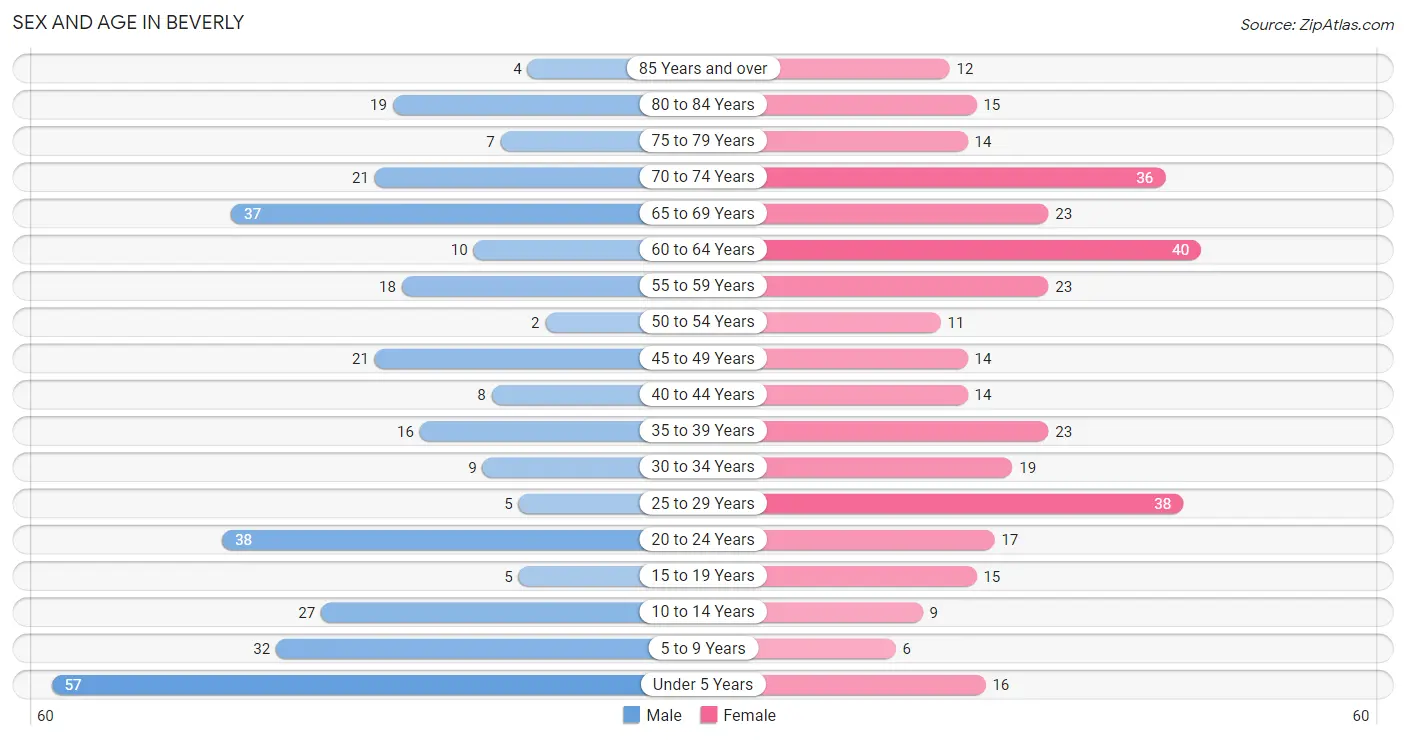
Sex and Age in Beverly
Sex and Age in Beverly
The most populous age groups in Beverly are Under 5 Years (57 | 17.0%) for men and 60 to 64 Years (40 | 11.6%) for women.
| Age Bracket | Male | Female |
| Under 5 Years | 57 (17.0%) | 16 (4.6%) |
| 5 to 9 Years | 32 (9.5%) | 6 (1.7%) |
| 10 to 14 Years | 27 (8.0%) | 9 (2.6%) |
| 15 to 19 Years | 5 (1.5%) | 15 (4.3%) |
| 20 to 24 Years | 38 (11.3%) | 17 (4.9%) |
| 25 to 29 Years | 5 (1.5%) | 38 (11.0%) |
| 30 to 34 Years | 9 (2.7%) | 19 (5.5%) |
| 35 to 39 Years | 16 (4.8%) | 23 (6.7%) |
| 40 to 44 Years | 8 (2.4%) | 14 (4.1%) |
| 45 to 49 Years | 21 (6.2%) | 14 (4.1%) |
| 50 to 54 Years | 2 (0.6%) | 11 (3.2%) |
| 55 to 59 Years | 18 (5.4%) | 23 (6.7%) |
| 60 to 64 Years | 10 (3.0%) | 40 (11.6%) |
| 65 to 69 Years | 37 (11.0%) | 23 (6.7%) |
| 70 to 74 Years | 21 (6.2%) | 36 (10.4%) |
| 75 to 79 Years | 7 (2.1%) | 14 (4.1%) |
| 80 to 84 Years | 19 (5.7%) | 15 (4.3%) |
| 85 Years and over | 4 (1.2%) | 12 (3.5%) |
| Total | 336 (100.0%) | 345 (100.0%) |
Families and Households in Beverly
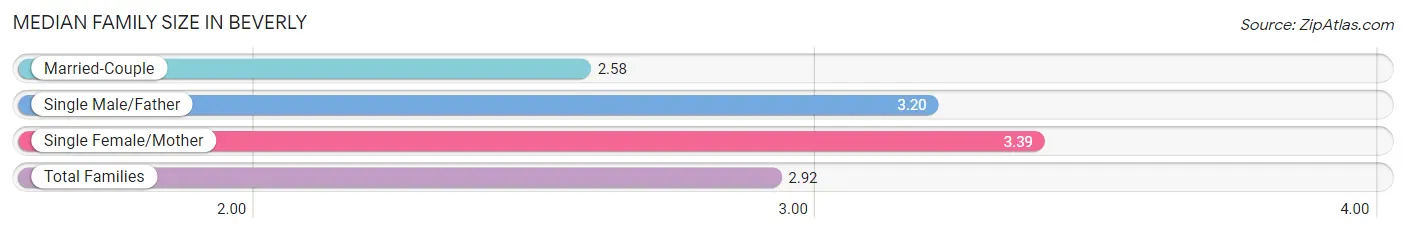
Median Family Size in Beverly
The median family size in Beverly is 2.92 persons per family, with single female/mother families (62 | 35.4%) accounting for the largest median family size of 3.39 persons per family. On the other hand, married-couple families (98 | 56.0%) represent the smallest median family size with 2.58 persons per family.
| Family Type | # Families | Family Size |
| Married-Couple | 98 (56.0%) | 2.58 |
| Single Male/Father | 15 (8.6%) | 3.20 |
| Single Female/Mother | 62 (35.4%) | 3.39 |
| Total Families | 175 (100.0%) | 2.92 |
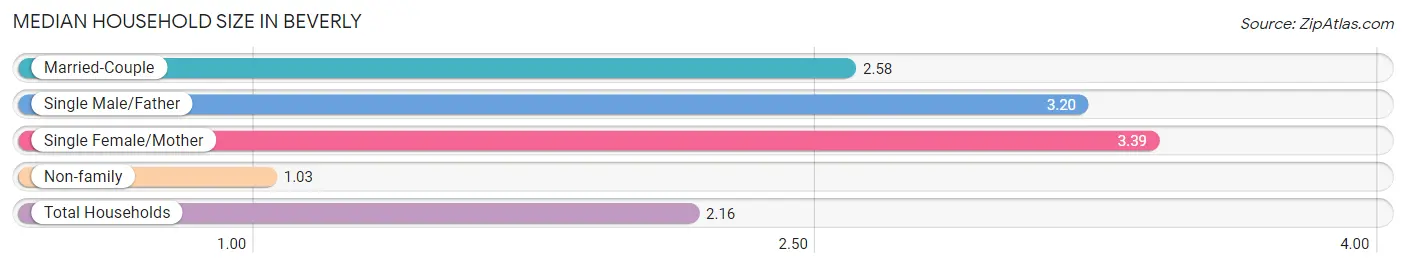
Median Household Size in Beverly
The median household size in Beverly is 2.16 persons per household, with single female/mother households (62 | 21.2%) accounting for the largest median household size of 3.39 persons per household. non-family households (117 | 40.1%) represent the smallest median household size with 1.03 persons per household.
| Household Type | # Households | Household Size |
| Married-Couple | 98 (33.6%) | 2.58 |
| Single Male/Father | 15 (5.1%) | 3.20 |
| Single Female/Mother | 62 (21.2%) | 3.39 |
| Non-family | 117 (40.1%) | 1.03 |
| Total Households | 292 (100.0%) | 2.16 |
Household Size by Marriage Status in Beverly
Out of a total of 292 households in Beverly, 175 (59.9%) are family households, while 117 (40.1%) are nonfamily households. The most numerous type of family households are 2-person households, comprising 112, and the most common type of nonfamily households are 1-person households, comprising 113.
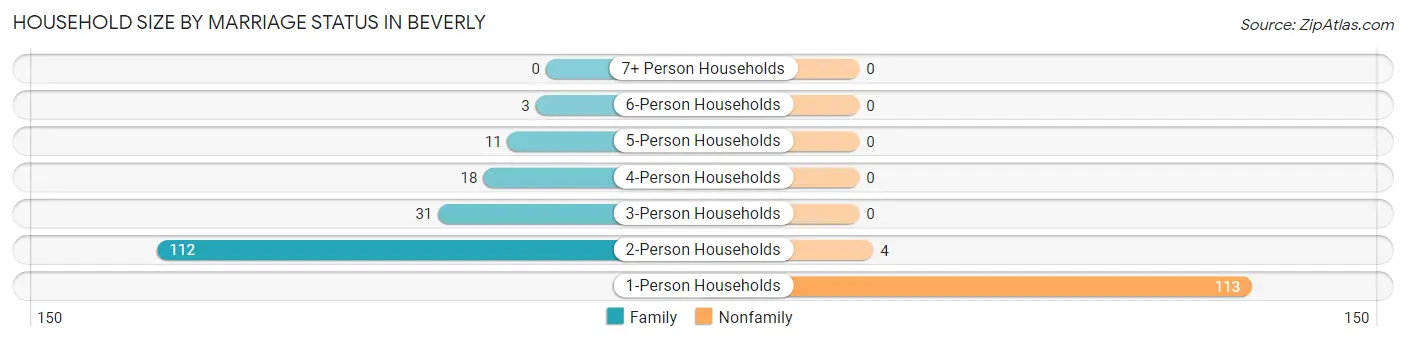
| Household Size | Family Households | Nonfamily Households |
| 1-Person Households | - | 113 (38.7%) |
| 2-Person Households | 112 (38.4%) | 4 (1.4%) |
| 3-Person Households | 31 (10.6%) | 0 (0.0%) |
| 4-Person Households | 18 (6.2%) | 0 (0.0%) |
| 5-Person Households | 11 (3.8%) | 0 (0.0%) |
| 6-Person Households | 3 (1.0%) | 0 (0.0%) |
| 7+ Person Households | 0 (0.0%) | 0 (0.0%) |
| Total | 175 (59.9%) | 117 (40.1%) |
Female Fertility in Beverly
Fertility by Age in Beverly
| Age Bracket | Women with Births | Births / 1,000 Women |
| 15 to 19 years | 0 (0.0%) | 0.0 |
| 20 to 34 years | 0 (0.0%) | 0.0 |
| 35 to 50 years | 0 (0.0%) | 0.0 |
| Total | 0 (0.0%) | 0.0 |
Fertility by Age by Marriage Status in Beverly
| Age Bracket | Married | Unmarried |
| 15 to 19 years | 0 (0.0%) | 0 (0.0%) |
| 20 to 34 years | 0 (0.0%) | 0 (0.0%) |
| 35 to 50 years | 0 (0.0%) | 0 (0.0%) |
| Total | 0 (0.0%) | 0 (0.0%) |
Fertility by Education in Beverly
| Educational Attainment | Women with Births | Births / 1,000 Women |
| Less than High School | 0 (0.0%) | 0.0 |
| High School Diploma | 0 (0.0%) | 0.0 |
| College or Associate's Degree | 0 (0.0%) | 0.0 |
| Bachelor's Degree | 0 (0.0%) | 0.0 |
| Graduate Degree | 0 (0.0%) | 0.0 |
| Total | 0 (0.0%) | 0.0 |
Fertility by Education by Marriage Status in Beverly
| Educational Attainment | Married | Unmarried |
| Less than High School | 0 (0.0%) | 0 (0.0%) |
| High School Diploma | 0 (0.0%) | 0 (0.0%) |
| College or Associate's Degree | 0 (0.0%) | 0 (0.0%) |
| Bachelor's Degree | 0 (0.0%) | 0 (0.0%) |
| Graduate Degree | 0 (0.0%) | 0 (0.0%) |
| Total | 0 (0.0%) | 0 (0.0%) |
Employment Characteristics in Beverly
Employment by Class of Employer in Beverly
Among the 181 employed individuals in Beverly, private company employees (116 | 64.1%), state government employees (26 | 14.4%), and self-employed (not incorporated) (15 | 8.3%) make up the most common classes of employment.
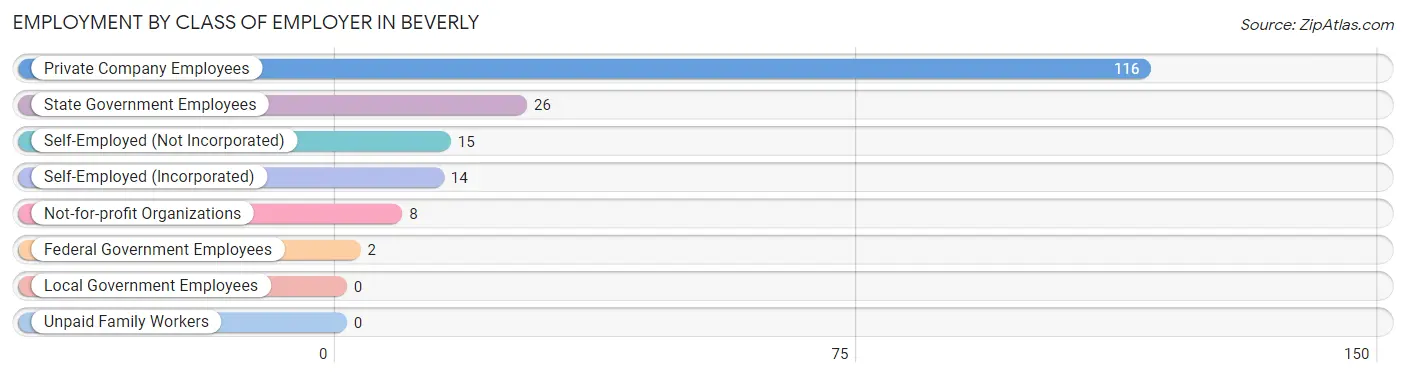
| Employer Class | # Employees | % Employees |
| Private Company Employees | 116 | 64.1% |
| Self-Employed (Incorporated) | 14 | 7.7% |
| Self-Employed (Not Incorporated) | 15 | 8.3% |
| Not-for-profit Organizations | 8 | 4.4% |
| Local Government Employees | 0 | 0.0% |
| State Government Employees | 26 | 14.4% |
| Federal Government Employees | 2 | 1.1% |
| Unpaid Family Workers | 0 | 0.0% |
| Total | 181 | 100.0% |
Employment Status by Age in Beverly
According to the labor force statistics for Beverly, out of the total population over 16 years of age (523), 38.0% or 199 individuals are in the labor force, with 7.0% or 14 of them unemployed. The age group with the highest labor force participation rate is 35 to 44 years, with 80.3% or 49 individuals in the labor force. Within the labor force, the 25 to 29 years age range has the highest percentage of unemployed individuals, with 25.0% or 3 of them being unemployed.
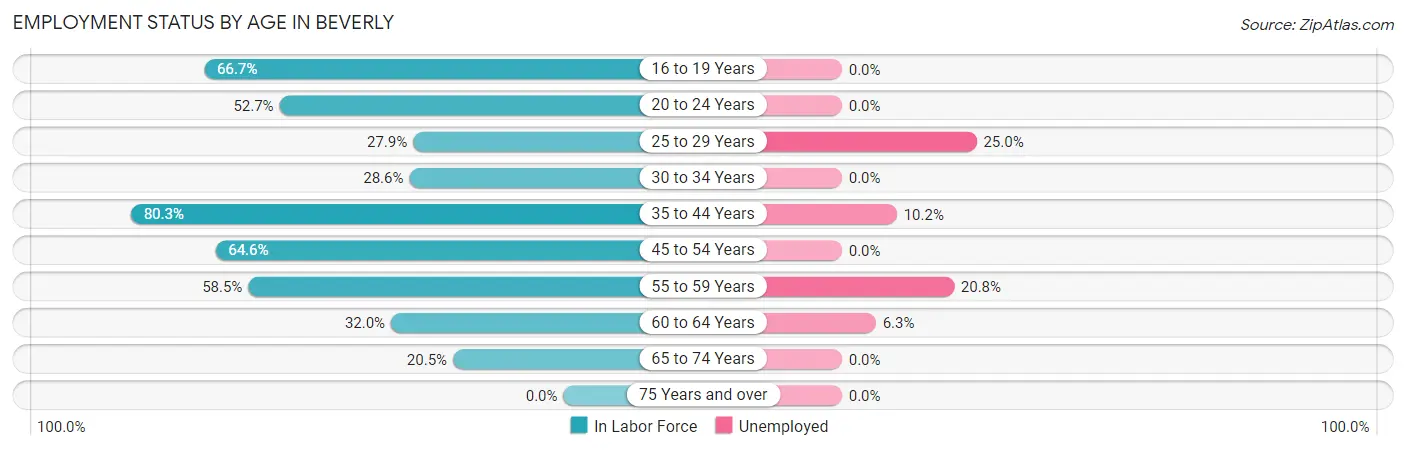
| Age Bracket | In Labor Force | Unemployed |
| 16 to 19 Years | 6 (66.7%) | 0 (0.0%) |
| 20 to 24 Years | 29 (52.7%) | 0 (0.0%) |
| 25 to 29 Years | 12 (27.9%) | 3 (25.0%) |
| 30 to 34 Years | 8 (28.6%) | 0 (0.0%) |
| 35 to 44 Years | 49 (80.3%) | 5 (10.2%) |
| 45 to 54 Years | 31 (64.6%) | 0 (0.0%) |
| 55 to 59 Years | 24 (58.5%) | 5 (20.8%) |
| 60 to 64 Years | 16 (32.0%) | 1 (6.3%) |
| 65 to 74 Years | 24 (20.5%) | 0 (0.0%) |
| 75 Years and over | 0 (0.0%) | 0 (0.0%) |
| Total | 199 (38.0%) | 14 (7.0%) |
Employment Status by Educational Attainment in Beverly
According to labor force statistics for Beverly, 51.7% of individuals (140) out of the total population between 25 and 64 years of age (271) are in the labor force, with 10.0% or 14 of them being unemployed. The group with the highest labor force participation rate are those with the educational attainment of college / associate degree, with 83.8% or 31 individuals in the labor force. Within the labor force, individuals with high school diploma education have the highest percentage of unemployment, with 15.9% or 14 of them being unemployed.
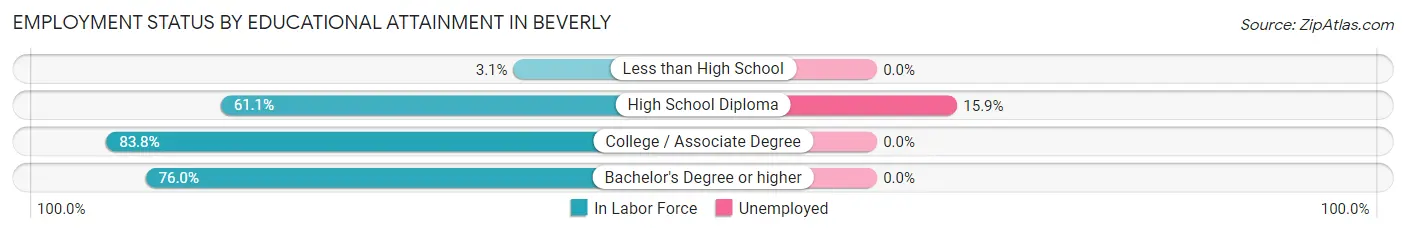
| Educational Attainment | In Labor Force | Unemployed |
| Less than High School | 2 (3.1%) | 0 (0.0%) |
| High School Diploma | 88 (61.1%) | 23 (15.9%) |
| College / Associate Degree | 31 (83.8%) | 0 (0.0%) |
| Bachelor's Degree or higher | 19 (76.0%) | 0 (0.0%) |
| Total | 140 (51.7%) | 27 (10.0%) |
Employment Occupations by Sex in Beverly
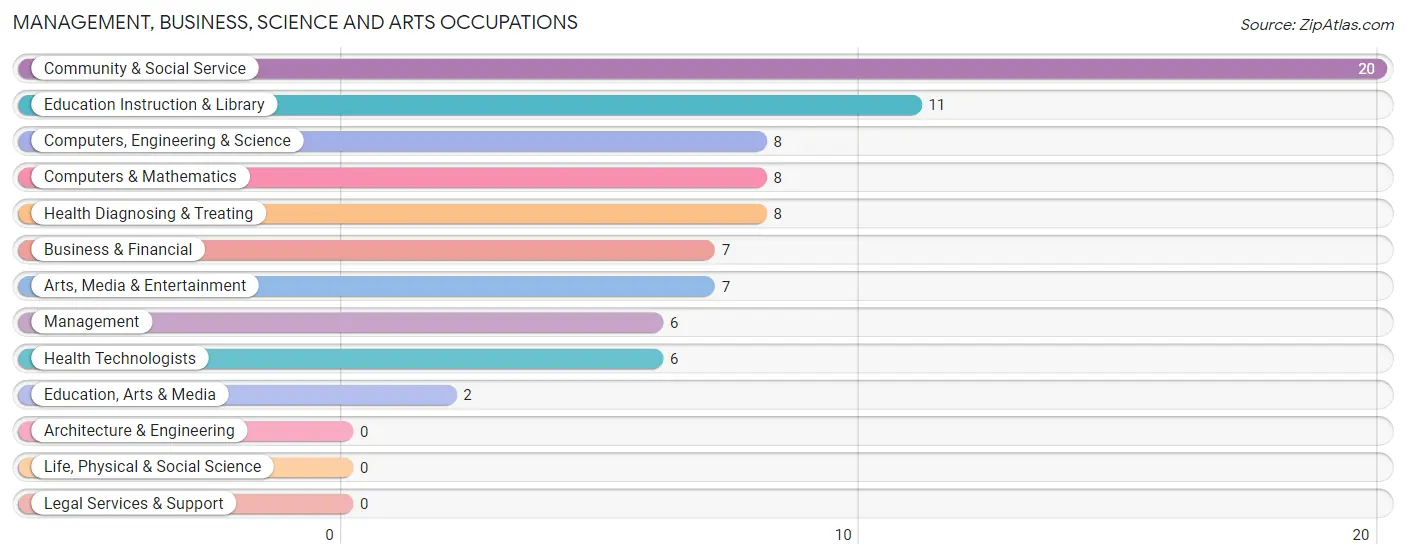
Management, Business, Science and Arts Occupations
The most common Management, Business, Science and Arts occupations in Beverly are Community & Social Service (20 | 10.8%), Education Instruction & Library (11 | 5.9%), Computers, Engineering & Science (8 | 4.3%), Computers & Mathematics (8 | 4.3%), and Health Diagnosing & Treating (8 | 4.3%).
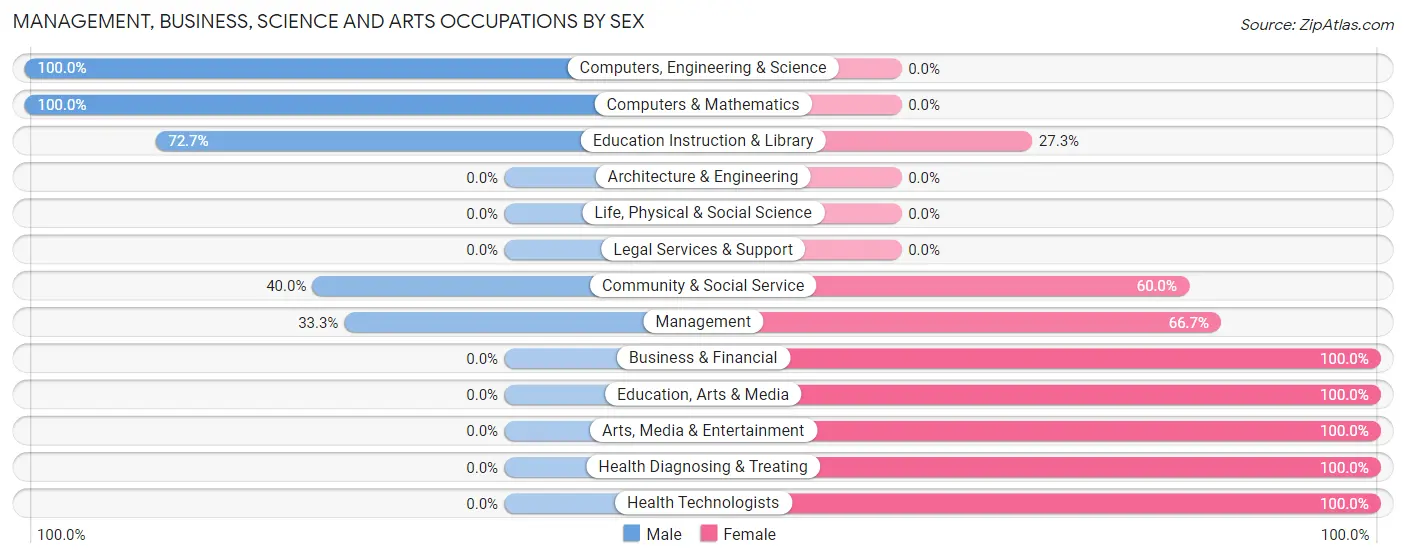
Management, Business, Science and Arts Occupations by Sex
Within the Management, Business, Science and Arts occupations in Beverly, the most male-oriented occupations are Computers, Engineering & Science (100.0%), Computers & Mathematics (100.0%), and Education Instruction & Library (72.7%), while the most female-oriented occupations are Business & Financial (100.0%), Education, Arts & Media (100.0%), and Arts, Media & Entertainment (100.0%).
| Occupation | Male | Female |
| Management | 2 (33.3%) | 4 (66.7%) |
| Business & Financial | 0 (0.0%) | 7 (100.0%) |
| Computers, Engineering & Science | 8 (100.0%) | 0 (0.0%) |
| Computers & Mathematics | 8 (100.0%) | 0 (0.0%) |
| Architecture & Engineering | 0 (0.0%) | 0 (0.0%) |
| Life, Physical & Social Science | 0 (0.0%) | 0 (0.0%) |
| Community & Social Service | 8 (40.0%) | 12 (60.0%) |
| Education, Arts & Media | 0 (0.0%) | 2 (100.0%) |
| Legal Services & Support | 0 (0.0%) | 0 (0.0%) |
| Education Instruction & Library | 8 (72.7%) | 3 (27.3%) |
| Arts, Media & Entertainment | 0 (0.0%) | 7 (100.0%) |
| Health Diagnosing & Treating | 0 (0.0%) | 8 (100.0%) |
| Health Technologists | 0 (0.0%) | 6 (100.0%) |
| Total (Category) | 18 (36.7%) | 31 (63.3%) |
| Total (Overall) | 108 (58.4%) | 77 (41.6%) |
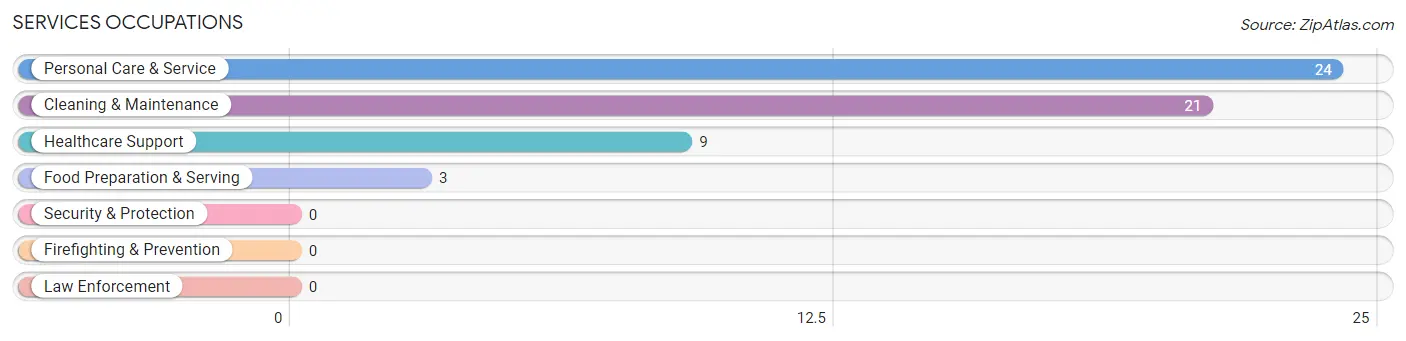
Services Occupations
The most common Services occupations in Beverly are Personal Care & Service (24 | 13.0%), Cleaning & Maintenance (21 | 11.4%), Healthcare Support (9 | 4.9%), and Food Preparation & Serving (3 | 1.6%).
Services Occupations by Sex
Within the Services occupations in Beverly, the most male-oriented occupations are Personal Care & Service (54.2%), and Cleaning & Maintenance (42.9%), while the most female-oriented occupations are Healthcare Support (100.0%), Food Preparation & Serving (100.0%), and Cleaning & Maintenance (57.1%).

| Occupation | Male | Female |
| Healthcare Support | 0 (0.0%) | 9 (100.0%) |
| Security & Protection | 0 (0.0%) | 0 (0.0%) |
| Firefighting & Prevention | 0 (0.0%) | 0 (0.0%) |
| Law Enforcement | 0 (0.0%) | 0 (0.0%) |
| Food Preparation & Serving | 0 (0.0%) | 3 (100.0%) |
| Cleaning & Maintenance | 9 (42.9%) | 12 (57.1%) |
| Personal Care & Service | 13 (54.2%) | 11 (45.8%) |
| Total (Category) | 22 (38.6%) | 35 (61.4%) |
| Total (Overall) | 108 (58.4%) | 77 (41.6%) |
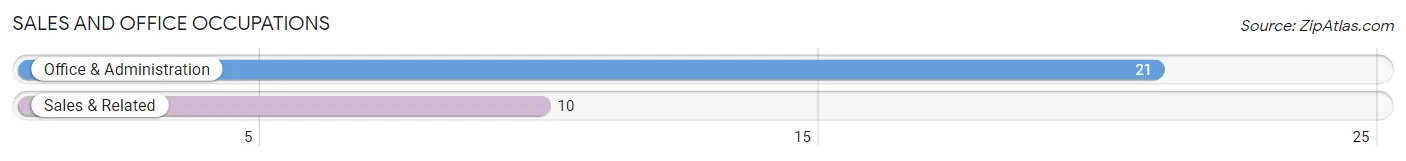
Sales and Office Occupations
The most common Sales and Office occupations in Beverly are Office & Administration (21 | 11.4%), and Sales & Related (10 | 5.4%).
Sales and Office Occupations by Sex
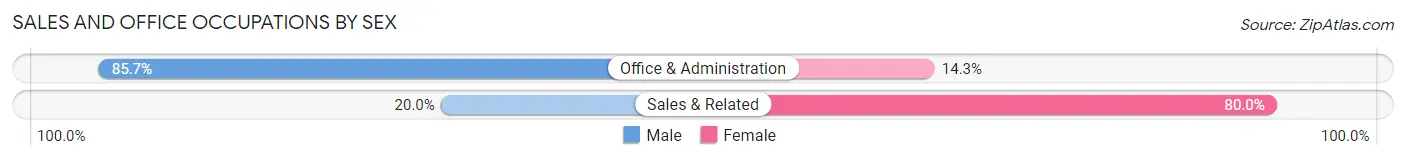
| Occupation | Male | Female |
| Sales & Related | 2 (20.0%) | 8 (80.0%) |
| Office & Administration | 18 (85.7%) | 3 (14.3%) |
| Total (Category) | 20 (64.5%) | 11 (35.5%) |
| Total (Overall) | 108 (58.4%) | 77 (41.6%) |
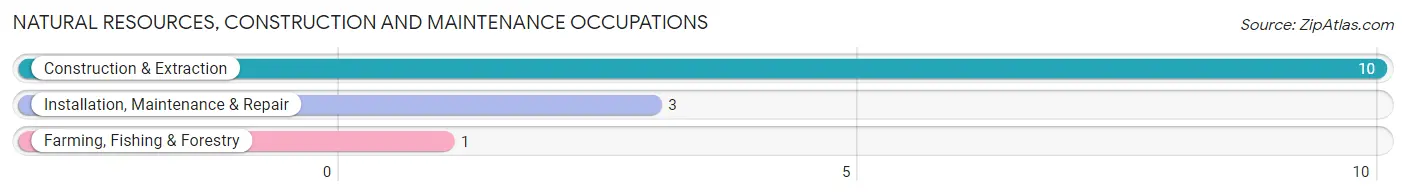
Natural Resources, Construction and Maintenance Occupations
The most common Natural Resources, Construction and Maintenance occupations in Beverly are Construction & Extraction (10 | 5.4%), Installation, Maintenance & Repair (3 | 1.6%), and Farming, Fishing & Forestry (1 | 0.5%).
Natural Resources, Construction and Maintenance Occupations by Sex
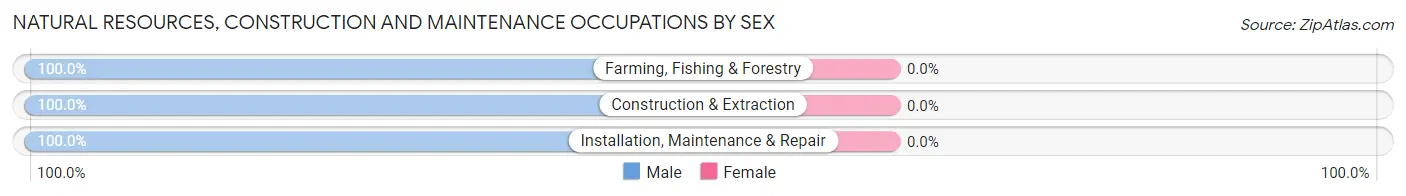
| Occupation | Male | Female |
| Farming, Fishing & Forestry | 1 (100.0%) | 0 (0.0%) |
| Construction & Extraction | 10 (100.0%) | 0 (0.0%) |
| Installation, Maintenance & Repair | 3 (100.0%) | 0 (0.0%) |
| Total (Category) | 14 (100.0%) | 0 (0.0%) |
| Total (Overall) | 108 (58.4%) | 77 (41.6%) |
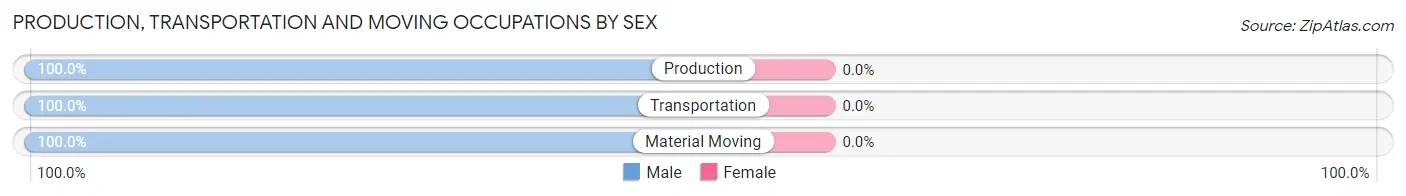
Production, Transportation and Moving Occupations
The most common Production, Transportation and Moving occupations in Beverly are Transportation (16 | 8.6%), Production (13 | 7.0%), and Material Moving (5 | 2.7%).
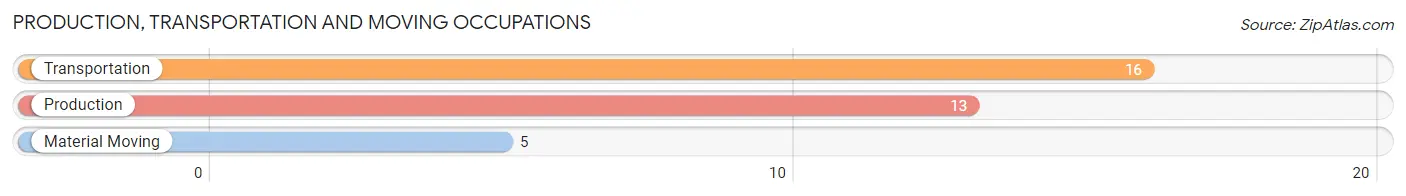
Production, Transportation and Moving Occupations by Sex
| Occupation | Male | Female |
| Production | 13 (100.0%) | 0 (0.0%) |
| Transportation | 16 (100.0%) | 0 (0.0%) |
| Material Moving | 5 (100.0%) | 0 (0.0%) |
| Total (Category) | 34 (100.0%) | 0 (0.0%) |
| Total (Overall) | 108 (58.4%) | 77 (41.6%) |
Employment Industries by Sex in Beverly
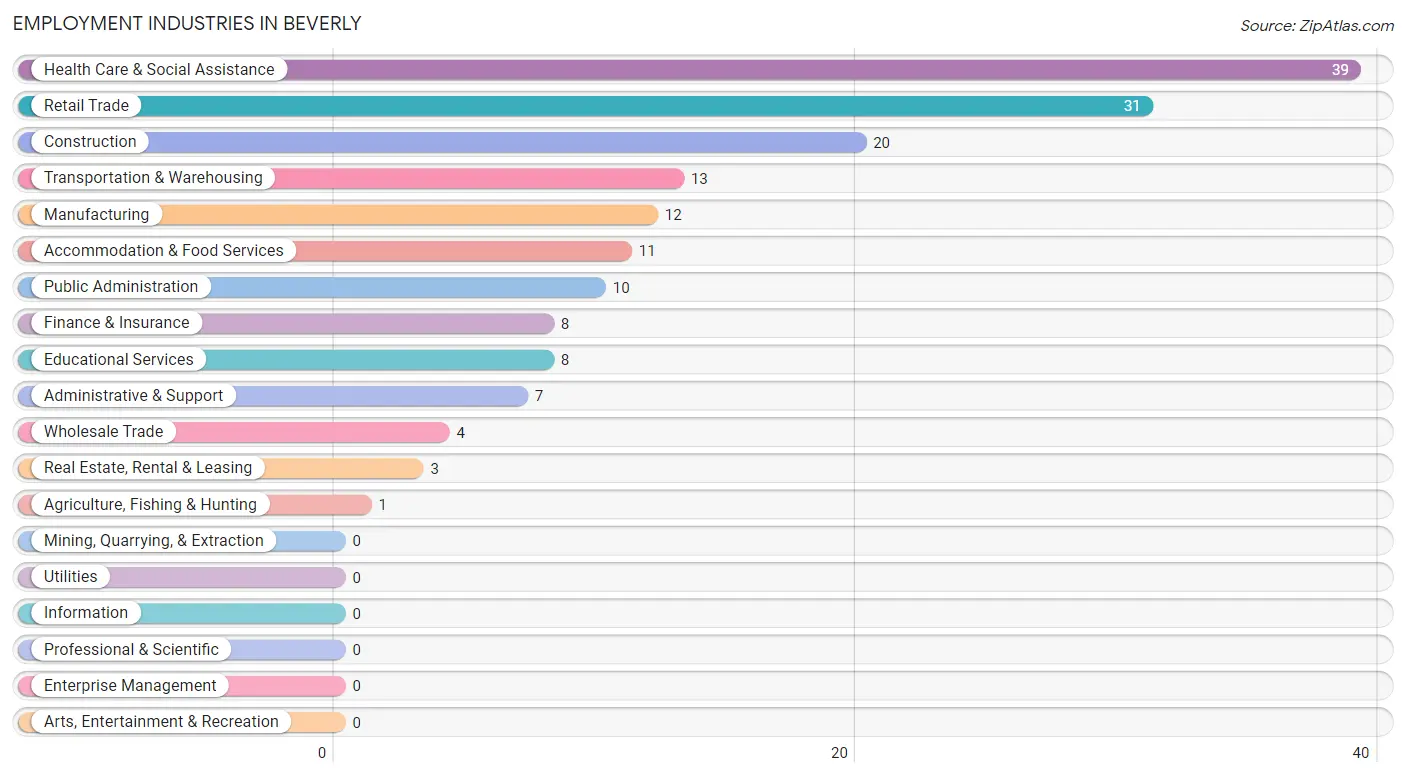
Employment Industries in Beverly
The major employment industries in Beverly include Health Care & Social Assistance (39 | 21.1%), Retail Trade (31 | 16.8%), Construction (20 | 10.8%), Transportation & Warehousing (13 | 7.0%), and Manufacturing (12 | 6.5%).
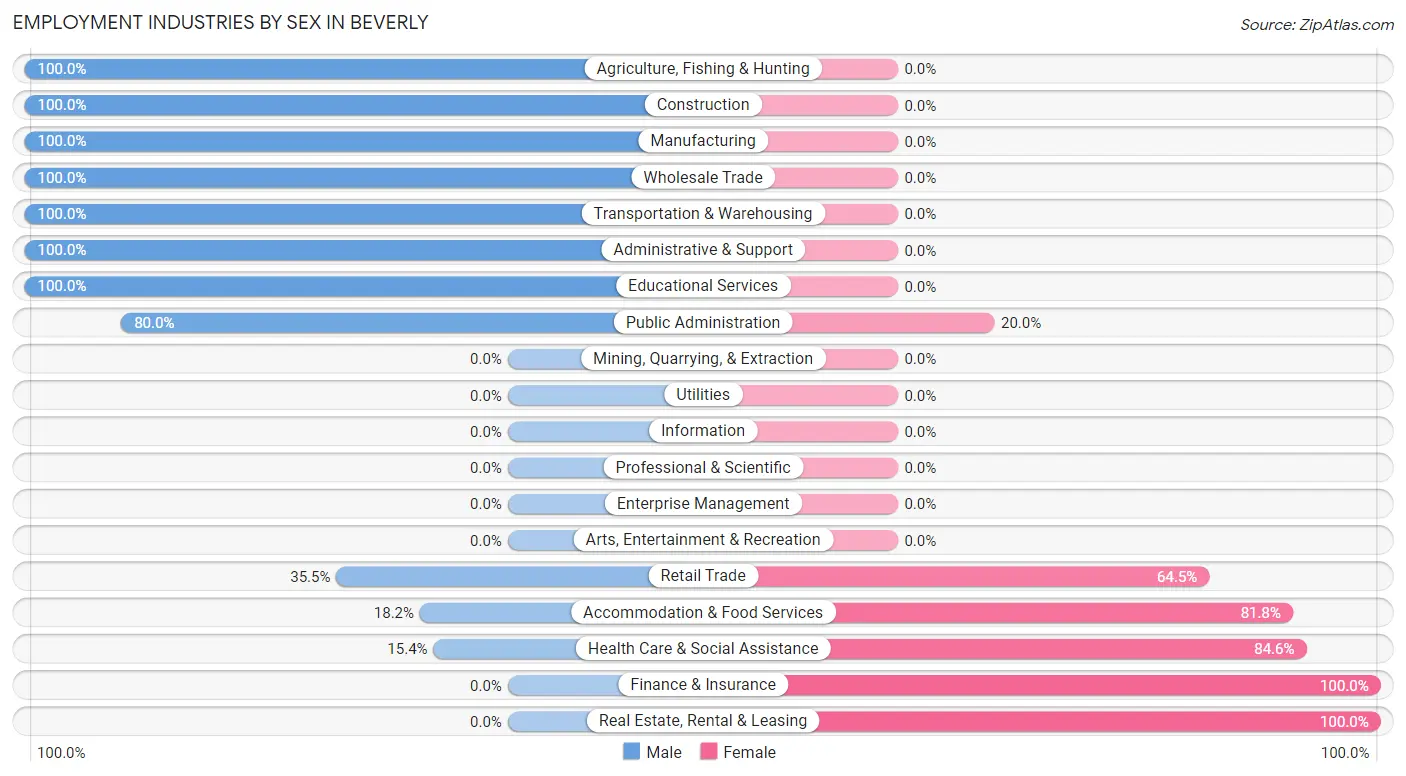
Employment Industries by Sex in Beverly
The Beverly industries that see more men than women are Agriculture, Fishing & Hunting (100.0%), Construction (100.0%), and Manufacturing (100.0%), whereas the industries that tend to have a higher number of women are Finance & Insurance (100.0%), Real Estate, Rental & Leasing (100.0%), and Health Care & Social Assistance (84.6%).
| Industry | Male | Female |
| Agriculture, Fishing & Hunting | 1 (100.0%) | 0 (0.0%) |
| Mining, Quarrying, & Extraction | 0 (0.0%) | 0 (0.0%) |
| Construction | 20 (100.0%) | 0 (0.0%) |
| Manufacturing | 12 (100.0%) | 0 (0.0%) |
| Wholesale Trade | 4 (100.0%) | 0 (0.0%) |
| Retail Trade | 11 (35.5%) | 20 (64.5%) |
| Transportation & Warehousing | 13 (100.0%) | 0 (0.0%) |
| Utilities | 0 (0.0%) | 0 (0.0%) |
| Information | 0 (0.0%) | 0 (0.0%) |
| Finance & Insurance | 0 (0.0%) | 8 (100.0%) |
| Real Estate, Rental & Leasing | 0 (0.0%) | 3 (100.0%) |
| Professional & Scientific | 0 (0.0%) | 0 (0.0%) |
| Enterprise Management | 0 (0.0%) | 0 (0.0%) |
| Administrative & Support | 7 (100.0%) | 0 (0.0%) |
| Educational Services | 8 (100.0%) | 0 (0.0%) |
| Health Care & Social Assistance | 6 (15.4%) | 33 (84.6%) |
| Arts, Entertainment & Recreation | 0 (0.0%) | 0 (0.0%) |
| Accommodation & Food Services | 2 (18.2%) | 9 (81.8%) |
| Public Administration | 8 (80.0%) | 2 (20.0%) |
| Total | 108 (58.4%) | 77 (41.6%) |
Education in Beverly
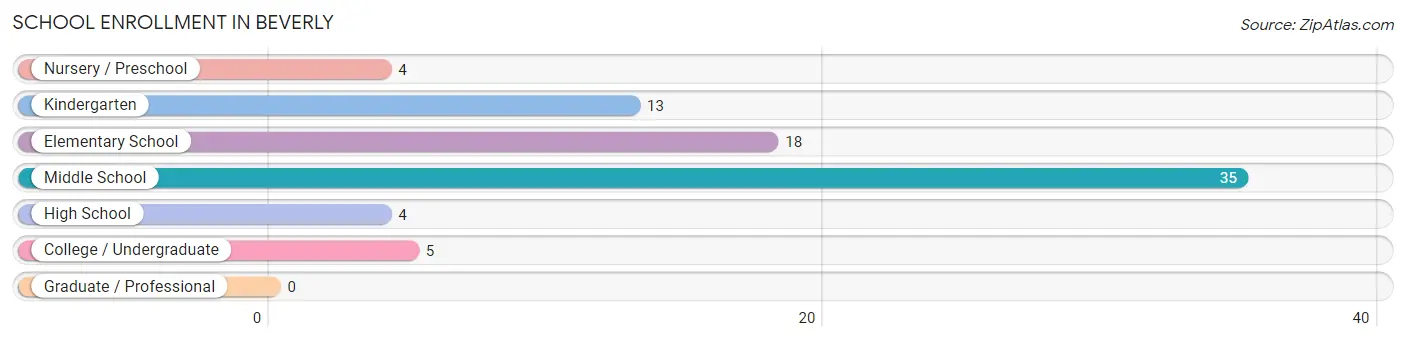
School Enrollment in Beverly
The most common levels of schooling among the 79 students in Beverly are middle school (35 | 44.3%), elementary school (18 | 22.8%), and kindergarten (13 | 16.5%).
| School Level | # Students | % Students |
| Nursery / Preschool | 4 | 5.1% |
| Kindergarten | 13 | 16.5% |
| Elementary School | 18 | 22.8% |
| Middle School | 35 | 44.3% |
| High School | 4 | 5.1% |
| College / Undergraduate | 5 | 6.3% |
| Graduate / Professional | 0 | 0.0% |
| Total | 79 | 100.0% |
School Enrollment by Age by Funding Source in Beverly
Out of a total of 79 students who are enrolled in schools in Beverly, 2 (2.5%) attend a private institution, while the remaining 77 (97.5%) are enrolled in public schools. The age group of 25 to 34 year olds has the highest likelihood of being enrolled in private schools, with 2 (40.0% in the age bracket) enrolled. Conversely, the age group of 3 to 4 year olds has the lowest likelihood of being enrolled in a private school, with 4 (100.0% in the age bracket) attending a public institution.
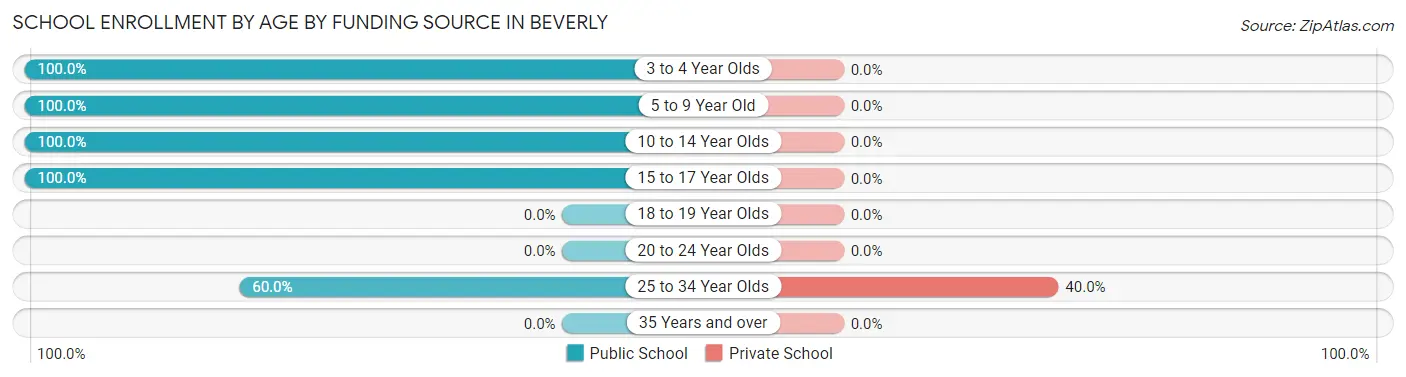
| Age Bracket | Public School | Private School |
| 3 to 4 Year Olds | 4 (100.0%) | 0 (0.0%) |
| 5 to 9 Year Old | 30 (100.0%) | 0 (0.0%) |
| 10 to 14 Year Olds | 36 (100.0%) | 0 (0.0%) |
| 15 to 17 Year Olds | 4 (100.0%) | 0 (0.0%) |
| 18 to 19 Year Olds | 0 (0.0%) | 0 (0.0%) |
| 20 to 24 Year Olds | 0 (0.0%) | 0 (0.0%) |
| 25 to 34 Year Olds | 3 (60.0%) | 2 (40.0%) |
| 35 Years and over | 0 (0.0%) | 0 (0.0%) |
| Total | 77 (97.5%) | 2 (2.5%) |
Educational Attainment by Field of Study in Beverly
Education (15 | 27.8%), computers & mathematics (10 | 18.5%), bio, nature & agricultural (9 | 16.7%), business (7 | 13.0%), and psychology (3 | 5.6%) are the most common fields of study among 54 individuals in Beverly who have obtained a bachelor's degree or higher.
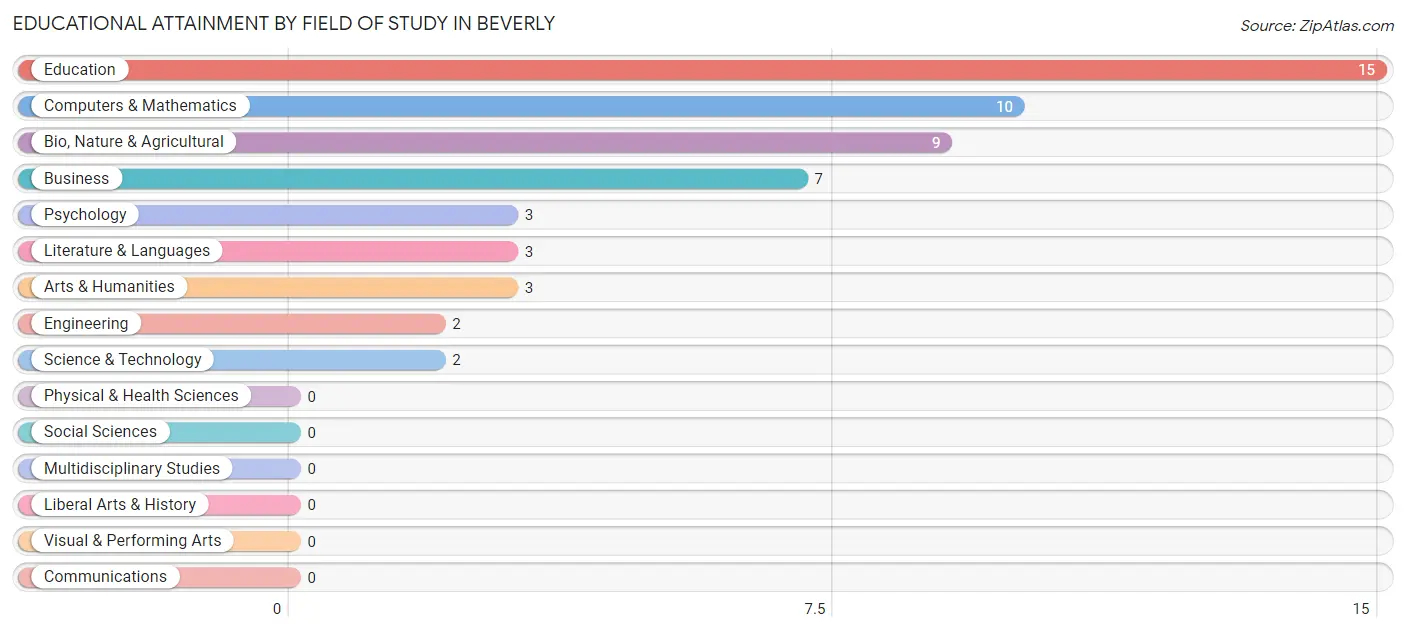
| Field of Study | # Graduates | % Graduates |
| Computers & Mathematics | 10 | 18.5% |
| Bio, Nature & Agricultural | 9 | 16.7% |
| Physical & Health Sciences | 0 | 0.0% |
| Psychology | 3 | 5.6% |
| Social Sciences | 0 | 0.0% |
| Engineering | 2 | 3.7% |
| Multidisciplinary Studies | 0 | 0.0% |
| Science & Technology | 2 | 3.7% |
| Business | 7 | 13.0% |
| Education | 15 | 27.8% |
| Literature & Languages | 3 | 5.6% |
| Liberal Arts & History | 0 | 0.0% |
| Visual & Performing Arts | 0 | 0.0% |
| Communications | 0 | 0.0% |
| Arts & Humanities | 3 | 5.6% |
| Total | 54 | 100.0% |
Transportation & Commute in Beverly
Vehicle Availability by Sex in Beverly
The most prevalent vehicle ownership categories in Beverly are males with 2 vehicles (62, accounting for 59.6%) and females with 2 vehicles (35, making up 80.5%).
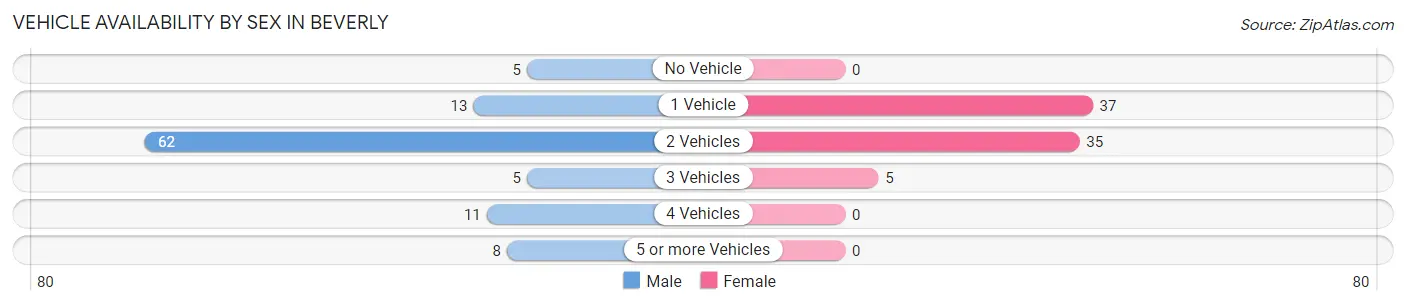
| Vehicles Available | Male | Female |
| No Vehicle | 5 (4.8%) | 0 (0.0%) |
| 1 Vehicle | 13 (12.5%) | 37 (48.0%) |
| 2 Vehicles | 62 (59.6%) | 35 (45.5%) |
| 3 Vehicles | 5 (4.8%) | 5 (6.5%) |
| 4 Vehicles | 11 (10.6%) | 0 (0.0%) |
| 5 or more Vehicles | 8 (7.7%) | 0 (0.0%) |
| Total | 104 (100.0%) | 77 (100.0%) |
Commute Time in Beverly
The most frequently occuring commute durations in Beverly are 10 to 14 minutes (51 commuters, 28.8%), 15 to 19 minutes (41 commuters, 23.2%), and 5 to 9 minutes (33 commuters, 18.6%).
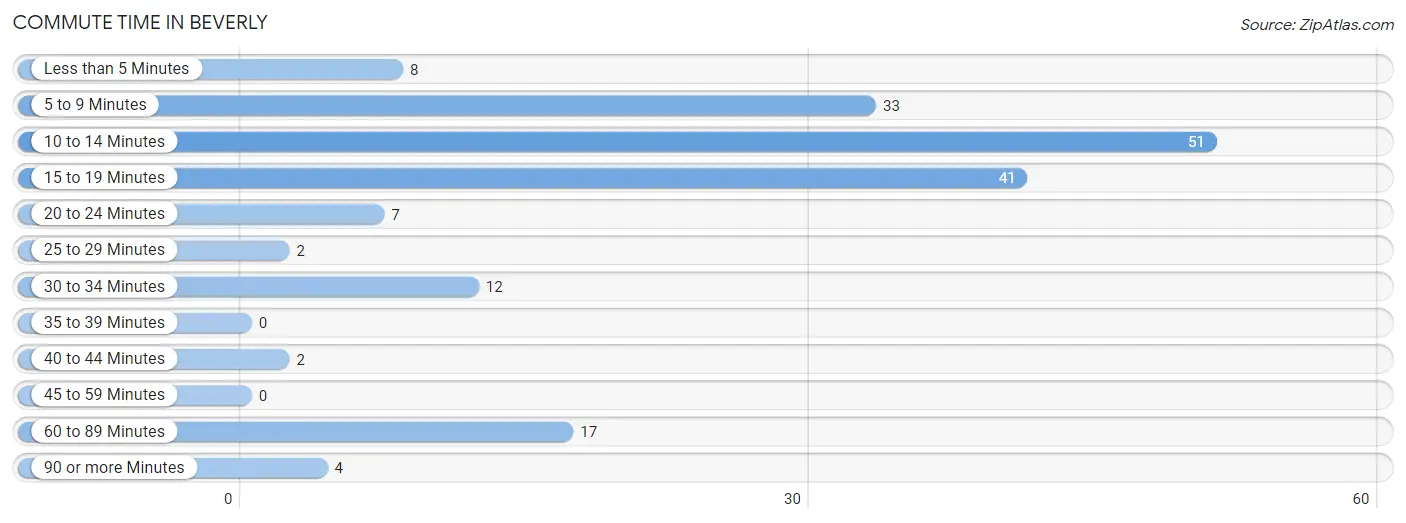
| Commute Time | # Commuters | % Commuters |
| Less than 5 Minutes | 8 | 4.5% |
| 5 to 9 Minutes | 33 | 18.6% |
| 10 to 14 Minutes | 51 | 28.8% |
| 15 to 19 Minutes | 41 | 23.2% |
| 20 to 24 Minutes | 7 | 4.0% |
| 25 to 29 Minutes | 2 | 1.1% |
| 30 to 34 Minutes | 12 | 6.8% |
| 35 to 39 Minutes | 0 | 0.0% |
| 40 to 44 Minutes | 2 | 1.1% |
| 45 to 59 Minutes | 0 | 0.0% |
| 60 to 89 Minutes | 17 | 9.6% |
| 90 or more Minutes | 4 | 2.3% |
Commute Time by Sex in Beverly
The most common commute times in Beverly are 10 to 14 minutes (41 commuters, 39.8%) for males and 15 to 19 minutes (22 commuters, 29.7%) for females.
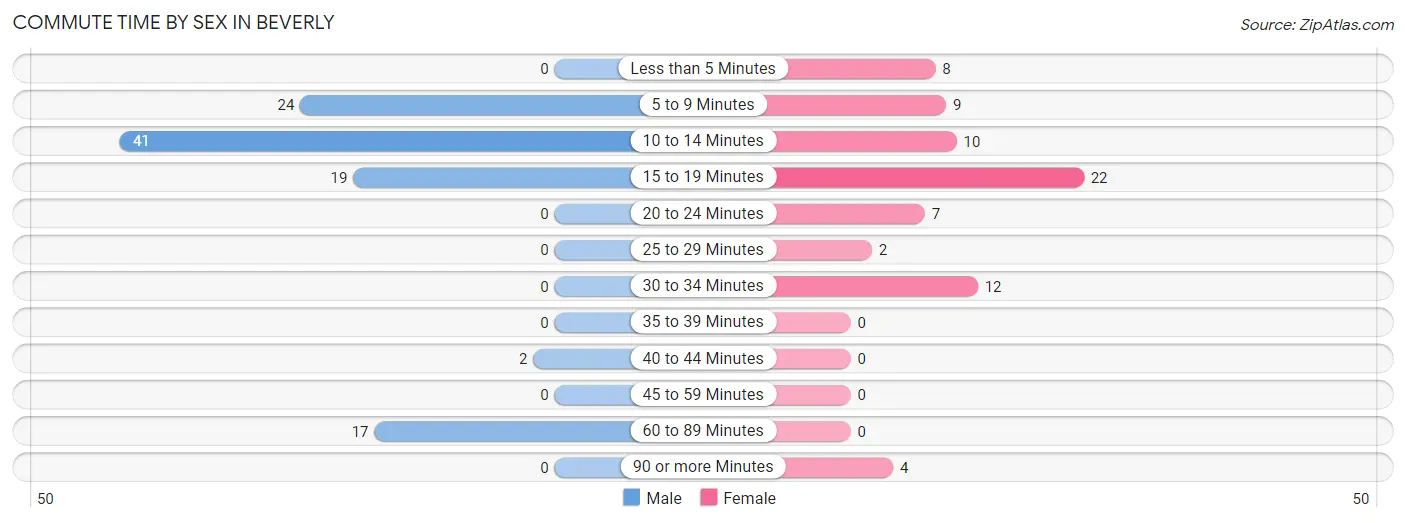
| Commute Time | Male | Female |
| Less than 5 Minutes | 0 (0.0%) | 8 (10.8%) |
| 5 to 9 Minutes | 24 (23.3%) | 9 (12.2%) |
| 10 to 14 Minutes | 41 (39.8%) | 10 (13.5%) |
| 15 to 19 Minutes | 19 (18.4%) | 22 (29.7%) |
| 20 to 24 Minutes | 0 (0.0%) | 7 (9.5%) |
| 25 to 29 Minutes | 0 (0.0%) | 2 (2.7%) |
| 30 to 34 Minutes | 0 (0.0%) | 12 (16.2%) |
| 35 to 39 Minutes | 0 (0.0%) | 0 (0.0%) |
| 40 to 44 Minutes | 2 (1.9%) | 0 (0.0%) |
| 45 to 59 Minutes | 0 (0.0%) | 0 (0.0%) |
| 60 to 89 Minutes | 17 (16.5%) | 0 (0.0%) |
| 90 or more Minutes | 0 (0.0%) | 4 (5.4%) |
Time of Departure to Work by Sex in Beverly
The most frequent times of departure to work in Beverly are 6:30 AM to 6:59 AM (29, 28.2%) for males and 7:00 AM to 7:29 AM (13, 17.6%) for females.
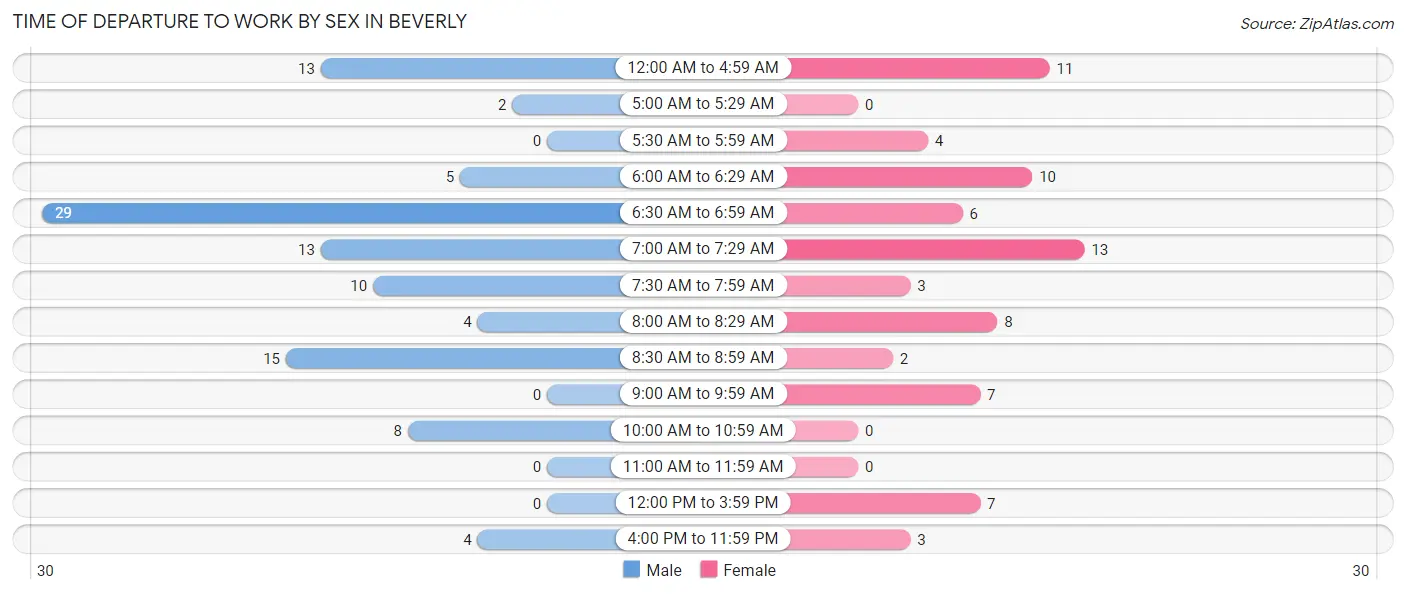
| Time of Departure | Male | Female |
| 12:00 AM to 4:59 AM | 13 (12.6%) | 11 (14.9%) |
| 5:00 AM to 5:29 AM | 2 (1.9%) | 0 (0.0%) |
| 5:30 AM to 5:59 AM | 0 (0.0%) | 4 (5.4%) |
| 6:00 AM to 6:29 AM | 5 (4.9%) | 10 (13.5%) |
| 6:30 AM to 6:59 AM | 29 (28.2%) | 6 (8.1%) |
| 7:00 AM to 7:29 AM | 13 (12.6%) | 13 (17.6%) |
| 7:30 AM to 7:59 AM | 10 (9.7%) | 3 (4.1%) |
| 8:00 AM to 8:29 AM | 4 (3.9%) | 8 (10.8%) |
| 8:30 AM to 8:59 AM | 15 (14.6%) | 2 (2.7%) |
| 9:00 AM to 9:59 AM | 0 (0.0%) | 7 (9.5%) |
| 10:00 AM to 10:59 AM | 8 (7.8%) | 0 (0.0%) |
| 11:00 AM to 11:59 AM | 0 (0.0%) | 0 (0.0%) |
| 12:00 PM to 3:59 PM | 0 (0.0%) | 7 (9.5%) |
| 4:00 PM to 11:59 PM | 4 (3.9%) | 3 (4.1%) |
| Total | 103 (100.0%) | 74 (100.0%) |
Housing Occupancy in Beverly
Occupancy by Ownership in Beverly
Of the total 292 dwellings in Beverly, owner-occupied units account for 130 (44.5%), while renter-occupied units make up 162 (55.5%).
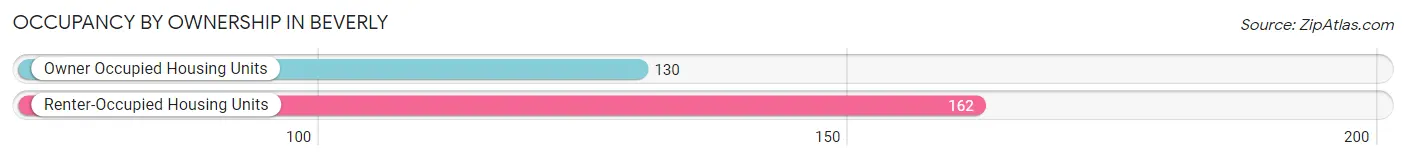
| Occupancy | # Housing Units | % Housing Units |
| Owner Occupied Housing Units | 130 | 44.5% |
| Renter-Occupied Housing Units | 162 | 55.5% |
| Total Occupied Housing Units | 292 | 100.0% |
Occupancy by Household Size in Beverly
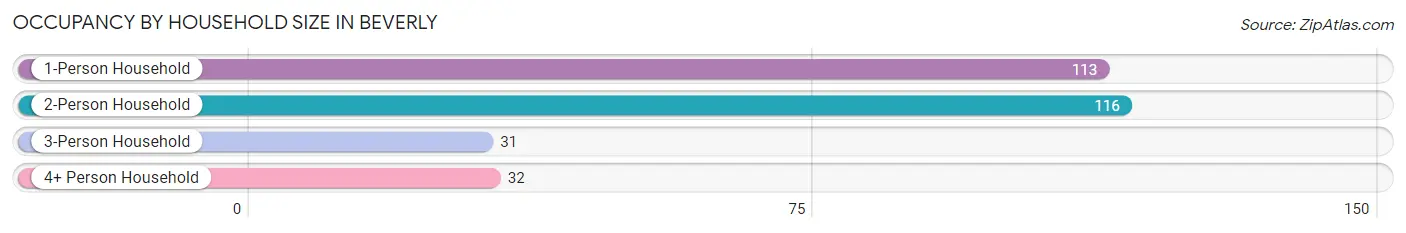
| Household Size | # Housing Units | % Housing Units |
| 1-Person Household | 113 | 38.7% |
| 2-Person Household | 116 | 39.7% |
| 3-Person Household | 31 | 10.6% |
| 4+ Person Household | 32 | 11.0% |
| Total Housing Units | 292 | 100.0% |
Occupancy by Ownership by Household Size in Beverly
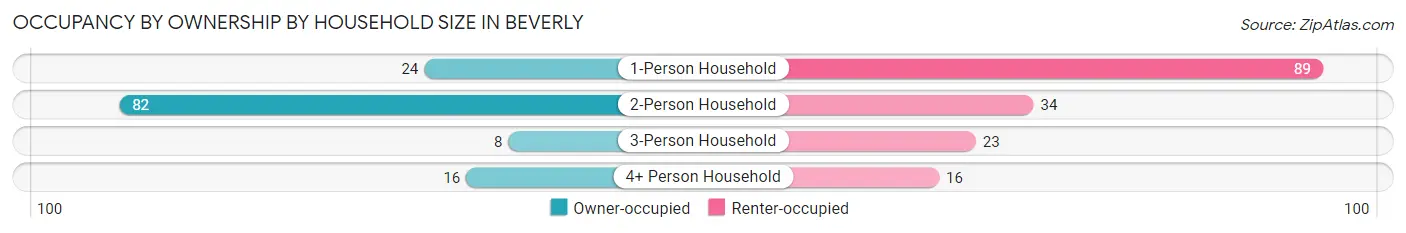
| Household Size | Owner-occupied | Renter-occupied |
| 1-Person Household | 24 (21.2%) | 89 (78.8%) |
| 2-Person Household | 82 (70.7%) | 34 (29.3%) |
| 3-Person Household | 8 (25.8%) | 23 (74.2%) |
| 4+ Person Household | 16 (50.0%) | 16 (50.0%) |
| Total Housing Units | 130 (44.5%) | 162 (55.5%) |
Occupancy by Educational Attainment in Beverly
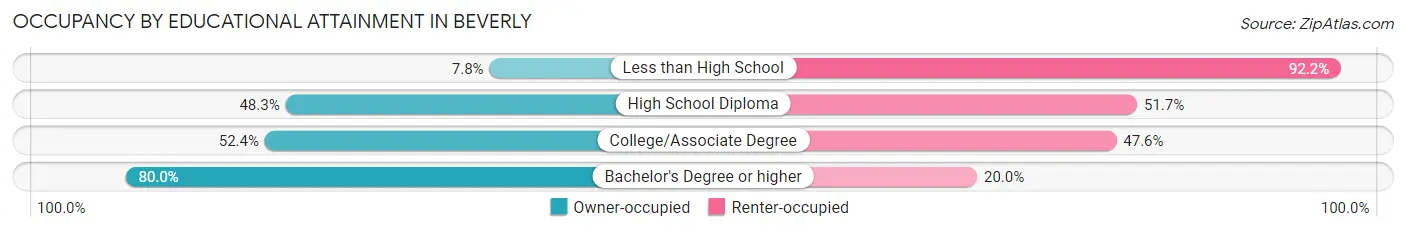
| Household Size | Owner-occupied | Renter-occupied |
| Less than High School | 4 (7.8%) | 47 (92.2%) |
| High School Diploma | 84 (48.3%) | 90 (51.7%) |
| College/Associate Degree | 22 (52.4%) | 20 (47.6%) |
| Bachelor's Degree or higher | 20 (80.0%) | 5 (20.0%) |
Occupancy by Age of Householder in Beverly
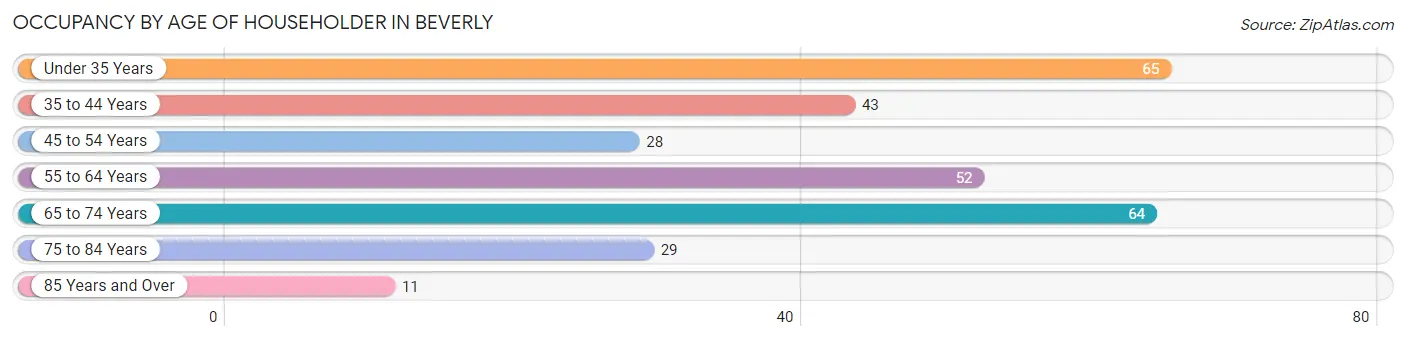
| Age Bracket | # Households | % Households |
| Under 35 Years | 65 | 22.3% |
| 35 to 44 Years | 43 | 14.7% |
| 45 to 54 Years | 28 | 9.6% |
| 55 to 64 Years | 52 | 17.8% |
| 65 to 74 Years | 64 | 21.9% |
| 75 to 84 Years | 29 | 9.9% |
| 85 Years and Over | 11 | 3.8% |
| Total | 292 | 100.0% |
Housing Finances in Beverly
Median Income by Occupancy in Beverly
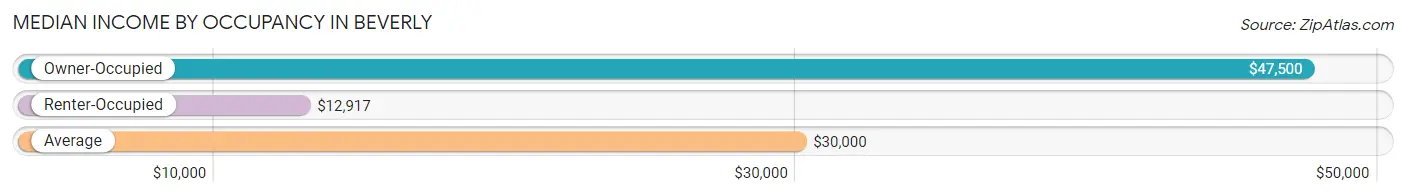
| Occupancy Type | # Households | Median Income |
| Owner-Occupied | 130 (44.5%) | $47,500 |
| Renter-Occupied | 162 (55.5%) | $12,917 |
| Average | 292 (100.0%) | $30,000 |
Occupancy by Householder Income Bracket in Beverly
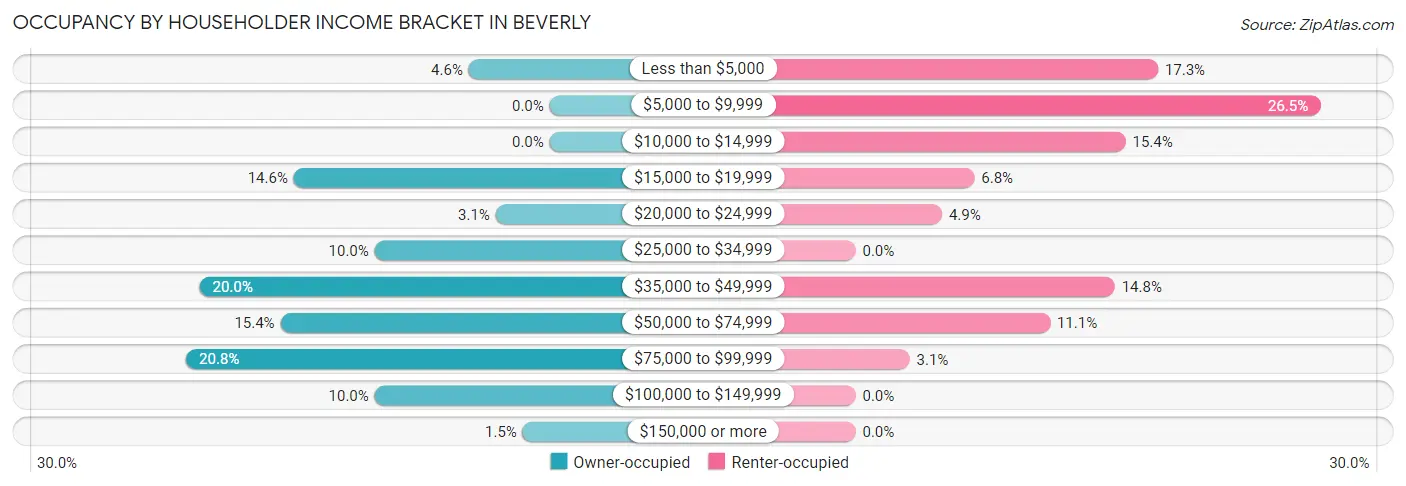
| Income Bracket | Owner-occupied | Renter-occupied |
| Less than $5,000 | 6 (4.6%) | 28 (17.3%) |
| $5,000 to $9,999 | 0 (0.0%) | 43 (26.5%) |
| $10,000 to $14,999 | 0 (0.0%) | 25 (15.4%) |
| $15,000 to $19,999 | 19 (14.6%) | 11 (6.8%) |
| $20,000 to $24,999 | 4 (3.1%) | 8 (4.9%) |
| $25,000 to $34,999 | 13 (10.0%) | 0 (0.0%) |
| $35,000 to $49,999 | 26 (20.0%) | 24 (14.8%) |
| $50,000 to $74,999 | 20 (15.4%) | 18 (11.1%) |
| $75,000 to $99,999 | 27 (20.8%) | 5 (3.1%) |
| $100,000 to $149,999 | 13 (10.0%) | 0 (0.0%) |
| $150,000 or more | 2 (1.5%) | 0 (0.0%) |
| Total | 130 (100.0%) | 162 (100.0%) |
Monthly Housing Cost Tiers in Beverly
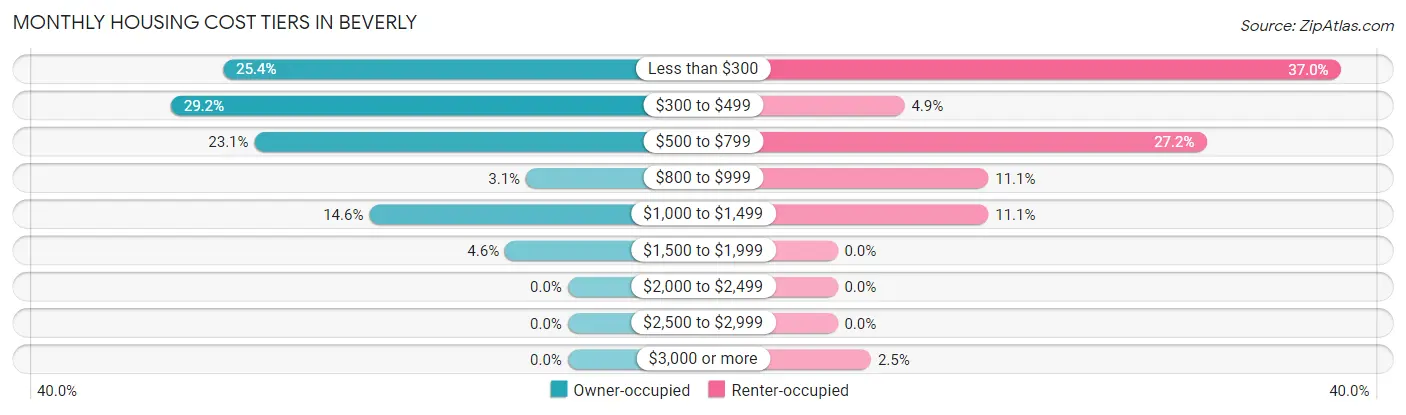
| Monthly Cost | Owner-occupied | Renter-occupied |
| Less than $300 | 33 (25.4%) | 60 (37.0%) |
| $300 to $499 | 38 (29.2%) | 8 (4.9%) |
| $500 to $799 | 30 (23.1%) | 44 (27.2%) |
| $800 to $999 | 4 (3.1%) | 18 (11.1%) |
| $1,000 to $1,499 | 19 (14.6%) | 18 (11.1%) |
| $1,500 to $1,999 | 6 (4.6%) | 0 (0.0%) |
| $2,000 to $2,499 | 0 (0.0%) | 0 (0.0%) |
| $2,500 to $2,999 | 0 (0.0%) | 0 (0.0%) |
| $3,000 or more | 0 (0.0%) | 4 (2.5%) |
| Total | 130 (100.0%) | 162 (100.0%) |
Physical Housing Characteristics in Beverly
Housing Structures in Beverly
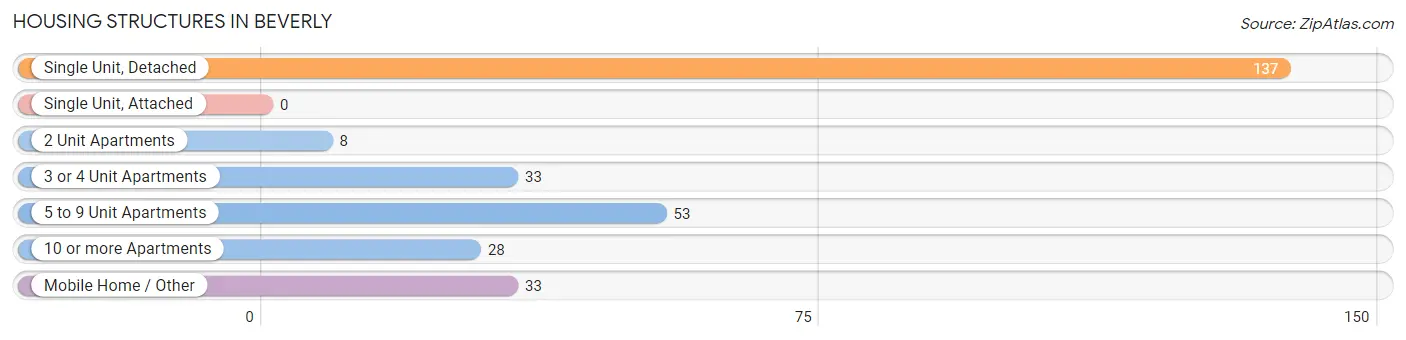
| Structure Type | # Housing Units | % Housing Units |
| Single Unit, Detached | 137 | 46.9% |
| Single Unit, Attached | 0 | 0.0% |
| 2 Unit Apartments | 8 | 2.7% |
| 3 or 4 Unit Apartments | 33 | 11.3% |
| 5 to 9 Unit Apartments | 53 | 18.1% |
| 10 or more Apartments | 28 | 9.6% |
| Mobile Home / Other | 33 | 11.3% |
| Total | 292 | 100.0% |
Housing Structures by Occupancy in Beverly
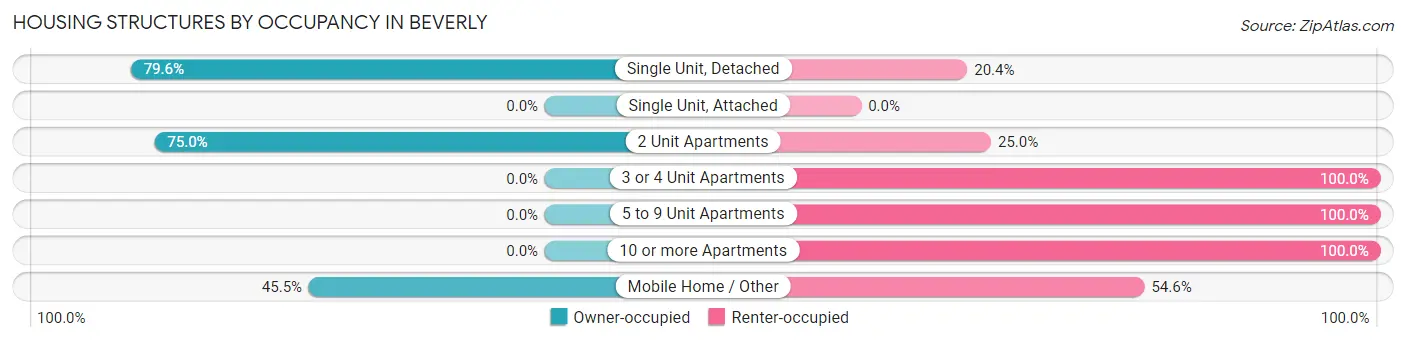
| Structure Type | Owner-occupied | Renter-occupied |
| Single Unit, Detached | 109 (79.6%) | 28 (20.4%) |
| Single Unit, Attached | 0 (0.0%) | 0 (0.0%) |
| 2 Unit Apartments | 6 (75.0%) | 2 (25.0%) |
| 3 or 4 Unit Apartments | 0 (0.0%) | 33 (100.0%) |
| 5 to 9 Unit Apartments | 0 (0.0%) | 53 (100.0%) |
| 10 or more Apartments | 0 (0.0%) | 28 (100.0%) |
| Mobile Home / Other | 15 (45.5%) | 18 (54.5%) |
| Total | 130 (44.5%) | 162 (55.5%) |
Housing Structures by Number of Rooms in Beverly
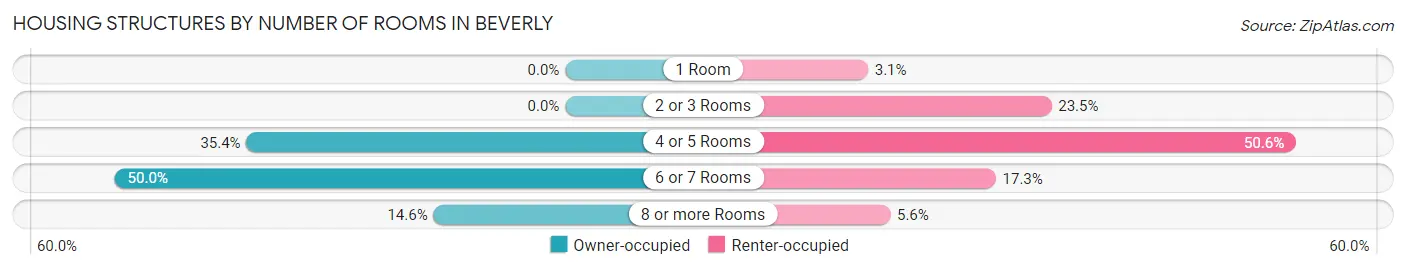
| Number of Rooms | Owner-occupied | Renter-occupied |
| 1 Room | 0 (0.0%) | 5 (3.1%) |
| 2 or 3 Rooms | 0 (0.0%) | 38 (23.5%) |
| 4 or 5 Rooms | 46 (35.4%) | 82 (50.6%) |
| 6 or 7 Rooms | 65 (50.0%) | 28 (17.3%) |
| 8 or more Rooms | 19 (14.6%) | 9 (5.6%) |
| Total | 130 (100.0%) | 162 (100.0%) |
Housing Structure by Heating Type in Beverly
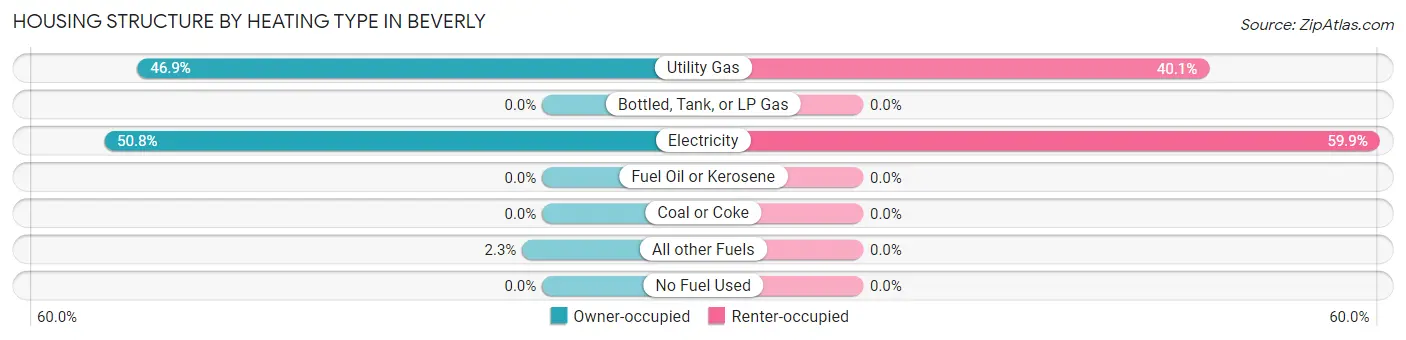
| Heating Type | Owner-occupied | Renter-occupied |
| Utility Gas | 61 (46.9%) | 65 (40.1%) |
| Bottled, Tank, or LP Gas | 0 (0.0%) | 0 (0.0%) |
| Electricity | 66 (50.8%) | 97 (59.9%) |
| Fuel Oil or Kerosene | 0 (0.0%) | 0 (0.0%) |
| Coal or Coke | 0 (0.0%) | 0 (0.0%) |
| All other Fuels | 3 (2.3%) | 0 (0.0%) |
| No Fuel Used | 0 (0.0%) | 0 (0.0%) |
| Total | 130 (100.0%) | 162 (100.0%) |
Household Vehicle Usage in Beverly
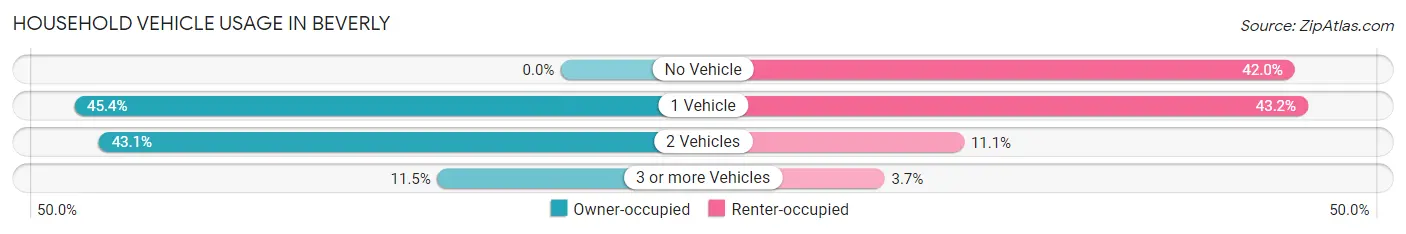
| Vehicles per Household | Owner-occupied | Renter-occupied |
| No Vehicle | 0 (0.0%) | 68 (42.0%) |
| 1 Vehicle | 59 (45.4%) | 70 (43.2%) |
| 2 Vehicles | 56 (43.1%) | 18 (11.1%) |
| 3 or more Vehicles | 15 (11.5%) | 6 (3.7%) |
| Total | 130 (100.0%) | 162 (100.0%) |
Real Estate & Mortgages in Beverly
Real Estate and Mortgage Overview in Beverly
| Characteristic | Without Mortgage | With Mortgage |
| Housing Units | 78 | 52 |
| Median Property Value | $127,500 | $118,800 |
| Median Household Income | $56,667 | $0 |
| Monthly Housing Costs | $361 | $0 |
| Real Estate Taxes | $491 | $0 |
Property Value by Mortgage Status in Beverly
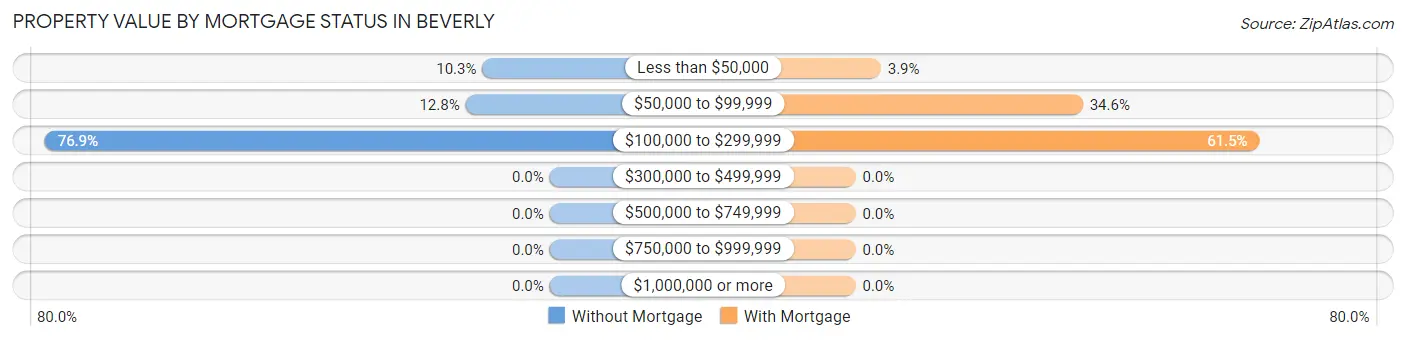
| Property Value | Without Mortgage | With Mortgage |
| Less than $50,000 | 8 (10.3%) | 2 (3.8%) |
| $50,000 to $99,999 | 10 (12.8%) | 18 (34.6%) |
| $100,000 to $299,999 | 60 (76.9%) | 32 (61.5%) |
| $300,000 to $499,999 | 0 (0.0%) | 0 (0.0%) |
| $500,000 to $749,999 | 0 (0.0%) | 0 (0.0%) |
| $750,000 to $999,999 | 0 (0.0%) | 0 (0.0%) |
| $1,000,000 or more | 0 (0.0%) | 0 (0.0%) |
| Total | 78 (100.0%) | 52 (100.0%) |
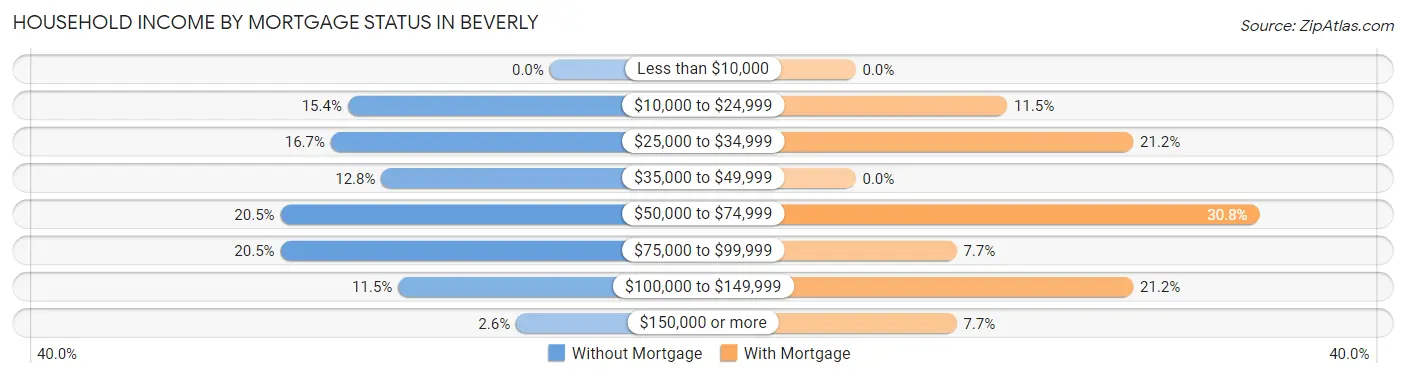
Household Income by Mortgage Status in Beverly
| Household Income | Without Mortgage | With Mortgage |
| Less than $10,000 | 0 (0.0%) | 0 (0.0%) |
| $10,000 to $24,999 | 12 (15.4%) | 6 (11.5%) |
| $25,000 to $34,999 | 13 (16.7%) | 11 (21.1%) |
| $35,000 to $49,999 | 10 (12.8%) | 0 (0.0%) |
| $50,000 to $74,999 | 16 (20.5%) | 16 (30.8%) |
| $75,000 to $99,999 | 16 (20.5%) | 4 (7.7%) |
| $100,000 to $149,999 | 9 (11.5%) | 11 (21.1%) |
| $150,000 or more | 2 (2.6%) | 4 (7.7%) |
| Total | 78 (100.0%) | 52 (100.0%) |
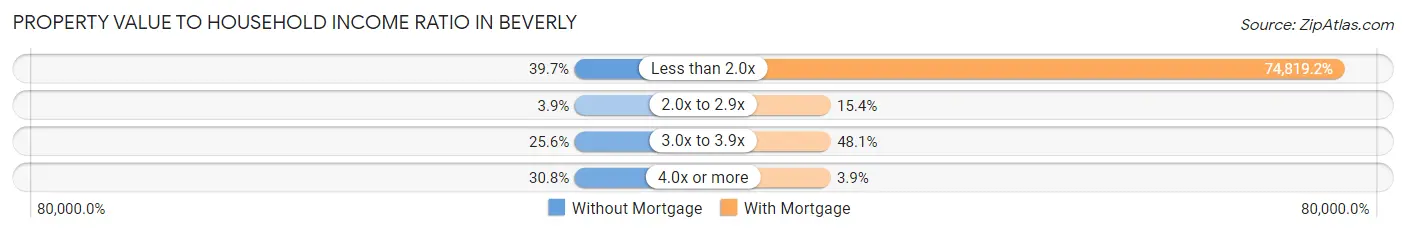
Property Value to Household Income Ratio in Beverly
| Value-to-Income Ratio | Without Mortgage | With Mortgage |
| Less than 2.0x | 31 (39.7%) | 38,906 (74,819.2%) |
| 2.0x to 2.9x | 3 (3.8%) | 8 (15.4%) |
| 3.0x to 3.9x | 20 (25.6%) | 25 (48.1%) |
| 4.0x or more | 24 (30.8%) | 2 (3.8%) |
| Total | 78 (100.0%) | 52 (100.0%) |
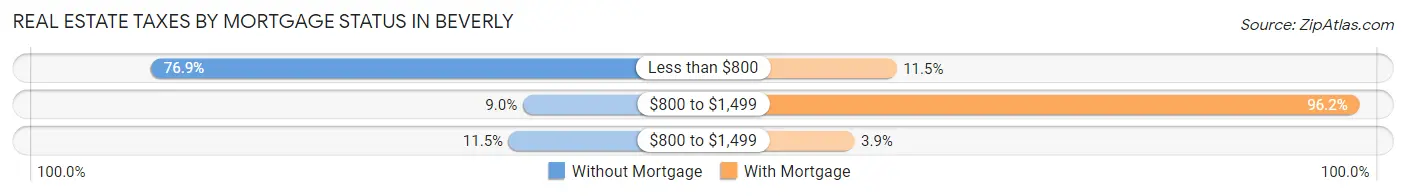
Real Estate Taxes by Mortgage Status in Beverly
| Property Taxes | Without Mortgage | With Mortgage |
| Less than $800 | 60 (76.9%) | 6 (11.5%) |
| $800 to $1,499 | 7 (9.0%) | 50 (96.2%) |
| $800 to $1,499 | 9 (11.5%) | 2 (3.8%) |
| Total | 78 (100.0%) | 52 (100.0%) |
Health & Disability in Beverly
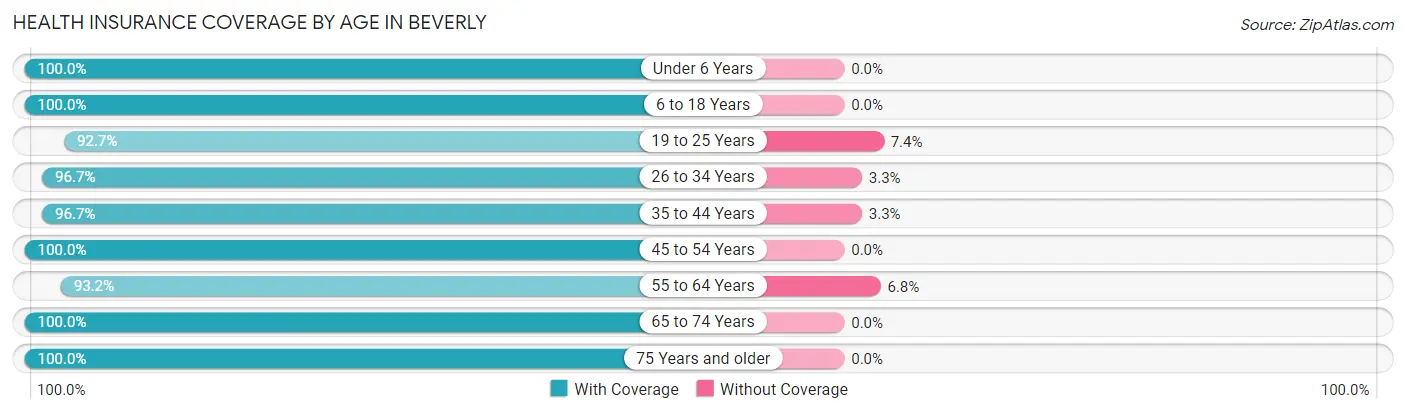
Health Insurance Coverage by Age in Beverly
| Age Bracket | With Coverage | Without Coverage |
| Under 6 Years | 92 (100.0%) | 0 (0.0%) |
| 6 to 18 Years | 72 (100.0%) | 0 (0.0%) |
| 19 to 25 Years | 63 (92.6%) | 5 (7.3%) |
| 26 to 34 Years | 59 (96.7%) | 2 (3.3%) |
| 35 to 44 Years | 59 (96.7%) | 2 (3.3%) |
| 45 to 54 Years | 48 (100.0%) | 0 (0.0%) |
| 55 to 64 Years | 69 (93.2%) | 5 (6.8%) |
| 65 to 74 Years | 103 (100.0%) | 0 (0.0%) |
| 75 Years and older | 56 (100.0%) | 0 (0.0%) |
| Total | 621 (97.8%) | 14 (2.2%) |
Health Insurance Coverage by Citizenship Status in Beverly
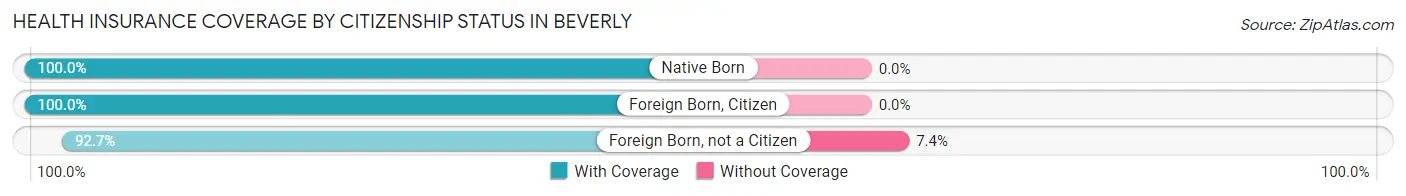
| Citizenship Status | With Coverage | Without Coverage |
| Native Born | 92 (100.0%) | 0 (0.0%) |
| Foreign Born, Citizen | 72 (100.0%) | 0 (0.0%) |
| Foreign Born, not a Citizen | 63 (92.6%) | 5 (7.3%) |
Health Insurance Coverage by Household Income in Beverly
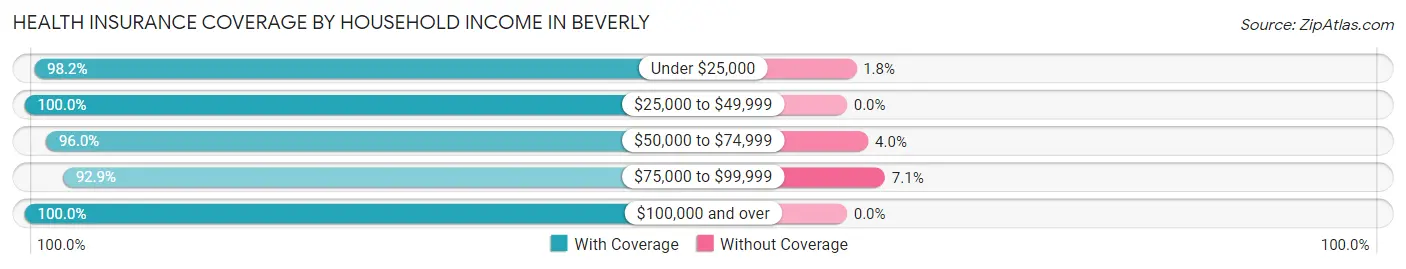
| Household Income | With Coverage | Without Coverage |
| Under $25,000 | 277 (98.2%) | 5 (1.8%) |
| $25,000 to $49,999 | 134 (100.0%) | 0 (0.0%) |
| $50,000 to $74,999 | 96 (96.0%) | 4 (4.0%) |
| $75,000 to $99,999 | 65 (92.9%) | 5 (7.1%) |
| $100,000 and over | 46 (100.0%) | 0 (0.0%) |
Public vs Private Health Insurance Coverage by Age in Beverly
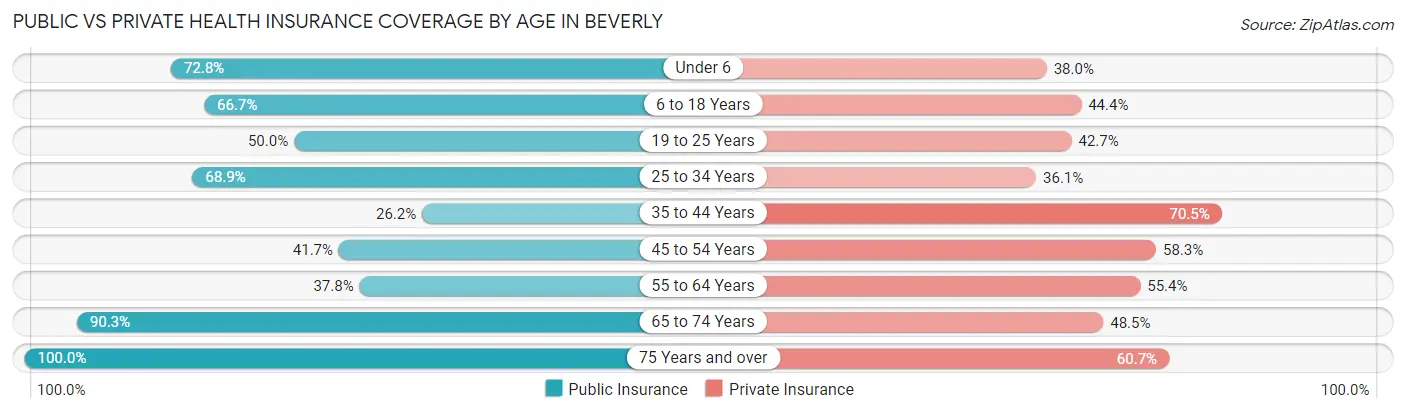
| Age Bracket | Public Insurance | Private Insurance |
| Under 6 | 67 (72.8%) | 35 (38.0%) |
| 6 to 18 Years | 48 (66.7%) | 32 (44.4%) |
| 19 to 25 Years | 34 (50.0%) | 29 (42.6%) |
| 25 to 34 Years | 42 (68.9%) | 22 (36.1%) |
| 35 to 44 Years | 16 (26.2%) | 43 (70.5%) |
| 45 to 54 Years | 20 (41.7%) | 28 (58.3%) |
| 55 to 64 Years | 28 (37.8%) | 41 (55.4%) |
| 65 to 74 Years | 93 (90.3%) | 50 (48.5%) |
| 75 Years and over | 56 (100.0%) | 34 (60.7%) |
| Total | 404 (63.6%) | 314 (49.4%) |
Disability Status by Sex by Age in Beverly
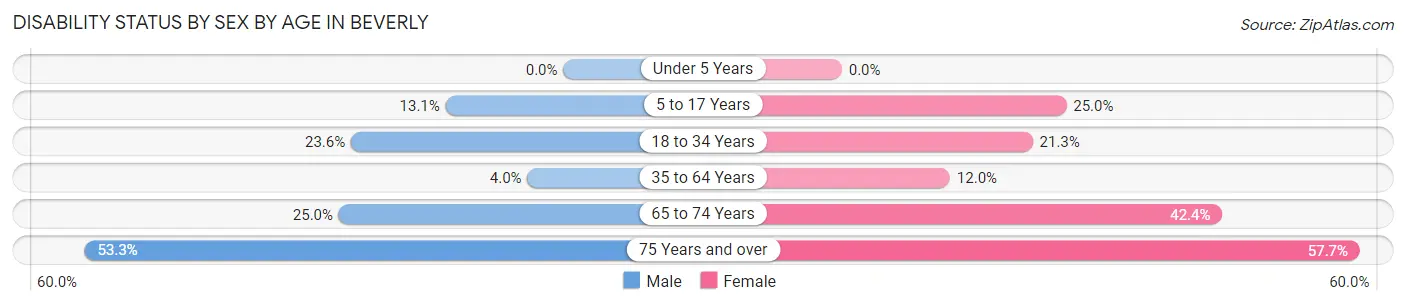
| Age Bracket | Male | Female |
| Under 5 Years | 0 (0.0%) | 0 (0.0%) |
| 5 to 17 Years | 8 (13.1%) | 6 (25.0%) |
| 18 to 34 Years | 13 (23.6%) | 17 (21.2%) |
| 35 to 64 Years | 3 (4.0%) | 13 (12.0%) |
| 65 to 74 Years | 11 (25.0%) | 25 (42.4%) |
| 75 Years and over | 16 (53.3%) | 15 (57.7%) |
Disability Class by Sex by Age in Beverly
Disability Class: Hearing Difficulty
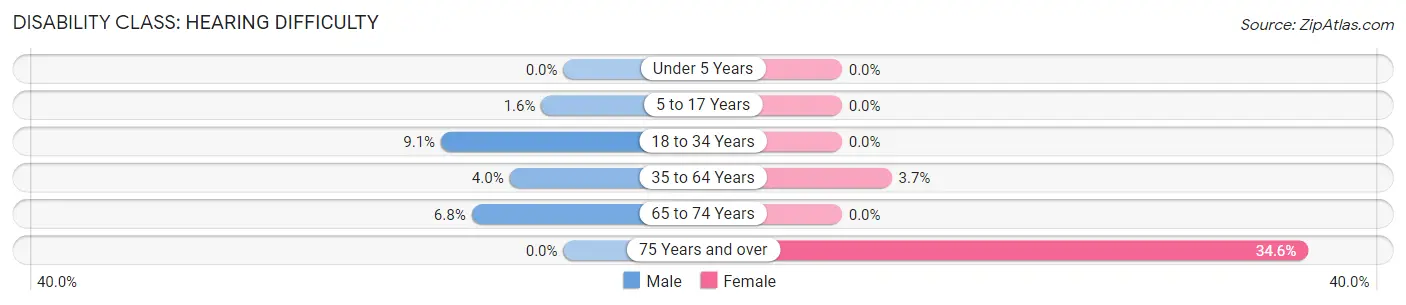
| Age Bracket | Male | Female |
| Under 5 Years | 0 (0.0%) | 0 (0.0%) |
| 5 to 17 Years | 1 (1.6%) | 0 (0.0%) |
| 18 to 34 Years | 5 (9.1%) | 0 (0.0%) |
| 35 to 64 Years | 3 (4.0%) | 4 (3.7%) |
| 65 to 74 Years | 3 (6.8%) | 0 (0.0%) |
| 75 Years and over | 0 (0.0%) | 9 (34.6%) |
Disability Class: Vision Difficulty
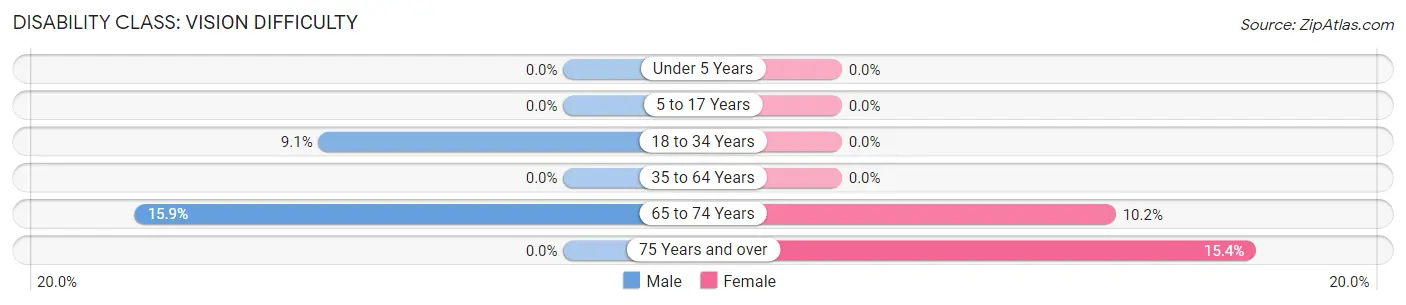
| Age Bracket | Male | Female |
| Under 5 Years | 0 (0.0%) | 0 (0.0%) |
| 5 to 17 Years | 0 (0.0%) | 0 (0.0%) |
| 18 to 34 Years | 5 (9.1%) | 0 (0.0%) |
| 35 to 64 Years | 0 (0.0%) | 0 (0.0%) |
| 65 to 74 Years | 7 (15.9%) | 6 (10.2%) |
| 75 Years and over | 0 (0.0%) | 4 (15.4%) |
Disability Class: Cognitive Difficulty
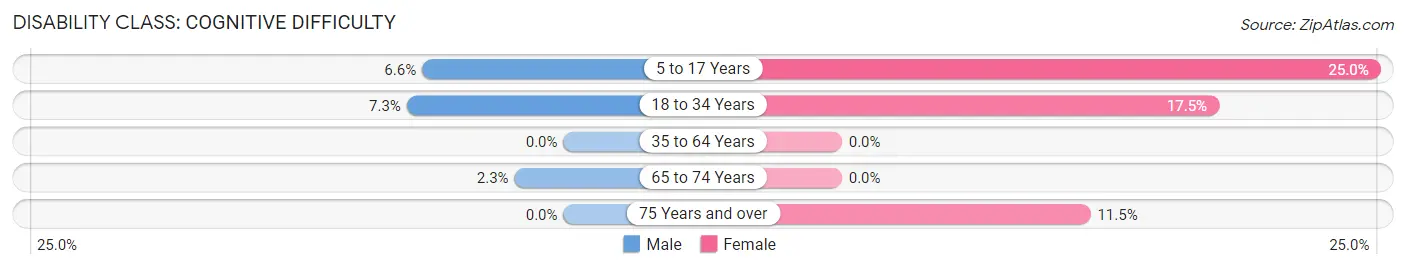
| Age Bracket | Male | Female |
| 5 to 17 Years | 4 (6.6%) | 6 (25.0%) |
| 18 to 34 Years | 4 (7.3%) | 14 (17.5%) |
| 35 to 64 Years | 0 (0.0%) | 0 (0.0%) |
| 65 to 74 Years | 1 (2.3%) | 0 (0.0%) |
| 75 Years and over | 0 (0.0%) | 3 (11.5%) |
Disability Class: Ambulatory Difficulty
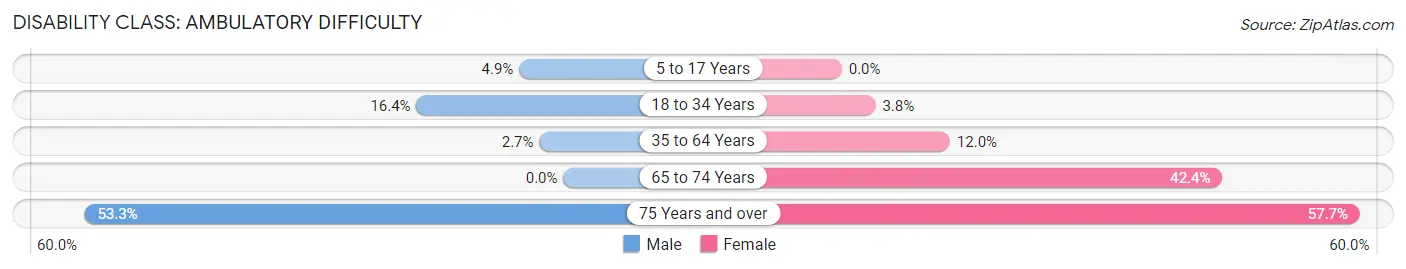
| Age Bracket | Male | Female |
| 5 to 17 Years | 3 (4.9%) | 0 (0.0%) |
| 18 to 34 Years | 9 (16.4%) | 3 (3.7%) |
| 35 to 64 Years | 2 (2.7%) | 13 (12.0%) |
| 65 to 74 Years | 0 (0.0%) | 25 (42.4%) |
| 75 Years and over | 16 (53.3%) | 15 (57.7%) |
Disability Class: Self-Care Difficulty
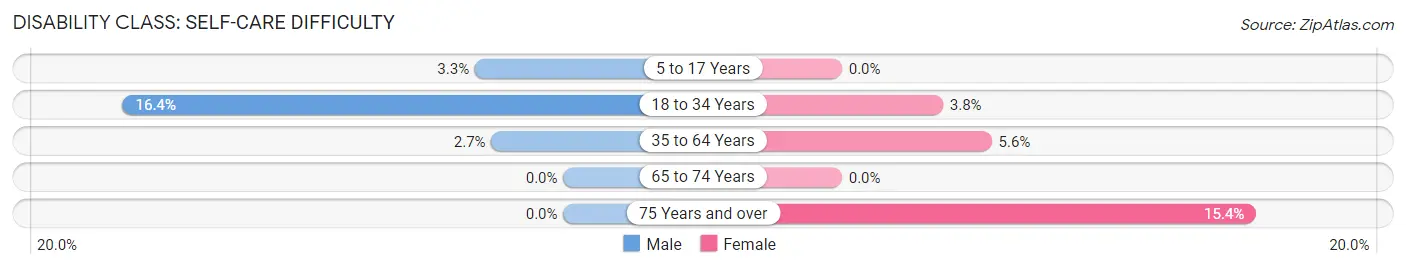
| Age Bracket | Male | Female |
| 5 to 17 Years | 2 (3.3%) | 0 (0.0%) |
| 18 to 34 Years | 9 (16.4%) | 3 (3.7%) |
| 35 to 64 Years | 2 (2.7%) | 6 (5.6%) |
| 65 to 74 Years | 0 (0.0%) | 0 (0.0%) |
| 75 Years and over | 0 (0.0%) | 4 (15.4%) |
Technology Access in Beverly
Computing Device Access in Beverly
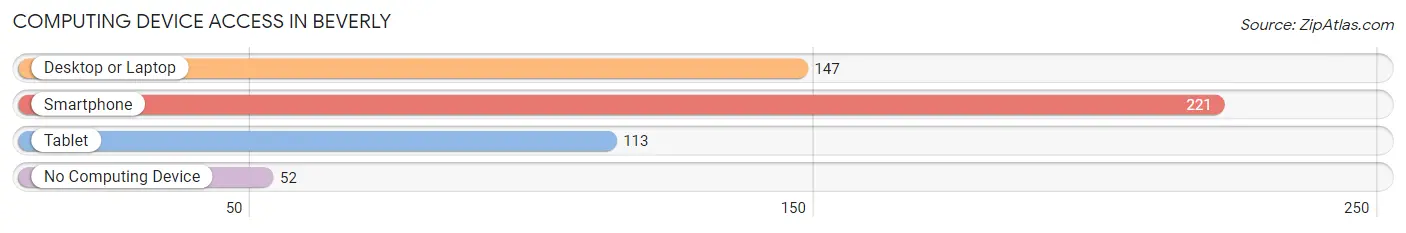
| Device Type | # Households | % Households |
| Desktop or Laptop | 147 | 50.3% |
| Smartphone | 221 | 75.7% |
| Tablet | 113 | 38.7% |
| No Computing Device | 52 | 17.8% |
| Total | 292 | 100.0% |
Internet Access in Beverly
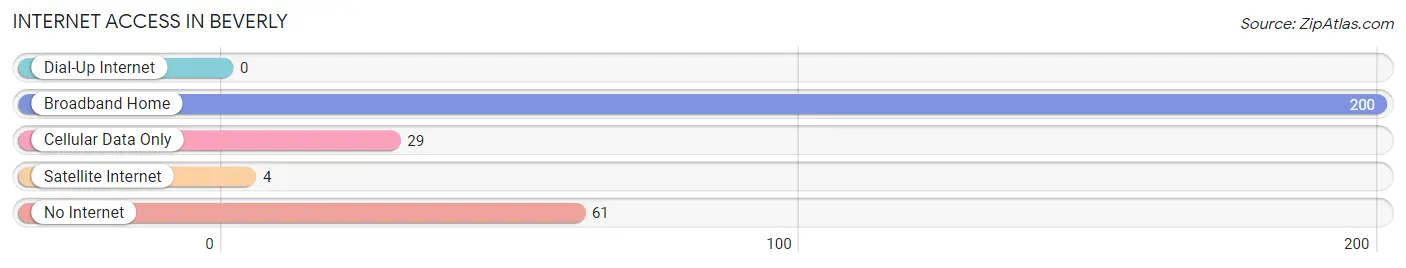
| Internet Type | # Households | % Households |
| Dial-Up Internet | 0 | 0.0% |
| Broadband Home | 200 | 68.5% |
| Cellular Data Only | 29 | 9.9% |
| Satellite Internet | 4 | 1.4% |
| No Internet | 61 | 20.9% |
| Total | 292 | 100.0% |
Beverly Summary
Beverly, West Virginia is a small town located in Randolph County, West Virginia. It is situated in the Appalachian Mountains and is part of the Potomac Highlands region. The town was founded in 1817 and is the oldest town in Randolph County. The population of Beverly in 2020 was estimated to be 1,072.
History
Beverly was founded in 1817 by a group of settlers from Pennsylvania. The town was named after the daughter of one of the settlers, Beverly Randolph. The town was originally a farming community and was known for its apple orchards. In the late 19th century, the town began to grow and develop as a commercial center. The town was incorporated in 1891 and the first mayor was elected in 1892.
In the early 20th century, Beverly became a popular tourist destination due to its proximity to the Monongahela National Forest. The town was also home to several resorts and hotels. In the 1950s, the town began to decline as the coal industry in the area declined. The town has since seen a resurgence in recent years as it has become a popular destination for outdoor recreation.
Geography
Beverly is located in the Appalachian Mountains in Randolph County, West Virginia. The town is situated in the Potomac Highlands region and is surrounded by the Monongahela National Forest. The town is located at an elevation of 1,845 feet and has a total area of 0.7 square miles. The town is located near the Tygart Valley River and is approximately 30 miles from Elkins, West Virginia.
Economy
The economy of Beverly is largely based on tourism and outdoor recreation. The town is home to several resorts and hotels, as well as several restaurants and shops. The town is also home to several outdoor recreation activities such as fishing, hunting, camping, and hiking. The town is also home to several small businesses, including a sawmill, a lumber yard, and a furniture store.
Demographics
As of the 2020 census, the population of Beverly was estimated to be 1,072. The racial makeup of the town was 97.2% White, 0.7% African American, 0.2% Native American, 0.2% Asian, 0.2% from other races, and 1.7% from two or more races. The median household income in Beverly was $37,917 and the median home value was $90,000. The town has a poverty rate of 16.3%.
Conclusion
Beverly, West Virginia is a small town located in Randolph County, West Virginia. It was founded in 1817 and is the oldest town in the county. The town is situated in the Appalachian Mountains and is part of the Potomac Highlands region. The economy of Beverly is largely based on tourism and outdoor recreation. The population of Beverly in 2020 was estimated to be 1,072 and the median household income was $37,917. The town has seen a resurgence in recent years as it has become a popular destination for outdoor recreation.
Common Questions
What is Per Capita Income in Beverly?
Per Capita income in Beverly is $18,141.
What is the Median Family Income in Beverly?
Median Family Income in Beverly is $39,141.
What is the Median Household income in Beverly?
Median Household Income in Beverly is $30,000.
What is Income or Wage Gap in Beverly?
Income or Wage Gap in Beverly is 48.0%.
Women in Beverly earn 52.0 cents for every dollar earned by a man.
What is Inequality or Gini Index in Beverly?
Inequality or Gini Index in Beverly is 0.48.
What is the Total Population of Beverly?
Total Population of Beverly is 681.
What is the Total Male Population of Beverly?
Total Male Population of Beverly is 336.
What is the Total Female Population of Beverly?
Total Female Population of Beverly is 345.
What is the Ratio of Males per 100 Females in Beverly?
There are 97.39 Males per 100 Females in Beverly.
What is the Ratio of Females per 100 Males in Beverly?
There are 102.68 Females per 100 Males in Beverly.
What is the Median Population Age in Beverly?
Median Population Age in Beverly is 41.7 Years.
What is the Average Family Size in Beverly
Average Family Size in Beverly is 2.9 People.
What is the Average Household Size in Beverly
Average Household Size in Beverly is 2.2 People.
How Large is the Labor Force in Beverly?
There are 199 People in the Labor Forcein in Beverly.
What is the Percentage of People in the Labor Force in Beverly?
38.0% of People are in the Labor Force in Beverly.
What is the Unemployment Rate in Beverly?
Unemployment Rate in Beverly is 7.0%.