Smithers, WV Map & Demographics
Smithers Map
Smithers Overview
$27,381
PER CAPITA INCOME
$51,979
AVG FAMILY INCOME
$31,536
AVG HOUSEHOLD INCOME
85.8%
WAGE / INCOME GAP [ % ]
14.2¢/ $1
WAGE / INCOME GAP [ $ ]
0.50
INEQUALITY / GINI INDEX
838
TOTAL POPULATION
321
MALE POPULATION
517
FEMALE POPULATION
62.09
MALES / 100 FEMALES
161.06
FEMALES / 100 MALES
54.8
MEDIAN AGE
2.9
AVG FAMILY SIZE
2.4
AVG HOUSEHOLD SIZE
247
LABOR FORCE [ PEOPLE ]
33.5%
PERCENT IN LABOR FORCE
5.3%
UNEMPLOYMENT RATE
Smithers Zip Codes
Smithers Area Codes
Income in Smithers
Income Overview in Smithers
Per Capita Income in Smithers is $27,381, while median incomes of families and households are $51,979 and $31,536 respectively.
| Characteristic | Number | Measure |
| Per Capita Income | 838 | $27,381 |
| Median Family Income | 203 | $51,979 |
| Mean Family Income | 203 | $62,814 |
| Median Household Income | 353 | $31,536 |
| Mean Household Income | 353 | $53,833 |
| Income Deficit | 203 | $0 |
| Wage / Income Gap (%) | 838 | 85.76% |
| Wage / Income Gap ($) | 838 | 14.24¢ per $1 |
| Gini / Inequality Index | 838 | 0.50 |
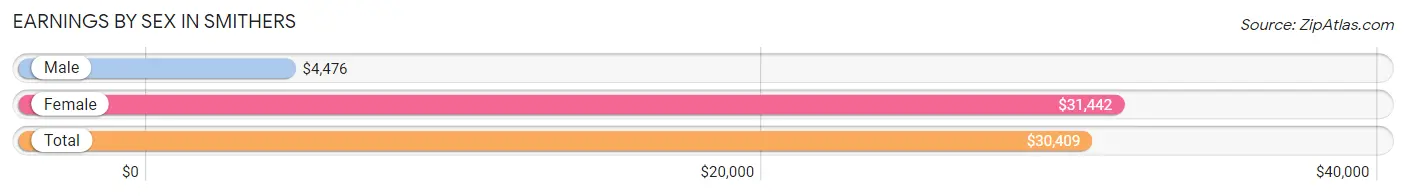
Earnings by Sex in Smithers
Average Earnings in Smithers are $30,409, $4,476 for men and $31,442 for women, a difference of 85.8%.
| Sex | Number | Average Earnings |
| Male | 98 (33.8%) | $4,476 |
| Female | 192 (66.2%) | $31,442 |
| Total | 290 (100.0%) | $30,409 |
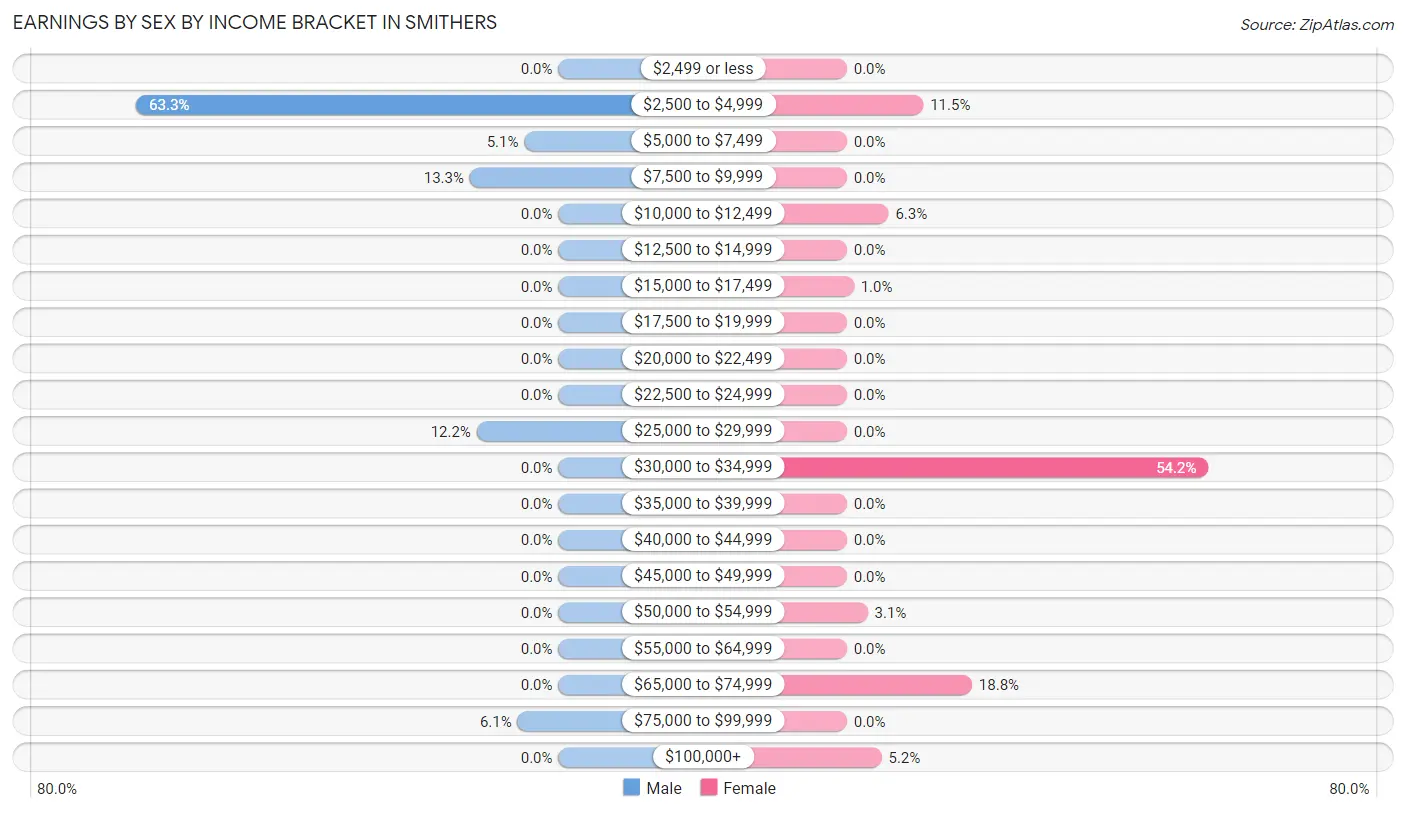
Earnings by Sex by Income Bracket in Smithers
The most common earnings brackets in Smithers are $2,500 to $4,999 for men (62 | 63.3%) and $30,000 to $34,999 for women (104 | 54.2%).
| Income | Male | Female |
| $2,499 or less | 0 (0.0%) | 0 (0.0%) |
| $2,500 to $4,999 | 62 (63.3%) | 22 (11.5%) |
| $5,000 to $7,499 | 5 (5.1%) | 0 (0.0%) |
| $7,500 to $9,999 | 13 (13.3%) | 0 (0.0%) |
| $10,000 to $12,499 | 0 (0.0%) | 12 (6.2%) |
| $12,500 to $14,999 | 0 (0.0%) | 0 (0.0%) |
| $15,000 to $17,499 | 0 (0.0%) | 2 (1.0%) |
| $17,500 to $19,999 | 0 (0.0%) | 0 (0.0%) |
| $20,000 to $22,499 | 0 (0.0%) | 0 (0.0%) |
| $22,500 to $24,999 | 0 (0.0%) | 0 (0.0%) |
| $25,000 to $29,999 | 12 (12.2%) | 0 (0.0%) |
| $30,000 to $34,999 | 0 (0.0%) | 104 (54.2%) |
| $35,000 to $39,999 | 0 (0.0%) | 0 (0.0%) |
| $40,000 to $44,999 | 0 (0.0%) | 0 (0.0%) |
| $45,000 to $49,999 | 0 (0.0%) | 0 (0.0%) |
| $50,000 to $54,999 | 0 (0.0%) | 6 (3.1%) |
| $55,000 to $64,999 | 0 (0.0%) | 0 (0.0%) |
| $65,000 to $74,999 | 0 (0.0%) | 36 (18.8%) |
| $75,000 to $99,999 | 6 (6.1%) | 0 (0.0%) |
| $100,000+ | 0 (0.0%) | 10 (5.2%) |
| Total | 98 (100.0%) | 192 (100.0%) |
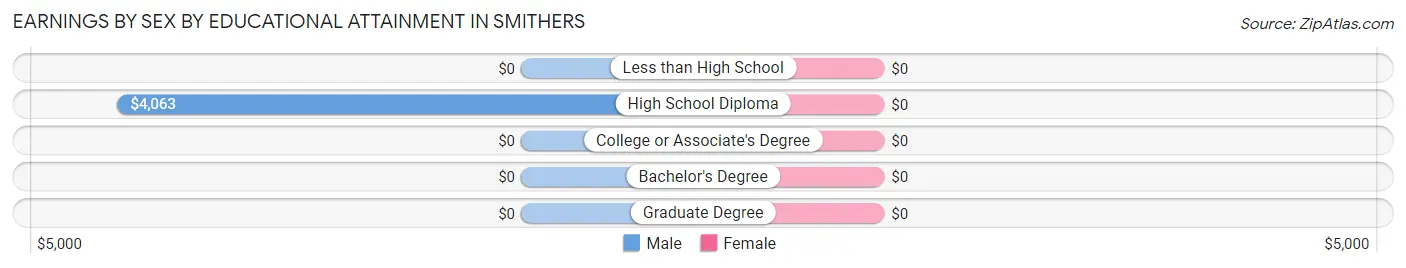
Earnings by Sex by Educational Attainment in Smithers
| Educational Attainment | Male Income | Female Income |
| Less than High School | - | - |
| High School Diploma | $4,063 | $0 |
| College or Associate's Degree | - | - |
| Bachelor's Degree | - | - |
| Graduate Degree | - | - |
| Total | $4,234 | $31,442 |
Family Income in Smithers
Family Income Brackets in Smithers
According to the Smithers family income data, there are 59 families falling into the $50,000 to $74,999 income range, which is the most common income bracket and makes up 29.1% of all families. Conversely, the $200,000+ income bracket is the least frequent group with only 4 families (2.0%) belonging to this category.
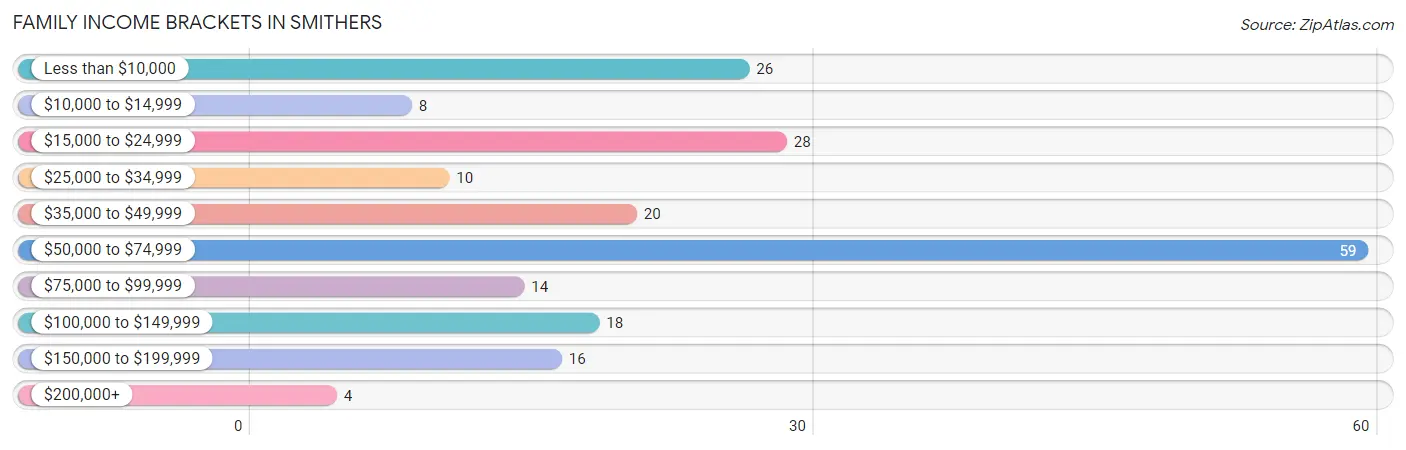
| Income Bracket | # Families | % Families |
| Less than $10,000 | 26 | 12.8% |
| $10,000 to $14,999 | 8 | 3.9% |
| $15,000 to $24,999 | 28 | 13.8% |
| $25,000 to $34,999 | 10 | 4.9% |
| $35,000 to $49,999 | 20 | 9.9% |
| $50,000 to $74,999 | 59 | 29.1% |
| $75,000 to $99,999 | 14 | 6.9% |
| $100,000 to $149,999 | 18 | 8.9% |
| $150,000 to $199,999 | 16 | 7.9% |
| $200,000+ | 4 | 2.0% |
Family Income by Famaliy Size in Smithers
2-person families (110 | 54.2%) account for the highest median family income in Smithers with $52,083 per family, while 2-person families (110 | 54.2%) have the highest median income of $26,042 per family member.
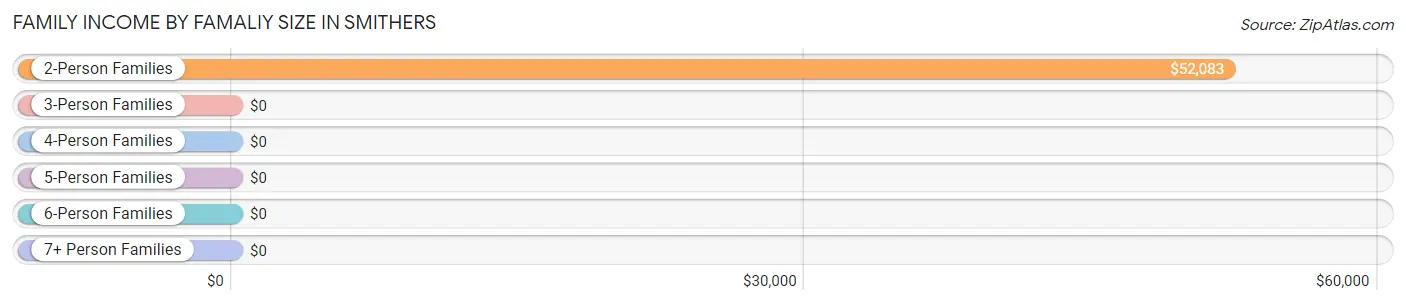
| Income Bracket | # Families | Median Income |
| 2-Person Families | 110 (54.2%) | $52,083 |
| 3-Person Families | 93 (45.8%) | $0 |
| 4-Person Families | 0 (0.0%) | $0 |
| 5-Person Families | 0 (0.0%) | $0 |
| 6-Person Families | 0 (0.0%) | $0 |
| 7+ Person Families | 0 (0.0%) | $0 |
| Total | 203 (100.0%) | $51,979 |
Family Income by Number of Earners in Smithers
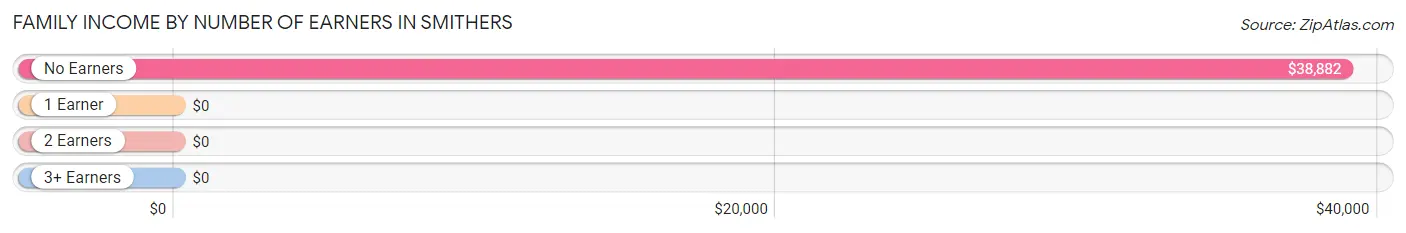
| Number of Earners | # Families | Median Income |
| No Earners | 109 (53.7%) | $38,882 |
| 1 Earner | 46 (22.7%) | $0 |
| 2 Earners | 48 (23.6%) | $0 |
| 3+ Earners | 0 (0.0%) | $0 |
| Total | 203 (100.0%) | $51,979 |
Household Income in Smithers
Household Income Brackets in Smithers
With 73 households falling in the category, the $25,000 to $34,999 income range is the most frequent in Smithers, accounting for 20.7% of all households. In contrast, only 4 households (1.1%) fall into the $200,000+ income bracket, making it the least populous group.
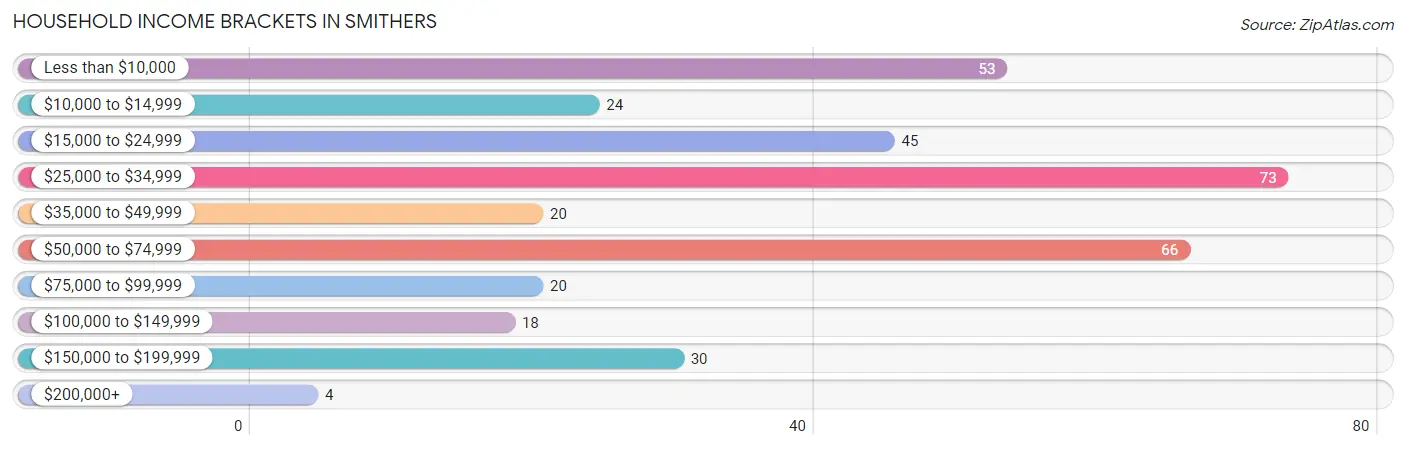
| Income Bracket | # Households | % Households |
| Less than $10,000 | 53 | 15.0% |
| $10,000 to $14,999 | 24 | 6.8% |
| $15,000 to $24,999 | 45 | 12.7% |
| $25,000 to $34,999 | 73 | 20.7% |
| $35,000 to $49,999 | 20 | 5.7% |
| $50,000 to $74,999 | 66 | 18.7% |
| $75,000 to $99,999 | 20 | 5.7% |
| $100,000 to $149,999 | 18 | 5.1% |
| $150,000 to $199,999 | 30 | 8.5% |
| $200,000+ | 4 | 1.1% |
Household Income by Householder Age in Smithers
The median household income in Smithers is $31,536, with the highest median household income of $60,417 found in the 65+ years age bracket for the primary householder. A total of 233 households (66.0%) fall into this category. Meanwhile, the 15 to 24 years age bracket for the primary householder has the lowest median household income of $0, with 25 households (7.1%) in this group.
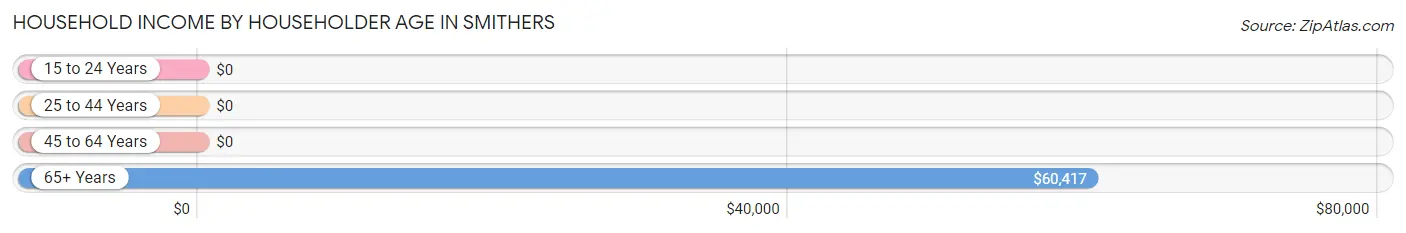
| Income Bracket | # Households | Median Income |
| 15 to 24 Years | 25 (7.1%) | $0 |
| 25 to 44 Years | 34 (9.6%) | $0 |
| 45 to 64 Years | 61 (17.3%) | $0 |
| 65+ Years | 233 (66.0%) | $60,417 |
| Total | 353 (100.0%) | $31,536 |
Poverty in Smithers
Income Below Poverty by Sex and Age in Smithers
With 42.7% poverty level for males and 34.4% for females among the residents of Smithers, under 5 year old males and under 5 year old females are the most vulnerable to poverty, with 26 males (100.0%) and 13 females (100.0%) in their respective age groups living below the poverty level.
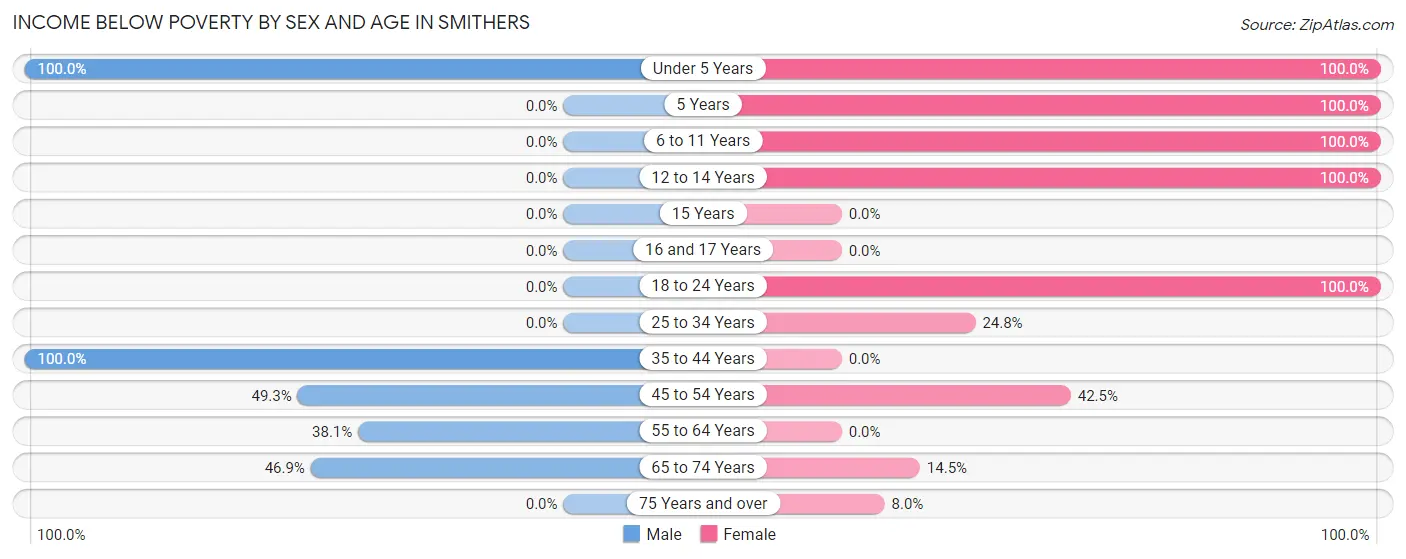
| Age Bracket | Male | Female |
| Under 5 Years | 26 (100.0%) | 13 (100.0%) |
| 5 Years | 0 (0.0%) | 17 (100.0%) |
| 6 to 11 Years | 0 (0.0%) | 17 (100.0%) |
| 12 to 14 Years | 0 (0.0%) | 25 (100.0%) |
| 15 Years | 0 (0.0%) | 0 (0.0%) |
| 16 and 17 Years | 0 (0.0%) | 0 (0.0%) |
| 18 to 24 Years | 0 (0.0%) | 13 (100.0%) |
| 25 to 34 Years | 0 (0.0%) | 33 (24.8%) |
| 35 to 44 Years | 13 (100.0%) | 0 (0.0%) |
| 45 to 54 Years | 37 (49.3%) | 34 (42.5%) |
| 55 to 64 Years | 8 (38.1%) | 0 (0.0%) |
| 65 to 74 Years | 53 (46.9%) | 19 (14.5%) |
| 75 Years and over | 0 (0.0%) | 7 (8.0%) |
| Total | 137 (42.7%) | 178 (34.4%) |
Income Above Poverty by Sex and Age in Smithers
According to the poverty statistics in Smithers, males aged 12 to 14 years and females aged 75 years and over are the age groups that are most secure financially, with 100.0% of males and 92.0% of females in these age groups living above the poverty line.
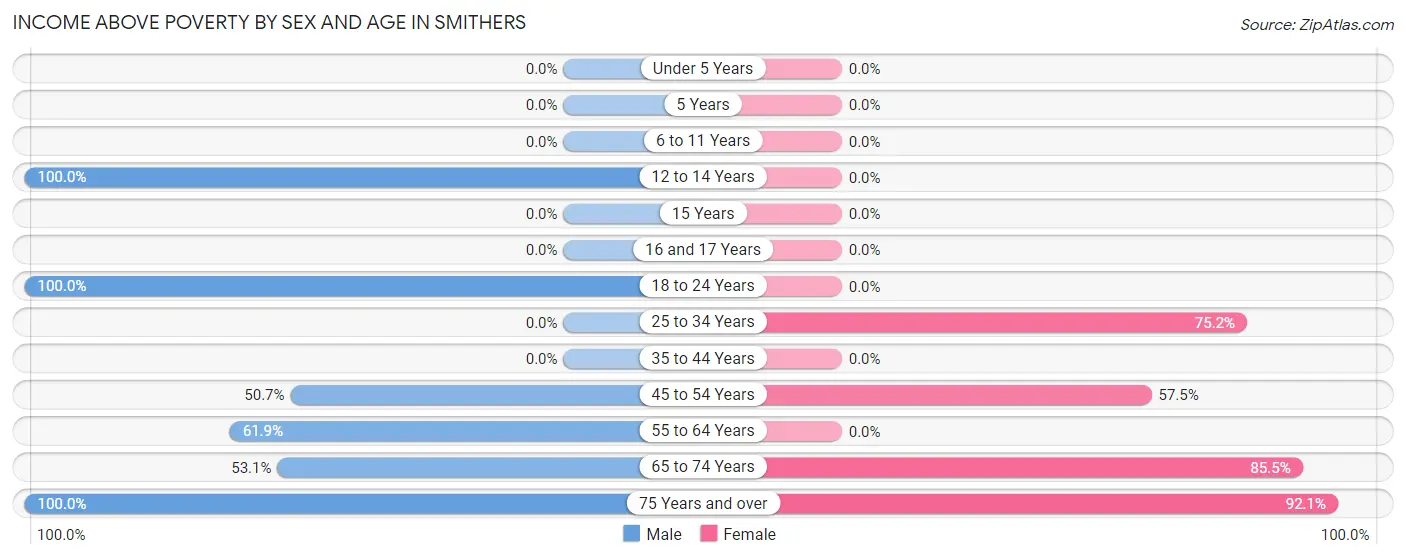
| Age Bracket | Male | Female |
| Under 5 Years | 0 (0.0%) | 0 (0.0%) |
| 5 Years | 0 (0.0%) | 0 (0.0%) |
| 6 to 11 Years | 0 (0.0%) | 0 (0.0%) |
| 12 to 14 Years | 2 (100.0%) | 0 (0.0%) |
| 15 Years | 0 (0.0%) | 0 (0.0%) |
| 16 and 17 Years | 0 (0.0%) | 0 (0.0%) |
| 18 to 24 Years | 12 (100.0%) | 0 (0.0%) |
| 25 to 34 Years | 0 (0.0%) | 100 (75.2%) |
| 35 to 44 Years | 0 (0.0%) | 0 (0.0%) |
| 45 to 54 Years | 38 (50.7%) | 46 (57.5%) |
| 55 to 64 Years | 13 (61.9%) | 0 (0.0%) |
| 65 to 74 Years | 60 (53.1%) | 112 (85.5%) |
| 75 Years and over | 59 (100.0%) | 81 (92.0%) |
| Total | 184 (57.3%) | 339 (65.6%) |
Income Below Poverty Among Married-Couple Families in Smithers
The poverty statistics for married-couple families in Smithers show that 22.4% or 28 of the total 125 families live below the poverty line. Families with 1 or 2 children have the highest poverty rate of 100.0%, comprising of 13 families. On the other hand, families with no children have the lowest poverty rate of 13.4%, which includes 15 families.
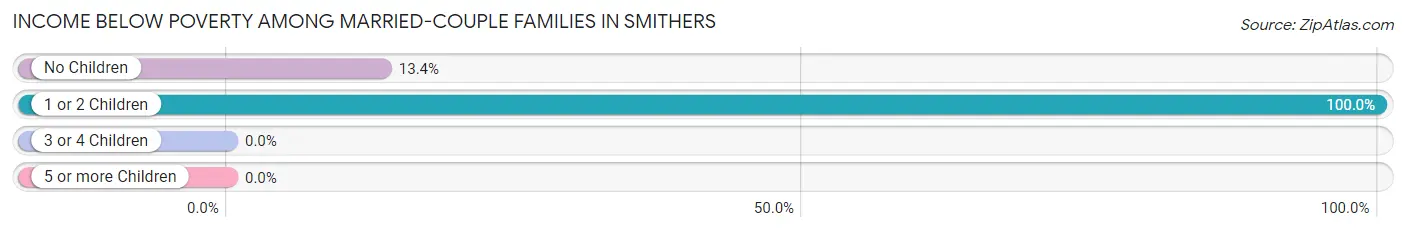
| Children | Above Poverty | Below Poverty |
| No Children | 97 (86.6%) | 15 (13.4%) |
| 1 or 2 Children | 0 (0.0%) | 13 (100.0%) |
| 3 or 4 Children | 0 (0.0%) | 0 (0.0%) |
| 5 or more Children | 0 (0.0%) | 0 (0.0%) |
| Total | 97 (77.6%) | 28 (22.4%) |
Income Below Poverty Among Single-Parent Households in Smithers
According to the poverty data in Smithers, 100.0% or 8 single-father households and 37.1% or 26 single-mother households are living below the poverty line. Among single-father households, those with 1 or 2 children have the highest poverty rate, with 8 households (100.0%) experiencing poverty. Likewise, among single-mother households, those with 1 or 2 children have the highest poverty rate, with 26 households (48.1%) falling below the poverty line.
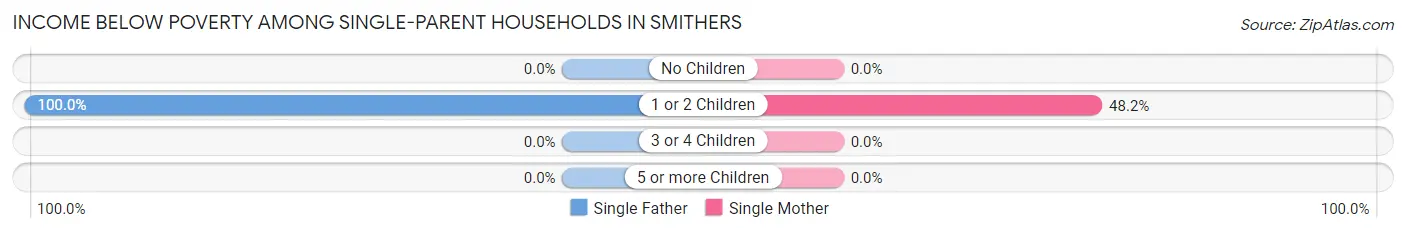
| Children | Single Father | Single Mother |
| No Children | 0 (0.0%) | 0 (0.0%) |
| 1 or 2 Children | 8 (100.0%) | 26 (48.1%) |
| 3 or 4 Children | 0 (0.0%) | 0 (0.0%) |
| 5 or more Children | 0 (0.0%) | 0 (0.0%) |
| Total | 8 (100.0%) | 26 (37.1%) |
Income Below Poverty Among Married-Couple vs Single-Parent Households in Smithers
The poverty data for Smithers shows that 28 of the married-couple family households (22.4%) and 34 of the single-parent households (43.6%) are living below the poverty level. Within the married-couple family households, those with 1 or 2 children have the highest poverty rate, with 13 households (100.0%) falling below the poverty line. Among the single-parent households, those with 1 or 2 children have the highest poverty rate, with 34 household (54.8%) living below poverty.
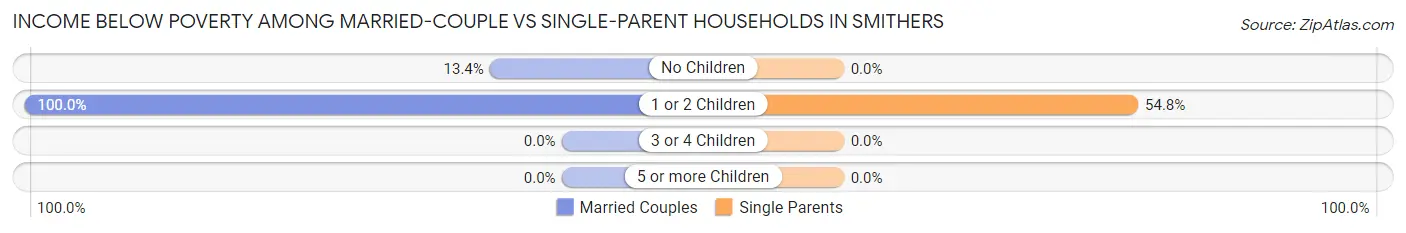
| Children | Married-Couple Families | Single-Parent Households |
| No Children | 15 (13.4%) | 0 (0.0%) |
| 1 or 2 Children | 13 (100.0%) | 34 (54.8%) |
| 3 or 4 Children | 0 (0.0%) | 0 (0.0%) |
| 5 or more Children | 0 (0.0%) | 0 (0.0%) |
| Total | 28 (22.4%) | 34 (43.6%) |
Race in Smithers
The most populous races in Smithers are White / Caucasian (669 | 79.8%), Hispanic or Latino (102 | 12.2%), and Two or more Races (102 | 12.2%).
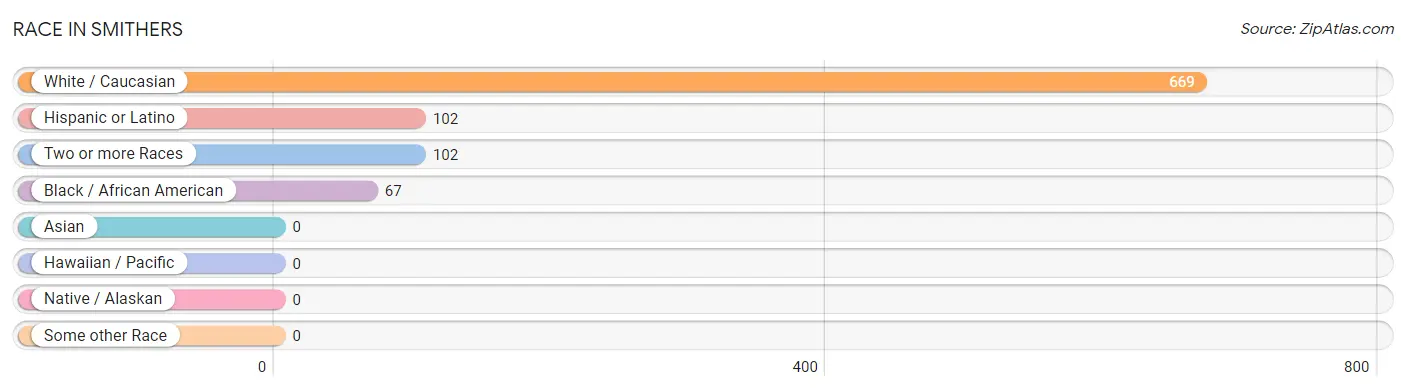
| Race | # Population | % Population |
| Asian | 0 | 0.0% |
| Black / African American | 67 | 8.0% |
| Hawaiian / Pacific | 0 | 0.0% |
| Hispanic or Latino | 102 | 12.2% |
| Native / Alaskan | 0 | 0.0% |
| White / Caucasian | 669 | 79.8% |
| Two or more Races | 102 | 12.2% |
| Some other Race | 0 | 0.0% |
| Total | 838 | 100.0% |
Ancestry in Smithers
The most populous ancestries reported in Smithers are English (207 | 24.7%), Irish (145 | 17.3%), Colombian (102 | 12.2%), South American (102 | 12.2%), and American (54 | 6.4%), together accounting for 72.8% of all Smithers residents.
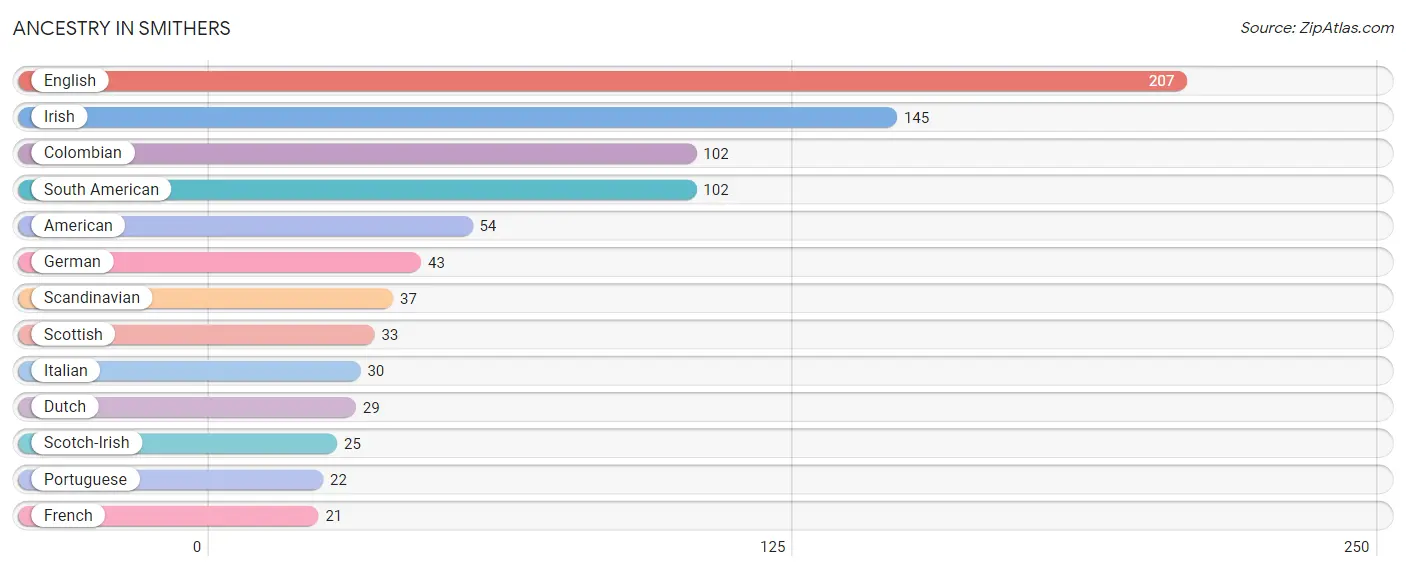
| Ancestry | # Population | % Population |
| American | 54 | 6.4% |
| Colombian | 102 | 12.2% |
| Dutch | 29 | 3.5% |
| English | 207 | 24.7% |
| French | 21 | 2.5% |
| German | 43 | 5.1% |
| Irish | 145 | 17.3% |
| Italian | 30 | 3.6% |
| Portuguese | 22 | 2.6% |
| Scandinavian | 37 | 4.4% |
| Scotch-Irish | 25 | 3.0% |
| Scottish | 33 | 3.9% |
| South American | 102 | 12.2% | View All 13 Rows |
Immigrants in Smithers

| Immigration Origin | # Population | % Population | View All 0 Rows |
Sex and Age in Smithers
Sex and Age in Smithers
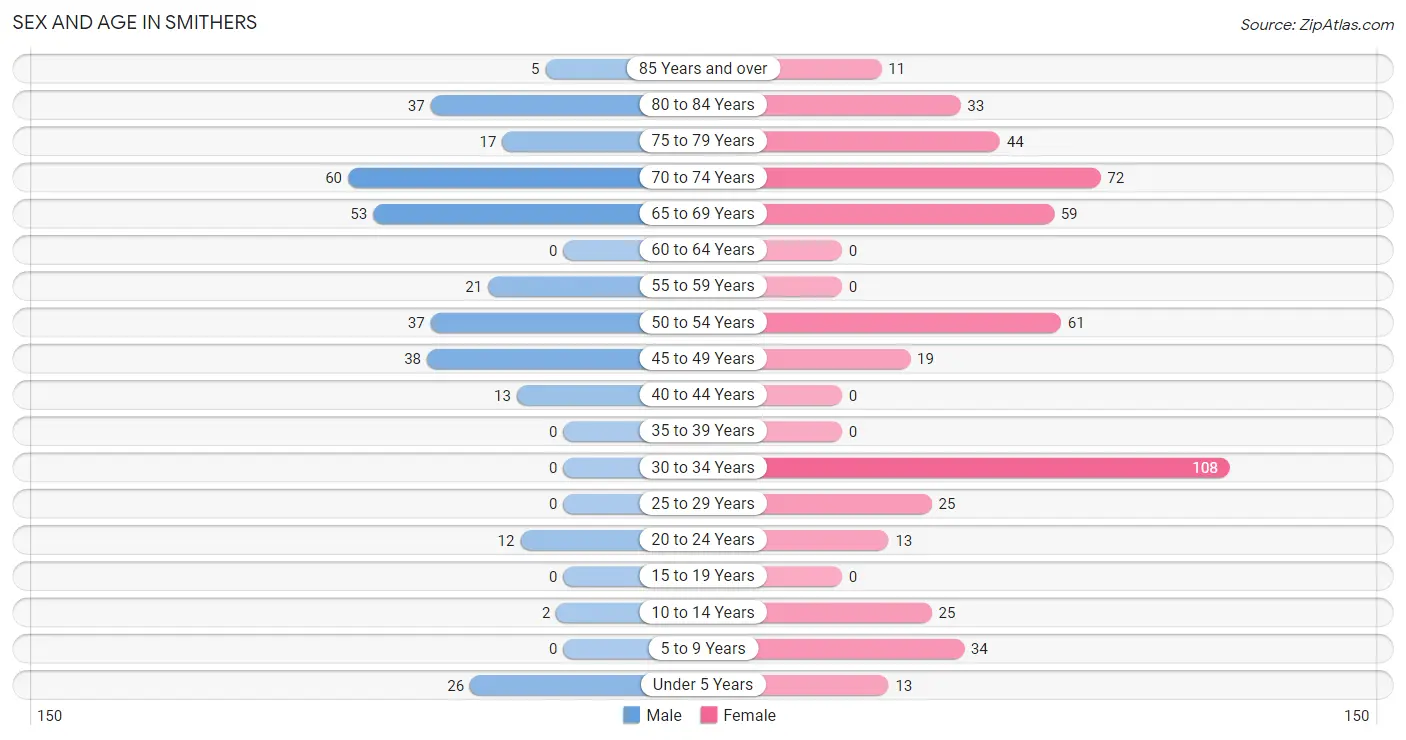
The most populous age groups in Smithers are 70 to 74 Years (60 | 18.7%) for men and 30 to 34 Years (108 | 20.9%) for women.
| Age Bracket | Male | Female |
| Under 5 Years | 26 (8.1%) | 13 (2.5%) |
| 5 to 9 Years | 0 (0.0%) | 34 (6.6%) |
| 10 to 14 Years | 2 (0.6%) | 25 (4.8%) |
| 15 to 19 Years | 0 (0.0%) | 0 (0.0%) |
| 20 to 24 Years | 12 (3.7%) | 13 (2.5%) |
| 25 to 29 Years | 0 (0.0%) | 25 (4.8%) |
| 30 to 34 Years | 0 (0.0%) | 108 (20.9%) |
| 35 to 39 Years | 0 (0.0%) | 0 (0.0%) |
| 40 to 44 Years | 13 (4.1%) | 0 (0.0%) |
| 45 to 49 Years | 38 (11.8%) | 19 (3.7%) |
| 50 to 54 Years | 37 (11.5%) | 61 (11.8%) |
| 55 to 59 Years | 21 (6.5%) | 0 (0.0%) |
| 60 to 64 Years | 0 (0.0%) | 0 (0.0%) |
| 65 to 69 Years | 53 (16.5%) | 59 (11.4%) |
| 70 to 74 Years | 60 (18.7%) | 72 (13.9%) |
| 75 to 79 Years | 17 (5.3%) | 44 (8.5%) |
| 80 to 84 Years | 37 (11.5%) | 33 (6.4%) |
| 85 Years and over | 5 (1.6%) | 11 (2.1%) |
| Total | 321 (100.0%) | 517 (100.0%) |
Families and Households in Smithers
Median Family Size in Smithers
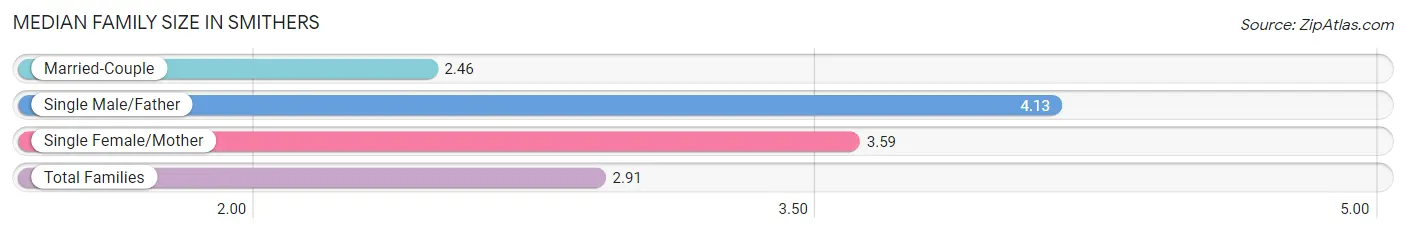
The median family size in Smithers is 2.91 persons per family, with single male/father families (8 | 3.9%) accounting for the largest median family size of 4.13 persons per family. On the other hand, married-couple families (125 | 61.6%) represent the smallest median family size with 2.46 persons per family.
| Family Type | # Families | Family Size |
| Married-Couple | 125 (61.6%) | 2.46 |
| Single Male/Father | 8 (3.9%) | 4.13 |
| Single Female/Mother | 70 (34.5%) | 3.59 |
| Total Families | 203 (100.0%) | 2.91 |
Median Household Size in Smithers
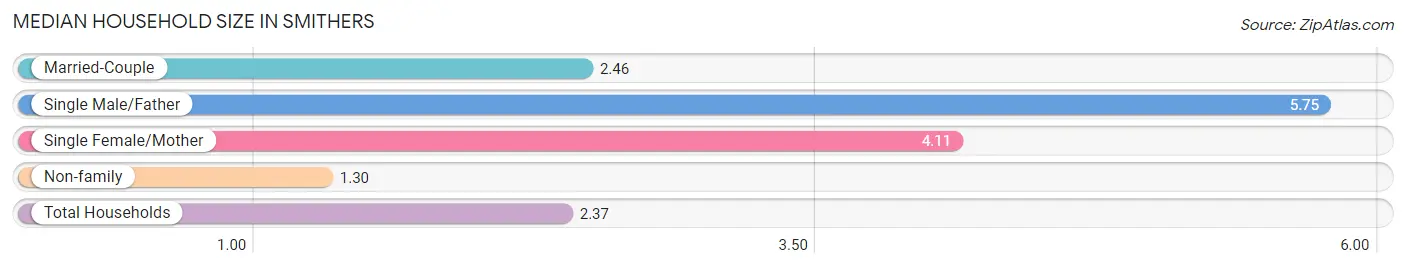
The median household size in Smithers is 2.37 persons per household, with single male/father households (8 | 2.3%) accounting for the largest median household size of 5.75 persons per household. non-family households (150 | 42.5%) represent the smallest median household size with 1.30 persons per household.
| Household Type | # Households | Household Size |
| Married-Couple | 125 (35.4%) | 2.46 |
| Single Male/Father | 8 (2.3%) | 5.75 |
| Single Female/Mother | 70 (19.8%) | 4.11 |
| Non-family | 150 (42.5%) | 1.30 |
| Total Households | 353 (100.0%) | 2.37 |
Household Size by Marriage Status in Smithers
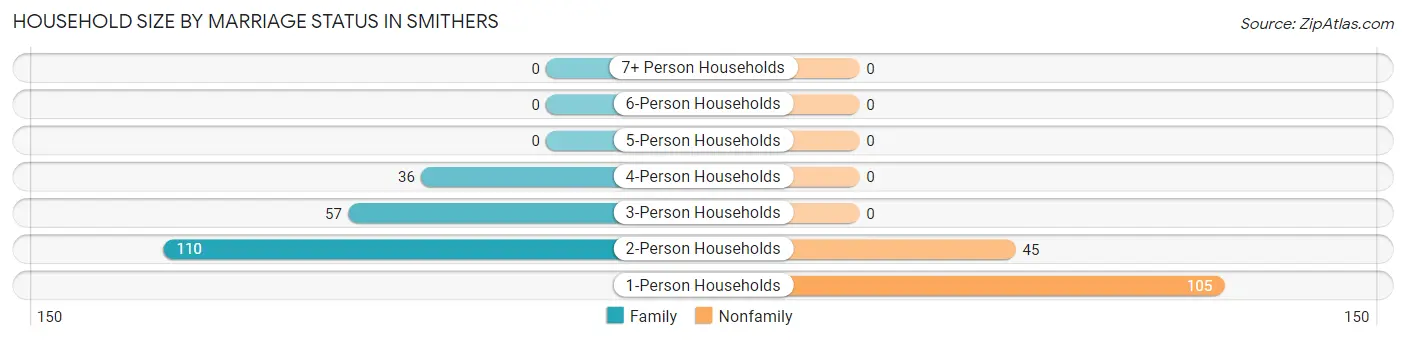
Out of a total of 353 households in Smithers, 203 (57.5%) are family households, while 150 (42.5%) are nonfamily households. The most numerous type of family households are 2-person households, comprising 110, and the most common type of nonfamily households are 1-person households, comprising 105.
| Household Size | Family Households | Nonfamily Households |
| 1-Person Households | - | 105 (29.7%) |
| 2-Person Households | 110 (31.2%) | 45 (12.8%) |
| 3-Person Households | 57 (16.2%) | 0 (0.0%) |
| 4-Person Households | 36 (10.2%) | 0 (0.0%) |
| 5-Person Households | 0 (0.0%) | 0 (0.0%) |
| 6-Person Households | 0 (0.0%) | 0 (0.0%) |
| 7+ Person Households | 0 (0.0%) | 0 (0.0%) |
| Total | 203 (57.5%) | 150 (42.5%) |
Female Fertility in Smithers
Fertility by Age in Smithers
Average fertility rate in Smithers is 72.0 births per 1,000 women. Women in the age bracket of 20 to 34 years have the highest fertility rate with 89.0 births per 1,000 women. Women in the age bracket of 20 to 34 years acount for 100.0% of all women with births.
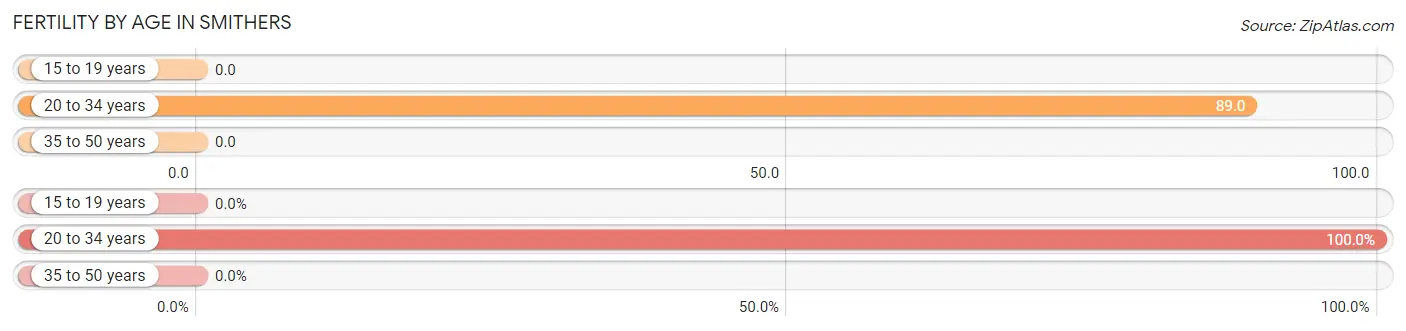
| Age Bracket | Women with Births | Births / 1,000 Women |
| 15 to 19 years | 0 (0.0%) | 0.0 |
| 20 to 34 years | 13 (100.0%) | 89.0 |
| 35 to 50 years | 0 (0.0%) | 0.0 |
| Total | 13 (100.0%) | 72.0 |
Fertility by Age by Marriage Status in Smithers
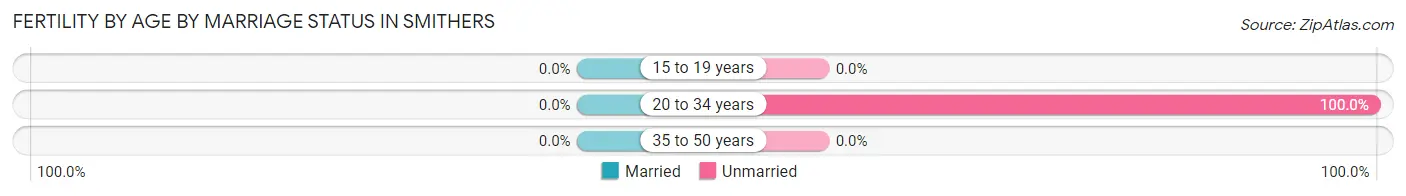
| Age Bracket | Married | Unmarried |
| 15 to 19 years | 0 (0.0%) | 0 (0.0%) |
| 20 to 34 years | 0 (0.0%) | 13 (100.0%) |
| 35 to 50 years | 0 (0.0%) | 0 (0.0%) |
| Total | 0 (0.0%) | 13 (100.0%) |
Fertility by Education in Smithers
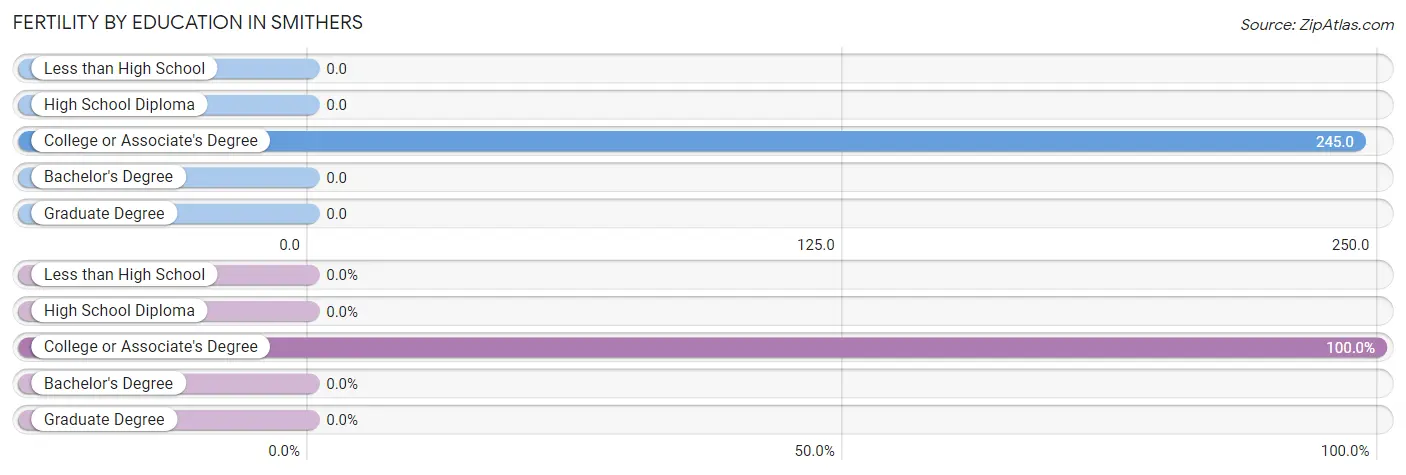
| Educational Attainment | Women with Births | Births / 1,000 Women |
| Less than High School | 0 (0.0%) | 0.0 |
| High School Diploma | 0 (0.0%) | 0.0 |
| College or Associate's Degree | 13 (100.0%) | 245.0 |
| Bachelor's Degree | 0 (0.0%) | 0.0 |
| Graduate Degree | 0 (0.0%) | 0.0 |
| Total | 13 (100.0%) | 72.0 |
Fertility by Education by Marriage Status in Smithers
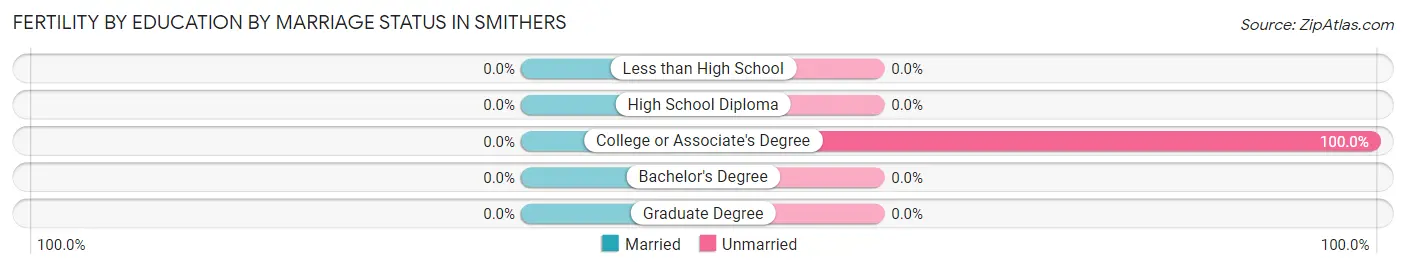
| Educational Attainment | Married | Unmarried |
| Less than High School | 0 (0.0%) | 0 (0.0%) |
| High School Diploma | 0 (0.0%) | 0 (0.0%) |
| College or Associate's Degree | 0 (0.0%) | 13 (100.0%) |
| Bachelor's Degree | 0 (0.0%) | 0 (0.0%) |
| Graduate Degree | 0 (0.0%) | 0 (0.0%) |
| Total | 0 (0.0%) | 13 (100.0%) |
Employment Characteristics in Smithers
Employment by Class of Employer in Smithers
Among the 234 employed individuals in Smithers, state government employees (100 | 42.7%), private company employees (80 | 34.2%), and self-employed (not incorporated) (37 | 15.8%) make up the most common classes of employment.
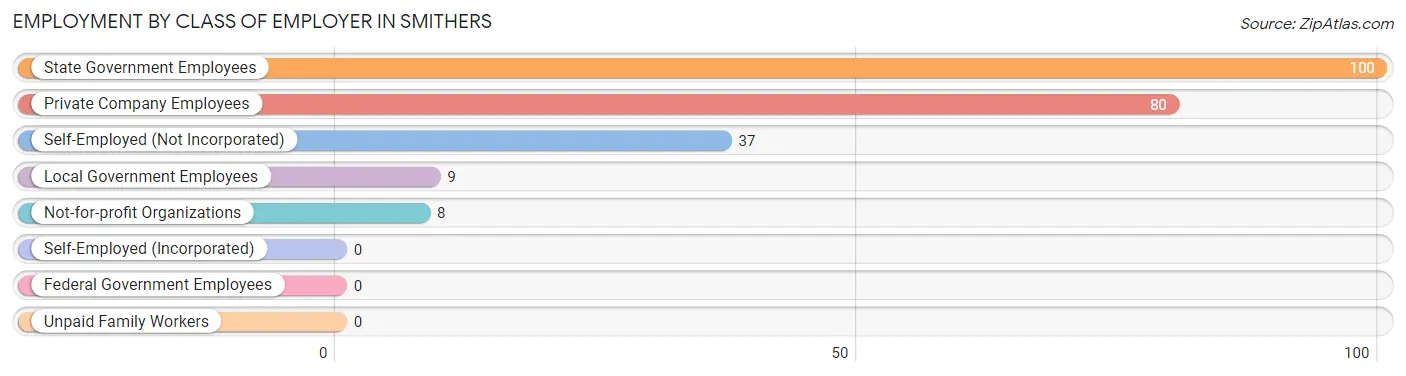
| Employer Class | # Employees | % Employees |
| Private Company Employees | 80 | 34.2% |
| Self-Employed (Incorporated) | 0 | 0.0% |
| Self-Employed (Not Incorporated) | 37 | 15.8% |
| Not-for-profit Organizations | 8 | 3.4% |
| Local Government Employees | 9 | 3.8% |
| State Government Employees | 100 | 42.7% |
| Federal Government Employees | 0 | 0.0% |
| Unpaid Family Workers | 0 | 0.0% |
| Total | 234 | 100.0% |
Employment Status by Age in Smithers
According to the labor force statistics for Smithers, out of the total population over 16 years of age (738), 33.5% or 247 individuals are in the labor force, with 5.3% or 13 of them unemployed. The age group with the highest labor force participation rate is 25 to 29 years, with 100.0% or 25 individuals in the labor force. Within the labor force, the 25 to 29 years age range has the highest percentage of unemployed individuals, with 52.0% or 13 of them being unemployed.
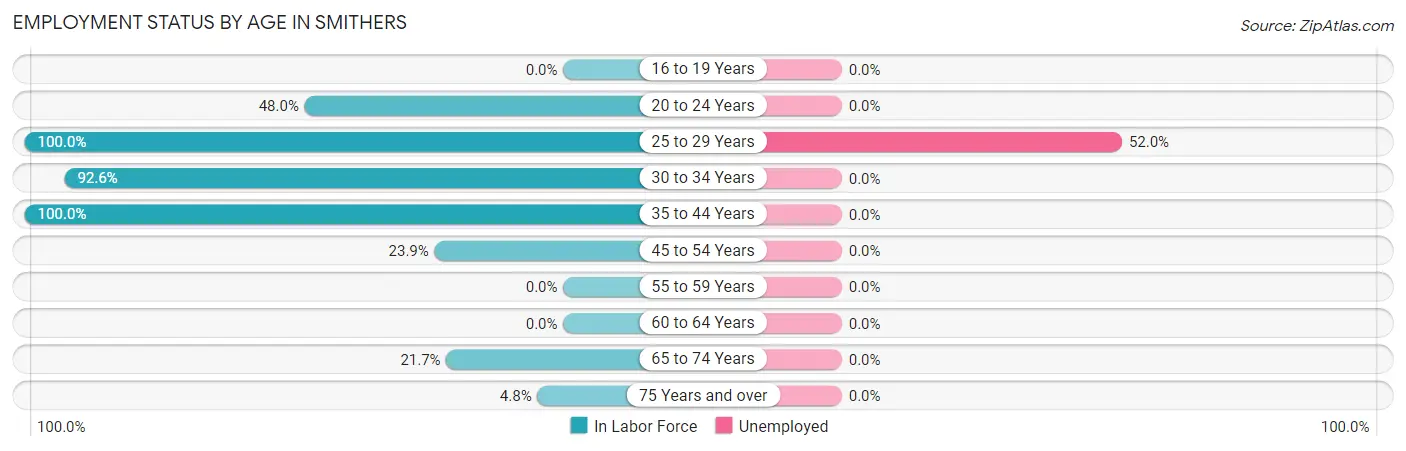
| Age Bracket | In Labor Force | Unemployed |
| 16 to 19 Years | 0 (0.0%) | 0 (0.0%) |
| 20 to 24 Years | 12 (48.0%) | 0 (0.0%) |
| 25 to 29 Years | 25 (100.0%) | 13 (52.0%) |
| 30 to 34 Years | 100 (92.6%) | 0 (0.0%) |
| 35 to 44 Years | 13 (100.0%) | 0 (0.0%) |
| 45 to 54 Years | 37 (23.9%) | 0 (0.0%) |
| 55 to 59 Years | 0 (0.0%) | 0 (0.0%) |
| 60 to 64 Years | 0 (0.0%) | 0 (0.0%) |
| 65 to 74 Years | 53 (21.7%) | 0 (0.0%) |
| 75 Years and over | 7 (4.8%) | 0 (0.0%) |
| Total | 247 (33.5%) | 13 (5.3%) |
Employment Status by Educational Attainment in Smithers
According to labor force statistics for Smithers, 54.3% of individuals (175) out of the total population between 25 and 64 years of age (322) are in the labor force, with 7.4% or 13 of them being unemployed. The group with the highest labor force participation rate are those with the educational attainment of bachelor's degree or higher, with 88.5% or 100 individuals in the labor force. Within the labor force, individuals with college / associate degree education have the highest percentage of unemployment, with 68.4% or 13 of them being unemployed.
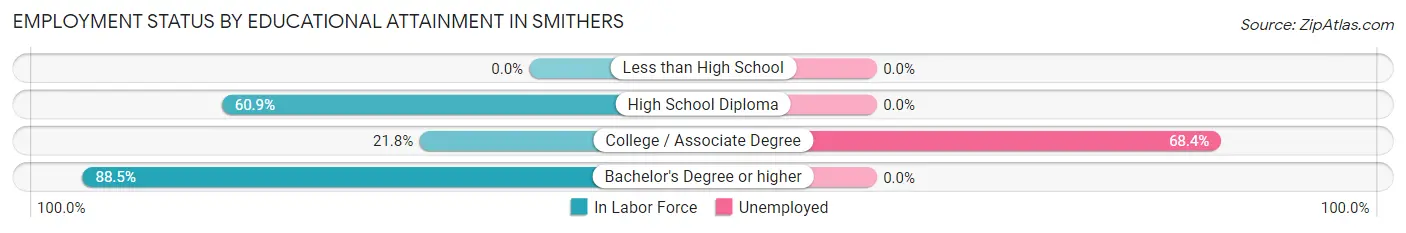
| Educational Attainment | In Labor Force | Unemployed |
| Less than High School | 0 (0.0%) | 0 (0.0%) |
| High School Diploma | 56 (60.9%) | 0 (0.0%) |
| College / Associate Degree | 19 (21.8%) | 60 (68.4%) |
| Bachelor's Degree or higher | 100 (88.5%) | 0 (0.0%) |
| Total | 175 (54.3%) | 24 (7.4%) |
Employment Occupations by Sex in Smithers
Management, Business, Science and Arts Occupations
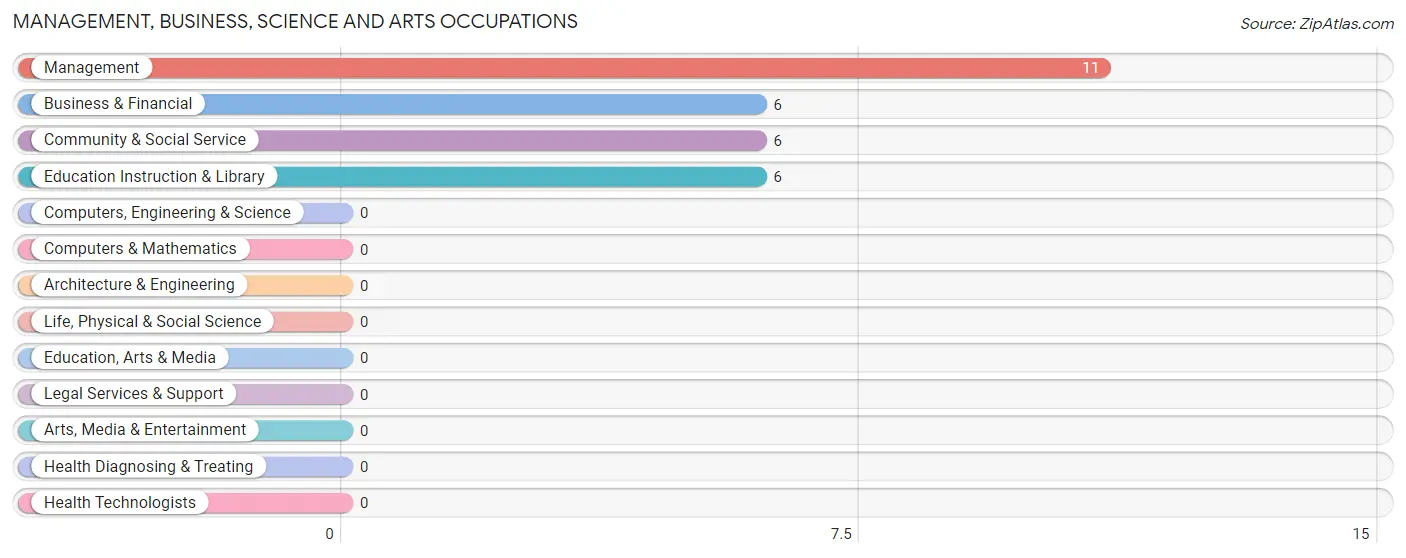
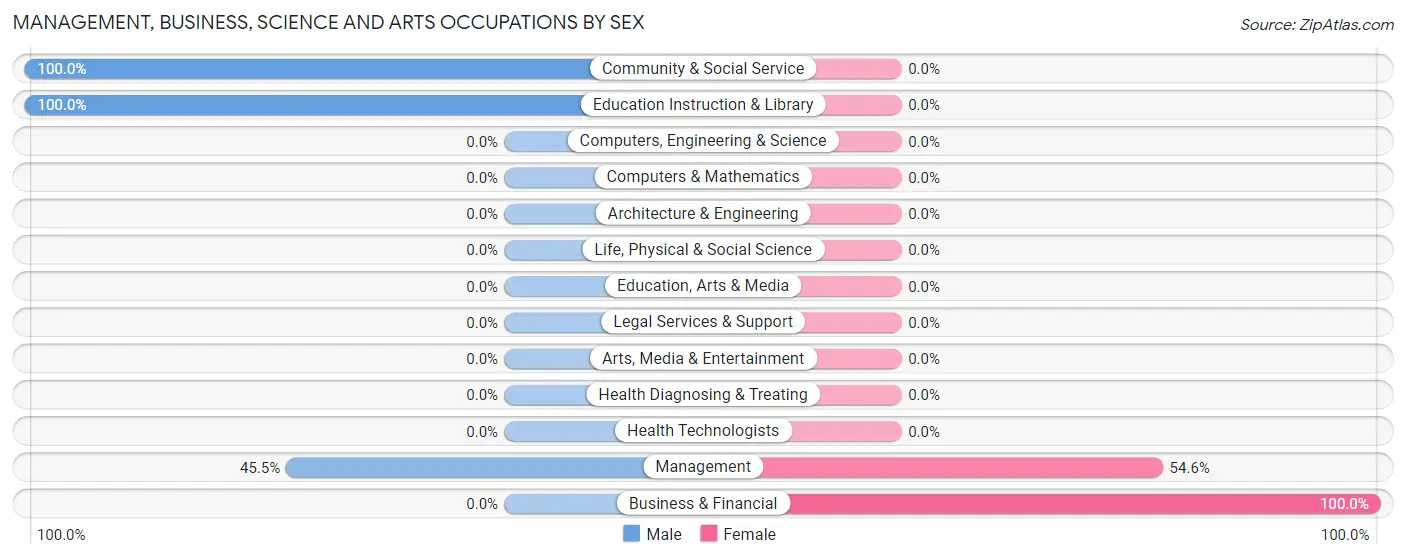
The most common Management, Business, Science and Arts occupations in Smithers are Management (11 | 4.7%), Business & Financial (6 | 2.6%), Community & Social Service (6 | 2.6%), and Education Instruction & Library (6 | 2.6%).
Management, Business, Science and Arts Occupations by Sex
Within the Management, Business, Science and Arts occupations in Smithers, the most male-oriented occupations are Community & Social Service (100.0%), Education Instruction & Library (100.0%), and Management (45.5%), while the most female-oriented occupations are Business & Financial (100.0%), and Management (54.5%).
| Occupation | Male | Female |
| Management | 5 (45.5%) | 6 (54.5%) |
| Business & Financial | 0 (0.0%) | 6 (100.0%) |
| Computers, Engineering & Science | 0 (0.0%) | 0 (0.0%) |
| Computers & Mathematics | 0 (0.0%) | 0 (0.0%) |
| Architecture & Engineering | 0 (0.0%) | 0 (0.0%) |
| Life, Physical & Social Science | 0 (0.0%) | 0 (0.0%) |
| Community & Social Service | 6 (100.0%) | 0 (0.0%) |
| Education, Arts & Media | 0 (0.0%) | 0 (0.0%) |
| Legal Services & Support | 0 (0.0%) | 0 (0.0%) |
| Education Instruction & Library | 6 (100.0%) | 0 (0.0%) |
| Arts, Media & Entertainment | 0 (0.0%) | 0 (0.0%) |
| Health Diagnosing & Treating | 0 (0.0%) | 0 (0.0%) |
| Health Technologists | 0 (0.0%) | 0 (0.0%) |
| Total (Category) | 11 (47.8%) | 12 (52.2%) |
| Total (Overall) | 88 (37.6%) | 146 (62.4%) |
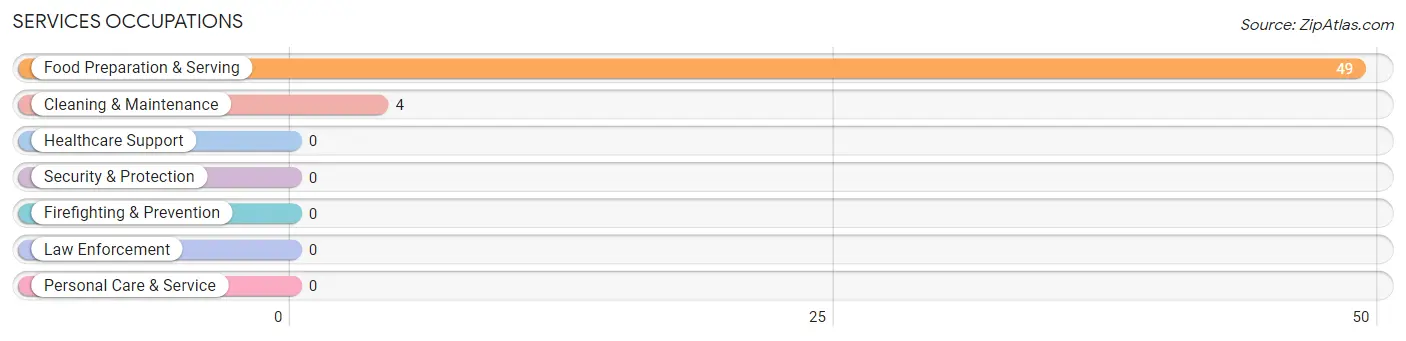
Services Occupations
The most common Services occupations in Smithers are Food Preparation & Serving (49 | 20.9%), and Cleaning & Maintenance (4 | 1.7%).
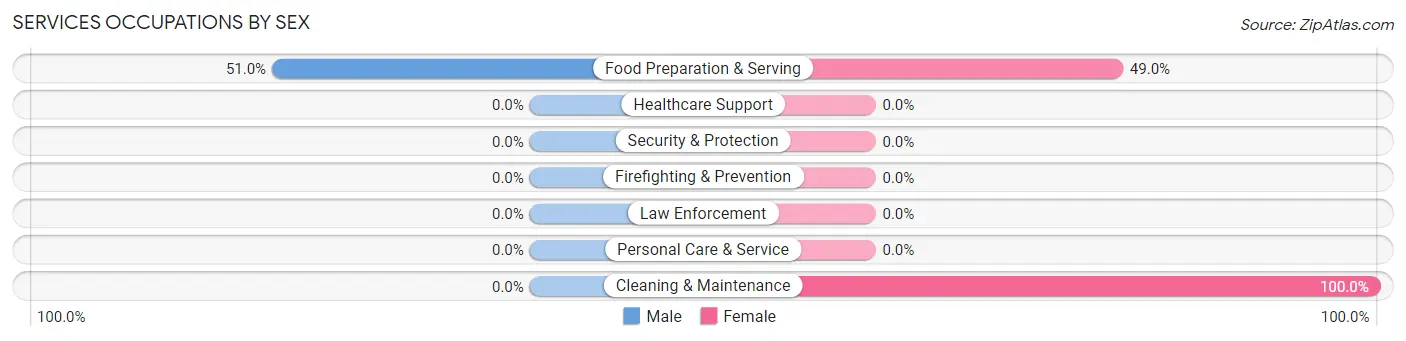
Services Occupations by Sex
| Occupation | Male | Female |
| Healthcare Support | 0 (0.0%) | 0 (0.0%) |
| Security & Protection | 0 (0.0%) | 0 (0.0%) |
| Firefighting & Prevention | 0 (0.0%) | 0 (0.0%) |
| Law Enforcement | 0 (0.0%) | 0 (0.0%) |
| Food Preparation & Serving | 25 (51.0%) | 24 (49.0%) |
| Cleaning & Maintenance | 0 (0.0%) | 4 (100.0%) |
| Personal Care & Service | 0 (0.0%) | 0 (0.0%) |
| Total (Category) | 25 (47.2%) | 28 (52.8%) |
| Total (Overall) | 88 (37.6%) | 146 (62.4%) |
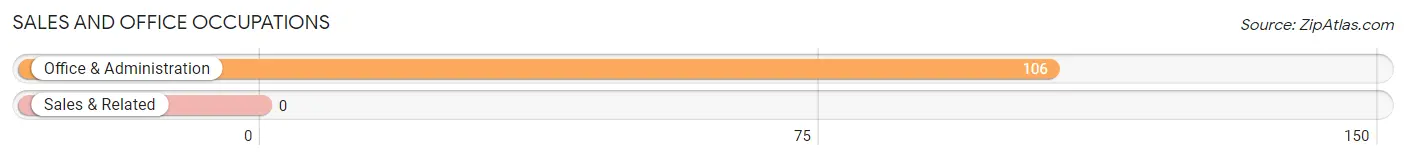
Sales and Office Occupations
The most common Sales and Office occupations in Smithers are , and Office & Administration (106 | 45.3%).
Sales and Office Occupations by Sex
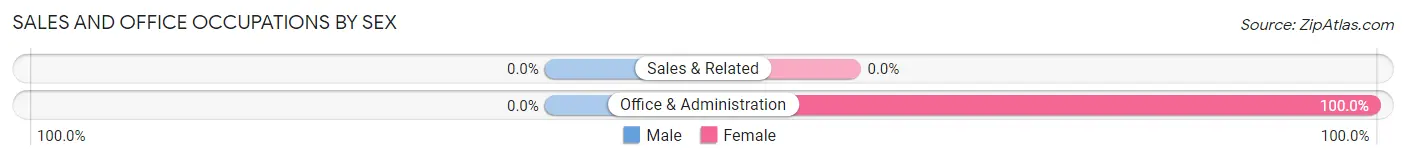
| Occupation | Male | Female |
| Sales & Related | 0 (0.0%) | 0 (0.0%) |
| Office & Administration | 0 (0.0%) | 106 (100.0%) |
| Total (Category) | 0 (0.0%) | 106 (100.0%) |
| Total (Overall) | 88 (37.6%) | 146 (62.4%) |
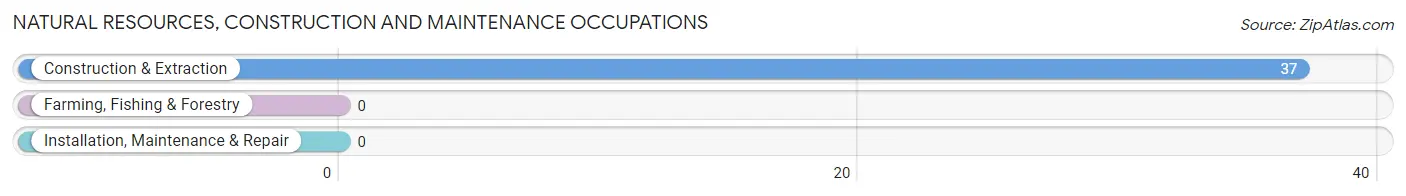
Natural Resources, Construction and Maintenance Occupations
The most common Natural Resources, Construction and Maintenance occupations in Smithers are , and Construction & Extraction (37 | 15.8%).
Natural Resources, Construction and Maintenance Occupations by Sex
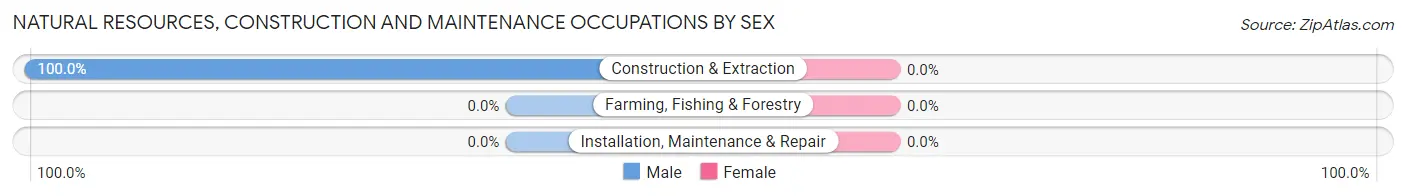
| Occupation | Male | Female |
| Farming, Fishing & Forestry | 0 (0.0%) | 0 (0.0%) |
| Construction & Extraction | 37 (100.0%) | 0 (0.0%) |
| Installation, Maintenance & Repair | 0 (0.0%) | 0 (0.0%) |
| Total (Category) | 37 (100.0%) | 0 (0.0%) |
| Total (Overall) | 88 (37.6%) | 146 (62.4%) |
Production, Transportation and Moving Occupations
The most common Production, Transportation and Moving occupations in Smithers are , and Material Moving (15 | 6.4%).
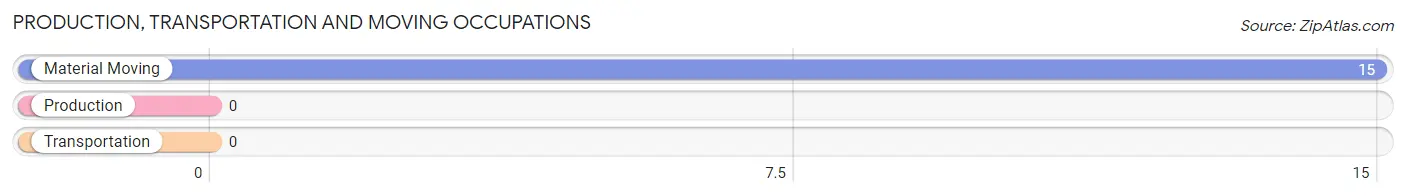
Production, Transportation and Moving Occupations by Sex
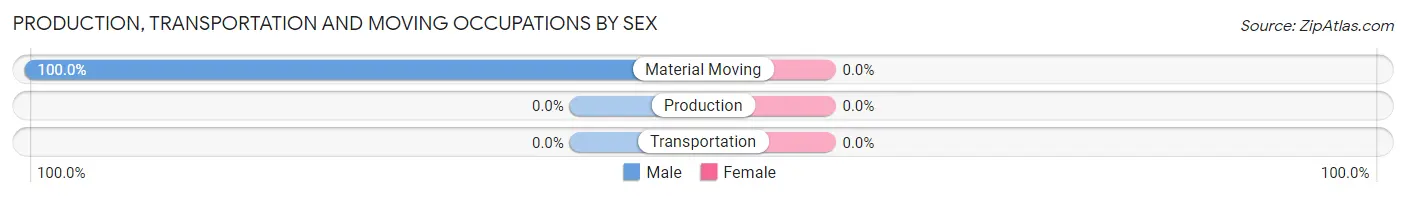
| Occupation | Male | Female |
| Production | 0 (0.0%) | 0 (0.0%) |
| Transportation | 0 (0.0%) | 0 (0.0%) |
| Material Moving | 15 (100.0%) | 0 (0.0%) |
| Total (Category) | 15 (100.0%) | 0 (0.0%) |
| Total (Overall) | 88 (37.6%) | 146 (62.4%) |
Employment Industries by Sex in Smithers
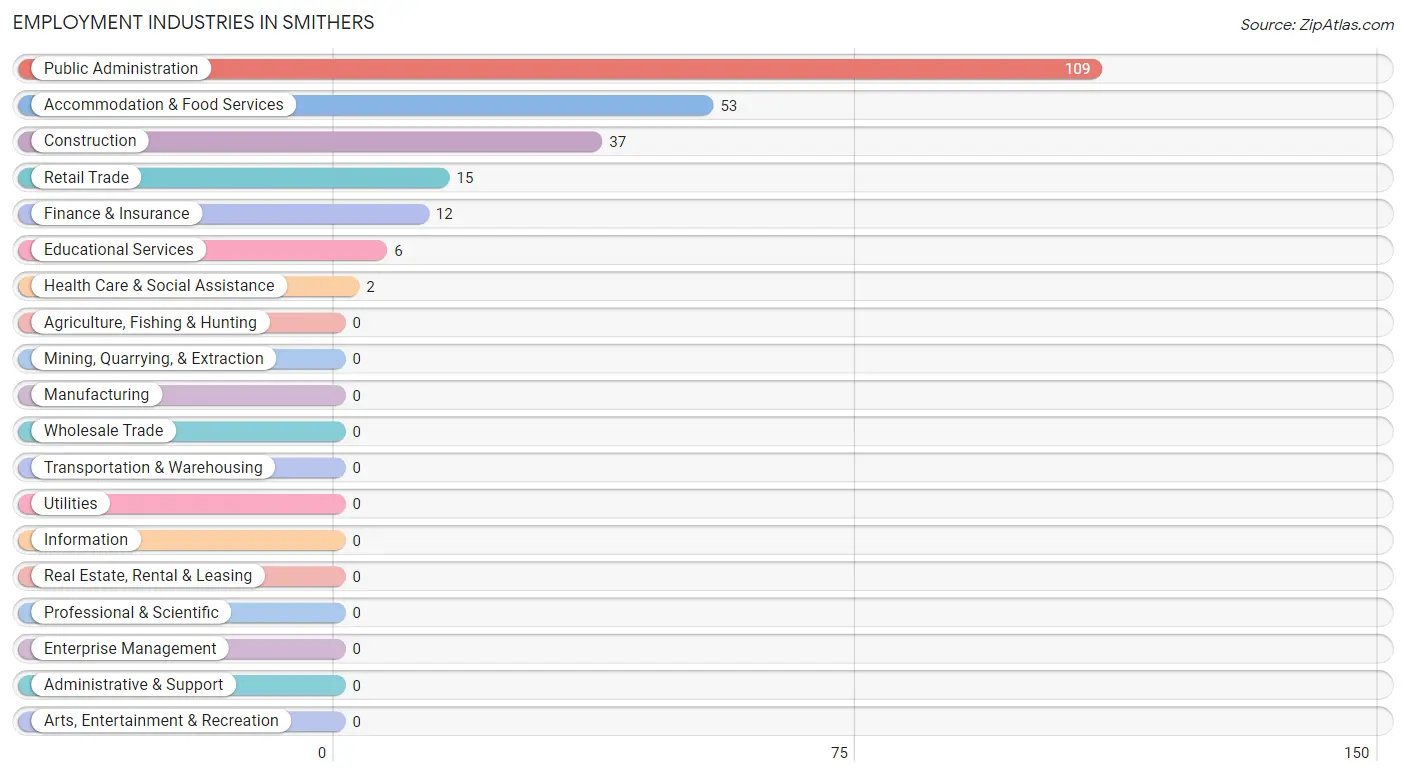
Employment Industries in Smithers
The major employment industries in Smithers include Public Administration (109 | 46.6%), Accommodation & Food Services (53 | 22.7%), Construction (37 | 15.8%), Retail Trade (15 | 6.4%), and Finance & Insurance (12 | 5.1%).
Employment Industries by Sex in Smithers
The Smithers industries that see more men than women are Construction (100.0%), Retail Trade (100.0%), and Educational Services (100.0%), whereas the industries that tend to have a higher number of women are Finance & Insurance (100.0%), Health Care & Social Assistance (100.0%), and Public Administration (95.4%).
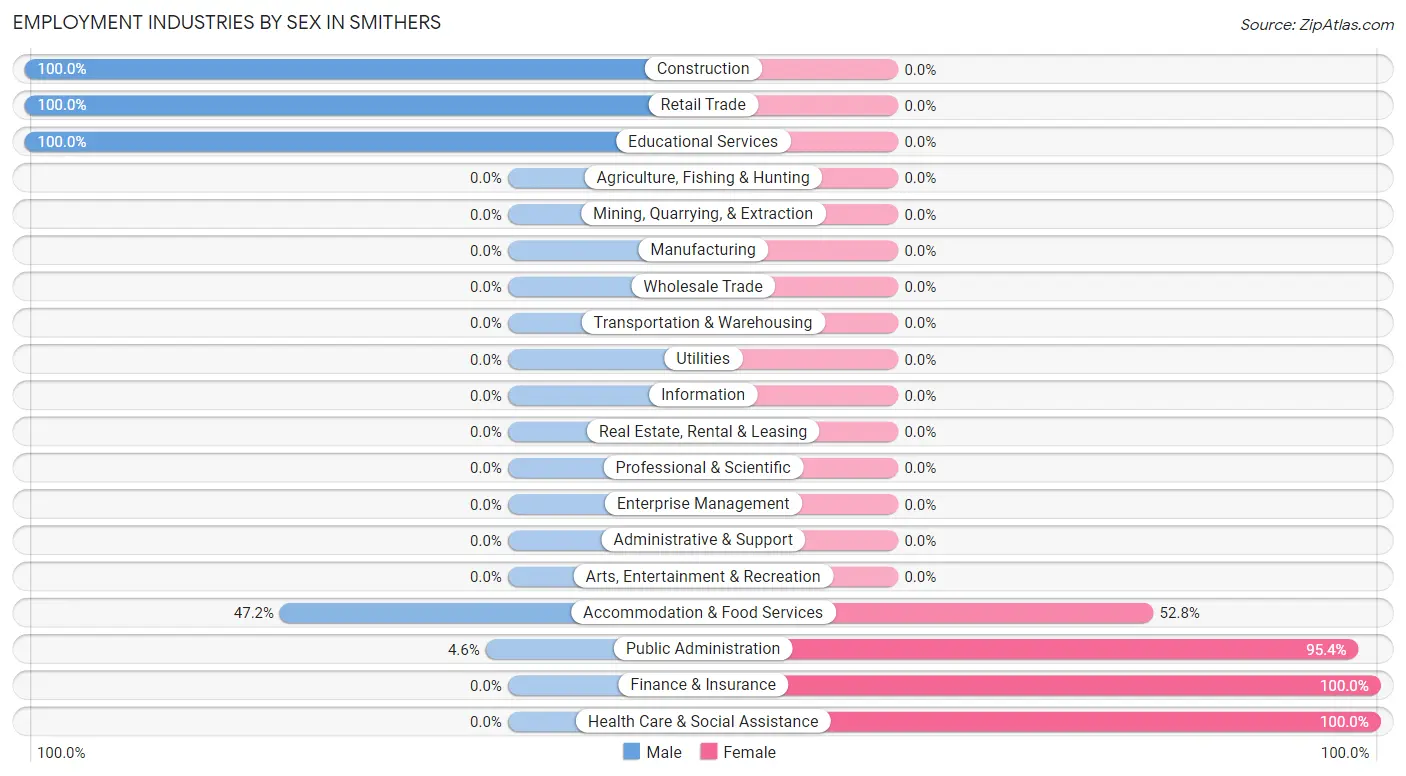
| Industry | Male | Female |
| Agriculture, Fishing & Hunting | 0 (0.0%) | 0 (0.0%) |
| Mining, Quarrying, & Extraction | 0 (0.0%) | 0 (0.0%) |
| Construction | 37 (100.0%) | 0 (0.0%) |
| Manufacturing | 0 (0.0%) | 0 (0.0%) |
| Wholesale Trade | 0 (0.0%) | 0 (0.0%) |
| Retail Trade | 15 (100.0%) | 0 (0.0%) |
| Transportation & Warehousing | 0 (0.0%) | 0 (0.0%) |
| Utilities | 0 (0.0%) | 0 (0.0%) |
| Information | 0 (0.0%) | 0 (0.0%) |
| Finance & Insurance | 0 (0.0%) | 12 (100.0%) |
| Real Estate, Rental & Leasing | 0 (0.0%) | 0 (0.0%) |
| Professional & Scientific | 0 (0.0%) | 0 (0.0%) |
| Enterprise Management | 0 (0.0%) | 0 (0.0%) |
| Administrative & Support | 0 (0.0%) | 0 (0.0%) |
| Educational Services | 6 (100.0%) | 0 (0.0%) |
| Health Care & Social Assistance | 0 (0.0%) | 2 (100.0%) |
| Arts, Entertainment & Recreation | 0 (0.0%) | 0 (0.0%) |
| Accommodation & Food Services | 25 (47.2%) | 28 (52.8%) |
| Public Administration | 5 (4.6%) | 104 (95.4%) |
| Total | 88 (37.6%) | 146 (62.4%) |
Education in Smithers
School Enrollment in Smithers
The most common levels of schooling among the 61 students in Smithers are middle school (27 | 44.3%), nursery / preschool (17 | 27.9%), and elementary school (17 | 27.9%).
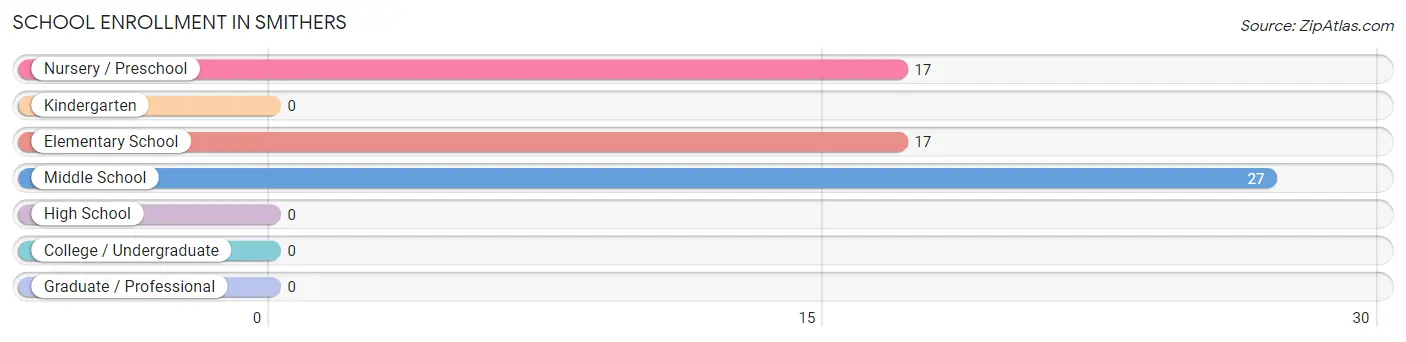
| School Level | # Students | % Students |
| Nursery / Preschool | 17 | 27.9% |
| Kindergarten | 0 | 0.0% |
| Elementary School | 17 | 27.9% |
| Middle School | 27 | 44.3% |
| High School | 0 | 0.0% |
| College / Undergraduate | 0 | 0.0% |
| Graduate / Professional | 0 | 0.0% |
| Total | 61 | 100.0% |
School Enrollment by Age by Funding Source in Smithers
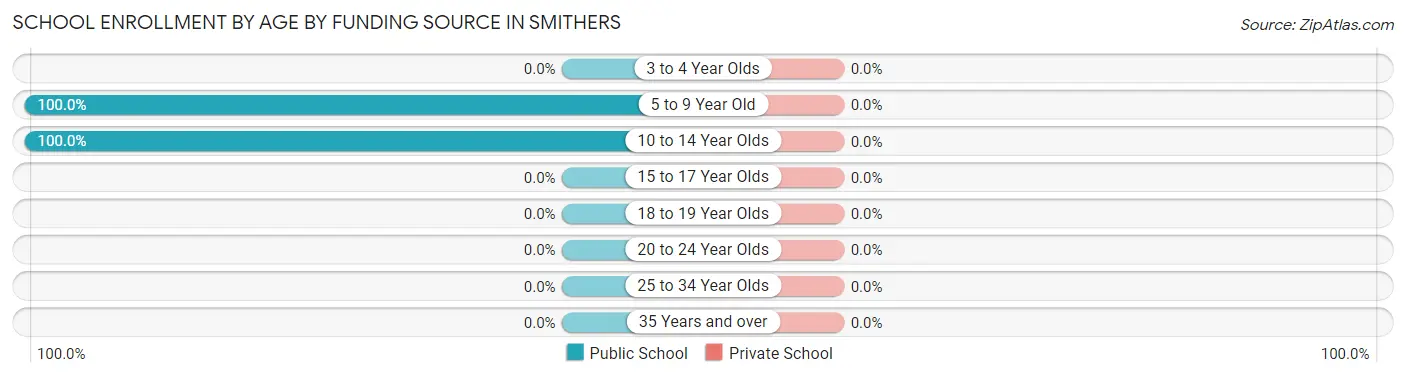
| Age Bracket | Public School | Private School |
| 3 to 4 Year Olds | 0 (0.0%) | 0 (0.0%) |
| 5 to 9 Year Old | 34 (100.0%) | 0 (0.0%) |
| 10 to 14 Year Olds | 27 (100.0%) | 0 (0.0%) |
| 15 to 17 Year Olds | 0 (0.0%) | 0 (0.0%) |
| 18 to 19 Year Olds | 0 (0.0%) | 0 (0.0%) |
| 20 to 24 Year Olds | 0 (0.0%) | 0 (0.0%) |
| 25 to 34 Year Olds | 0 (0.0%) | 0 (0.0%) |
| 35 Years and over | 0 (0.0%) | 0 (0.0%) |
| Total | 61 (100.0%) | 0 (0.0%) |
Educational Attainment by Field of Study in Smithers
Business (136 | 58.1%), education (33 | 14.1%), science & technology (24 | 10.3%), psychology (19 | 8.1%), and engineering (12 | 5.1%) are the most common fields of study among 234 individuals in Smithers who have obtained a bachelor's degree or higher.
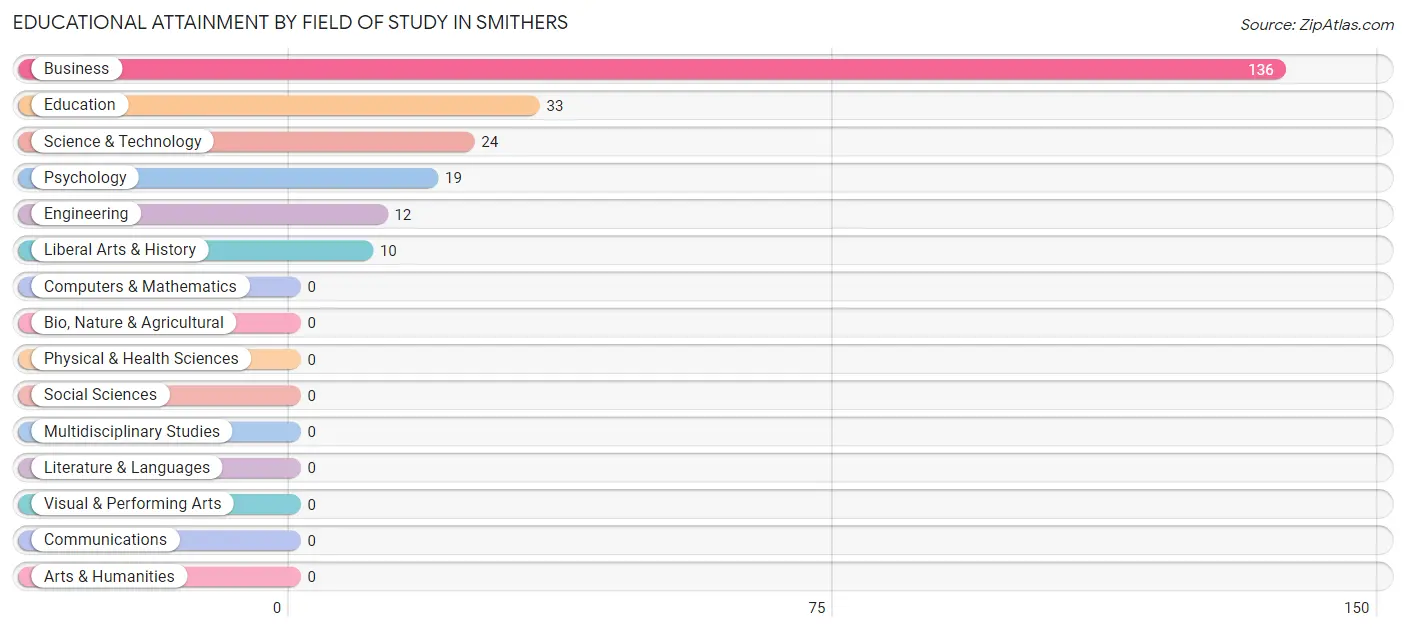
| Field of Study | # Graduates | % Graduates |
| Computers & Mathematics | 0 | 0.0% |
| Bio, Nature & Agricultural | 0 | 0.0% |
| Physical & Health Sciences | 0 | 0.0% |
| Psychology | 19 | 8.1% |
| Social Sciences | 0 | 0.0% |
| Engineering | 12 | 5.1% |
| Multidisciplinary Studies | 0 | 0.0% |
| Science & Technology | 24 | 10.3% |
| Business | 136 | 58.1% |
| Education | 33 | 14.1% |
| Literature & Languages | 0 | 0.0% |
| Liberal Arts & History | 10 | 4.3% |
| Visual & Performing Arts | 0 | 0.0% |
| Communications | 0 | 0.0% |
| Arts & Humanities | 0 | 0.0% |
| Total | 234 | 100.0% |
Transportation & Commute in Smithers
Vehicle Availability by Sex in Smithers
The most prevalent vehicle ownership categories in Smithers are males with 3 vehicles (37, accounting for 42.0%) and females with 3 vehicles (112, making up 25.7%).
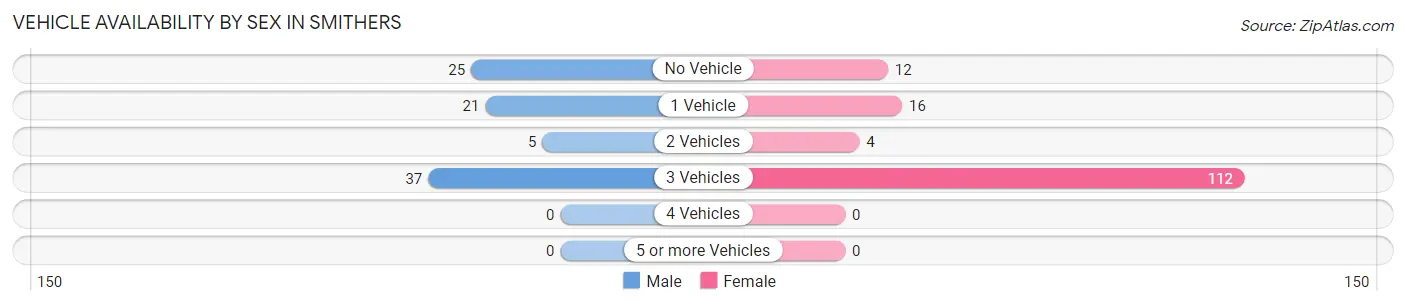
| Vehicles Available | Male | Female |
| No Vehicle | 25 (28.4%) | 12 (8.3%) |
| 1 Vehicle | 21 (23.9%) | 16 (11.1%) |
| 2 Vehicles | 5 (5.7%) | 4 (2.8%) |
| 3 Vehicles | 37 (42.0%) | 112 (77.8%) |
| 4 Vehicles | 0 (0.0%) | 0 (0.0%) |
| 5 or more Vehicles | 0 (0.0%) | 0 (0.0%) |
| Total | 88 (100.0%) | 144 (100.0%) |
Commute Time in Smithers
The most frequently occuring commute durations in Smithers are 5 to 9 minutes (40 commuters, 31.2%), less than 5 minutes (39 commuters, 30.5%), and 20 to 24 minutes (25 commuters, 19.5%).
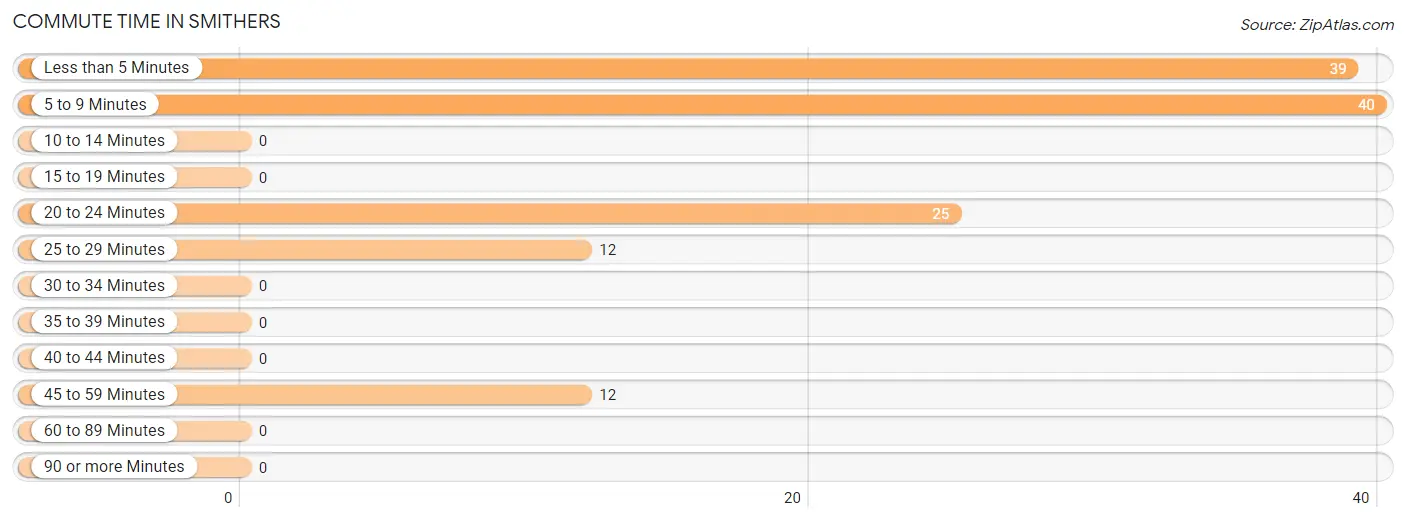
| Commute Time | # Commuters | % Commuters |
| Less than 5 Minutes | 39 | 30.5% |
| 5 to 9 Minutes | 40 | 31.2% |
| 10 to 14 Minutes | 0 | 0.0% |
| 15 to 19 Minutes | 0 | 0.0% |
| 20 to 24 Minutes | 25 | 19.5% |
| 25 to 29 Minutes | 12 | 9.4% |
| 30 to 34 Minutes | 0 | 0.0% |
| 35 to 39 Minutes | 0 | 0.0% |
| 40 to 44 Minutes | 0 | 0.0% |
| 45 to 59 Minutes | 12 | 9.4% |
| 60 to 89 Minutes | 0 | 0.0% |
| 90 or more Minutes | 0 | 0.0% |
Commute Time by Sex in Smithers
The most common commute times in Smithers are less than 5 minutes (37 commuters, 45.1%) for males and 5 to 9 minutes (20 commuters, 43.5%) for females.
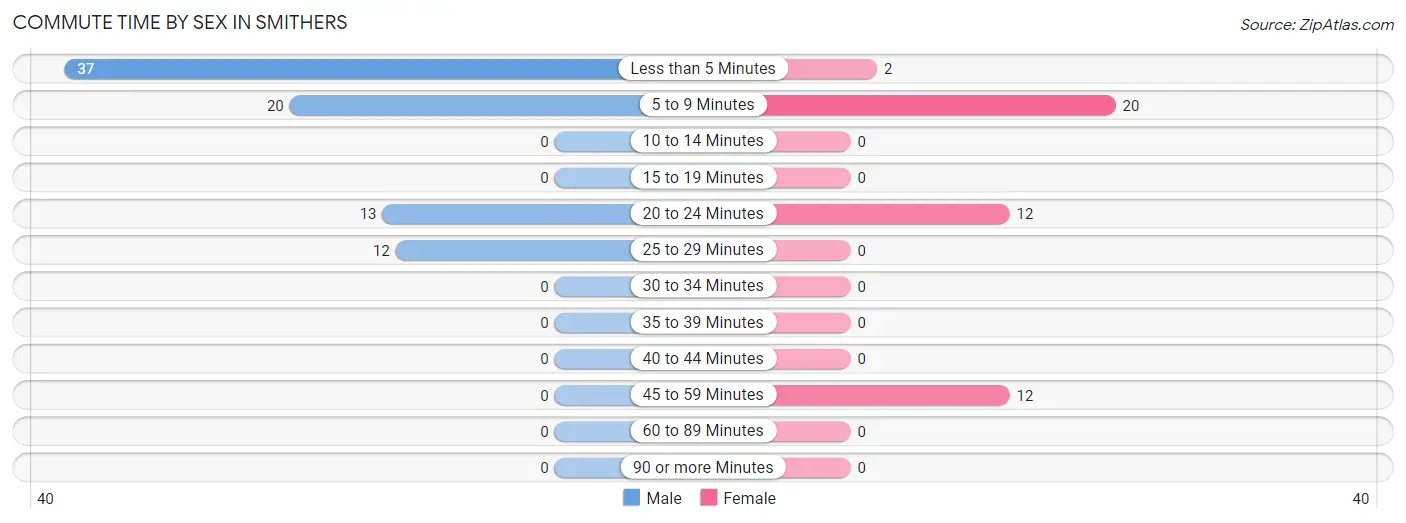
| Commute Time | Male | Female |
| Less than 5 Minutes | 37 (45.1%) | 2 (4.3%) |
| 5 to 9 Minutes | 20 (24.4%) | 20 (43.5%) |
| 10 to 14 Minutes | 0 (0.0%) | 0 (0.0%) |
| 15 to 19 Minutes | 0 (0.0%) | 0 (0.0%) |
| 20 to 24 Minutes | 13 (15.9%) | 12 (26.1%) |
| 25 to 29 Minutes | 12 (14.6%) | 0 (0.0%) |
| 30 to 34 Minutes | 0 (0.0%) | 0 (0.0%) |
| 35 to 39 Minutes | 0 (0.0%) | 0 (0.0%) |
| 40 to 44 Minutes | 0 (0.0%) | 0 (0.0%) |
| 45 to 59 Minutes | 0 (0.0%) | 12 (26.1%) |
| 60 to 89 Minutes | 0 (0.0%) | 0 (0.0%) |
| 90 or more Minutes | 0 (0.0%) | 0 (0.0%) |
Time of Departure to Work by Sex in Smithers
The most frequent times of departure to work in Smithers are 8:00 AM to 8:29 AM (42, 51.2%) for males and 6:30 AM to 6:59 AM (12, 26.1%) for females.
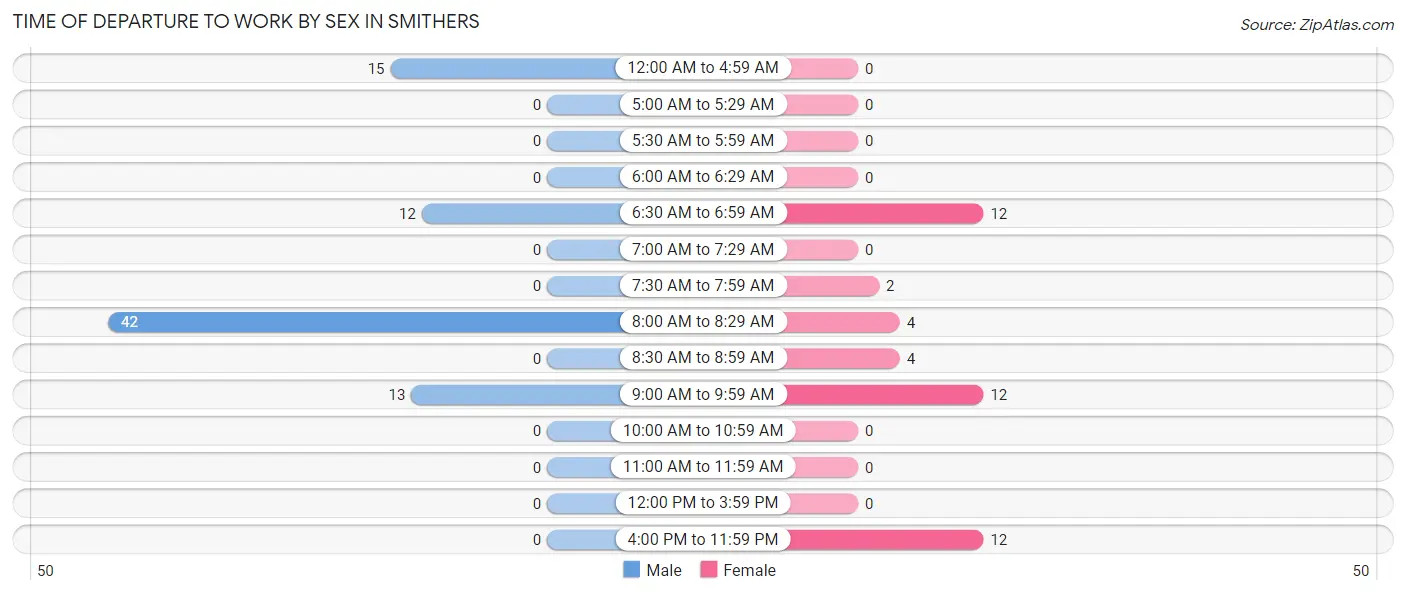
| Time of Departure | Male | Female |
| 12:00 AM to 4:59 AM | 15 (18.3%) | 0 (0.0%) |
| 5:00 AM to 5:29 AM | 0 (0.0%) | 0 (0.0%) |
| 5:30 AM to 5:59 AM | 0 (0.0%) | 0 (0.0%) |
| 6:00 AM to 6:29 AM | 0 (0.0%) | 0 (0.0%) |
| 6:30 AM to 6:59 AM | 12 (14.6%) | 12 (26.1%) |
| 7:00 AM to 7:29 AM | 0 (0.0%) | 0 (0.0%) |
| 7:30 AM to 7:59 AM | 0 (0.0%) | 2 (4.3%) |
| 8:00 AM to 8:29 AM | 42 (51.2%) | 4 (8.7%) |
| 8:30 AM to 8:59 AM | 0 (0.0%) | 4 (8.7%) |
| 9:00 AM to 9:59 AM | 13 (15.9%) | 12 (26.1%) |
| 10:00 AM to 10:59 AM | 0 (0.0%) | 0 (0.0%) |
| 11:00 AM to 11:59 AM | 0 (0.0%) | 0 (0.0%) |
| 12:00 PM to 3:59 PM | 0 (0.0%) | 0 (0.0%) |
| 4:00 PM to 11:59 PM | 0 (0.0%) | 12 (26.1%) |
| Total | 82 (100.0%) | 46 (100.0%) |
Housing Occupancy in Smithers
Occupancy by Ownership in Smithers
Of the total 353 dwellings in Smithers, owner-occupied units account for 183 (51.8%), while renter-occupied units make up 170 (48.2%).
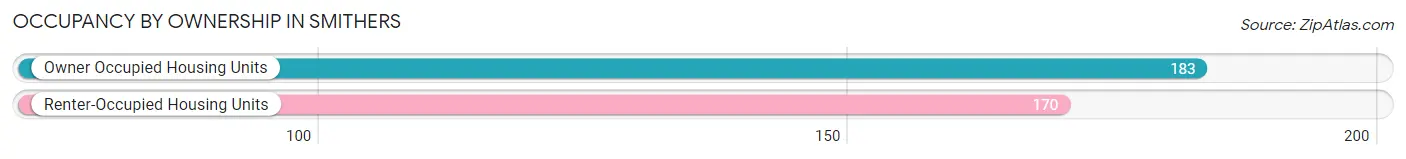
| Occupancy | # Housing Units | % Housing Units |
| Owner Occupied Housing Units | 183 | 51.8% |
| Renter-Occupied Housing Units | 170 | 48.2% |
| Total Occupied Housing Units | 353 | 100.0% |
Occupancy by Household Size in Smithers
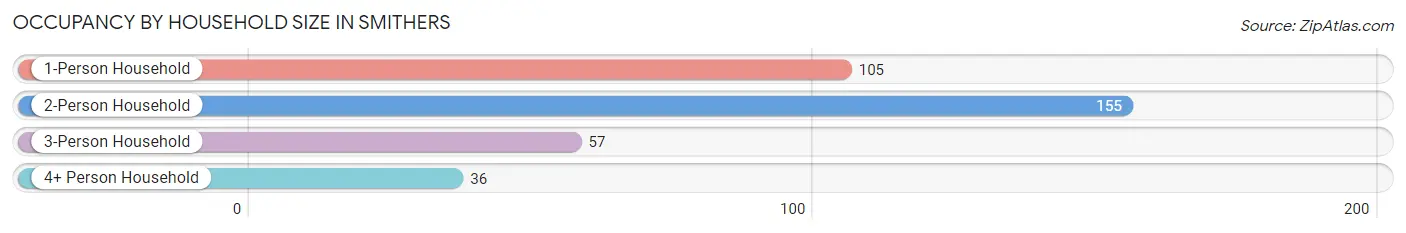
| Household Size | # Housing Units | % Housing Units |
| 1-Person Household | 105 | 29.7% |
| 2-Person Household | 155 | 43.9% |
| 3-Person Household | 57 | 16.2% |
| 4+ Person Household | 36 | 10.2% |
| Total Housing Units | 353 | 100.0% |
Occupancy by Ownership by Household Size in Smithers
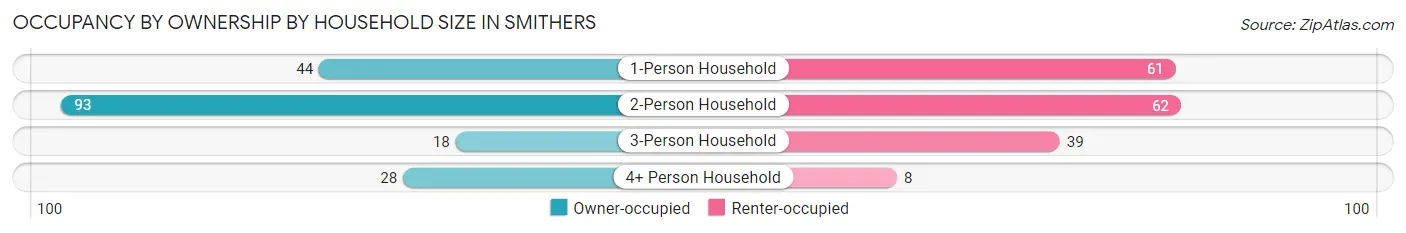
| Household Size | Owner-occupied | Renter-occupied |
| 1-Person Household | 44 (41.9%) | 61 (58.1%) |
| 2-Person Household | 93 (60.0%) | 62 (40.0%) |
| 3-Person Household | 18 (31.6%) | 39 (68.4%) |
| 4+ Person Household | 28 (77.8%) | 8 (22.2%) |
| Total Housing Units | 183 (51.8%) | 170 (48.2%) |
Occupancy by Educational Attainment in Smithers
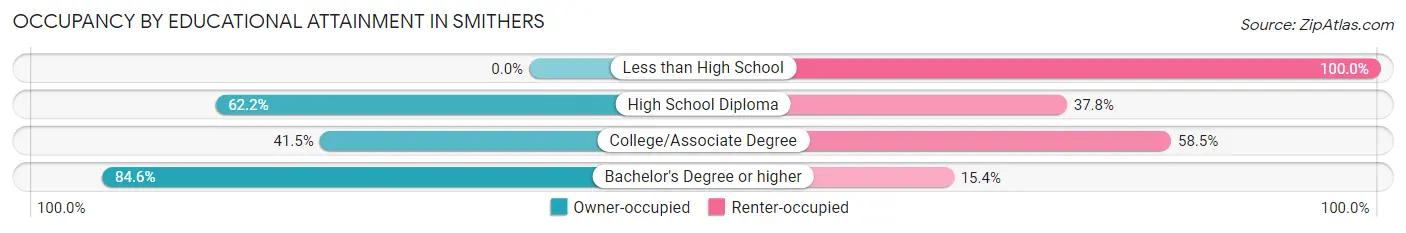
| Household Size | Owner-occupied | Renter-occupied |
| Less than High School | 0 (0.0%) | 43 (100.0%) |
| High School Diploma | 79 (62.2%) | 48 (37.8%) |
| College/Associate Degree | 49 (41.5%) | 69 (58.5%) |
| Bachelor's Degree or higher | 55 (84.6%) | 10 (15.4%) |
Occupancy by Age of Householder in Smithers
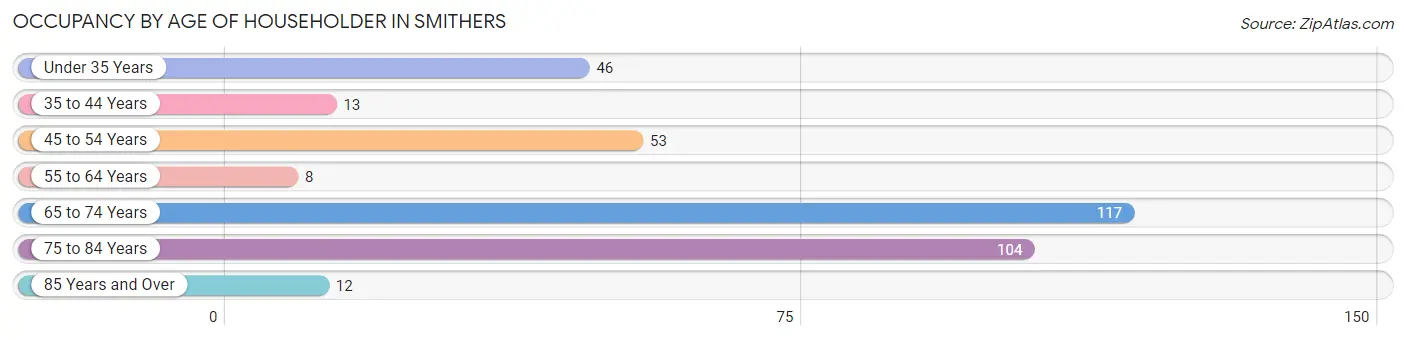
| Age Bracket | # Households | % Households |
| Under 35 Years | 46 | 13.0% |
| 35 to 44 Years | 13 | 3.7% |
| 45 to 54 Years | 53 | 15.0% |
| 55 to 64 Years | 8 | 2.3% |
| 65 to 74 Years | 117 | 33.1% |
| 75 to 84 Years | 104 | 29.5% |
| 85 Years and Over | 12 | 3.4% |
| Total | 353 | 100.0% |
Housing Finances in Smithers
Median Income by Occupancy in Smithers
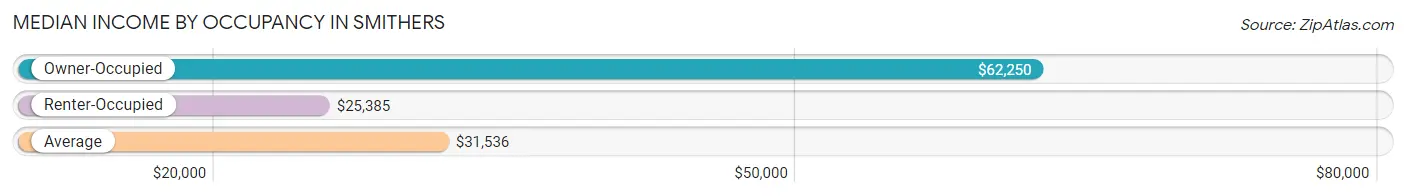
| Occupancy Type | # Households | Median Income |
| Owner-Occupied | 183 (51.8%) | $62,250 |
| Renter-Occupied | 170 (48.2%) | $25,385 |
| Average | 353 (100.0%) | $31,536 |
Occupancy by Householder Income Bracket in Smithers
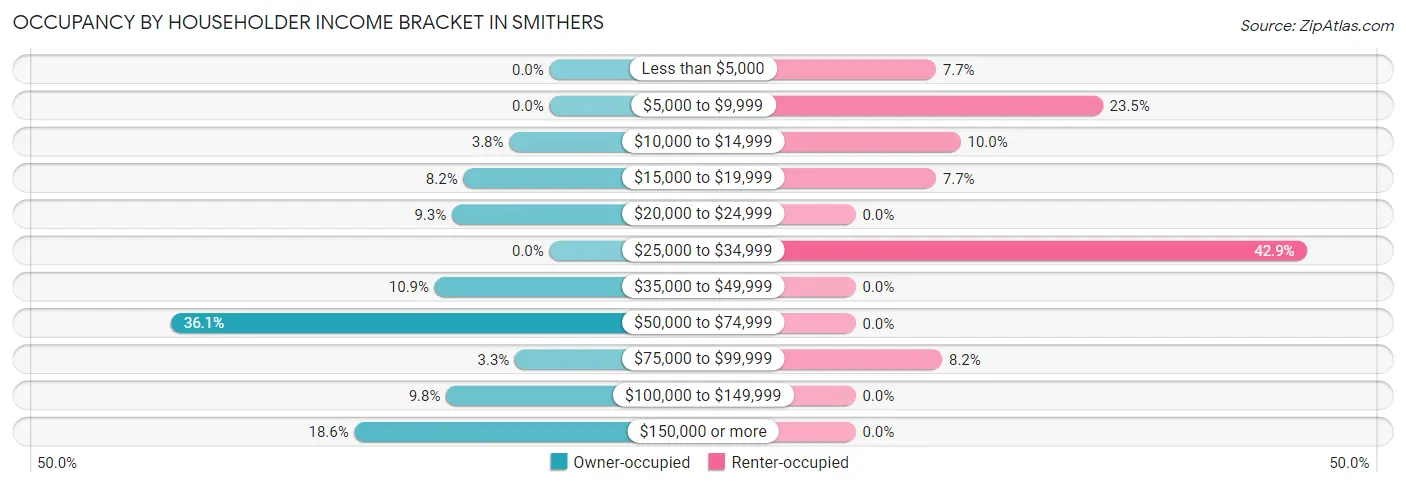
| Income Bracket | Owner-occupied | Renter-occupied |
| Less than $5,000 | 0 (0.0%) | 13 (7.6%) |
| $5,000 to $9,999 | 0 (0.0%) | 40 (23.5%) |
| $10,000 to $14,999 | 7 (3.8%) | 17 (10.0%) |
| $15,000 to $19,999 | 15 (8.2%) | 13 (7.6%) |
| $20,000 to $24,999 | 17 (9.3%) | 0 (0.0%) |
| $25,000 to $34,999 | 0 (0.0%) | 73 (42.9%) |
| $35,000 to $49,999 | 20 (10.9%) | 0 (0.0%) |
| $50,000 to $74,999 | 66 (36.1%) | 0 (0.0%) |
| $75,000 to $99,999 | 6 (3.3%) | 14 (8.2%) |
| $100,000 to $149,999 | 18 (9.8%) | 0 (0.0%) |
| $150,000 or more | 34 (18.6%) | 0 (0.0%) |
| Total | 183 (100.0%) | 170 (100.0%) |
Monthly Housing Cost Tiers in Smithers
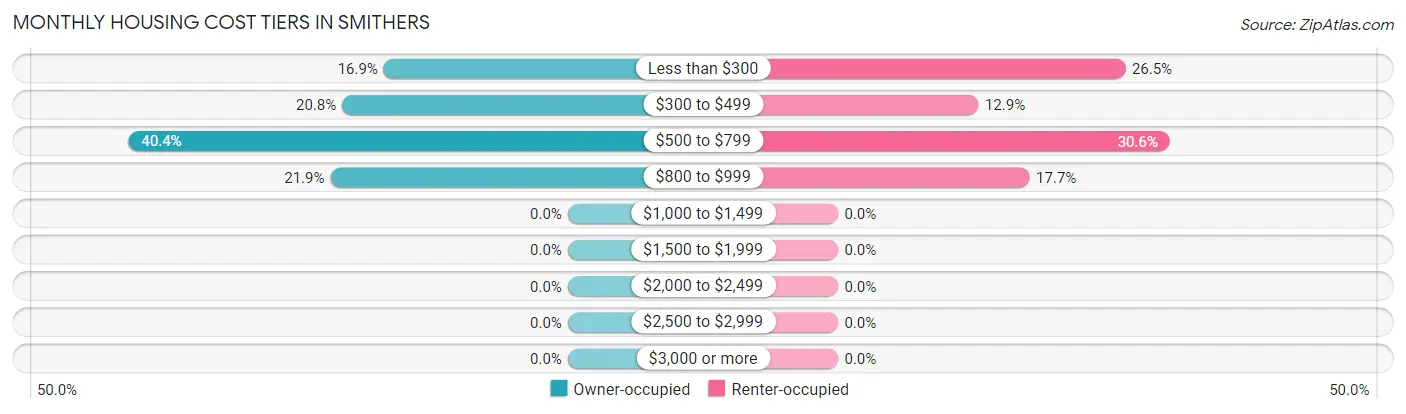
| Monthly Cost | Owner-occupied | Renter-occupied |
| Less than $300 | 31 (16.9%) | 45 (26.5%) |
| $300 to $499 | 38 (20.8%) | 22 (12.9%) |
| $500 to $799 | 74 (40.4%) | 52 (30.6%) |
| $800 to $999 | 40 (21.9%) | 30 (17.6%) |
| $1,000 to $1,499 | 0 (0.0%) | 0 (0.0%) |
| $1,500 to $1,999 | 0 (0.0%) | 0 (0.0%) |
| $2,000 to $2,499 | 0 (0.0%) | 0 (0.0%) |
| $2,500 to $2,999 | 0 (0.0%) | 0 (0.0%) |
| $3,000 or more | 0 (0.0%) | 0 (0.0%) |
| Total | 183 (100.0%) | 170 (100.0%) |
Physical Housing Characteristics in Smithers
Housing Structures in Smithers
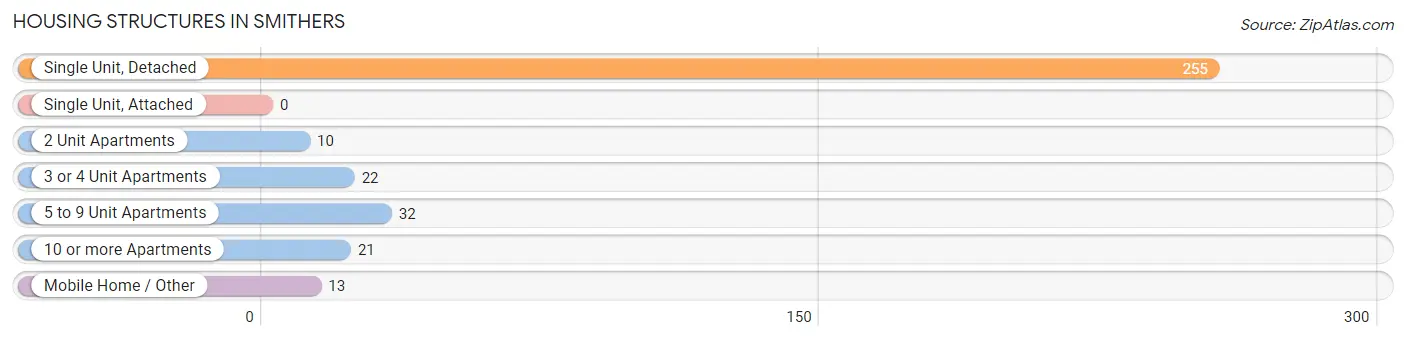
| Structure Type | # Housing Units | % Housing Units |
| Single Unit, Detached | 255 | 72.2% |
| Single Unit, Attached | 0 | 0.0% |
| 2 Unit Apartments | 10 | 2.8% |
| 3 or 4 Unit Apartments | 22 | 6.2% |
| 5 to 9 Unit Apartments | 32 | 9.1% |
| 10 or more Apartments | 21 | 5.9% |
| Mobile Home / Other | 13 | 3.7% |
| Total | 353 | 100.0% |
Housing Structures by Occupancy in Smithers
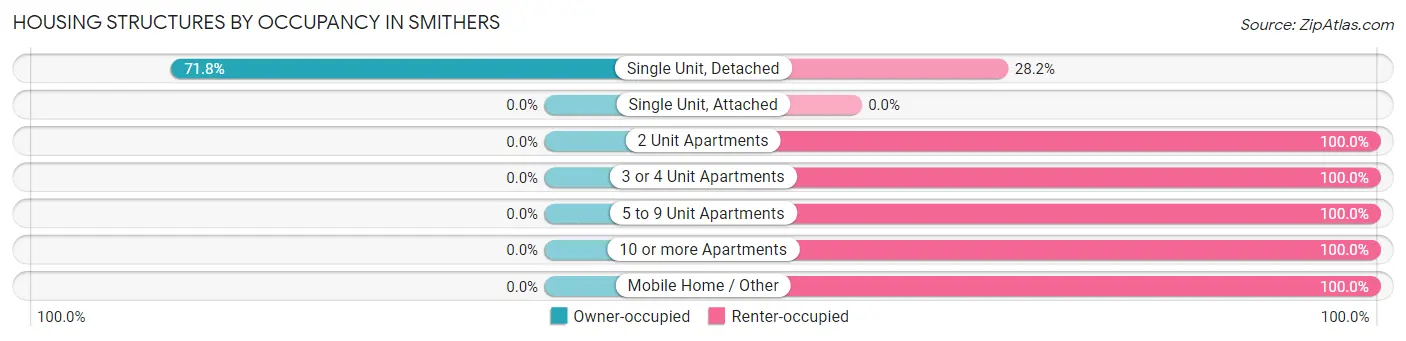
| Structure Type | Owner-occupied | Renter-occupied |
| Single Unit, Detached | 183 (71.8%) | 72 (28.2%) |
| Single Unit, Attached | 0 (0.0%) | 0 (0.0%) |
| 2 Unit Apartments | 0 (0.0%) | 10 (100.0%) |
| 3 or 4 Unit Apartments | 0 (0.0%) | 22 (100.0%) |
| 5 to 9 Unit Apartments | 0 (0.0%) | 32 (100.0%) |
| 10 or more Apartments | 0 (0.0%) | 21 (100.0%) |
| Mobile Home / Other | 0 (0.0%) | 13 (100.0%) |
| Total | 183 (51.8%) | 170 (48.2%) |
Housing Structures by Number of Rooms in Smithers
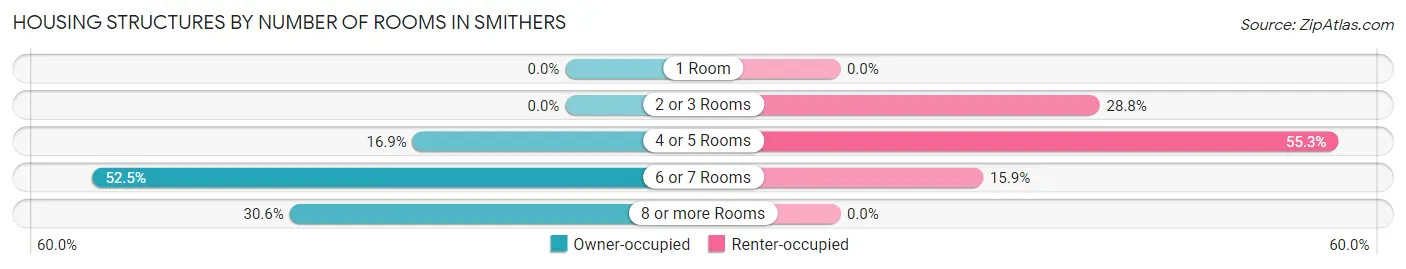
| Number of Rooms | Owner-occupied | Renter-occupied |
| 1 Room | 0 (0.0%) | 0 (0.0%) |
| 2 or 3 Rooms | 0 (0.0%) | 49 (28.8%) |
| 4 or 5 Rooms | 31 (16.9%) | 94 (55.3%) |
| 6 or 7 Rooms | 96 (52.5%) | 27 (15.9%) |
| 8 or more Rooms | 56 (30.6%) | 0 (0.0%) |
| Total | 183 (100.0%) | 170 (100.0%) |
Housing Structure by Heating Type in Smithers
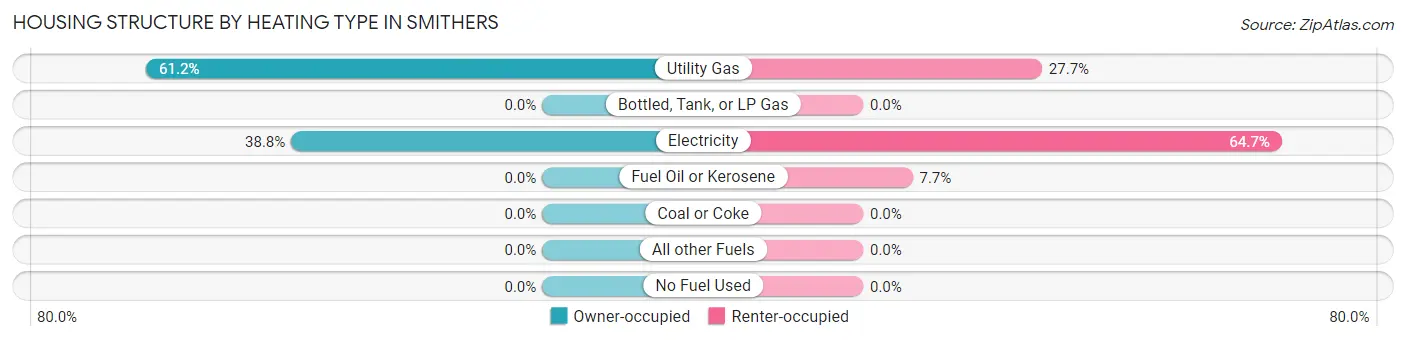
| Heating Type | Owner-occupied | Renter-occupied |
| Utility Gas | 112 (61.2%) | 47 (27.7%) |
| Bottled, Tank, or LP Gas | 0 (0.0%) | 0 (0.0%) |
| Electricity | 71 (38.8%) | 110 (64.7%) |
| Fuel Oil or Kerosene | 0 (0.0%) | 13 (7.6%) |
| Coal or Coke | 0 (0.0%) | 0 (0.0%) |
| All other Fuels | 0 (0.0%) | 0 (0.0%) |
| No Fuel Used | 0 (0.0%) | 0 (0.0%) |
| Total | 183 (100.0%) | 170 (100.0%) |
Household Vehicle Usage in Smithers
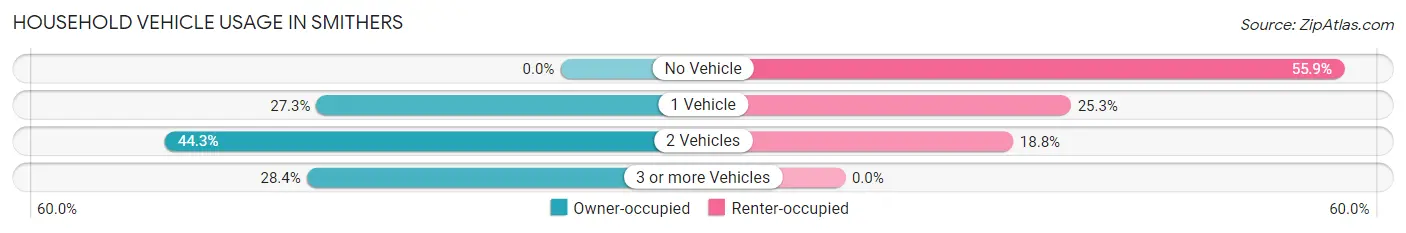
| Vehicles per Household | Owner-occupied | Renter-occupied |
| No Vehicle | 0 (0.0%) | 95 (55.9%) |
| 1 Vehicle | 50 (27.3%) | 43 (25.3%) |
| 2 Vehicles | 81 (44.3%) | 32 (18.8%) |
| 3 or more Vehicles | 52 (28.4%) | 0 (0.0%) |
| Total | 183 (100.0%) | 170 (100.0%) |
Real Estate & Mortgages in Smithers
Real Estate and Mortgage Overview in Smithers
| Characteristic | Without Mortgage | With Mortgage |
| Housing Units | 133 | 50 |
| Median Property Value | $194,800 | $63,600 |
| Median Household Income | - | - |
| Monthly Housing Costs | $438 | $0 |
| Real Estate Taxes | - | - |
Property Value by Mortgage Status in Smithers
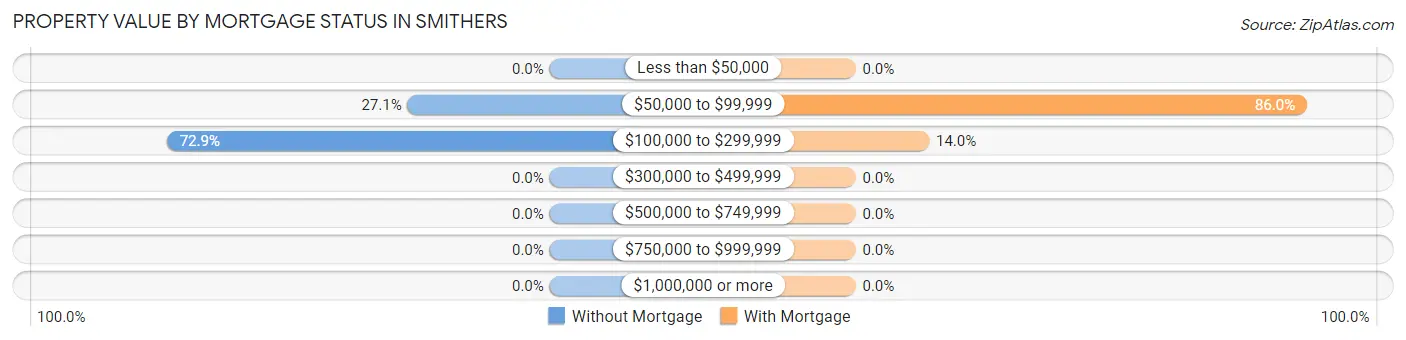
| Property Value | Without Mortgage | With Mortgage |
| Less than $50,000 | 0 (0.0%) | 0 (0.0%) |
| $50,000 to $99,999 | 36 (27.1%) | 43 (86.0%) |
| $100,000 to $299,999 | 97 (72.9%) | 7 (14.0%) |
| $300,000 to $499,999 | 0 (0.0%) | 0 (0.0%) |
| $500,000 to $749,999 | 0 (0.0%) | 0 (0.0%) |
| $750,000 to $999,999 | 0 (0.0%) | 0 (0.0%) |
| $1,000,000 or more | 0 (0.0%) | 0 (0.0%) |
| Total | 133 (100.0%) | 50 (100.0%) |
Household Income by Mortgage Status in Smithers
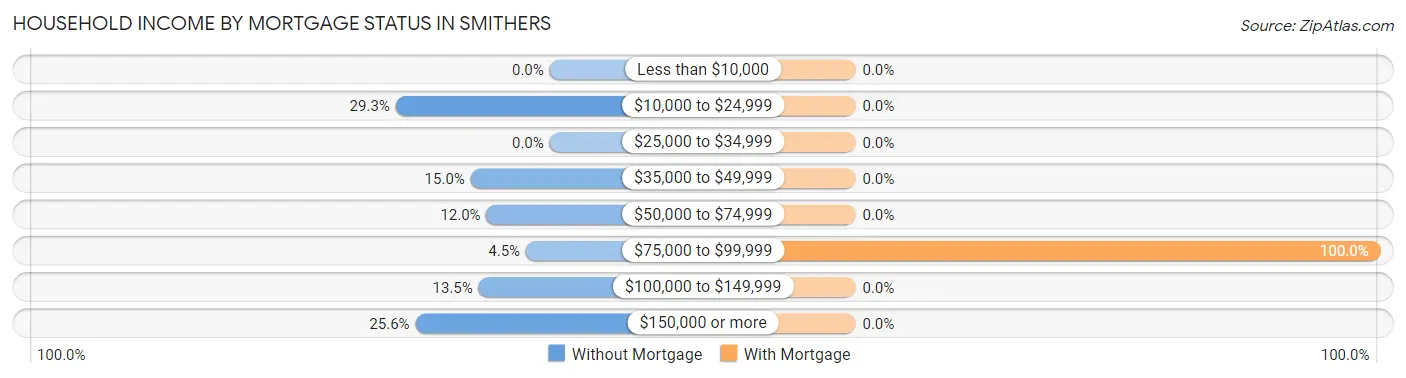
| Household Income | Without Mortgage | With Mortgage |
| Less than $10,000 | 0 (0.0%) | 0 (0.0%) |
| $10,000 to $24,999 | 39 (29.3%) | 0 (0.0%) |
| $25,000 to $34,999 | 0 (0.0%) | 0 (0.0%) |
| $35,000 to $49,999 | 20 (15.0%) | 0 (0.0%) |
| $50,000 to $74,999 | 16 (12.0%) | 0 (0.0%) |
| $75,000 to $99,999 | 6 (4.5%) | 50 (100.0%) |
| $100,000 to $149,999 | 18 (13.5%) | 0 (0.0%) |
| $150,000 or more | 34 (25.6%) | 0 (0.0%) |
| Total | 133 (100.0%) | 50 (100.0%) |
Property Value to Household Income Ratio in Smithers
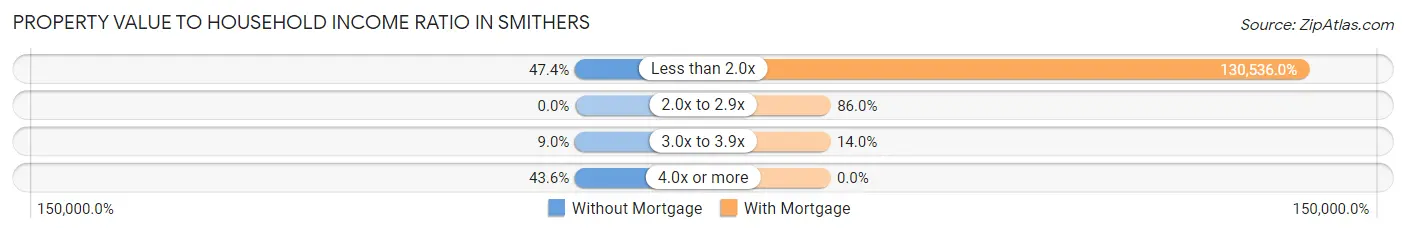
| Value-to-Income Ratio | Without Mortgage | With Mortgage |
| Less than 2.0x | 63 (47.4%) | 65,268 (130,536.0%) |
| 2.0x to 2.9x | 0 (0.0%) | 43 (86.0%) |
| 3.0x to 3.9x | 12 (9.0%) | 7 (14.0%) |
| 4.0x or more | 58 (43.6%) | 0 (0.0%) |
| Total | 133 (100.0%) | 50 (100.0%) |
Real Estate Taxes by Mortgage Status in Smithers
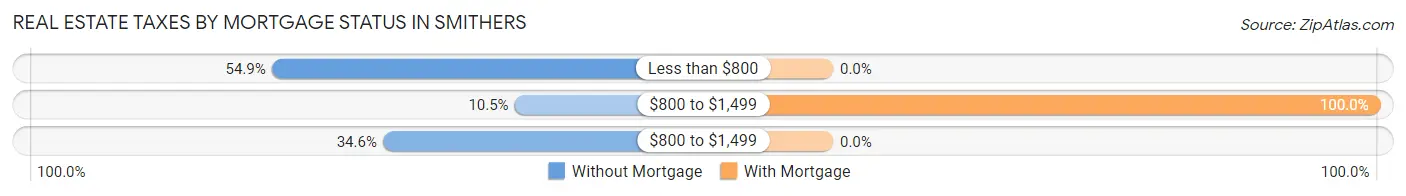
| Property Taxes | Without Mortgage | With Mortgage |
| Less than $800 | 73 (54.9%) | 0 (0.0%) |
| $800 to $1,499 | 14 (10.5%) | 50 (100.0%) |
| $800 to $1,499 | 46 (34.6%) | 0 (0.0%) |
| Total | 133 (100.0%) | 50 (100.0%) |
Health & Disability in Smithers
Health Insurance Coverage by Age in Smithers
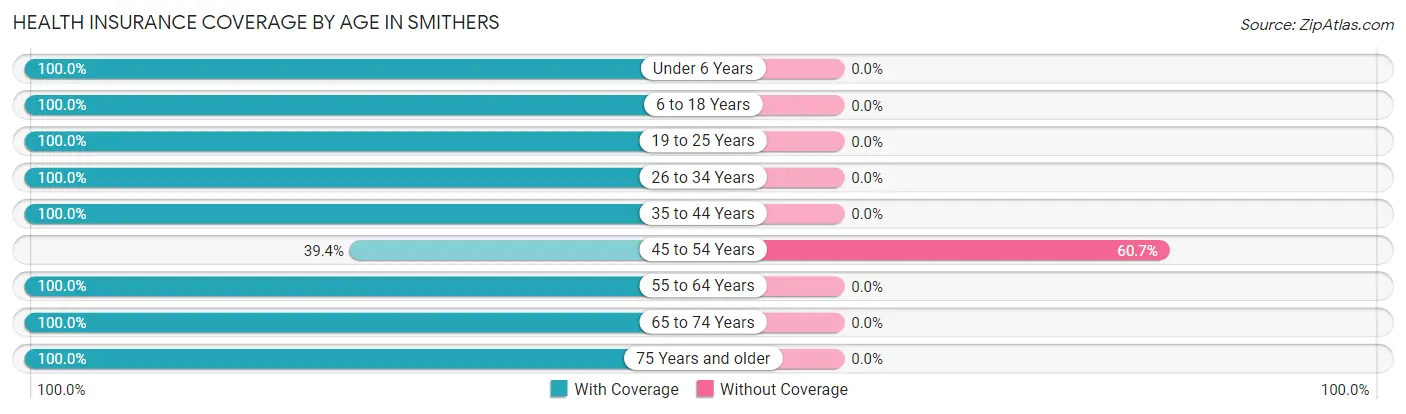
| Age Bracket | With Coverage | Without Coverage |
| Under 6 Years | 56 (100.0%) | 0 (0.0%) |
| 6 to 18 Years | 44 (100.0%) | 0 (0.0%) |
| 19 to 25 Years | 25 (100.0%) | 0 (0.0%) |
| 26 to 34 Years | 133 (100.0%) | 0 (0.0%) |
| 35 to 44 Years | 13 (100.0%) | 0 (0.0%) |
| 45 to 54 Years | 61 (39.4%) | 94 (60.7%) |
| 55 to 64 Years | 21 (100.0%) | 0 (0.0%) |
| 65 to 74 Years | 244 (100.0%) | 0 (0.0%) |
| 75 Years and older | 147 (100.0%) | 0 (0.0%) |
| Total | 744 (88.8%) | 94 (11.2%) |
Health Insurance Coverage by Citizenship Status in Smithers
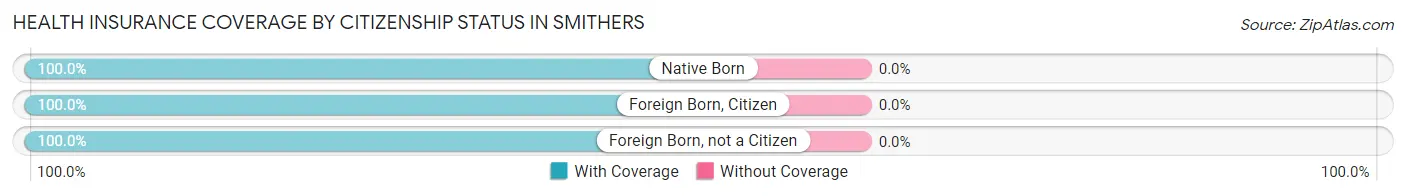
| Citizenship Status | With Coverage | Without Coverage |
| Native Born | 56 (100.0%) | 0 (0.0%) |
| Foreign Born, Citizen | 44 (100.0%) | 0 (0.0%) |
| Foreign Born, not a Citizen | 25 (100.0%) | 0 (0.0%) |
Health Insurance Coverage by Household Income in Smithers
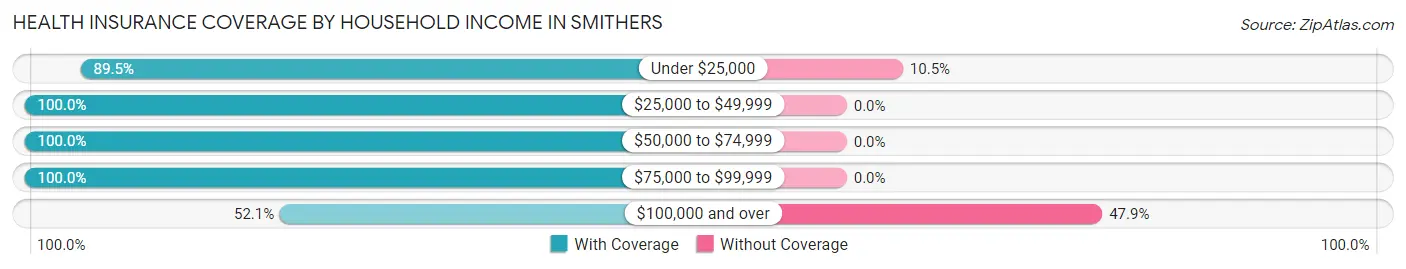
| Household Income | With Coverage | Without Coverage |
| Under $25,000 | 230 (89.5%) | 27 (10.5%) |
| $25,000 to $49,999 | 166 (100.0%) | 0 (0.0%) |
| $50,000 to $74,999 | 237 (100.0%) | 0 (0.0%) |
| $75,000 to $99,999 | 36 (100.0%) | 0 (0.0%) |
| $100,000 and over | 73 (52.1%) | 67 (47.9%) |
Public vs Private Health Insurance Coverage by Age in Smithers
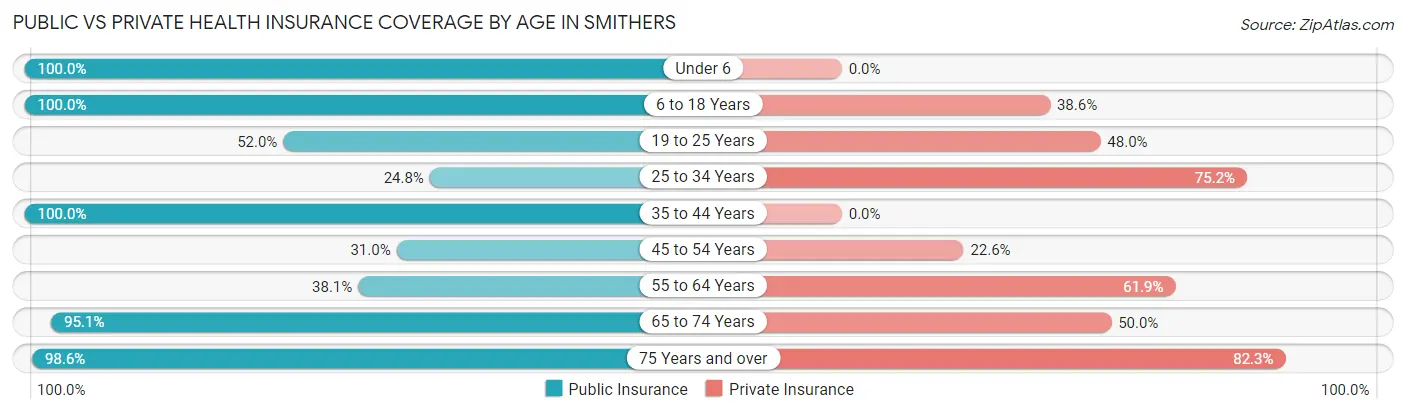
| Age Bracket | Public Insurance | Private Insurance |
| Under 6 | 56 (100.0%) | 0 (0.0%) |
| 6 to 18 Years | 44 (100.0%) | 17 (38.6%) |
| 19 to 25 Years | 13 (52.0%) | 12 (48.0%) |
| 25 to 34 Years | 33 (24.8%) | 100 (75.2%) |
| 35 to 44 Years | 13 (100.0%) | 0 (0.0%) |
| 45 to 54 Years | 48 (31.0%) | 35 (22.6%) |
| 55 to 64 Years | 8 (38.1%) | 13 (61.9%) |
| 65 to 74 Years | 232 (95.1%) | 122 (50.0%) |
| 75 Years and over | 145 (98.6%) | 121 (82.3%) |
| Total | 592 (70.6%) | 420 (50.1%) |
Disability Status by Sex by Age in Smithers
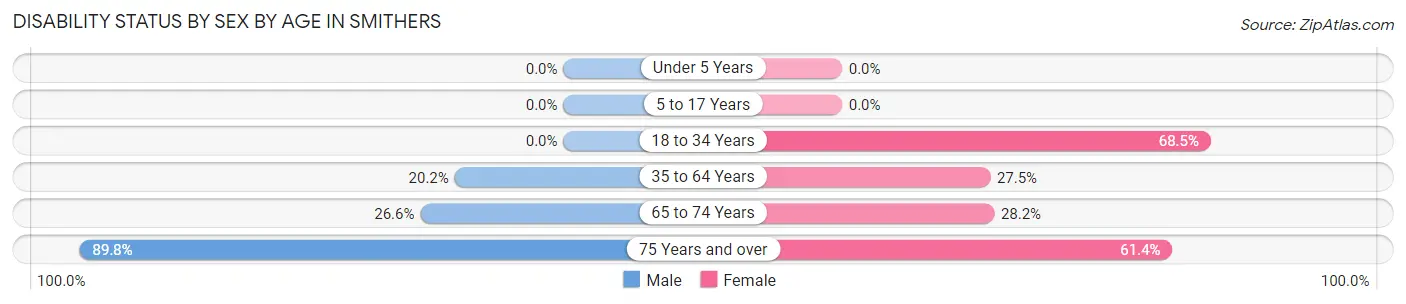
| Age Bracket | Male | Female |
| Under 5 Years | 0 (0.0%) | 0 (0.0%) |
| 5 to 17 Years | 0 (0.0%) | 0 (0.0%) |
| 18 to 34 Years | 0 (0.0%) | 100 (68.5%) |
| 35 to 64 Years | 22 (20.2%) | 22 (27.5%) |
| 65 to 74 Years | 30 (26.6%) | 37 (28.2%) |
| 75 Years and over | 53 (89.8%) | 54 (61.4%) |
Disability Class by Sex by Age in Smithers
Disability Class: Hearing Difficulty
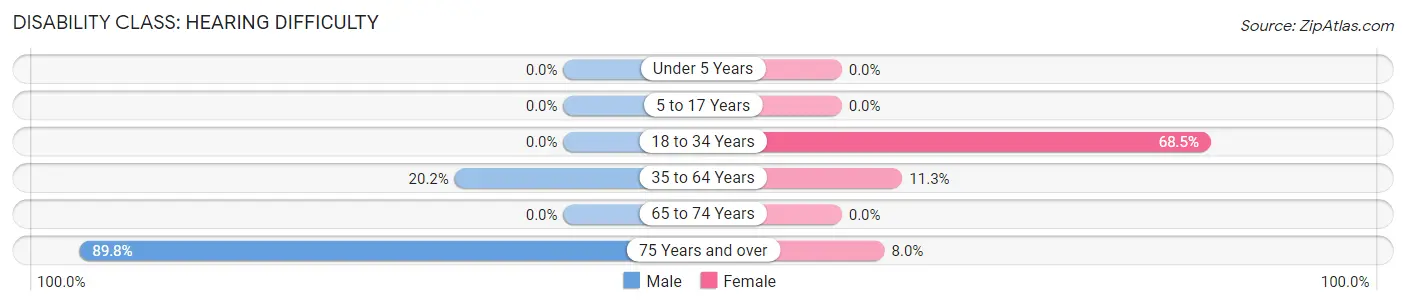
| Age Bracket | Male | Female |
| Under 5 Years | 0 (0.0%) | 0 (0.0%) |
| 5 to 17 Years | 0 (0.0%) | 0 (0.0%) |
| 18 to 34 Years | 0 (0.0%) | 100 (68.5%) |
| 35 to 64 Years | 22 (20.2%) | 9 (11.3%) |
| 65 to 74 Years | 0 (0.0%) | 0 (0.0%) |
| 75 Years and over | 53 (89.8%) | 7 (8.0%) |
Disability Class: Vision Difficulty
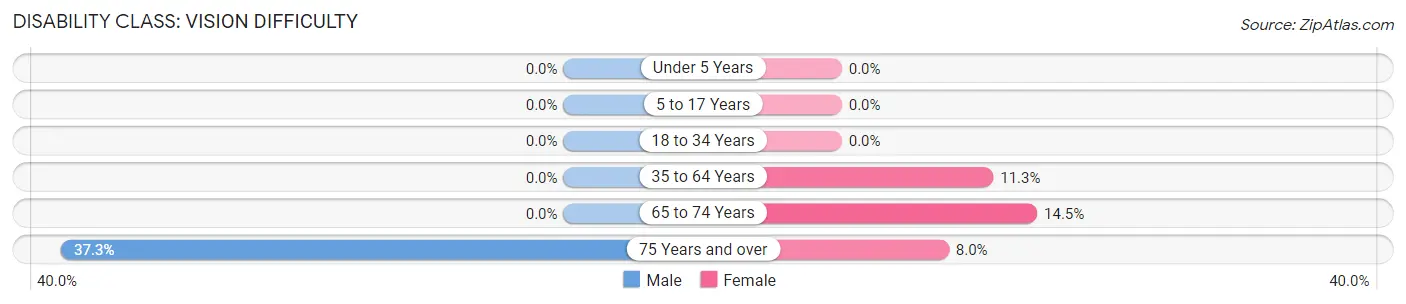
| Age Bracket | Male | Female |
| Under 5 Years | 0 (0.0%) | 0 (0.0%) |
| 5 to 17 Years | 0 (0.0%) | 0 (0.0%) |
| 18 to 34 Years | 0 (0.0%) | 0 (0.0%) |
| 35 to 64 Years | 0 (0.0%) | 9 (11.3%) |
| 65 to 74 Years | 0 (0.0%) | 19 (14.5%) |
| 75 Years and over | 22 (37.3%) | 7 (8.0%) |
Disability Class: Cognitive Difficulty
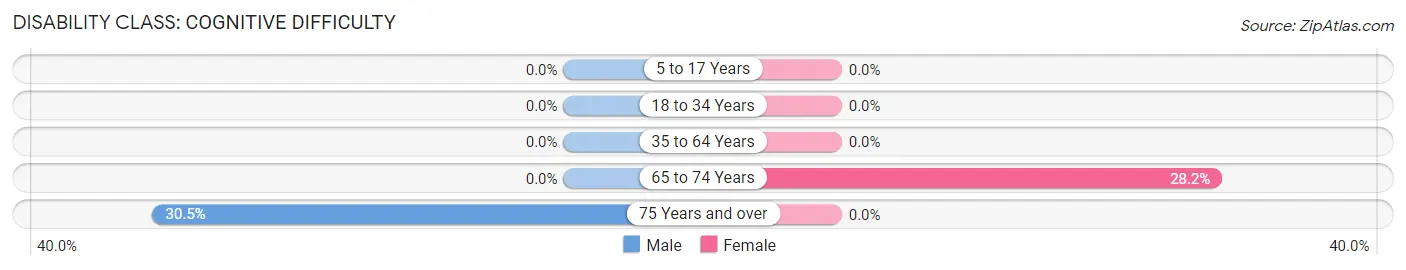
| Age Bracket | Male | Female |
| 5 to 17 Years | 0 (0.0%) | 0 (0.0%) |
| 18 to 34 Years | 0 (0.0%) | 0 (0.0%) |
| 35 to 64 Years | 0 (0.0%) | 0 (0.0%) |
| 65 to 74 Years | 0 (0.0%) | 37 (28.2%) |
| 75 Years and over | 18 (30.5%) | 0 (0.0%) |
Disability Class: Ambulatory Difficulty
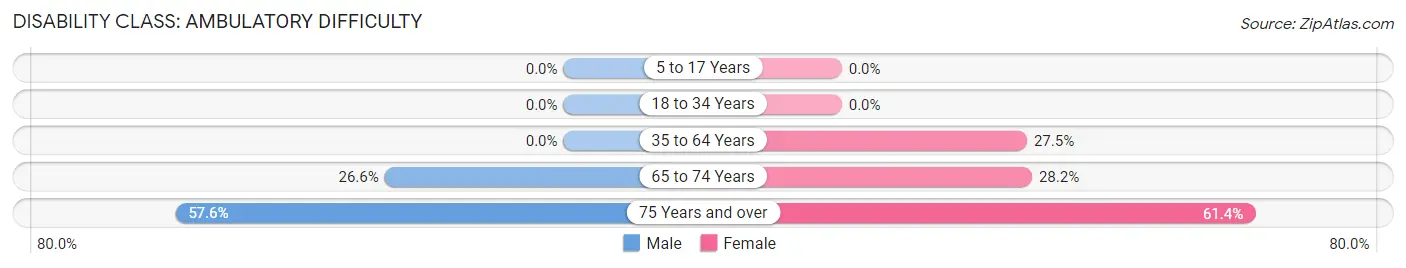
| Age Bracket | Male | Female |
| 5 to 17 Years | 0 (0.0%) | 0 (0.0%) |
| 18 to 34 Years | 0 (0.0%) | 0 (0.0%) |
| 35 to 64 Years | 0 (0.0%) | 22 (27.5%) |
| 65 to 74 Years | 30 (26.6%) | 37 (28.2%) |
| 75 Years and over | 34 (57.6%) | 54 (61.4%) |
Disability Class: Self-Care Difficulty
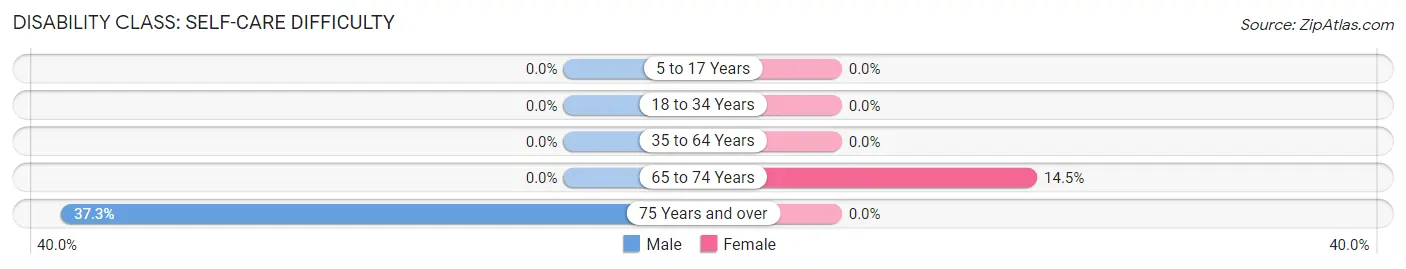
| Age Bracket | Male | Female |
| 5 to 17 Years | 0 (0.0%) | 0 (0.0%) |
| 18 to 34 Years | 0 (0.0%) | 0 (0.0%) |
| 35 to 64 Years | 0 (0.0%) | 0 (0.0%) |
| 65 to 74 Years | 0 (0.0%) | 19 (14.5%) |
| 75 Years and over | 22 (37.3%) | 0 (0.0%) |
Technology Access in Smithers
Computing Device Access in Smithers
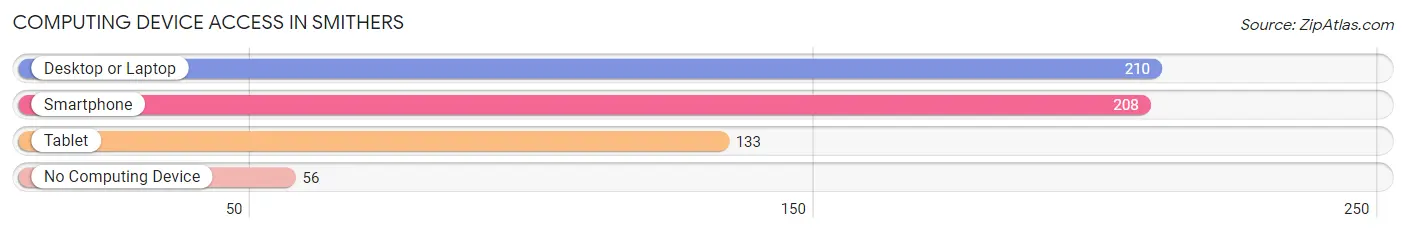
| Device Type | # Households | % Households |
| Desktop or Laptop | 210 | 59.5% |
| Smartphone | 208 | 58.9% |
| Tablet | 133 | 37.7% |
| No Computing Device | 56 | 15.9% |
| Total | 353 | 100.0% |
Internet Access in Smithers
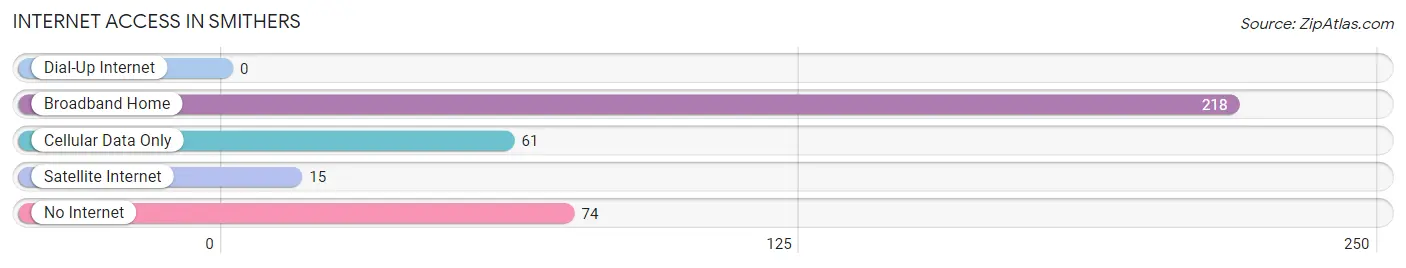
| Internet Type | # Households | % Households |
| Dial-Up Internet | 0 | 0.0% |
| Broadband Home | 218 | 61.8% |
| Cellular Data Only | 61 | 17.3% |
| Satellite Internet | 15 | 4.3% |
| No Internet | 74 | 21.0% |
| Total | 353 | 100.0% |
Smithers Summary
Smithers, West Virginia is a small town located in Fayette County, West Virginia. It is situated along the banks of the New River and is part of the Beckley-Raleigh County Metropolitan Statistical Area. The town has a population of approximately 1,000 people and is known for its rich history and culture.
History
The town of Smithers was founded in 1883 by the Smithers family, who had moved to the area from Virginia. The town was named after the family’s patriarch, William Smithers. The town was originally a coal mining town, and the Smithers family owned several coal mines in the area. The town grew rapidly in the late 19th and early 20th centuries, and by the 1920s, it had become a bustling community with a population of over 1,000 people.
The town was also home to several businesses, including a general store, a hotel, a bank, and a post office. The town was also home to a number of churches, including the First Baptist Church, which was founded in 1883.
Geography
Smithers is located in the Appalachian Mountains of West Virginia. The town is situated along the banks of the New River, which is a tributary of the Kanawha River. The town is surrounded by rolling hills and lush forests, and is located approximately 30 miles south of the state capital of Charleston.
The town is located at an elevation of 1,400 feet above sea level, and the average annual temperature is around 50 degrees Fahrenheit. The town receives an average of 44 inches of precipitation each year, and the average snowfall is around 20 inches.
Economy
The economy of Smithers is largely based on the coal mining industry. The town is home to several coal mines, and the coal industry is the primary source of employment for the town’s residents. The town is also home to several small businesses, including restaurants, retail stores, and service providers.
The town is also home to a number of tourist attractions, including the New River Gorge National River, which is a popular destination for whitewater rafting and other outdoor activities. The town is also home to the Smithers Country Club, which is a popular destination for golfers.
Demographics
As of the 2010 census, the population of Smithers was 1,000 people. The town is predominantly white, with approximately 95% of the population identifying as white. The median household income in the town is around $30,000, and the median age is around 40 years old.
The town is home to a number of churches, including the First Baptist Church, which was founded in 1883. The town is also home to a number of schools, including Smithers Elementary School and Smithers High School.
Conclusion
Smithers, West Virginia is a small town located in Fayette County, West Virginia. It is situated along the banks of the New River and is part of the Beckley-Raleigh County Metropolitan Statistical Area. The town has a population of approximately 1,000 people and is known for its rich history and culture. The town’s economy is largely based on the coal mining industry, and the town is also home to several small businesses and tourist attractions. The town is predominantly white, with a median household income of around $30,000 and a median age of around 40 years old.
Common Questions
What is Per Capita Income in Smithers?
Per Capita income in Smithers is $27,381.
What is the Median Family Income in Smithers?
Median Family Income in Smithers is $51,979.
What is the Median Household income in Smithers?
Median Household Income in Smithers is $31,536.
What is Income or Wage Gap in Smithers?
Income or Wage Gap in Smithers is 85.8%.
Women in Smithers earn 14.2 cents for every dollar earned by a man.
What is Inequality or Gini Index in Smithers?
Inequality or Gini Index in Smithers is 0.50.
What is the Total Population of Smithers?
Total Population of Smithers is 838.
What is the Total Male Population of Smithers?
Total Male Population of Smithers is 321.
What is the Total Female Population of Smithers?
Total Female Population of Smithers is 517.
What is the Ratio of Males per 100 Females in Smithers?
There are 62.09 Males per 100 Females in Smithers.
What is the Ratio of Females per 100 Males in Smithers?
There are 161.06 Females per 100 Males in Smithers.
What is the Median Population Age in Smithers?
Median Population Age in Smithers is 54.8 Years.
What is the Average Family Size in Smithers
Average Family Size in Smithers is 2.9 People.
What is the Average Household Size in Smithers
Average Household Size in Smithers is 2.4 People.
How Large is the Labor Force in Smithers?
There are 247 People in the Labor Forcein in Smithers.
What is the Percentage of People in the Labor Force in Smithers?
33.5% of People are in the Labor Force in Smithers.
What is the Unemployment Rate in Smithers?
Unemployment Rate in Smithers is 5.3%.