Point Pleasant, WV Map & Demographics
Point Pleasant Map
Point Pleasant Overview
$30,990
PER CAPITA INCOME
$73,750
AVG FAMILY INCOME
$45,996
AVG HOUSEHOLD INCOME
54.1%
WAGE / INCOME GAP [ % ]
45.9¢/ $1
WAGE / INCOME GAP [ $ ]
0.48
INEQUALITY / GINI INDEX
4,067
TOTAL POPULATION
2,030
MALE POPULATION
2,037
FEMALE POPULATION
99.66
MALES / 100 FEMALES
100.34
FEMALES / 100 MALES
44.5
MEDIAN AGE
3.1
AVG FAMILY SIZE
2.1
AVG HOUSEHOLD SIZE
1,559
LABOR FORCE [ PEOPLE ]
49.9%
PERCENT IN LABOR FORCE
3.3%
UNEMPLOYMENT RATE
Point Pleasant Zip Codes
Point Pleasant Area Codes
Income in Point Pleasant
Income Overview in Point Pleasant
Per Capita Income in Point Pleasant is $30,990, while median incomes of families and households are $73,750 and $45,996 respectively.
| Characteristic | Number | Measure |
| Per Capita Income | 4,067 | $30,990 |
| Median Family Income | 916 | $73,750 |
| Mean Family Income | 916 | $96,194 |
| Median Household Income | 1,885 | $45,996 |
| Mean Household Income | 1,885 | $64,138 |
| Income Deficit | 916 | $0 |
| Wage / Income Gap (%) | 4,067 | 54.15% |
| Wage / Income Gap ($) | 4,067 | 45.85¢ per $1 |
| Gini / Inequality Index | 4,067 | 0.48 |
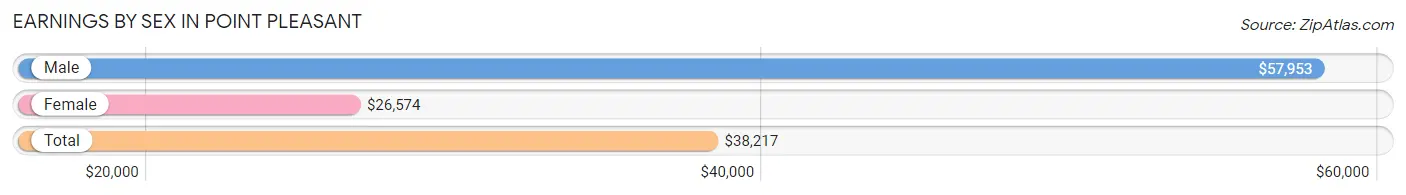
Earnings by Sex in Point Pleasant
Average Earnings in Point Pleasant are $38,217, $57,953 for men and $26,574 for women, a difference of 54.1%.
| Sex | Number | Average Earnings |
| Male | 853 (50.5%) | $57,953 |
| Female | 836 (49.5%) | $26,574 |
| Total | 1,689 (100.0%) | $38,217 |
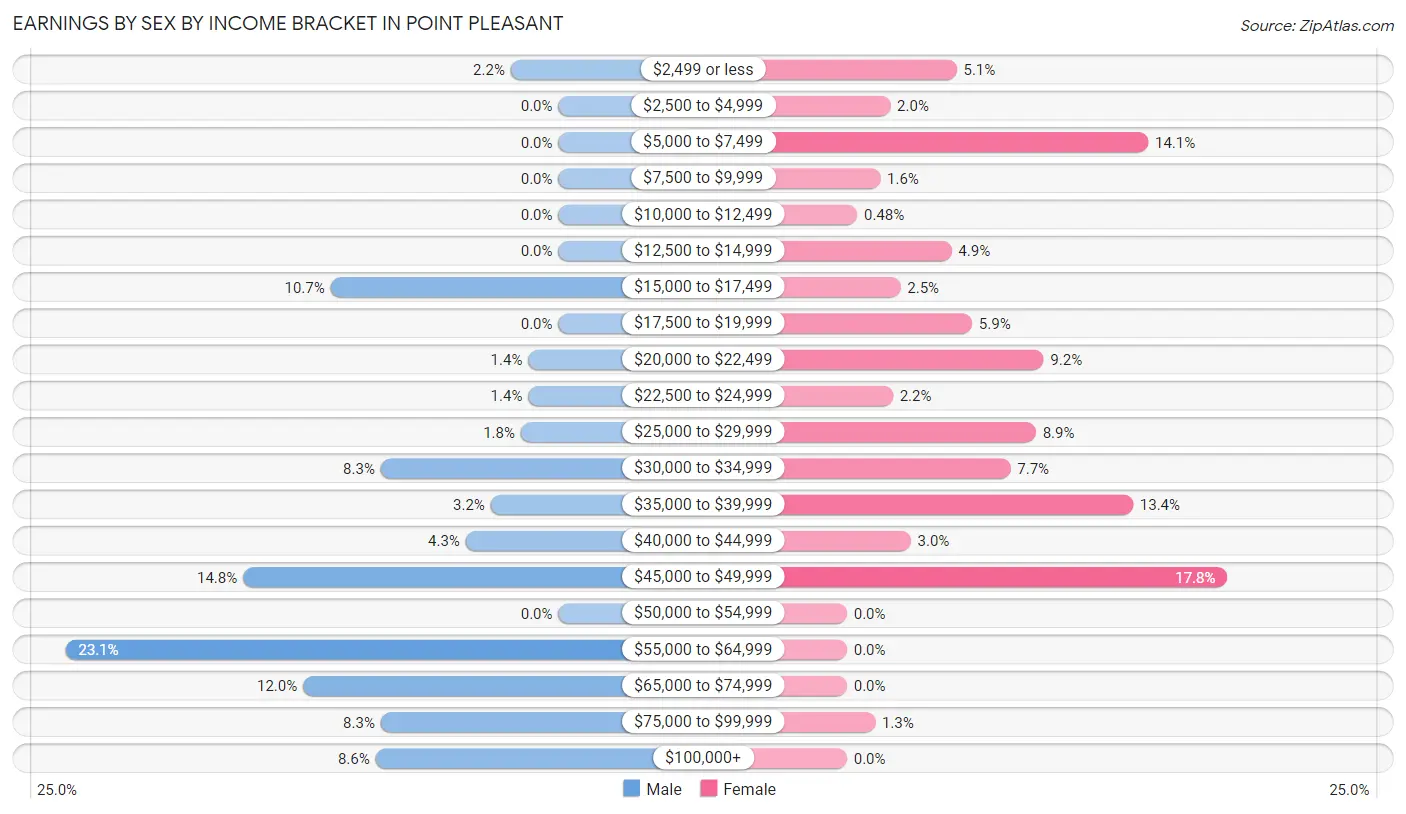
Earnings by Sex by Income Bracket in Point Pleasant
The most common earnings brackets in Point Pleasant are $55,000 to $64,999 for men (197 | 23.1%) and $45,000 to $49,999 for women (149 | 17.8%).
| Income | Male | Female |
| $2,499 or less | 19 (2.2%) | 43 (5.1%) |
| $2,500 to $4,999 | 0 (0.0%) | 17 (2.0%) |
| $5,000 to $7,499 | 0 (0.0%) | 118 (14.1%) |
| $7,500 to $9,999 | 0 (0.0%) | 13 (1.6%) |
| $10,000 to $12,499 | 0 (0.0%) | 4 (0.5%) |
| $12,500 to $14,999 | 0 (0.0%) | 41 (4.9%) |
| $15,000 to $17,499 | 91 (10.7%) | 21 (2.5%) |
| $17,500 to $19,999 | 0 (0.0%) | 49 (5.9%) |
| $20,000 to $22,499 | 12 (1.4%) | 77 (9.2%) |
| $22,500 to $24,999 | 12 (1.4%) | 18 (2.1%) |
| $25,000 to $29,999 | 15 (1.8%) | 74 (8.8%) |
| $30,000 to $34,999 | 71 (8.3%) | 64 (7.7%) |
| $35,000 to $39,999 | 27 (3.2%) | 112 (13.4%) |
| $40,000 to $44,999 | 37 (4.3%) | 25 (3.0%) |
| $45,000 to $49,999 | 126 (14.8%) | 149 (17.8%) |
| $50,000 to $54,999 | 0 (0.0%) | 0 (0.0%) |
| $55,000 to $64,999 | 197 (23.1%) | 0 (0.0%) |
| $65,000 to $74,999 | 102 (12.0%) | 0 (0.0%) |
| $75,000 to $99,999 | 71 (8.3%) | 11 (1.3%) |
| $100,000+ | 73 (8.6%) | 0 (0.0%) |
| Total | 853 (100.0%) | 836 (100.0%) |
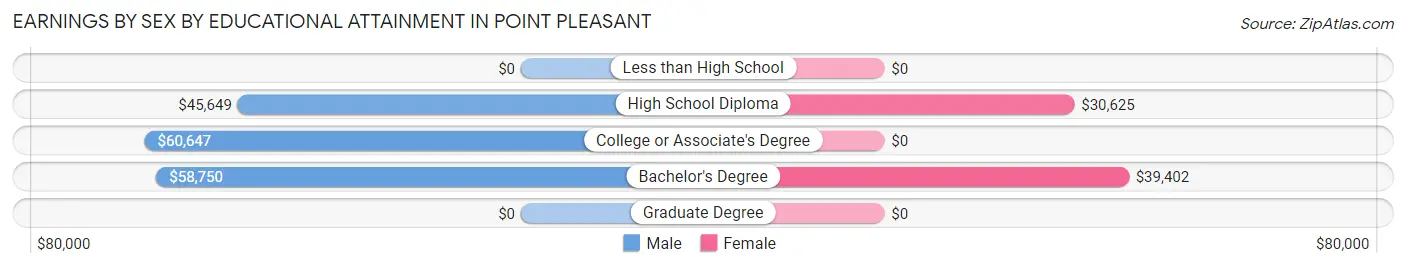
Earnings by Sex by Educational Attainment in Point Pleasant
Average earnings in Point Pleasant are $58,434 for men and $29,043 for women, a difference of 50.3%. Men with an educational attainment of college or associate's degree enjoy the highest average annual earnings of $60,647, while those with high school diploma education earn the least with $45,649. Women with an educational attainment of bachelor's degree earn the most with the average annual earnings of $39,402, while those with high school diploma education have the smallest earnings of $30,625.
| Educational Attainment | Male Income | Female Income |
| Less than High School | - | - |
| High School Diploma | $45,649 | $30,625 |
| College or Associate's Degree | $60,647 | $0 |
| Bachelor's Degree | $58,750 | $39,402 |
| Graduate Degree | - | - |
| Total | $58,434 | $29,043 |
Family Income in Point Pleasant
Family Income Brackets in Point Pleasant
According to the Point Pleasant family income data, there are 240 families falling into the $75,000 to $99,999 income range, which is the most common income bracket and makes up 26.2% of all families.
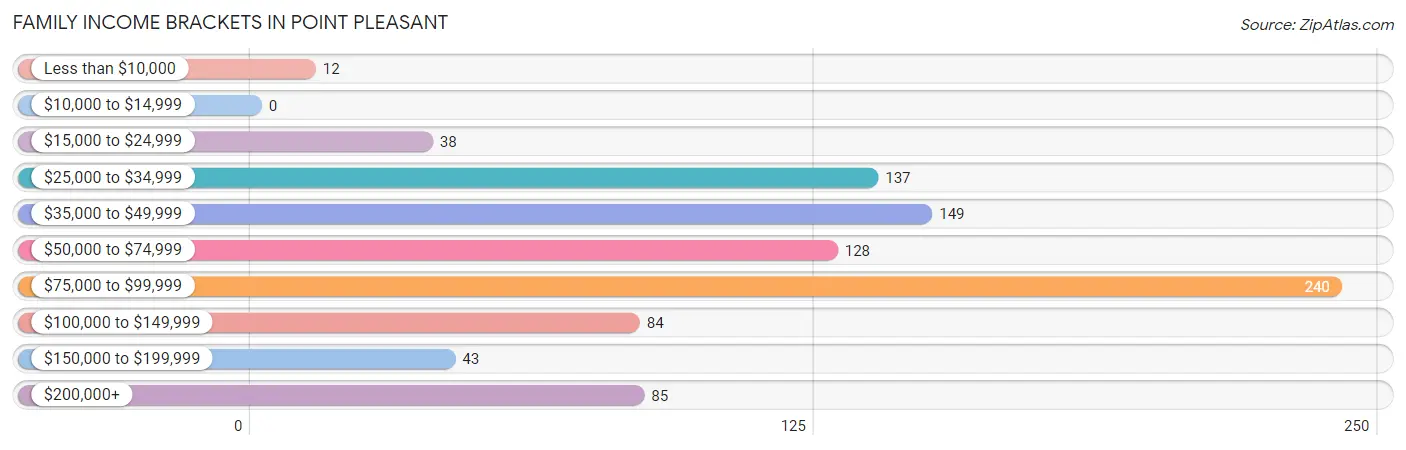
| Income Bracket | # Families | % Families |
| Less than $10,000 | 12 | 1.3% |
| $10,000 to $14,999 | 0 | 0.0% |
| $15,000 to $24,999 | 38 | 4.1% |
| $25,000 to $34,999 | 137 | 15.0% |
| $35,000 to $49,999 | 149 | 16.3% |
| $50,000 to $74,999 | 128 | 14.0% |
| $75,000 to $99,999 | 240 | 26.2% |
| $100,000 to $149,999 | 84 | 9.2% |
| $150,000 to $199,999 | 43 | 4.7% |
| $200,000+ | 85 | 9.3% |
Family Income by Famaliy Size in Point Pleasant
3-person families (90 | 9.8%) account for the highest median family income in Point Pleasant with $76,029 per family, while 2-person families (594 | 64.8%) have the highest median income of $33,290 per family member.
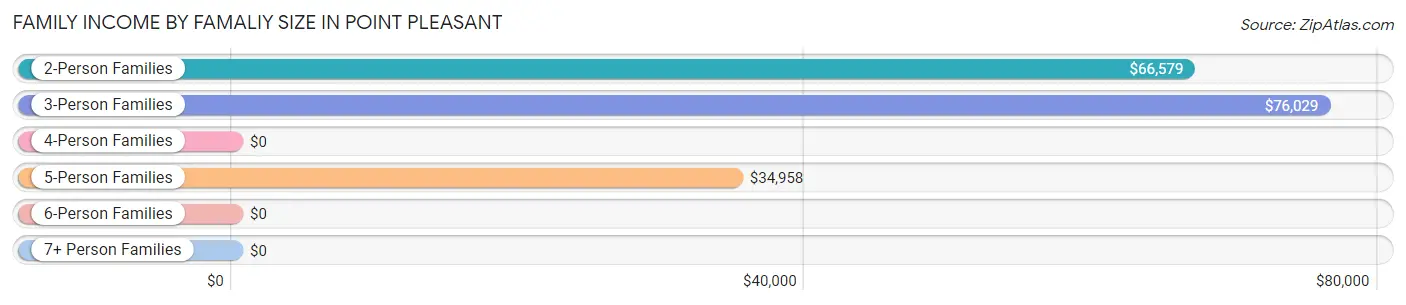
| Income Bracket | # Families | Median Income |
| 2-Person Families | 594 (64.8%) | $66,579 |
| 3-Person Families | 90 (9.8%) | $76,029 |
| 4-Person Families | 104 (11.4%) | $0 |
| 5-Person Families | 81 (8.8%) | $34,958 |
| 6-Person Families | 47 (5.1%) | $0 |
| 7+ Person Families | 0 (0.0%) | $0 |
| Total | 916 (100.0%) | $73,750 |
Family Income by Number of Earners in Point Pleasant
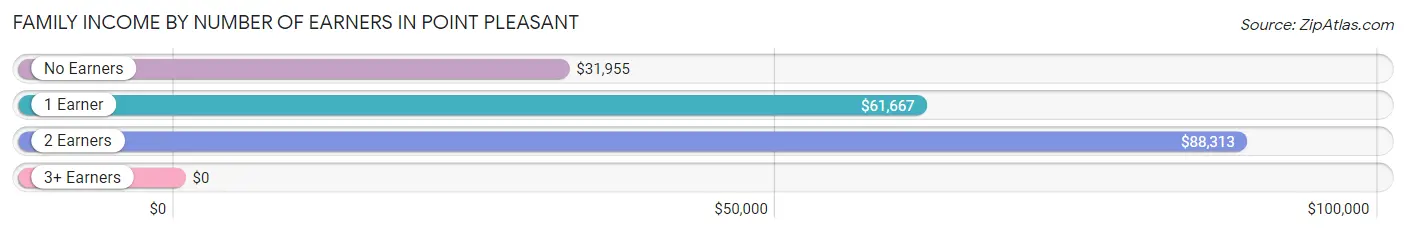
| Number of Earners | # Families | Median Income |
| No Earners | 175 (19.1%) | $31,955 |
| 1 Earner | 320 (34.9%) | $61,667 |
| 2 Earners | 395 (43.1%) | $88,313 |
| 3+ Earners | 26 (2.8%) | $0 |
| Total | 916 (100.0%) | $73,750 |
Household Income in Point Pleasant
Household Income Brackets in Point Pleasant
With 371 households falling in the category, the $35,000 to $49,999 income range is the most frequent in Point Pleasant, accounting for 19.7% of all households. In contrast, only 43 households (2.3%) fall into the $150,000 to $199,999 income bracket, making it the least populous group.
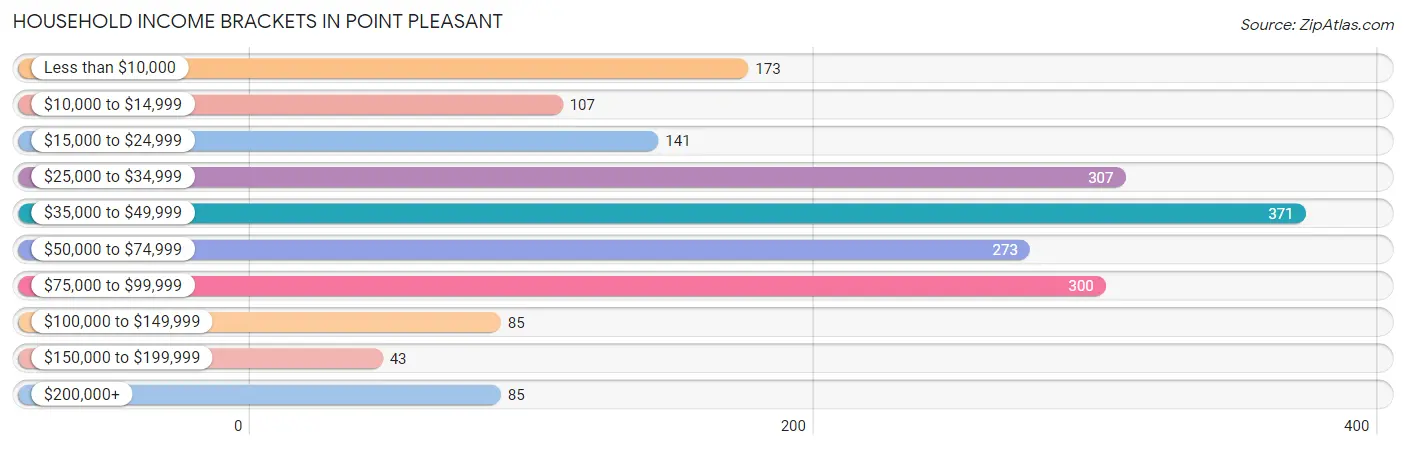
| Income Bracket | # Households | % Households |
| Less than $10,000 | 173 | 9.2% |
| $10,000 to $14,999 | 107 | 5.7% |
| $15,000 to $24,999 | 141 | 7.5% |
| $25,000 to $34,999 | 307 | 16.3% |
| $35,000 to $49,999 | 371 | 19.7% |
| $50,000 to $74,999 | 273 | 14.5% |
| $75,000 to $99,999 | 300 | 15.9% |
| $100,000 to $149,999 | 85 | 4.5% |
| $150,000 to $199,999 | 43 | 2.3% |
| $200,000+ | 85 | 4.5% |
Household Income by Householder Age in Point Pleasant
The median household income in Point Pleasant is $45,996, with the highest median household income of $57,785 found in the 45 to 64 years age bracket for the primary householder. A total of 738 households (39.2%) fall into this category. Meanwhile, the 15 to 24 years age bracket for the primary householder has the lowest median household income of $0, with 69 households (3.7%) in this group.
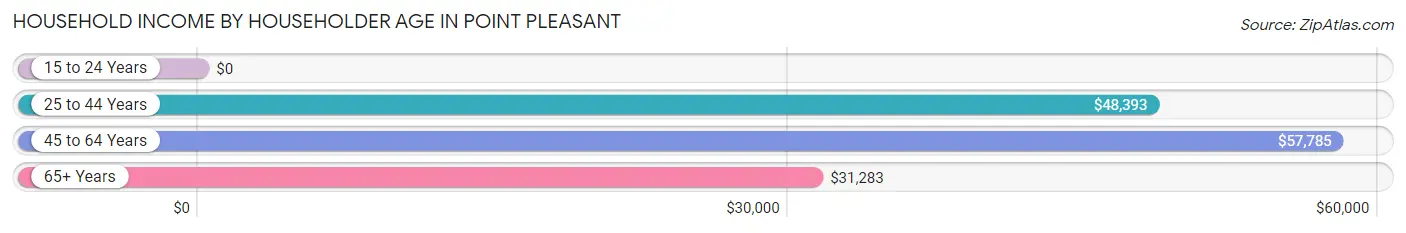
| Income Bracket | # Households | Median Income |
| 15 to 24 Years | 69 (3.7%) | $0 |
| 25 to 44 Years | 380 (20.2%) | $48,393 |
| 45 to 64 Years | 738 (39.2%) | $57,785 |
| 65+ Years | 698 (37.0%) | $31,283 |
| Total | 1,885 (100.0%) | $45,996 |
Poverty in Point Pleasant
Income Below Poverty by Sex and Age in Point Pleasant
With 17.4% poverty level for males and 20.0% for females among the residents of Point Pleasant, 16 and 17 year old males and 25 to 34 year old females are the most vulnerable to poverty, with 8 males (100.0%) and 103 females (51.2%) in their respective age groups living below the poverty level.
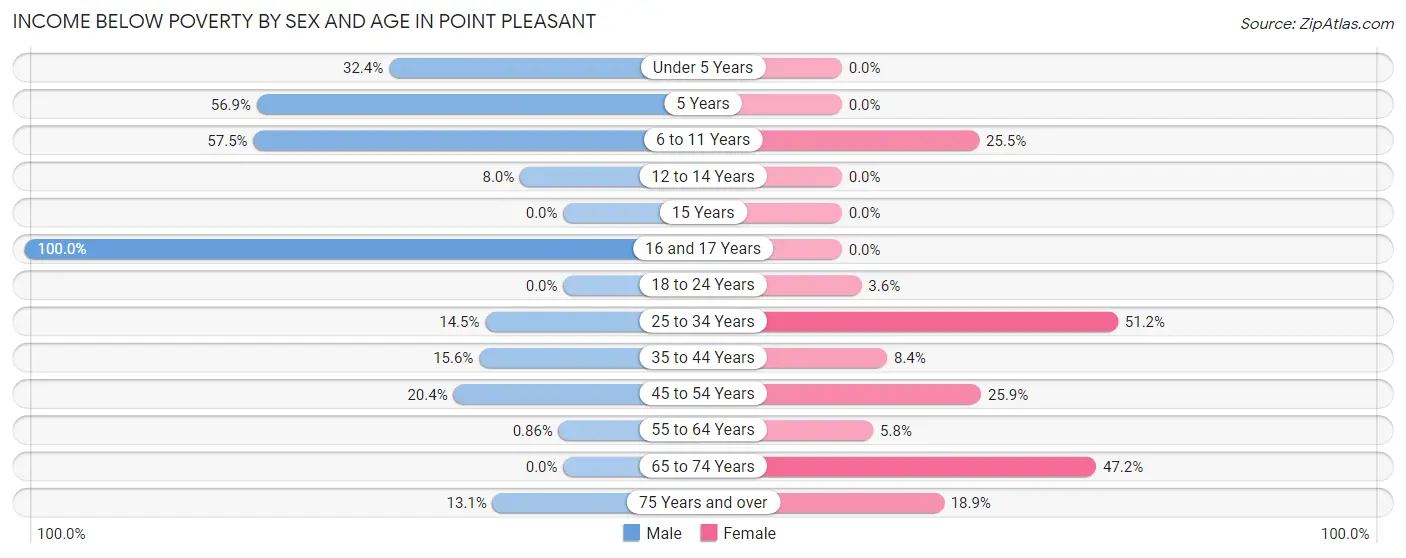
| Age Bracket | Male | Female |
| Under 5 Years | 99 (32.4%) | 0 (0.0%) |
| 5 Years | 33 (56.9%) | 0 (0.0%) |
| 6 to 11 Years | 84 (57.5%) | 13 (25.5%) |
| 12 to 14 Years | 11 (8.0%) | 0 (0.0%) |
| 15 Years | 0 (0.0%) | 0 (0.0%) |
| 16 and 17 Years | 8 (100.0%) | 0 (0.0%) |
| 18 to 24 Years | 0 (0.0%) | 4 (3.6%) |
| 25 to 34 Years | 30 (14.5%) | 103 (51.2%) |
| 35 to 44 Years | 35 (15.6%) | 26 (8.4%) |
| 45 to 54 Years | 21 (20.4%) | 53 (25.9%) |
| 55 to 64 Years | 4 (0.9%) | 22 (5.8%) |
| 65 to 74 Years | 0 (0.0%) | 118 (47.2%) |
| 75 Years and over | 26 (13.1%) | 52 (18.9%) |
| Total | 351 (17.4%) | 391 (20.0%) |
Income Above Poverty by Sex and Age in Point Pleasant
According to the poverty statistics in Point Pleasant, males aged 18 to 24 years and females aged under 5 years are the age groups that are most secure financially, with 100.0% of males and 100.0% of females in these age groups living above the poverty line.
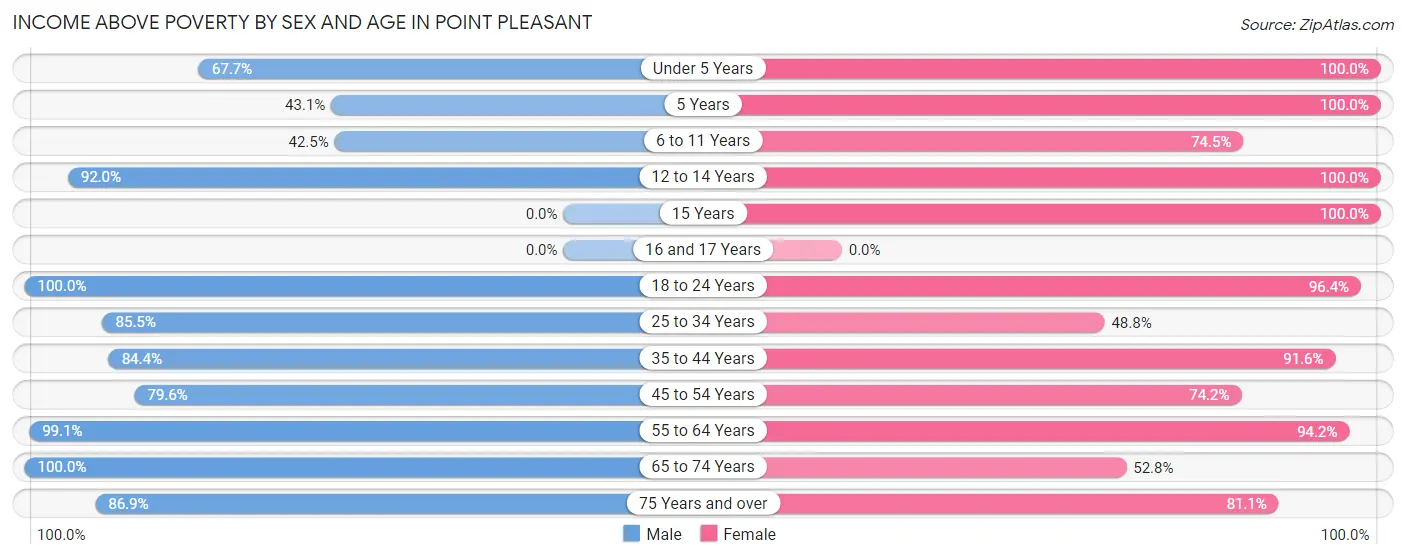
| Age Bracket | Male | Female |
| Under 5 Years | 207 (67.6%) | 57 (100.0%) |
| 5 Years | 25 (43.1%) | 28 (100.0%) |
| 6 to 11 Years | 62 (42.5%) | 38 (74.5%) |
| 12 to 14 Years | 126 (92.0%) | 82 (100.0%) |
| 15 Years | 0 (0.0%) | 9 (100.0%) |
| 16 and 17 Years | 0 (0.0%) | 0 (0.0%) |
| 18 to 24 Years | 28 (100.0%) | 106 (96.4%) |
| 25 to 34 Years | 177 (85.5%) | 98 (48.8%) |
| 35 to 44 Years | 189 (84.4%) | 284 (91.6%) |
| 45 to 54 Years | 82 (79.6%) | 152 (74.2%) |
| 55 to 64 Years | 461 (99.1%) | 356 (94.2%) |
| 65 to 74 Years | 142 (100.0%) | 132 (52.8%) |
| 75 Years and over | 172 (86.9%) | 223 (81.1%) |
| Total | 1,671 (82.6%) | 1,565 (80.0%) |
Income Below Poverty Among Married-Couple Families in Point Pleasant
The poverty statistics for married-couple families in Point Pleasant show that 5.3% or 39 of the total 735 families live below the poverty line. Families with 3 or 4 children have the highest poverty rate of 38.0%, comprising of 30 families. On the other hand, families with no children have the lowest poverty rate of 0.0%, which includes 0 families.
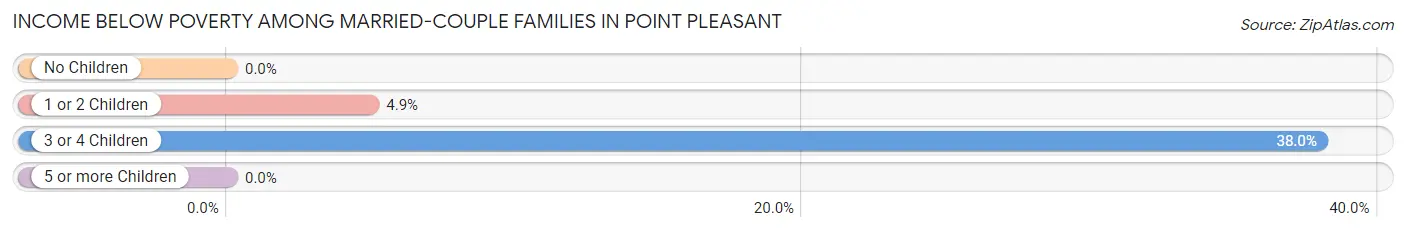
| Children | Above Poverty | Below Poverty |
| No Children | 473 (100.0%) | 0 (0.0%) |
| 1 or 2 Children | 174 (95.1%) | 9 (4.9%) |
| 3 or 4 Children | 49 (62.0%) | 30 (38.0%) |
| 5 or more Children | 0 (0.0%) | 0 (0.0%) |
| Total | 696 (94.7%) | 39 (5.3%) |
Income Below Poverty Among Single-Parent Households in Point Pleasant
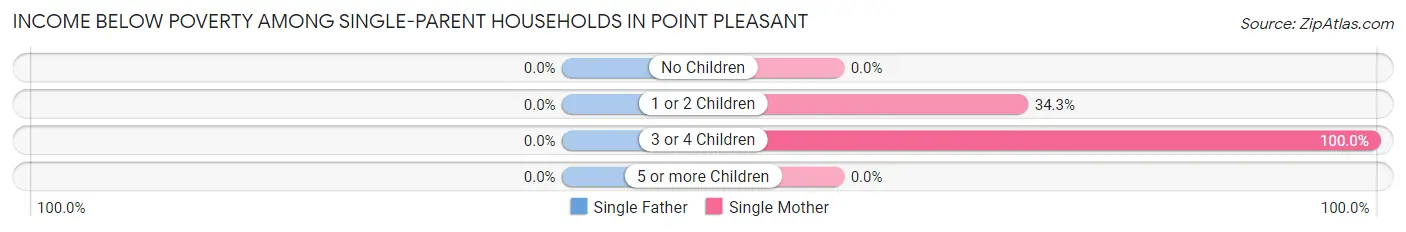
| Children | Single Father | Single Mother |
| No Children | 0 (0.0%) | 0 (0.0%) |
| 1 or 2 Children | 0 (0.0%) | 12 (34.3%) |
| 3 or 4 Children | 0 (0.0%) | 2 (100.0%) |
| 5 or more Children | 0 (0.0%) | 0 (0.0%) |
| Total | 0 (0.0%) | 14 (14.3%) |
Income Below Poverty Among Married-Couple vs Single-Parent Households in Point Pleasant
The poverty data for Point Pleasant shows that 39 of the married-couple family households (5.3%) and 14 of the single-parent households (7.7%) are living below the poverty level. Within the married-couple family households, those with 3 or 4 children have the highest poverty rate, with 30 households (38.0%) falling below the poverty line. Among the single-parent households, those with 3 or 4 children have the highest poverty rate, with 2 household (100.0%) living below poverty.
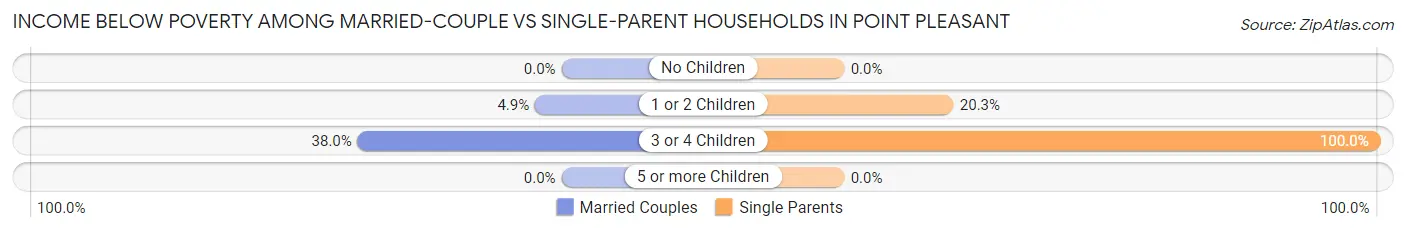
| Children | Married-Couple Families | Single-Parent Households |
| No Children | 0 (0.0%) | 0 (0.0%) |
| 1 or 2 Children | 9 (4.9%) | 12 (20.3%) |
| 3 or 4 Children | 30 (38.0%) | 2 (100.0%) |
| 5 or more Children | 0 (0.0%) | 0 (0.0%) |
| Total | 39 (5.3%) | 14 (7.7%) |
Race in Point Pleasant
The most populous races in Point Pleasant are White / Caucasian (3,880 | 95.4%), Two or more Races (77 | 1.9%), and Some other Race (75 | 1.8%).
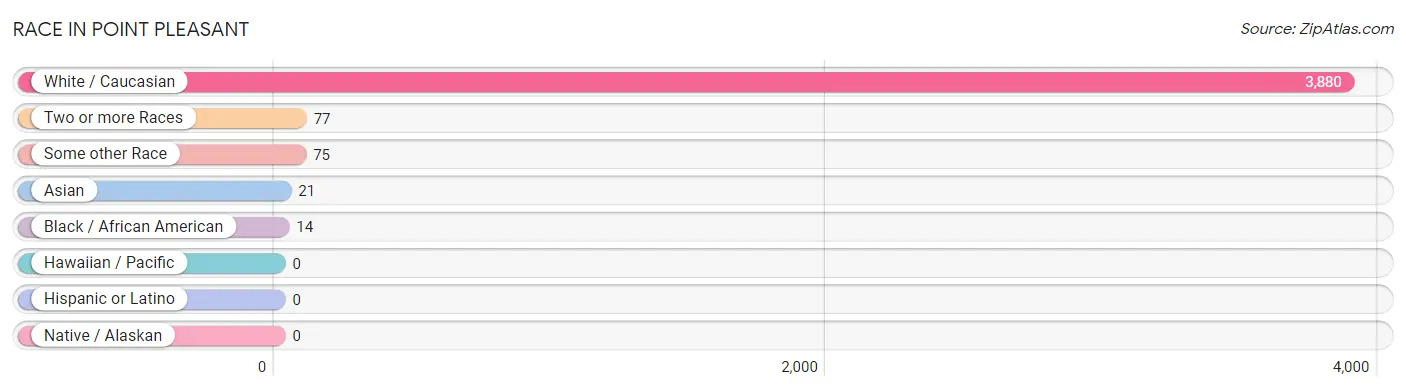
| Race | # Population | % Population |
| Asian | 21 | 0.5% |
| Black / African American | 14 | 0.3% |
| Hawaiian / Pacific | 0 | 0.0% |
| Hispanic or Latino | 0 | 0.0% |
| Native / Alaskan | 0 | 0.0% |
| White / Caucasian | 3,880 | 95.4% |
| Two or more Races | 77 | 1.9% |
| Some other Race | 75 | 1.8% |
| Total | 4,067 | 100.0% |
Ancestry in Point Pleasant
The most populous ancestries reported in Point Pleasant are English (556 | 13.7%), German (493 | 12.1%), Irish (485 | 11.9%), American (271 | 6.7%), and Italian (214 | 5.3%), together accounting for 49.6% of all Point Pleasant residents.
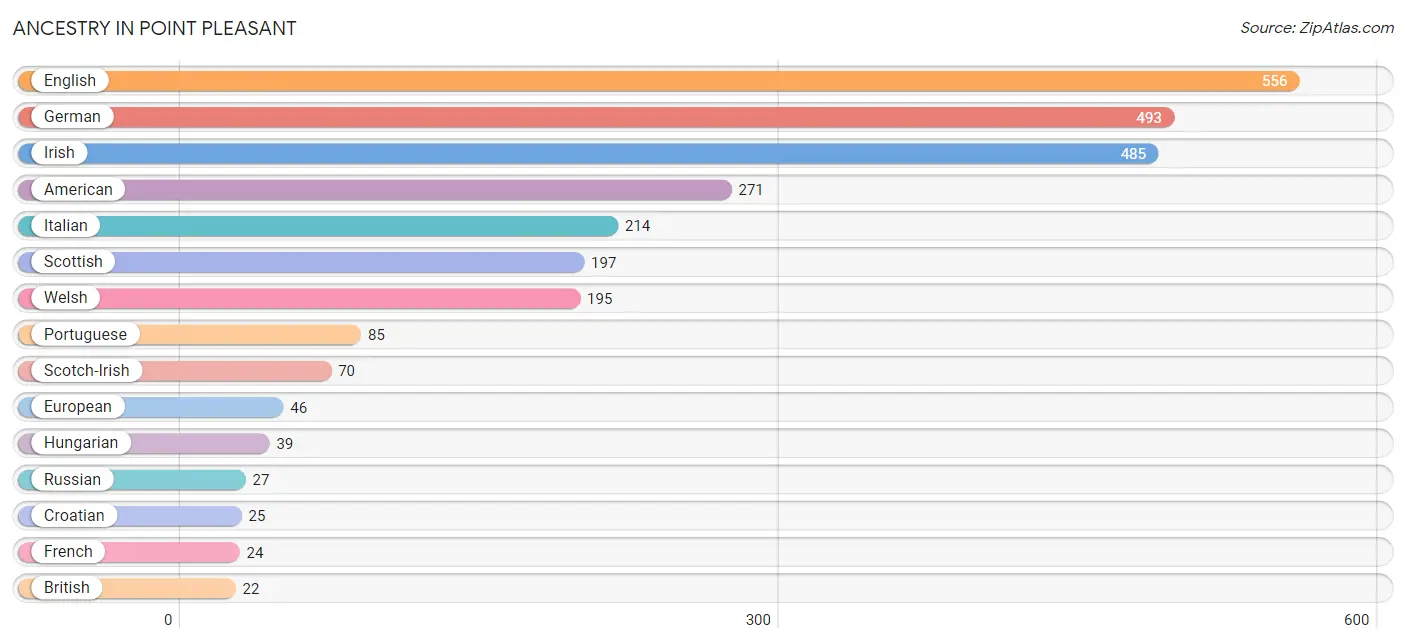
| Ancestry | # Population | % Population |
| American | 271 | 6.7% |
| British | 22 | 0.5% |
| Croatian | 25 | 0.6% |
| Czech | 1 | 0.0% |
| Eastern European | 21 | 0.5% |
| English | 556 | 13.7% |
| European | 46 | 1.1% |
| French | 24 | 0.6% |
| German | 493 | 12.1% |
| Hungarian | 39 | 1.0% |
| Indian (Asian) | 16 | 0.4% |
| Irish | 485 | 11.9% |
| Italian | 214 | 5.3% |
| Jamaican | 1 | 0.0% |
| Polish | 20 | 0.5% |
| Portuguese | 85 | 2.1% |
| Russian | 27 | 0.7% |
| Scotch-Irish | 70 | 1.7% |
| Scottish | 197 | 4.8% |
| Sri Lankan | 5 | 0.1% |
| Welsh | 195 | 4.8% | View All 21 Rows |
Immigrants in Point Pleasant
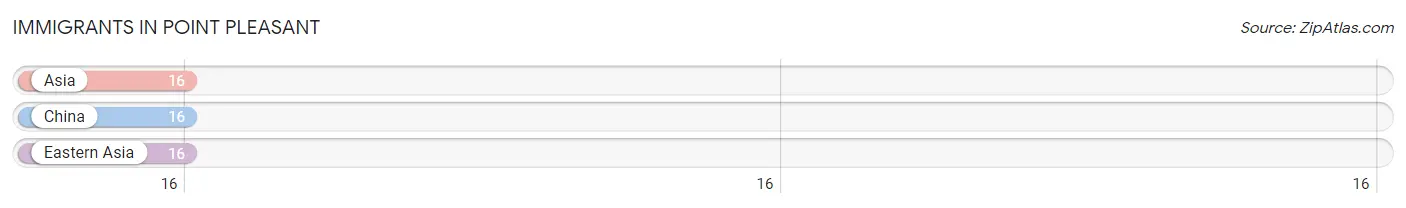
The most numerous immigrant groups reported in Point Pleasant came from Asia (16 | 0.4%), China (16 | 0.4%), and Eastern Asia (16 | 0.4%), together accounting for 1.2% of all Point Pleasant residents.
| Immigration Origin | # Population | % Population |
| Asia | 16 | 0.4% |
| China | 16 | 0.4% |
| Eastern Asia | 16 | 0.4% | View All 3 Rows |
Sex and Age in Point Pleasant
Sex and Age in Point Pleasant
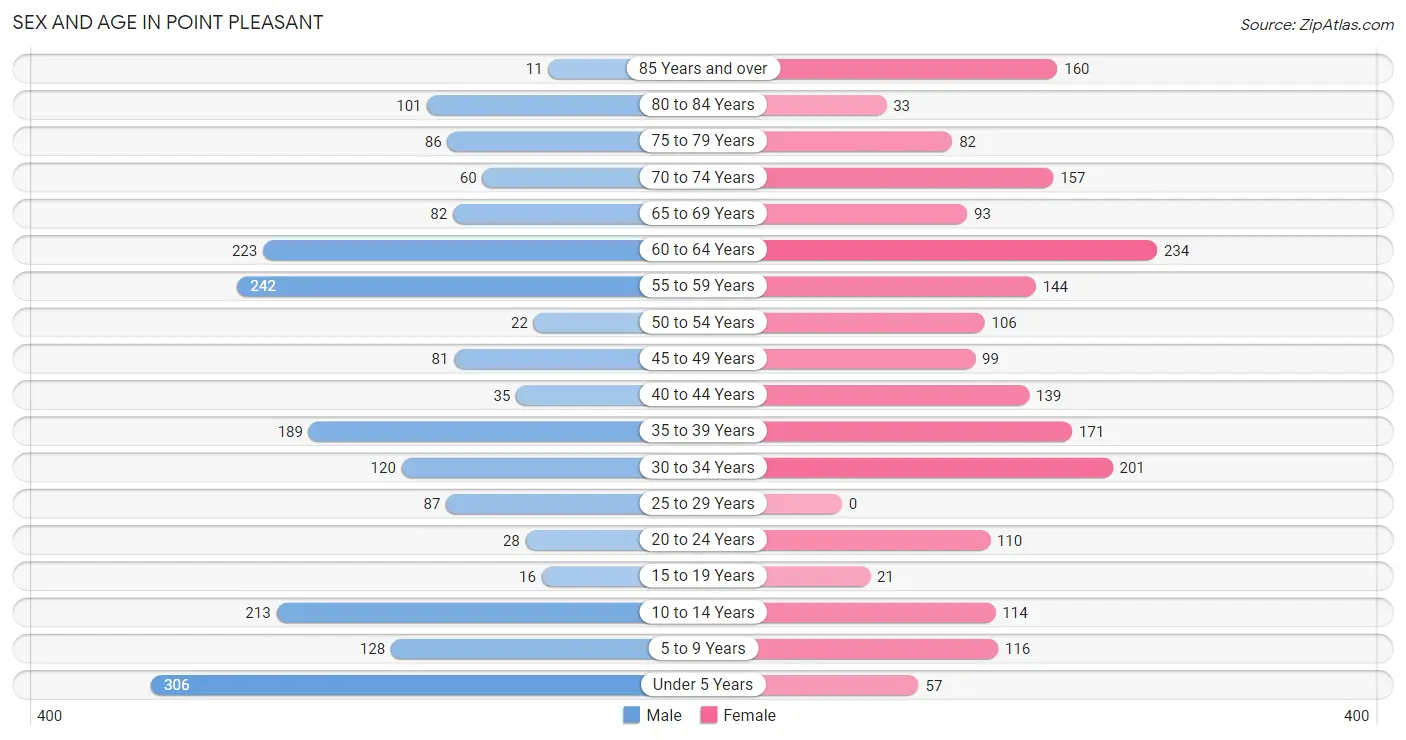
The most populous age groups in Point Pleasant are Under 5 Years (306 | 15.1%) for men and 60 to 64 Years (234 | 11.5%) for women.
| Age Bracket | Male | Female |
| Under 5 Years | 306 (15.1%) | 57 (2.8%) |
| 5 to 9 Years | 128 (6.3%) | 116 (5.7%) |
| 10 to 14 Years | 213 (10.5%) | 114 (5.6%) |
| 15 to 19 Years | 16 (0.8%) | 21 (1.0%) |
| 20 to 24 Years | 28 (1.4%) | 110 (5.4%) |
| 25 to 29 Years | 87 (4.3%) | 0 (0.0%) |
| 30 to 34 Years | 120 (5.9%) | 201 (9.9%) |
| 35 to 39 Years | 189 (9.3%) | 171 (8.4%) |
| 40 to 44 Years | 35 (1.7%) | 139 (6.8%) |
| 45 to 49 Years | 81 (4.0%) | 99 (4.9%) |
| 50 to 54 Years | 22 (1.1%) | 106 (5.2%) |
| 55 to 59 Years | 242 (11.9%) | 144 (7.1%) |
| 60 to 64 Years | 223 (11.0%) | 234 (11.5%) |
| 65 to 69 Years | 82 (4.0%) | 93 (4.6%) |
| 70 to 74 Years | 60 (3.0%) | 157 (7.7%) |
| 75 to 79 Years | 86 (4.2%) | 82 (4.0%) |
| 80 to 84 Years | 101 (5.0%) | 33 (1.6%) |
| 85 Years and over | 11 (0.5%) | 160 (7.9%) |
| Total | 2,030 (100.0%) | 2,037 (100.0%) |
Families and Households in Point Pleasant
Median Family Size in Point Pleasant
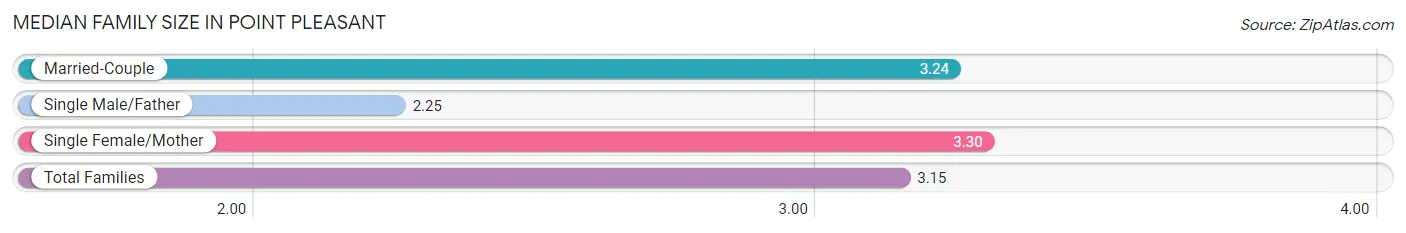
The median family size in Point Pleasant is 3.15 persons per family, with single female/mother families (98 | 10.7%) accounting for the largest median family size of 3.3 persons per family. On the other hand, single male/father families (83 | 9.1%) represent the smallest median family size with 2.25 persons per family.
| Family Type | # Families | Family Size |
| Married-Couple | 735 (80.2%) | 3.24 |
| Single Male/Father | 83 (9.1%) | 2.25 |
| Single Female/Mother | 98 (10.7%) | 3.30 |
| Total Families | 916 (100.0%) | 3.15 |
Median Household Size in Point Pleasant
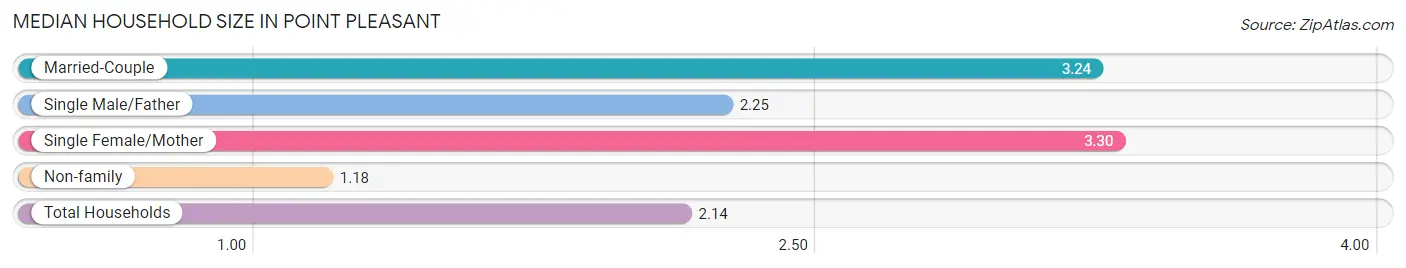
The median household size in Point Pleasant is 2.14 persons per household, with single female/mother households (98 | 5.2%) accounting for the largest median household size of 3.3 persons per household. non-family households (969 | 51.4%) represent the smallest median household size with 1.18 persons per household.
| Household Type | # Households | Household Size |
| Married-Couple | 735 (39.0%) | 3.24 |
| Single Male/Father | 83 (4.4%) | 2.25 |
| Single Female/Mother | 98 (5.2%) | 3.30 |
| Non-family | 969 (51.4%) | 1.18 |
| Total Households | 1,885 (100.0%) | 2.14 |
Household Size by Marriage Status in Point Pleasant
Out of a total of 1,885 households in Point Pleasant, 916 (48.6%) are family households, while 969 (51.4%) are nonfamily households. The most numerous type of family households are 2-person households, comprising 594, and the most common type of nonfamily households are 1-person households, comprising 890.
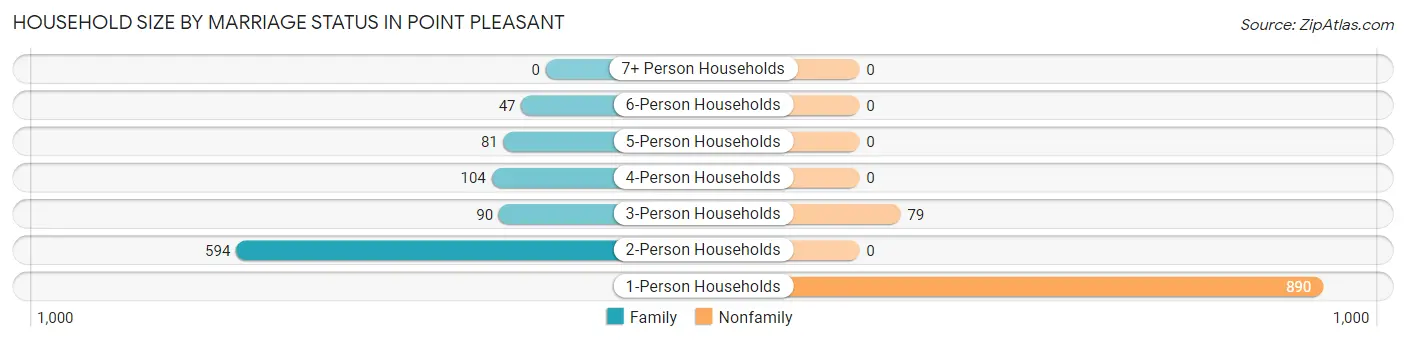
| Household Size | Family Households | Nonfamily Households |
| 1-Person Households | - | 890 (47.2%) |
| 2-Person Households | 594 (31.5%) | 0 (0.0%) |
| 3-Person Households | 90 (4.8%) | 79 (4.2%) |
| 4-Person Households | 104 (5.5%) | 0 (0.0%) |
| 5-Person Households | 81 (4.3%) | 0 (0.0%) |
| 6-Person Households | 47 (2.5%) | 0 (0.0%) |
| 7+ Person Households | 0 (0.0%) | 0 (0.0%) |
| Total | 916 (48.6%) | 969 (51.4%) |
Female Fertility in Point Pleasant
Fertility by Age in Point Pleasant
Average fertility rate in Point Pleasant is 105.0 births per 1,000 women. Women in the age bracket of 20 to 34 years have the highest fertility rate with 251.0 births per 1,000 women. Women in the age bracket of 20 to 34 years acount for 100.0% of all women with births.
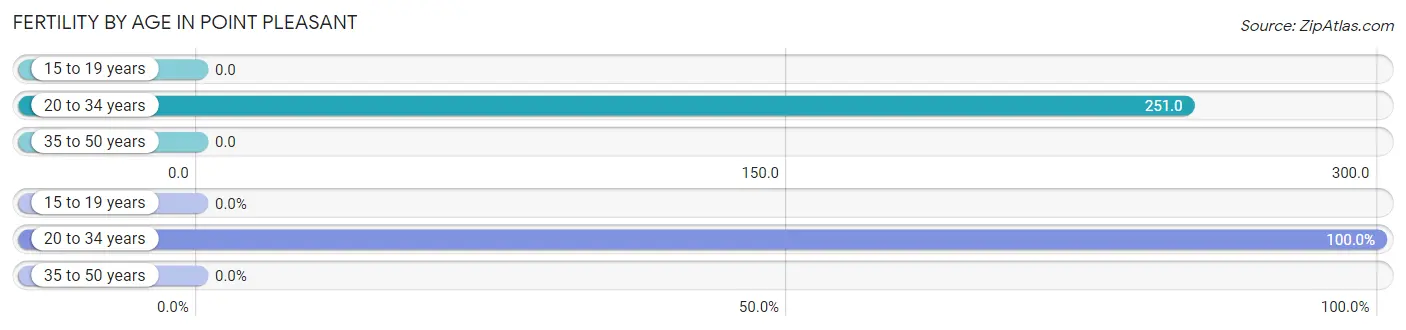
| Age Bracket | Women with Births | Births / 1,000 Women |
| 15 to 19 years | 0 (0.0%) | 0.0 |
| 20 to 34 years | 78 (100.0%) | 251.0 |
| 35 to 50 years | 0 (0.0%) | 0.0 |
| Total | 78 (100.0%) | 105.0 |
Fertility by Age by Marriage Status in Point Pleasant
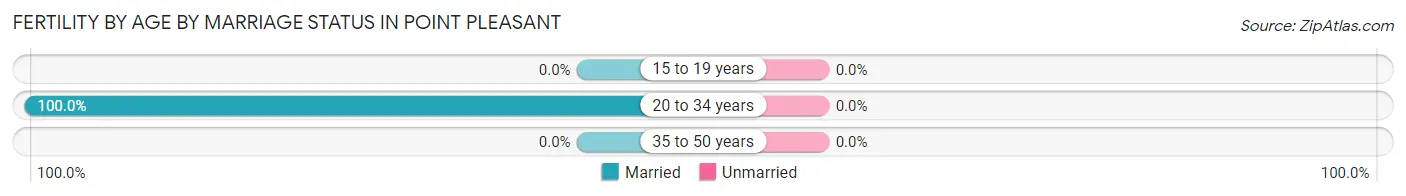
| Age Bracket | Married | Unmarried |
| 15 to 19 years | 0 (0.0%) | 0 (0.0%) |
| 20 to 34 years | 78 (100.0%) | 0 (0.0%) |
| 35 to 50 years | 0 (0.0%) | 0 (0.0%) |
| Total | 78 (100.0%) | 0 (0.0%) |
Fertility by Education in Point Pleasant
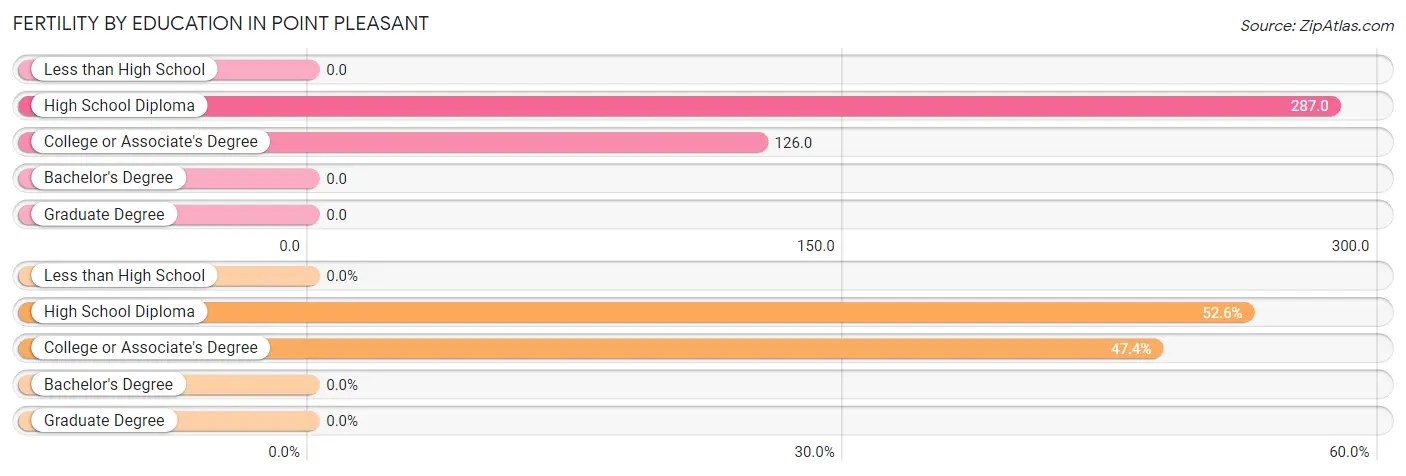
| Educational Attainment | Women with Births | Births / 1,000 Women |
| Less than High School | 0 (0.0%) | 0.0 |
| High School Diploma | 41 (52.6%) | 287.0 |
| College or Associate's Degree | 37 (47.4%) | 126.0 |
| Bachelor's Degree | 0 (0.0%) | 0.0 |
| Graduate Degree | 0 (0.0%) | 0.0 |
| Total | 78 (100.0%) | 105.0 |
Fertility by Education by Marriage Status in Point Pleasant
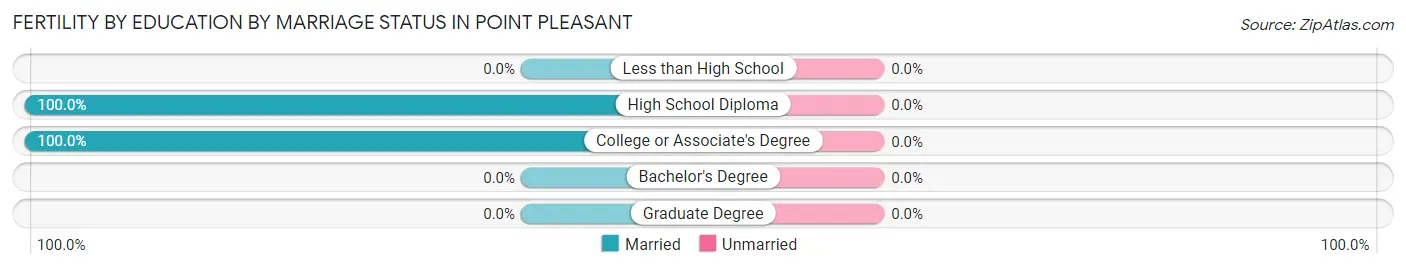
| Educational Attainment | Married | Unmarried |
| Less than High School | 0 (0.0%) | 0 (0.0%) |
| High School Diploma | 41 (100.0%) | 0 (0.0%) |
| College or Associate's Degree | 37 (100.0%) | 0 (0.0%) |
| Bachelor's Degree | 0 (0.0%) | 0 (0.0%) |
| Graduate Degree | 0 (0.0%) | 0 (0.0%) |
| Total | 78 (100.0%) | 0 (0.0%) |
Employment Characteristics in Point Pleasant
Employment by Class of Employer in Point Pleasant
Among the 1,344 employed individuals in Point Pleasant, private company employees (919 | 68.4%), state government employees (168 | 12.5%), and local government employees (94 | 7.0%) make up the most common classes of employment.
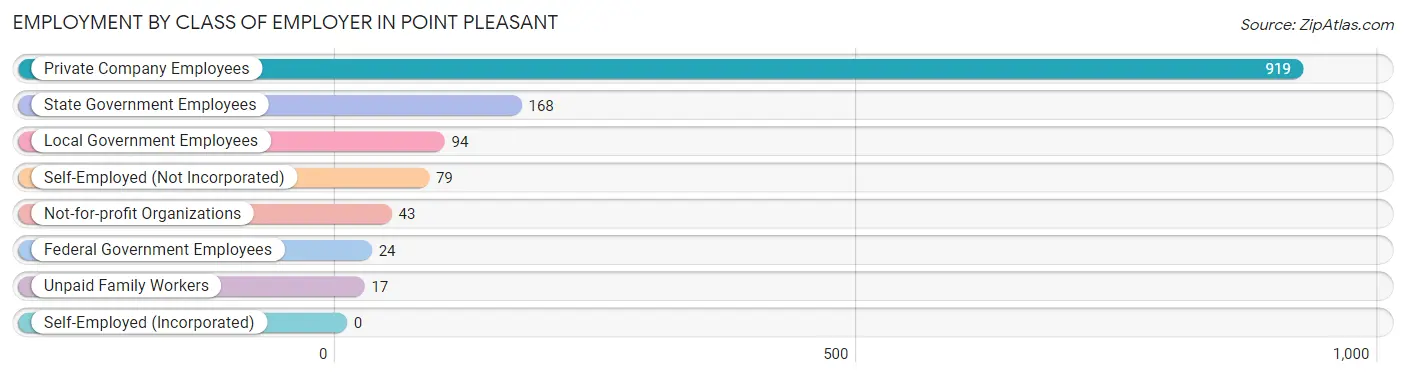
| Employer Class | # Employees | % Employees |
| Private Company Employees | 919 | 68.4% |
| Self-Employed (Incorporated) | 0 | 0.0% |
| Self-Employed (Not Incorporated) | 79 | 5.9% |
| Not-for-profit Organizations | 43 | 3.2% |
| Local Government Employees | 94 | 7.0% |
| State Government Employees | 168 | 12.5% |
| Federal Government Employees | 24 | 1.8% |
| Unpaid Family Workers | 17 | 1.3% |
| Total | 1,344 | 100.0% |
Employment Status by Age in Point Pleasant
According to the labor force statistics for Point Pleasant, out of the total population over 16 years of age (3,124), 49.9% or 1,559 individuals are in the labor force, with 3.3% or 51 of them unemployed. The age group with the highest labor force participation rate is 55 to 59 years, with 81.6% or 315 individuals in the labor force. Within the labor force, the 55 to 59 years age range has the highest percentage of unemployed individuals, with 8.6% or 27 of them being unemployed.
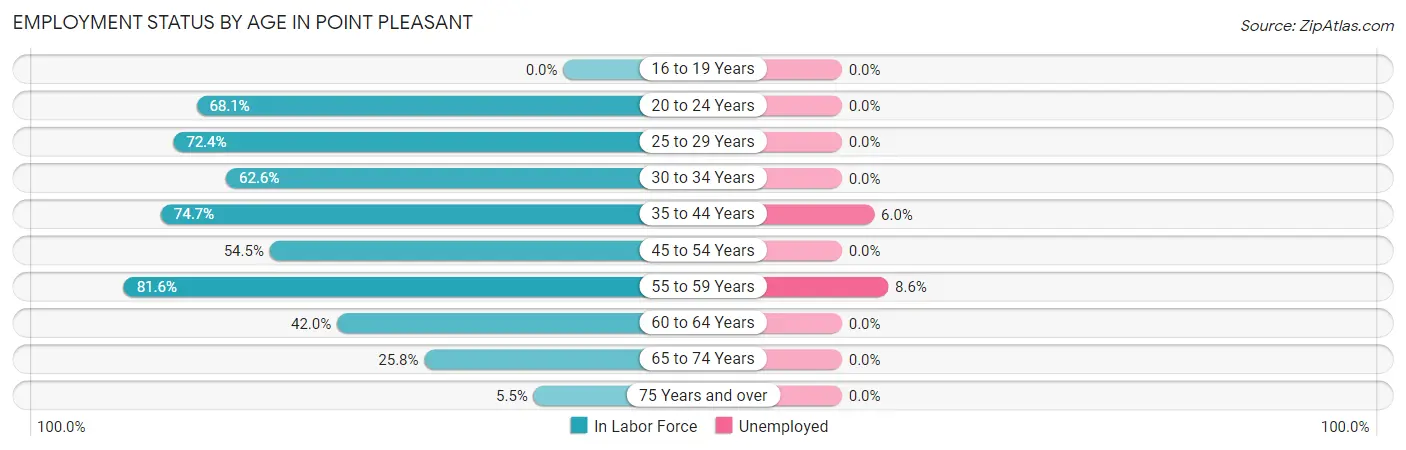
| Age Bracket | In Labor Force | Unemployed |
| 16 to 19 Years | 0 (0.0%) | 0 (0.0%) |
| 20 to 24 Years | 94 (68.1%) | 0 (0.0%) |
| 25 to 29 Years | 63 (72.4%) | 0 (0.0%) |
| 30 to 34 Years | 201 (62.6%) | 0 (0.0%) |
| 35 to 44 Years | 399 (74.7%) | 24 (6.0%) |
| 45 to 54 Years | 168 (54.5%) | 0 (0.0%) |
| 55 to 59 Years | 315 (81.6%) | 27 (8.6%) |
| 60 to 64 Years | 192 (42.0%) | 0 (0.0%) |
| 65 to 74 Years | 101 (25.8%) | 0 (0.0%) |
| 75 Years and over | 26 (5.5%) | 0 (0.0%) |
| Total | 1,559 (49.9%) | 51 (3.3%) |
Employment Status by Educational Attainment in Point Pleasant
According to labor force statistics for Point Pleasant, 63.9% of individuals (1,337) out of the total population between 25 and 64 years of age (2,093) are in the labor force, with 3.8% or 51 of them being unemployed. The group with the highest labor force participation rate are those with the educational attainment of less than high school, with 69.9% or 153 individuals in the labor force. Within the labor force, individuals with high school diploma education have the highest percentage of unemployment, with 13.3% or 51 of them being unemployed.
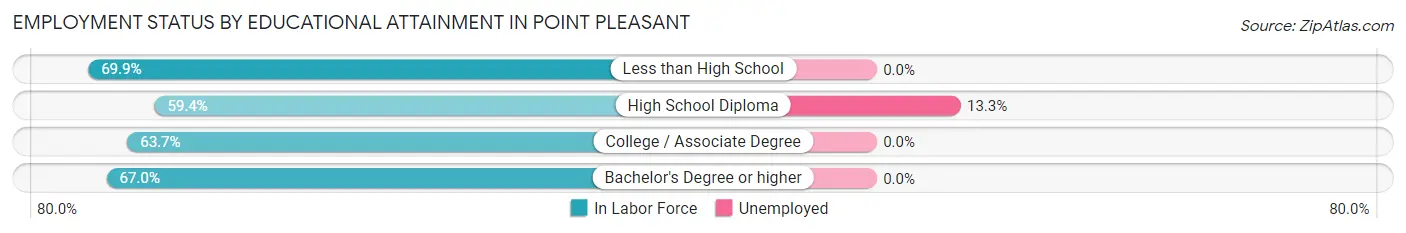
| Educational Attainment | In Labor Force | Unemployed |
| Less than High School | 153 (69.9%) | 0 (0.0%) |
| High School Diploma | 383 (59.4%) | 86 (13.3%) |
| College / Associate Degree | 414 (63.7%) | 0 (0.0%) |
| Bachelor's Degree or higher | 388 (67.0%) | 0 (0.0%) |
| Total | 1,337 (63.9%) | 80 (3.8%) |
Employment Occupations by Sex in Point Pleasant
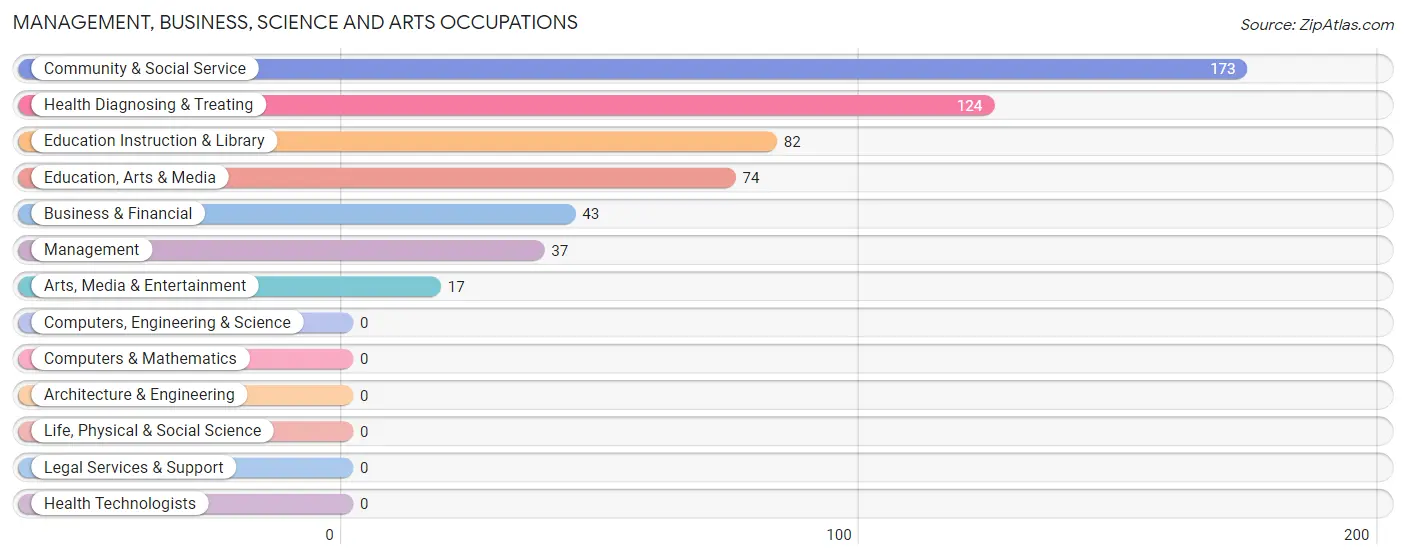
Management, Business, Science and Arts Occupations
The most common Management, Business, Science and Arts occupations in Point Pleasant are Community & Social Service (173 | 11.5%), Health Diagnosing & Treating (124 | 8.2%), Education Instruction & Library (82 | 5.4%), Education, Arts & Media (74 | 4.9%), and Business & Financial (43 | 2.9%).
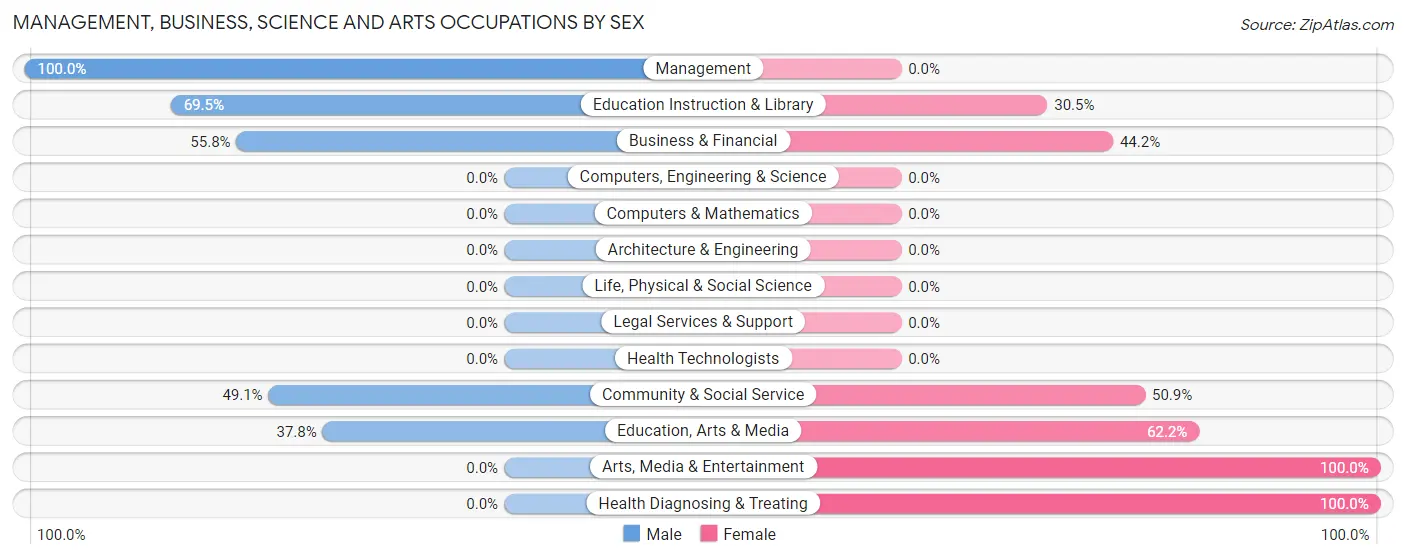
Management, Business, Science and Arts Occupations by Sex
Within the Management, Business, Science and Arts occupations in Point Pleasant, the most male-oriented occupations are Management (100.0%), Education Instruction & Library (69.5%), and Business & Financial (55.8%), while the most female-oriented occupations are Arts, Media & Entertainment (100.0%), Health Diagnosing & Treating (100.0%), and Education, Arts & Media (62.2%).
| Occupation | Male | Female |
| Management | 37 (100.0%) | 0 (0.0%) |
| Business & Financial | 24 (55.8%) | 19 (44.2%) |
| Computers, Engineering & Science | 0 (0.0%) | 0 (0.0%) |
| Computers & Mathematics | 0 (0.0%) | 0 (0.0%) |
| Architecture & Engineering | 0 (0.0%) | 0 (0.0%) |
| Life, Physical & Social Science | 0 (0.0%) | 0 (0.0%) |
| Community & Social Service | 85 (49.1%) | 88 (50.9%) |
| Education, Arts & Media | 28 (37.8%) | 46 (62.2%) |
| Legal Services & Support | 0 (0.0%) | 0 (0.0%) |
| Education Instruction & Library | 57 (69.5%) | 25 (30.5%) |
| Arts, Media & Entertainment | 0 (0.0%) | 17 (100.0%) |
| Health Diagnosing & Treating | 0 (0.0%) | 124 (100.0%) |
| Health Technologists | 0 (0.0%) | 0 (0.0%) |
| Total (Category) | 146 (38.7%) | 231 (61.3%) |
| Total (Overall) | 834 (55.3%) | 674 (44.7%) |
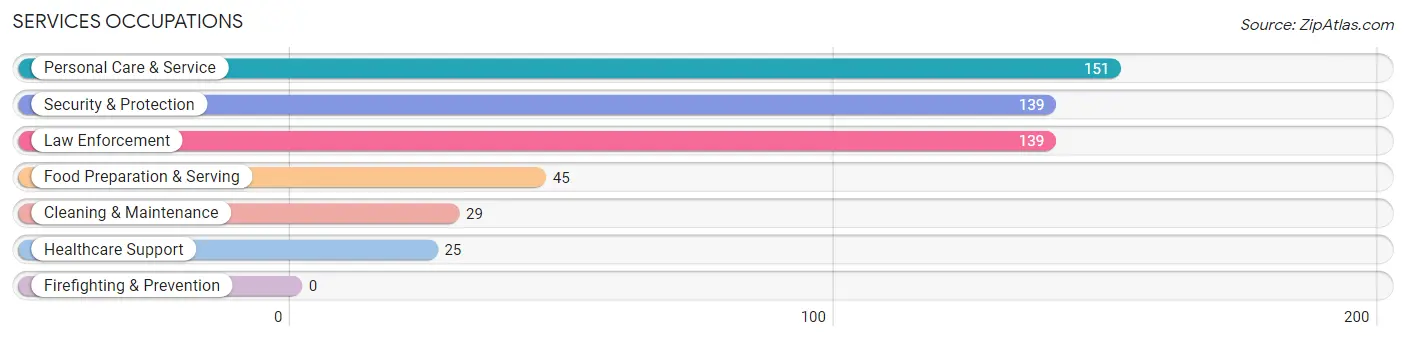
Services Occupations
The most common Services occupations in Point Pleasant are Personal Care & Service (151 | 10.0%), Security & Protection (139 | 9.2%), Law Enforcement (139 | 9.2%), Food Preparation & Serving (45 | 3.0%), and Cleaning & Maintenance (29 | 1.9%).
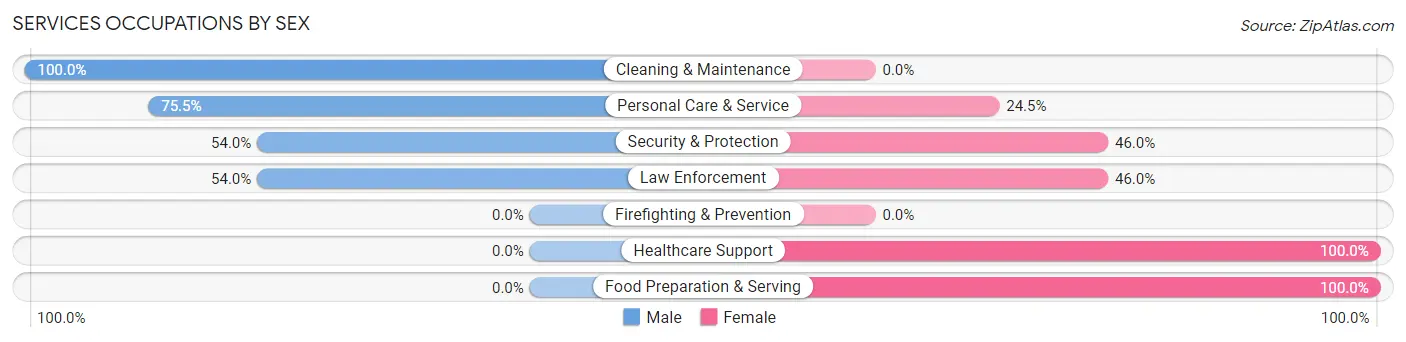
Services Occupations by Sex
Within the Services occupations in Point Pleasant, the most male-oriented occupations are Cleaning & Maintenance (100.0%), Personal Care & Service (75.5%), and Security & Protection (54.0%), while the most female-oriented occupations are Healthcare Support (100.0%), Food Preparation & Serving (100.0%), and Security & Protection (46.0%).
| Occupation | Male | Female |
| Healthcare Support | 0 (0.0%) | 25 (100.0%) |
| Security & Protection | 75 (54.0%) | 64 (46.0%) |
| Firefighting & Prevention | 0 (0.0%) | 0 (0.0%) |
| Law Enforcement | 75 (54.0%) | 64 (46.0%) |
| Food Preparation & Serving | 0 (0.0%) | 45 (100.0%) |
| Cleaning & Maintenance | 29 (100.0%) | 0 (0.0%) |
| Personal Care & Service | 114 (75.5%) | 37 (24.5%) |
| Total (Category) | 218 (56.0%) | 171 (44.0%) |
| Total (Overall) | 834 (55.3%) | 674 (44.7%) |
Sales and Office Occupations
The most common Sales and Office occupations in Point Pleasant are Sales & Related (397 | 26.3%), and Office & Administration (75 | 5.0%).
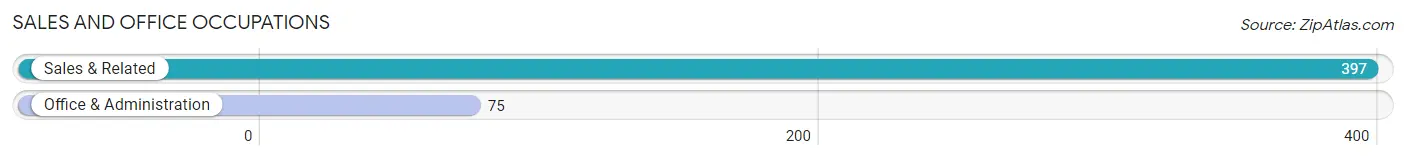
Sales and Office Occupations by Sex
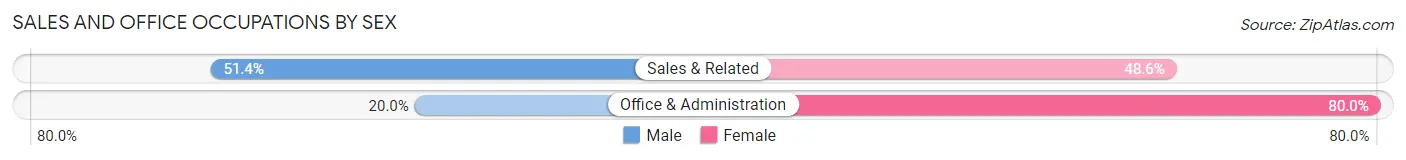
| Occupation | Male | Female |
| Sales & Related | 204 (51.4%) | 193 (48.6%) |
| Office & Administration | 15 (20.0%) | 60 (80.0%) |
| Total (Category) | 219 (46.4%) | 253 (53.6%) |
| Total (Overall) | 834 (55.3%) | 674 (44.7%) |
Natural Resources, Construction and Maintenance Occupations
The most common Natural Resources, Construction and Maintenance occupations in Point Pleasant are Construction & Extraction (97 | 6.4%), and Installation, Maintenance & Repair (90 | 6.0%).
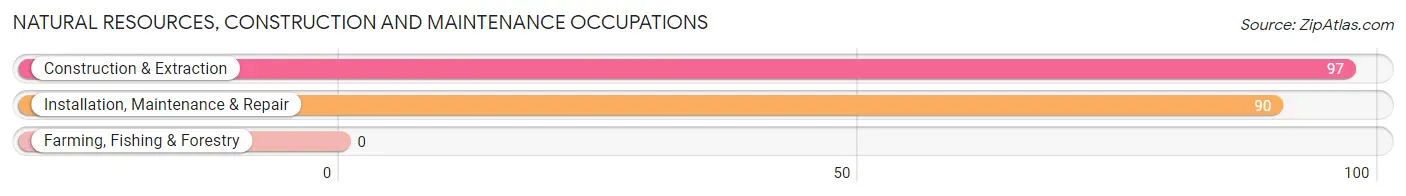
Natural Resources, Construction and Maintenance Occupations by Sex
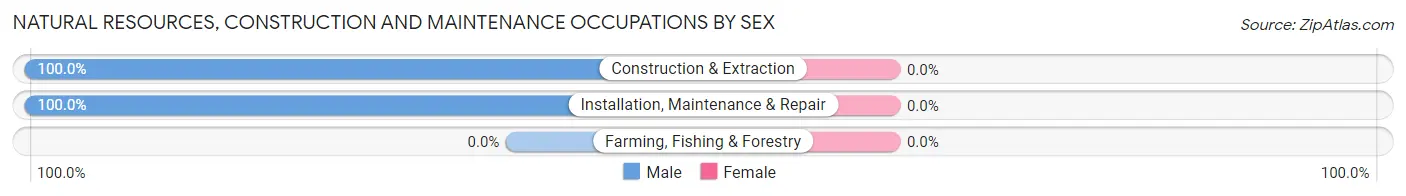
| Occupation | Male | Female |
| Farming, Fishing & Forestry | 0 (0.0%) | 0 (0.0%) |
| Construction & Extraction | 97 (100.0%) | 0 (0.0%) |
| Installation, Maintenance & Repair | 90 (100.0%) | 0 (0.0%) |
| Total (Category) | 187 (100.0%) | 0 (0.0%) |
| Total (Overall) | 834 (55.3%) | 674 (44.7%) |
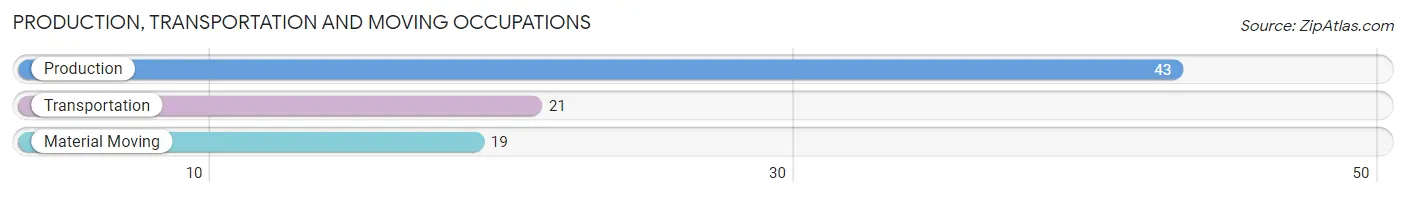
Production, Transportation and Moving Occupations
The most common Production, Transportation and Moving occupations in Point Pleasant are Production (43 | 2.9%), Transportation (21 | 1.4%), and Material Moving (19 | 1.3%).
Production, Transportation and Moving Occupations by Sex
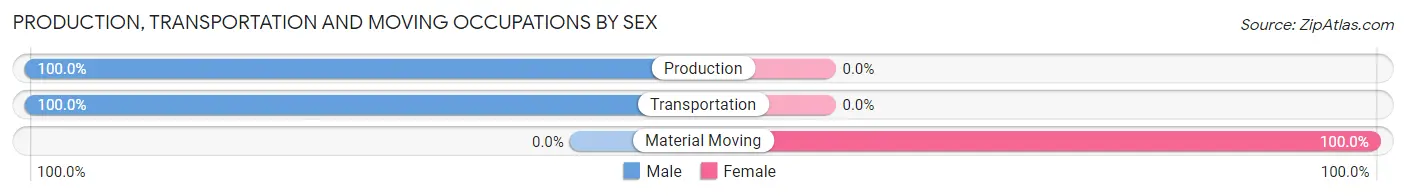
| Occupation | Male | Female |
| Production | 43 (100.0%) | 0 (0.0%) |
| Transportation | 21 (100.0%) | 0 (0.0%) |
| Material Moving | 0 (0.0%) | 19 (100.0%) |
| Total (Category) | 64 (77.1%) | 19 (22.9%) |
| Total (Overall) | 834 (55.3%) | 674 (44.7%) |
Employment Industries by Sex in Point Pleasant
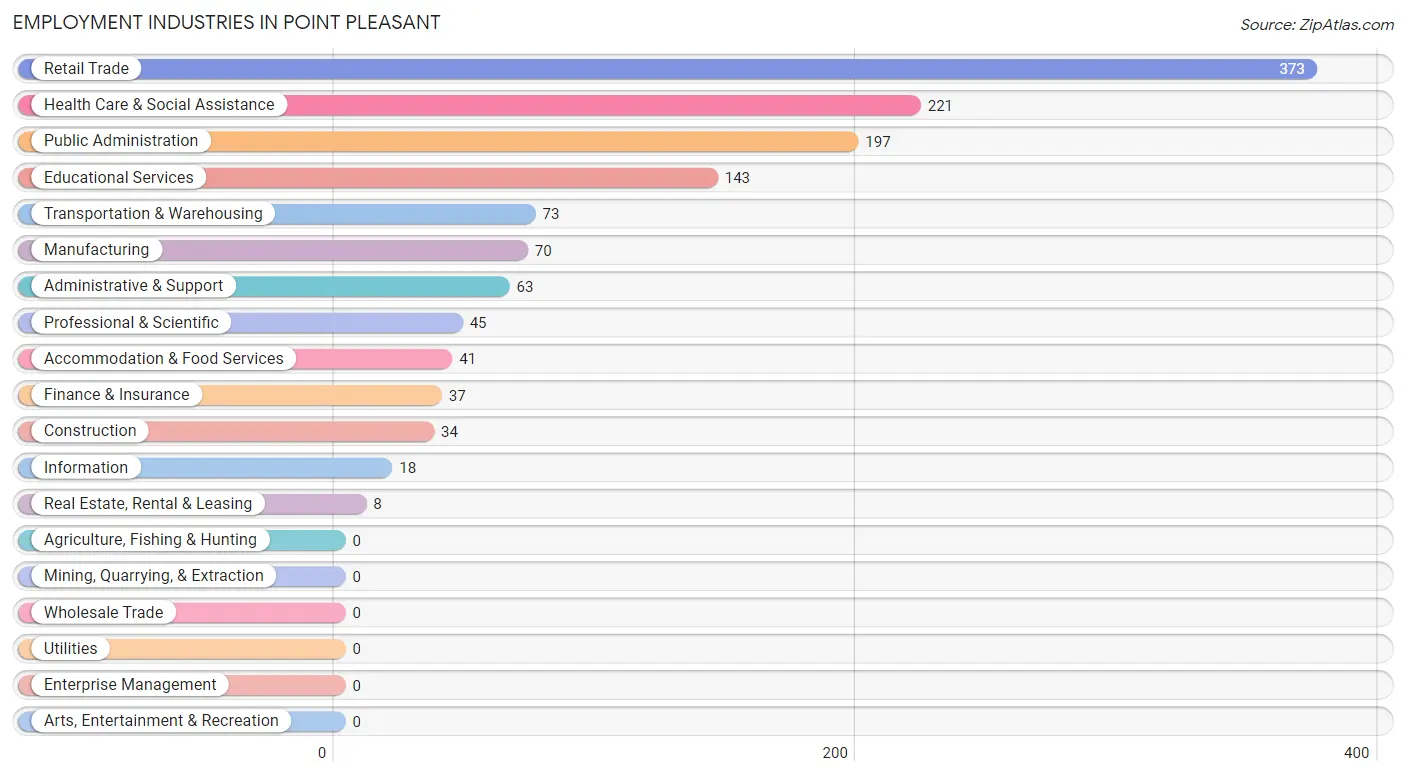
Employment Industries in Point Pleasant
The major employment industries in Point Pleasant include Retail Trade (373 | 24.7%), Health Care & Social Assistance (221 | 14.7%), Public Administration (197 | 13.1%), Educational Services (143 | 9.5%), and Transportation & Warehousing (73 | 4.8%).
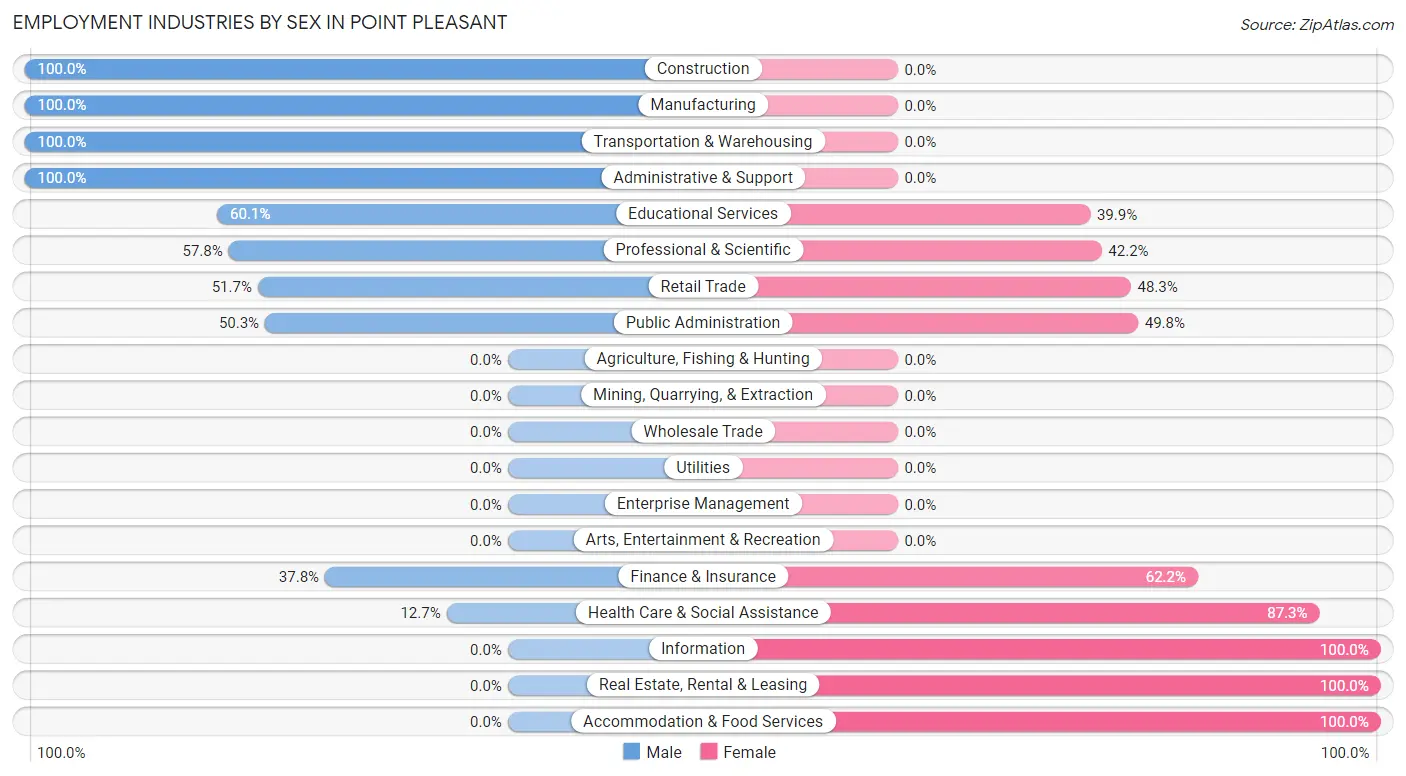
Employment Industries by Sex in Point Pleasant
The Point Pleasant industries that see more men than women are Construction (100.0%), Manufacturing (100.0%), and Transportation & Warehousing (100.0%), whereas the industries that tend to have a higher number of women are Information (100.0%), Real Estate, Rental & Leasing (100.0%), and Accommodation & Food Services (100.0%).
| Industry | Male | Female |
| Agriculture, Fishing & Hunting | 0 (0.0%) | 0 (0.0%) |
| Mining, Quarrying, & Extraction | 0 (0.0%) | 0 (0.0%) |
| Construction | 34 (100.0%) | 0 (0.0%) |
| Manufacturing | 70 (100.0%) | 0 (0.0%) |
| Wholesale Trade | 0 (0.0%) | 0 (0.0%) |
| Retail Trade | 193 (51.7%) | 180 (48.3%) |
| Transportation & Warehousing | 73 (100.0%) | 0 (0.0%) |
| Utilities | 0 (0.0%) | 0 (0.0%) |
| Information | 0 (0.0%) | 18 (100.0%) |
| Finance & Insurance | 14 (37.8%) | 23 (62.2%) |
| Real Estate, Rental & Leasing | 0 (0.0%) | 8 (100.0%) |
| Professional & Scientific | 26 (57.8%) | 19 (42.2%) |
| Enterprise Management | 0 (0.0%) | 0 (0.0%) |
| Administrative & Support | 63 (100.0%) | 0 (0.0%) |
| Educational Services | 86 (60.1%) | 57 (39.9%) |
| Health Care & Social Assistance | 28 (12.7%) | 193 (87.3%) |
| Arts, Entertainment & Recreation | 0 (0.0%) | 0 (0.0%) |
| Accommodation & Food Services | 0 (0.0%) | 41 (100.0%) |
| Public Administration | 99 (50.2%) | 98 (49.7%) |
| Total | 834 (55.3%) | 674 (44.7%) |
Education in Point Pleasant
School Enrollment in Point Pleasant
The most common levels of schooling among the 685 students in Point Pleasant are middle school (327 | 47.7%), elementary school (131 | 19.1%), and graduate / professional (92 | 13.4%).
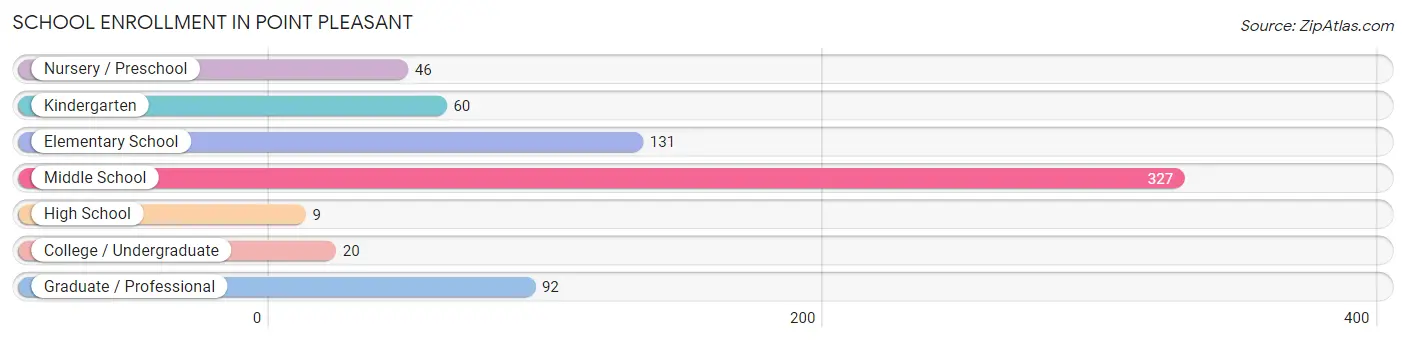
| School Level | # Students | % Students |
| Nursery / Preschool | 46 | 6.7% |
| Kindergarten | 60 | 8.8% |
| Elementary School | 131 | 19.1% |
| Middle School | 327 | 47.7% |
| High School | 9 | 1.3% |
| College / Undergraduate | 20 | 2.9% |
| Graduate / Professional | 92 | 13.4% |
| Total | 685 | 100.0% |
School Enrollment by Age by Funding Source in Point Pleasant
Out of a total of 685 students who are enrolled in schools in Point Pleasant, 23 (3.4%) attend a private institution, while the remaining 662 (96.6%) are enrolled in public schools. The age group of 18 to 19 year olds has the highest likelihood of being enrolled in private schools, with 12 (60.0% in the age bracket) enrolled. Conversely, the age group of 3 to 4 year olds has the lowest likelihood of being enrolled in a private school, with 21 (100.0% in the age bracket) attending a public institution.
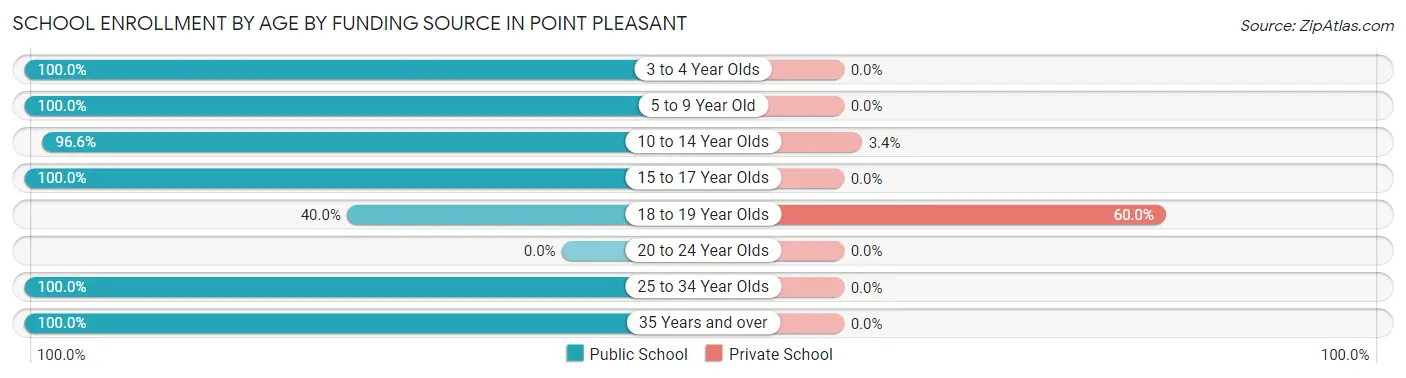
| Age Bracket | Public School | Private School |
| 3 to 4 Year Olds | 21 (100.0%) | 0 (0.0%) |
| 5 to 9 Year Old | 216 (100.0%) | 0 (0.0%) |
| 10 to 14 Year Olds | 316 (96.6%) | 11 (3.4%) |
| 15 to 17 Year Olds | 9 (100.0%) | 0 (0.0%) |
| 18 to 19 Year Olds | 8 (40.0%) | 12 (60.0%) |
| 20 to 24 Year Olds | 0 (0.0%) | 0 (0.0%) |
| 25 to 34 Year Olds | 67 (100.0%) | 0 (0.0%) |
| 35 Years and over | 25 (100.0%) | 0 (0.0%) |
| Total | 662 (96.6%) | 23 (3.4%) |
Educational Attainment by Field of Study in Point Pleasant
Education (194 | 28.2%), business (150 | 21.8%), arts & humanities (145 | 21.1%), science & technology (72 | 10.5%), and liberal arts & history (51 | 7.4%) are the most common fields of study among 688 individuals in Point Pleasant who have obtained a bachelor's degree or higher.
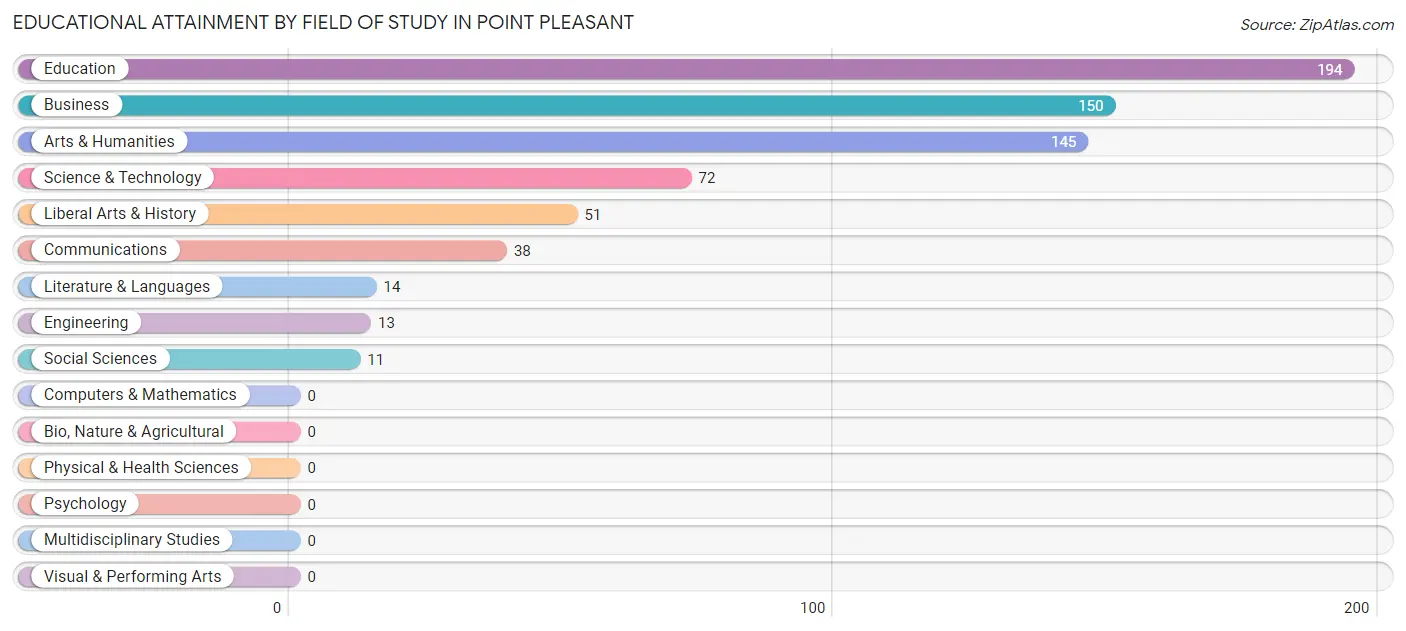
| Field of Study | # Graduates | % Graduates |
| Computers & Mathematics | 0 | 0.0% |
| Bio, Nature & Agricultural | 0 | 0.0% |
| Physical & Health Sciences | 0 | 0.0% |
| Psychology | 0 | 0.0% |
| Social Sciences | 11 | 1.6% |
| Engineering | 13 | 1.9% |
| Multidisciplinary Studies | 0 | 0.0% |
| Science & Technology | 72 | 10.5% |
| Business | 150 | 21.8% |
| Education | 194 | 28.2% |
| Literature & Languages | 14 | 2.0% |
| Liberal Arts & History | 51 | 7.4% |
| Visual & Performing Arts | 0 | 0.0% |
| Communications | 38 | 5.5% |
| Arts & Humanities | 145 | 21.1% |
| Total | 688 | 100.0% |
Transportation & Commute in Point Pleasant
Vehicle Availability by Sex in Point Pleasant
The most prevalent vehicle ownership categories in Point Pleasant are males with 2 vehicles (334, accounting for 44.7%) and females with 2 vehicles (105, making up 56.0%).
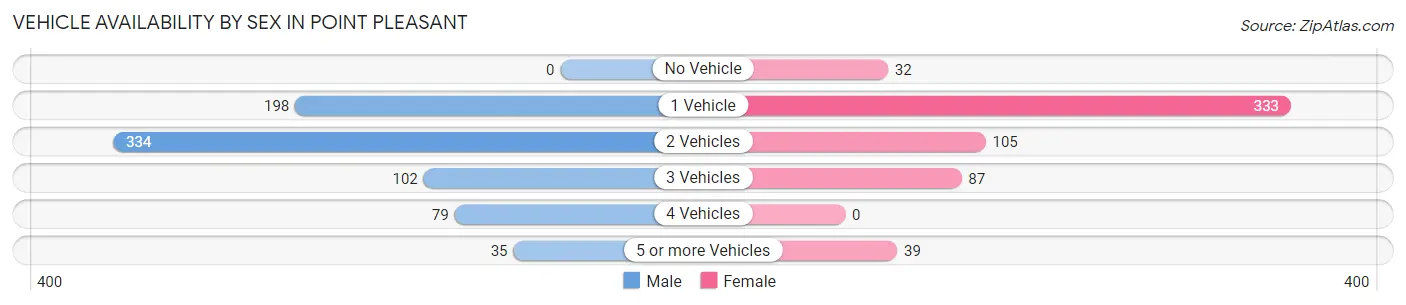
| Vehicles Available | Male | Female |
| No Vehicle | 0 (0.0%) | 32 (5.4%) |
| 1 Vehicle | 198 (26.5%) | 333 (55.9%) |
| 2 Vehicles | 334 (44.7%) | 105 (17.6%) |
| 3 Vehicles | 102 (13.6%) | 87 (14.6%) |
| 4 Vehicles | 79 (10.6%) | 0 (0.0%) |
| 5 or more Vehicles | 35 (4.7%) | 39 (6.5%) |
| Total | 748 (100.0%) | 596 (100.0%) |
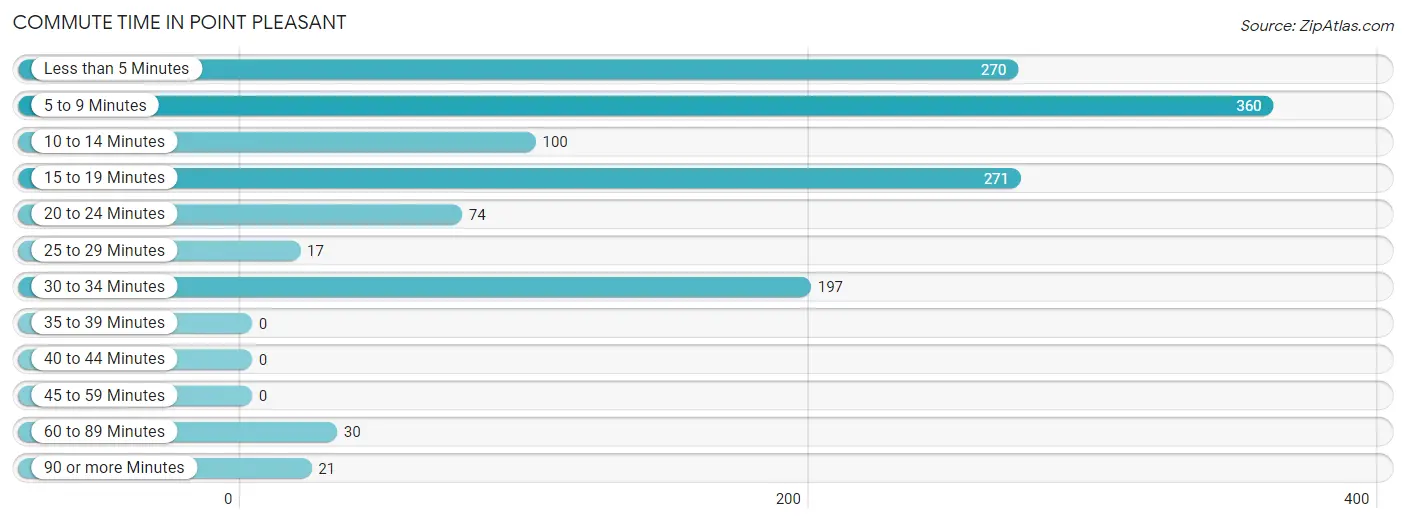
Commute Time in Point Pleasant
The most frequently occuring commute durations in Point Pleasant are 5 to 9 minutes (360 commuters, 26.9%), 15 to 19 minutes (271 commuters, 20.2%), and less than 5 minutes (270 commuters, 20.2%).
| Commute Time | # Commuters | % Commuters |
| Less than 5 Minutes | 270 | 20.2% |
| 5 to 9 Minutes | 360 | 26.9% |
| 10 to 14 Minutes | 100 | 7.5% |
| 15 to 19 Minutes | 271 | 20.2% |
| 20 to 24 Minutes | 74 | 5.5% |
| 25 to 29 Minutes | 17 | 1.3% |
| 30 to 34 Minutes | 197 | 14.7% |
| 35 to 39 Minutes | 0 | 0.0% |
| 40 to 44 Minutes | 0 | 0.0% |
| 45 to 59 Minutes | 0 | 0.0% |
| 60 to 89 Minutes | 30 | 2.2% |
| 90 or more Minutes | 21 | 1.6% |
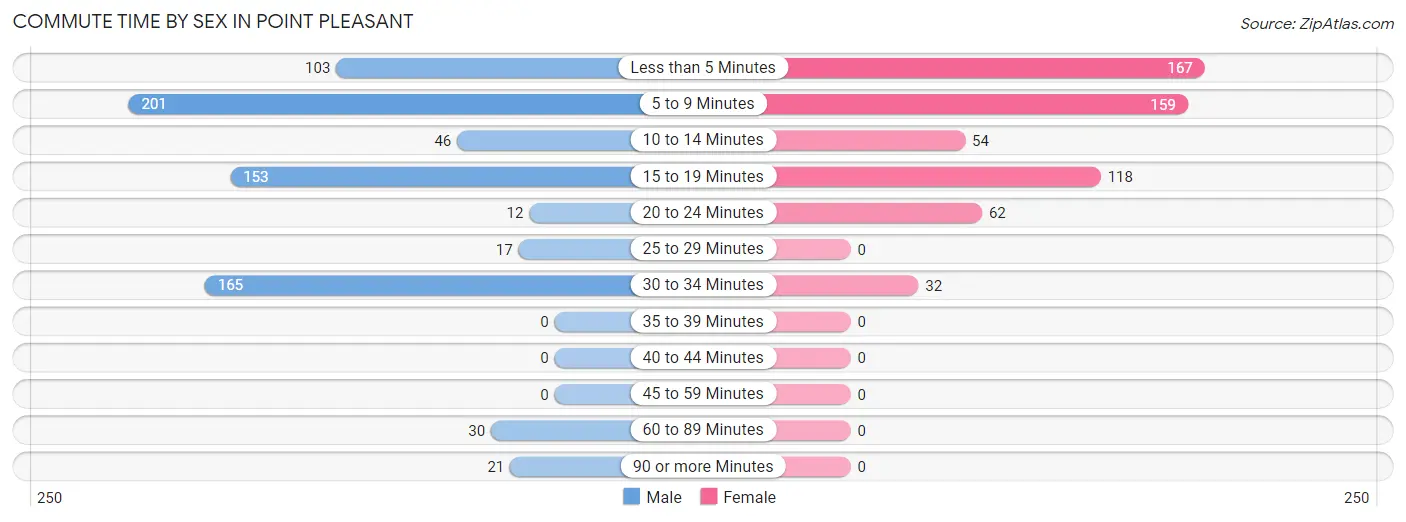
Commute Time by Sex in Point Pleasant
The most common commute times in Point Pleasant are 5 to 9 minutes (201 commuters, 26.9%) for males and less than 5 minutes (167 commuters, 28.2%) for females.
| Commute Time | Male | Female |
| Less than 5 Minutes | 103 (13.8%) | 167 (28.2%) |
| 5 to 9 Minutes | 201 (26.9%) | 159 (26.9%) |
| 10 to 14 Minutes | 46 (6.1%) | 54 (9.1%) |
| 15 to 19 Minutes | 153 (20.4%) | 118 (19.9%) |
| 20 to 24 Minutes | 12 (1.6%) | 62 (10.5%) |
| 25 to 29 Minutes | 17 (2.3%) | 0 (0.0%) |
| 30 to 34 Minutes | 165 (22.1%) | 32 (5.4%) |
| 35 to 39 Minutes | 0 (0.0%) | 0 (0.0%) |
| 40 to 44 Minutes | 0 (0.0%) | 0 (0.0%) |
| 45 to 59 Minutes | 0 (0.0%) | 0 (0.0%) |
| 60 to 89 Minutes | 30 (4.0%) | 0 (0.0%) |
| 90 or more Minutes | 21 (2.8%) | 0 (0.0%) |
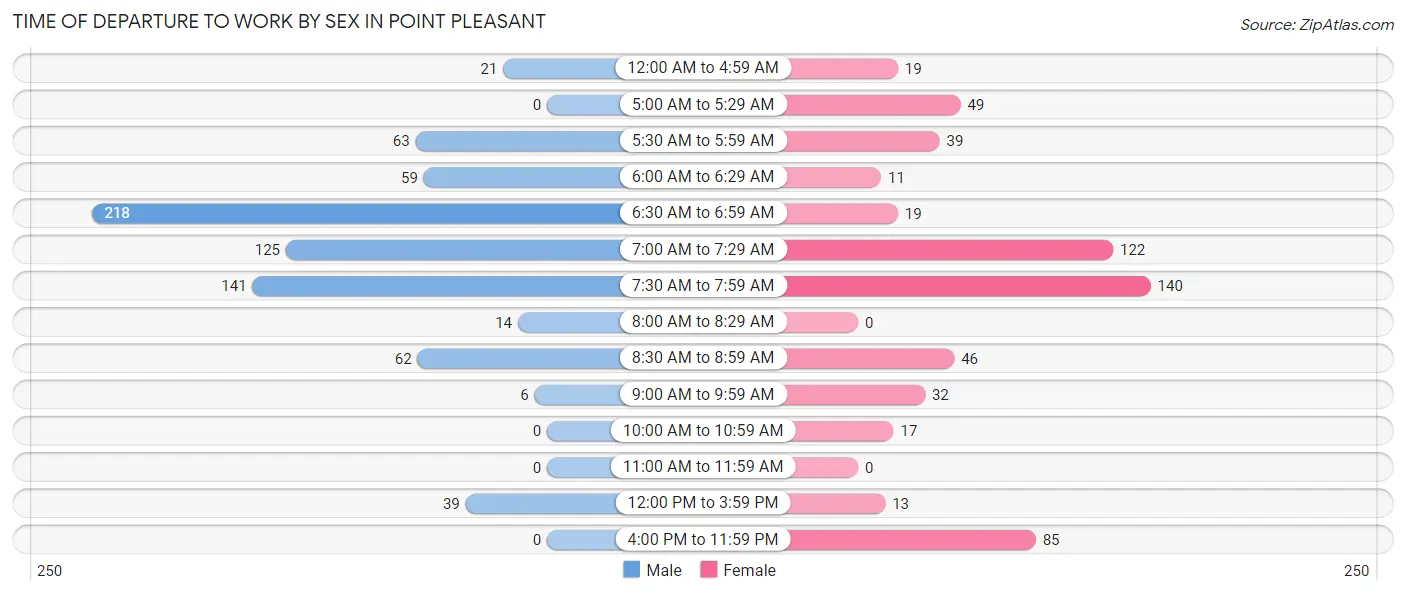
Time of Departure to Work by Sex in Point Pleasant
The most frequent times of departure to work in Point Pleasant are 6:30 AM to 6:59 AM (218, 29.1%) for males and 7:30 AM to 7:59 AM (140, 23.6%) for females.
| Time of Departure | Male | Female |
| 12:00 AM to 4:59 AM | 21 (2.8%) | 19 (3.2%) |
| 5:00 AM to 5:29 AM | 0 (0.0%) | 49 (8.3%) |
| 5:30 AM to 5:59 AM | 63 (8.4%) | 39 (6.6%) |
| 6:00 AM to 6:29 AM | 59 (7.9%) | 11 (1.9%) |
| 6:30 AM to 6:59 AM | 218 (29.1%) | 19 (3.2%) |
| 7:00 AM to 7:29 AM | 125 (16.7%) | 122 (20.6%) |
| 7:30 AM to 7:59 AM | 141 (18.9%) | 140 (23.6%) |
| 8:00 AM to 8:29 AM | 14 (1.9%) | 0 (0.0%) |
| 8:30 AM to 8:59 AM | 62 (8.3%) | 46 (7.8%) |
| 9:00 AM to 9:59 AM | 6 (0.8%) | 32 (5.4%) |
| 10:00 AM to 10:59 AM | 0 (0.0%) | 17 (2.9%) |
| 11:00 AM to 11:59 AM | 0 (0.0%) | 0 (0.0%) |
| 12:00 PM to 3:59 PM | 39 (5.2%) | 13 (2.2%) |
| 4:00 PM to 11:59 PM | 0 (0.0%) | 85 (14.4%) |
| Total | 748 (100.0%) | 592 (100.0%) |
Housing Occupancy in Point Pleasant
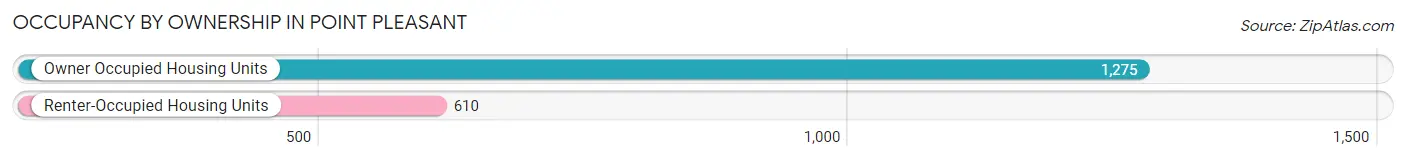
Occupancy by Ownership in Point Pleasant
Of the total 1,885 dwellings in Point Pleasant, owner-occupied units account for 1,275 (67.6%), while renter-occupied units make up 610 (32.4%).
| Occupancy | # Housing Units | % Housing Units |
| Owner Occupied Housing Units | 1,275 | 67.6% |
| Renter-Occupied Housing Units | 610 | 32.4% |
| Total Occupied Housing Units | 1,885 | 100.0% |
Occupancy by Household Size in Point Pleasant
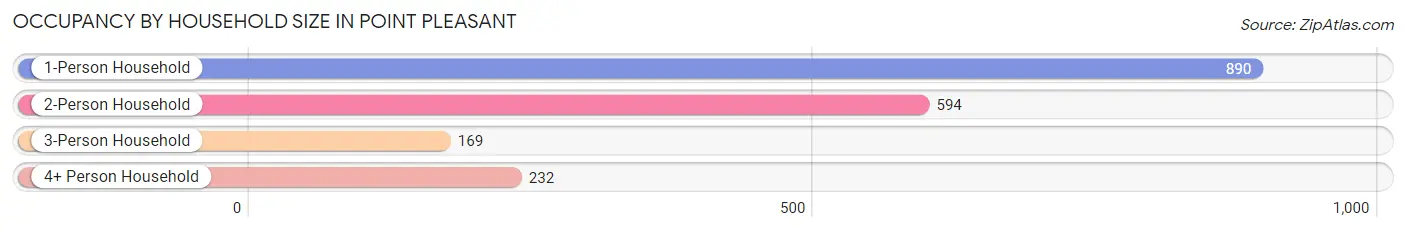
| Household Size | # Housing Units | % Housing Units |
| 1-Person Household | 890 | 47.2% |
| 2-Person Household | 594 | 31.5% |
| 3-Person Household | 169 | 9.0% |
| 4+ Person Household | 232 | 12.3% |
| Total Housing Units | 1,885 | 100.0% |
Occupancy by Ownership by Household Size in Point Pleasant
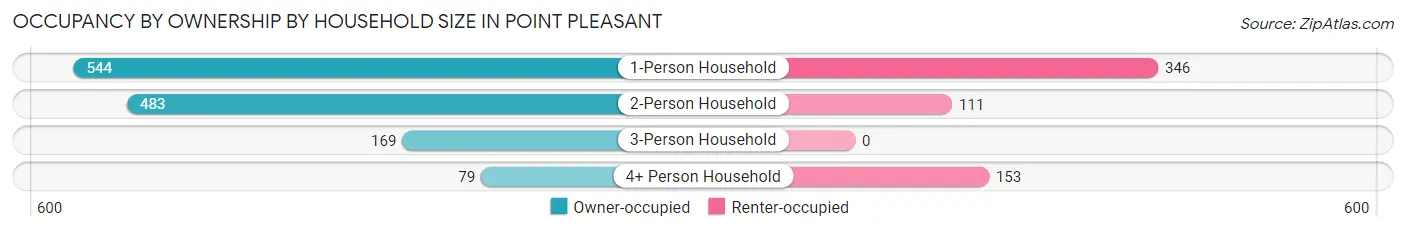
| Household Size | Owner-occupied | Renter-occupied |
| 1-Person Household | 544 (61.1%) | 346 (38.9%) |
| 2-Person Household | 483 (81.3%) | 111 (18.7%) |
| 3-Person Household | 169 (100.0%) | 0 (0.0%) |
| 4+ Person Household | 79 (34.1%) | 153 (65.9%) |
| Total Housing Units | 1,275 (67.6%) | 610 (32.4%) |
Occupancy by Educational Attainment in Point Pleasant
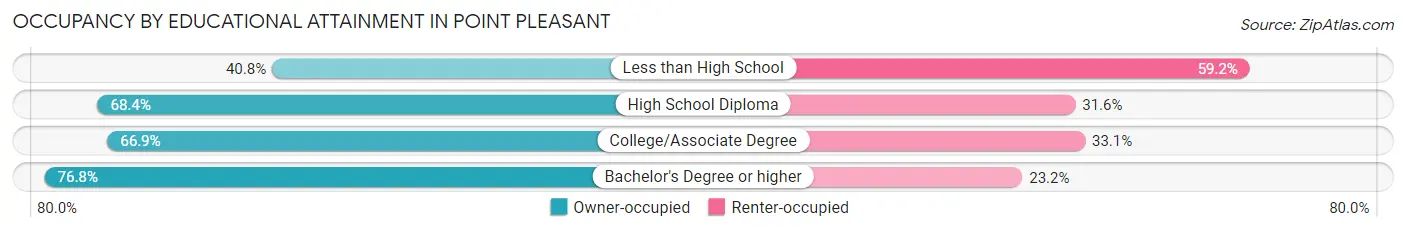
| Household Size | Owner-occupied | Renter-occupied |
| Less than High School | 75 (40.8%) | 109 (59.2%) |
| High School Diploma | 468 (68.4%) | 216 (31.6%) |
| College/Associate Degree | 331 (66.9%) | 164 (33.1%) |
| Bachelor's Degree or higher | 401 (76.8%) | 121 (23.2%) |
Occupancy by Age of Householder in Point Pleasant
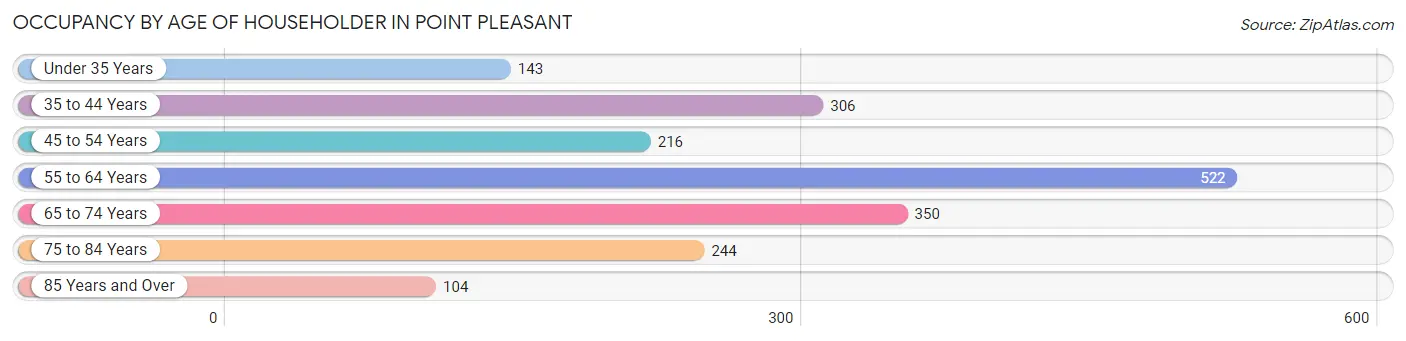
| Age Bracket | # Households | % Households |
| Under 35 Years | 143 | 7.6% |
| 35 to 44 Years | 306 | 16.2% |
| 45 to 54 Years | 216 | 11.5% |
| 55 to 64 Years | 522 | 27.7% |
| 65 to 74 Years | 350 | 18.6% |
| 75 to 84 Years | 244 | 12.9% |
| 85 Years and Over | 104 | 5.5% |
| Total | 1,885 | 100.0% |
Housing Finances in Point Pleasant
Median Income by Occupancy in Point Pleasant
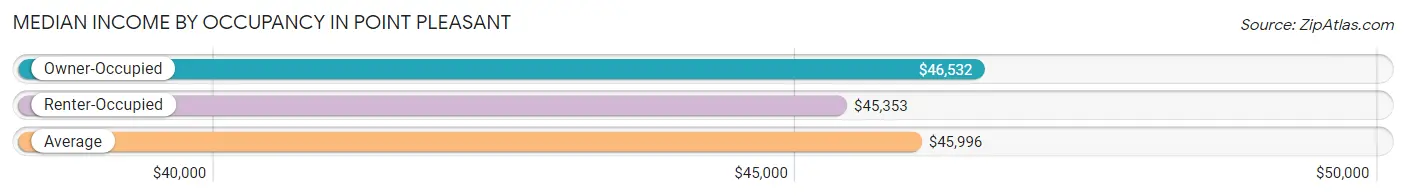
| Occupancy Type | # Households | Median Income |
| Owner-Occupied | 1,275 (67.6%) | $46,532 |
| Renter-Occupied | 610 (32.4%) | $45,353 |
| Average | 1,885 (100.0%) | $45,996 |
Occupancy by Householder Income Bracket in Point Pleasant
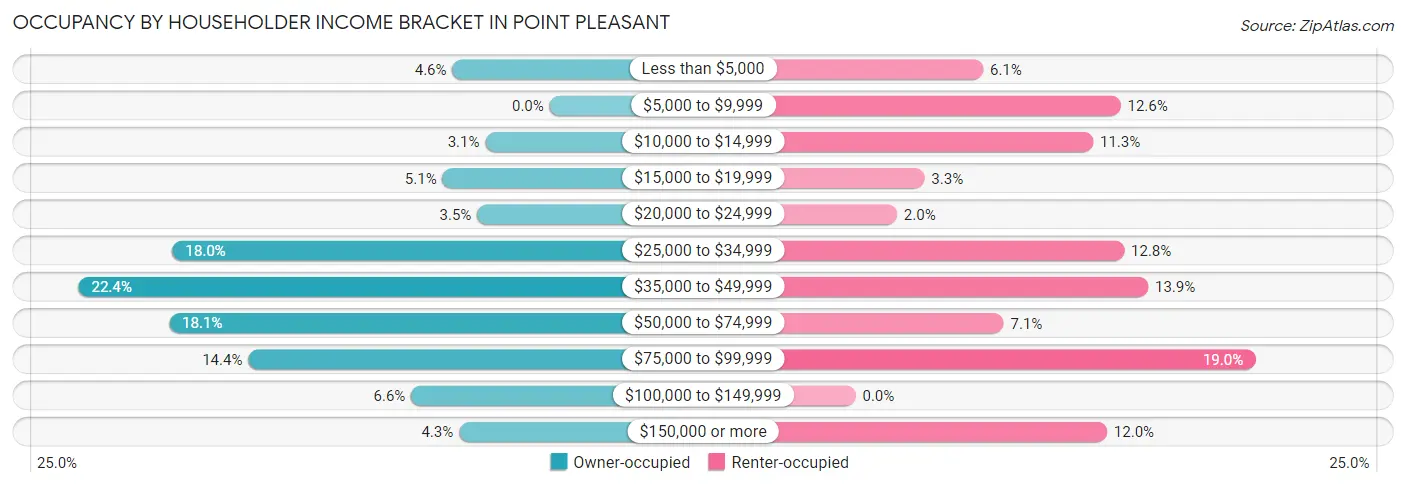
| Income Bracket | Owner-occupied | Renter-occupied |
| Less than $5,000 | 59 (4.6%) | 37 (6.1%) |
| $5,000 to $9,999 | 0 (0.0%) | 77 (12.6%) |
| $10,000 to $14,999 | 39 (3.1%) | 69 (11.3%) |
| $15,000 to $19,999 | 65 (5.1%) | 20 (3.3%) |
| $20,000 to $24,999 | 44 (3.5%) | 12 (2.0%) |
| $25,000 to $34,999 | 229 (18.0%) | 78 (12.8%) |
| $35,000 to $49,999 | 286 (22.4%) | 85 (13.9%) |
| $50,000 to $74,999 | 231 (18.1%) | 43 (7.0%) |
| $75,000 to $99,999 | 183 (14.3%) | 116 (19.0%) |
| $100,000 to $149,999 | 84 (6.6%) | 0 (0.0%) |
| $150,000 or more | 55 (4.3%) | 73 (12.0%) |
| Total | 1,275 (100.0%) | 610 (100.0%) |
Monthly Housing Cost Tiers in Point Pleasant
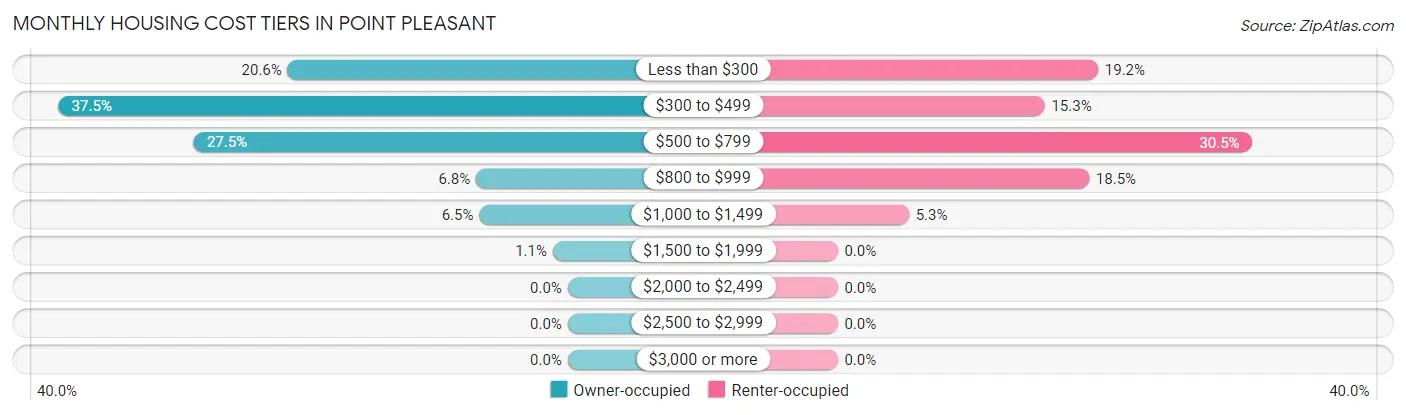
| Monthly Cost | Owner-occupied | Renter-occupied |
| Less than $300 | 263 (20.6%) | 117 (19.2%) |
| $300 to $499 | 478 (37.5%) | 93 (15.2%) |
| $500 to $799 | 351 (27.5%) | 186 (30.5%) |
| $800 to $999 | 86 (6.8%) | 113 (18.5%) |
| $1,000 to $1,499 | 83 (6.5%) | 32 (5.2%) |
| $1,500 to $1,999 | 14 (1.1%) | 0 (0.0%) |
| $2,000 to $2,499 | 0 (0.0%) | 0 (0.0%) |
| $2,500 to $2,999 | 0 (0.0%) | 0 (0.0%) |
| $3,000 or more | 0 (0.0%) | 0 (0.0%) |
| Total | 1,275 (100.0%) | 610 (100.0%) |
Physical Housing Characteristics in Point Pleasant
Housing Structures in Point Pleasant
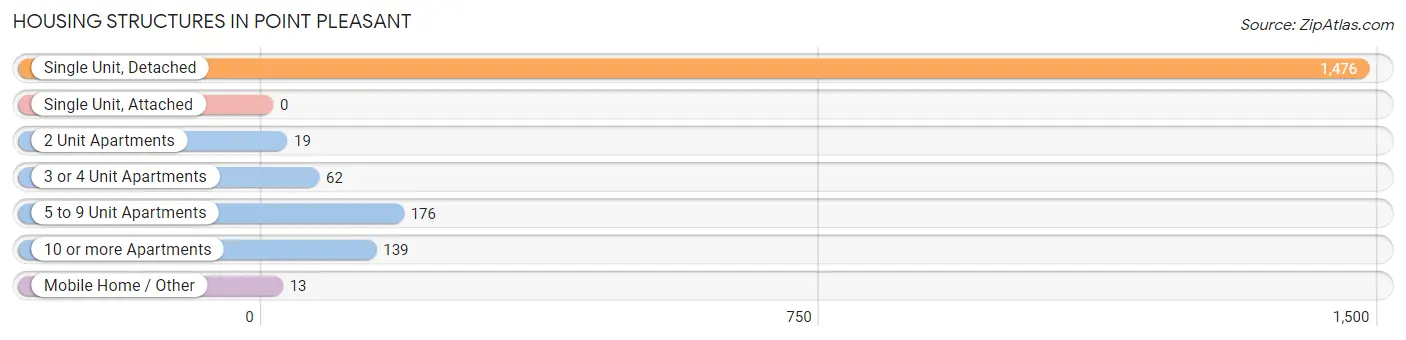
| Structure Type | # Housing Units | % Housing Units |
| Single Unit, Detached | 1,476 | 78.3% |
| Single Unit, Attached | 0 | 0.0% |
| 2 Unit Apartments | 19 | 1.0% |
| 3 or 4 Unit Apartments | 62 | 3.3% |
| 5 to 9 Unit Apartments | 176 | 9.3% |
| 10 or more Apartments | 139 | 7.4% |
| Mobile Home / Other | 13 | 0.7% |
| Total | 1,885 | 100.0% |
Housing Structures by Occupancy in Point Pleasant
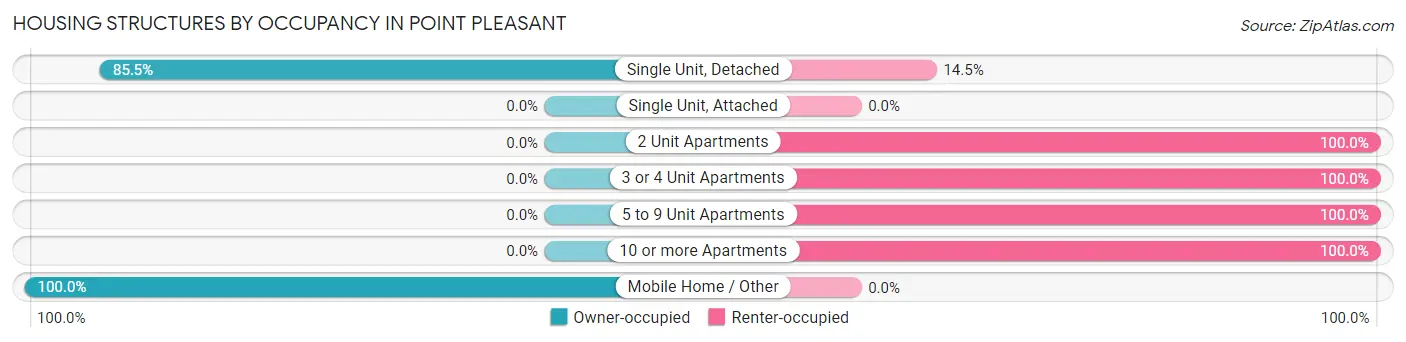
| Structure Type | Owner-occupied | Renter-occupied |
| Single Unit, Detached | 1,262 (85.5%) | 214 (14.5%) |
| Single Unit, Attached | 0 (0.0%) | 0 (0.0%) |
| 2 Unit Apartments | 0 (0.0%) | 19 (100.0%) |
| 3 or 4 Unit Apartments | 0 (0.0%) | 62 (100.0%) |
| 5 to 9 Unit Apartments | 0 (0.0%) | 176 (100.0%) |
| 10 or more Apartments | 0 (0.0%) | 139 (100.0%) |
| Mobile Home / Other | 13 (100.0%) | 0 (0.0%) |
| Total | 1,275 (67.6%) | 610 (32.4%) |
Housing Structures by Number of Rooms in Point Pleasant
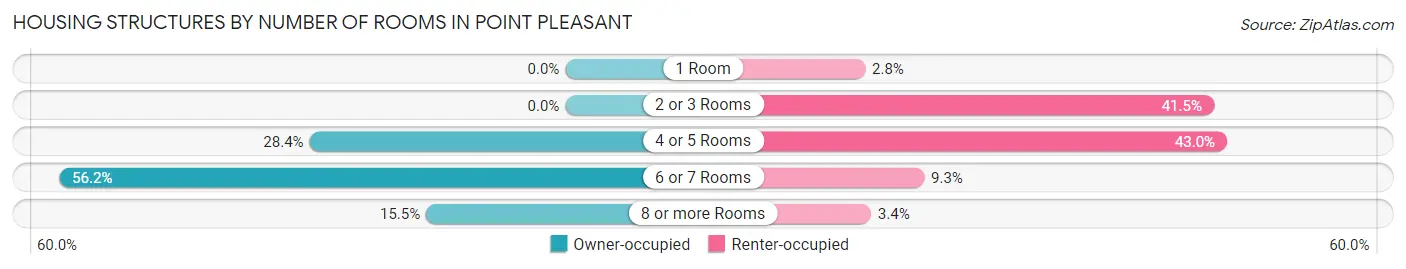
| Number of Rooms | Owner-occupied | Renter-occupied |
| 1 Room | 0 (0.0%) | 17 (2.8%) |
| 2 or 3 Rooms | 0 (0.0%) | 253 (41.5%) |
| 4 or 5 Rooms | 362 (28.4%) | 262 (42.9%) |
| 6 or 7 Rooms | 716 (56.2%) | 57 (9.3%) |
| 8 or more Rooms | 197 (15.4%) | 21 (3.4%) |
| Total | 1,275 (100.0%) | 610 (100.0%) |
Housing Structure by Heating Type in Point Pleasant
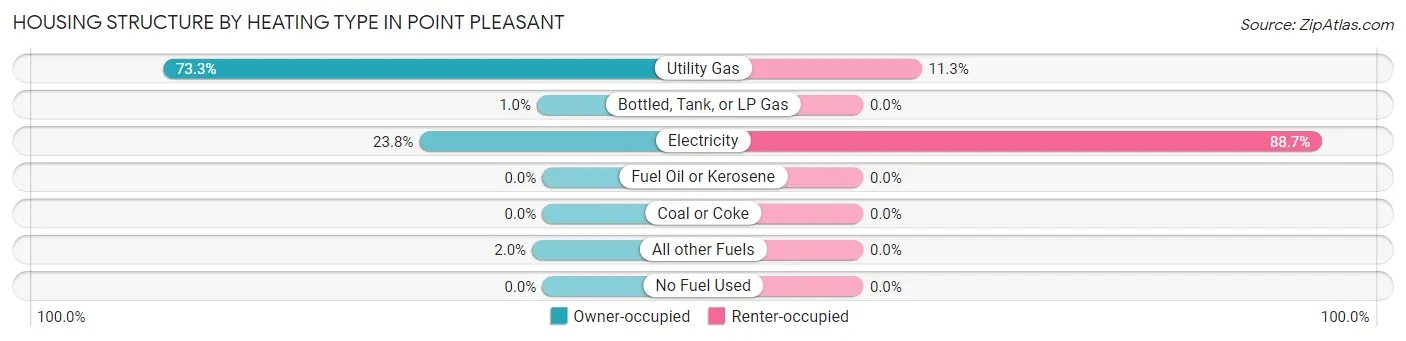
| Heating Type | Owner-occupied | Renter-occupied |
| Utility Gas | 934 (73.3%) | 69 (11.3%) |
| Bottled, Tank, or LP Gas | 13 (1.0%) | 0 (0.0%) |
| Electricity | 303 (23.8%) | 541 (88.7%) |
| Fuel Oil or Kerosene | 0 (0.0%) | 0 (0.0%) |
| Coal or Coke | 0 (0.0%) | 0 (0.0%) |
| All other Fuels | 25 (2.0%) | 0 (0.0%) |
| No Fuel Used | 0 (0.0%) | 0 (0.0%) |
| Total | 1,275 (100.0%) | 610 (100.0%) |
Household Vehicle Usage in Point Pleasant
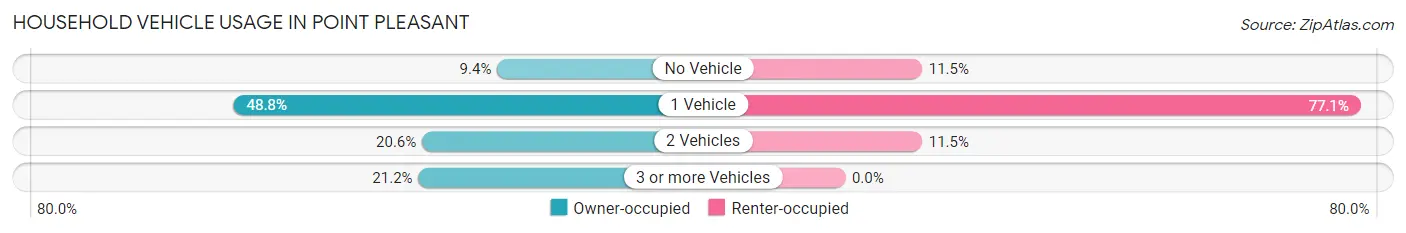
| Vehicles per Household | Owner-occupied | Renter-occupied |
| No Vehicle | 120 (9.4%) | 70 (11.5%) |
| 1 Vehicle | 622 (48.8%) | 470 (77.0%) |
| 2 Vehicles | 263 (20.6%) | 70 (11.5%) |
| 3 or more Vehicles | 270 (21.2%) | 0 (0.0%) |
| Total | 1,275 (100.0%) | 610 (100.0%) |
Real Estate & Mortgages in Point Pleasant
Real Estate and Mortgage Overview in Point Pleasant
| Characteristic | Without Mortgage | With Mortgage |
| Housing Units | 933 | 342 |
| Median Property Value | $111,000 | $102,000 |
| Median Household Income | $39,229 | $0 |
| Monthly Housing Costs | $415 | $0 |
| Real Estate Taxes | $766 | $9 |
Property Value by Mortgage Status in Point Pleasant
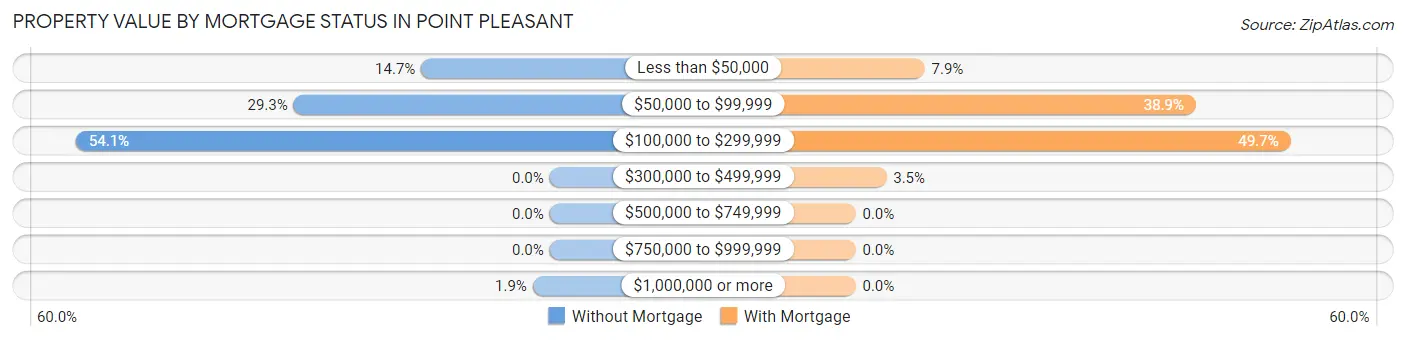
| Property Value | Without Mortgage | With Mortgage |
| Less than $50,000 | 137 (14.7%) | 27 (7.9%) |
| $50,000 to $99,999 | 273 (29.3%) | 133 (38.9%) |
| $100,000 to $299,999 | 505 (54.1%) | 170 (49.7%) |
| $300,000 to $499,999 | 0 (0.0%) | 12 (3.5%) |
| $500,000 to $749,999 | 0 (0.0%) | 0 (0.0%) |
| $750,000 to $999,999 | 0 (0.0%) | 0 (0.0%) |
| $1,000,000 or more | 18 (1.9%) | 0 (0.0%) |
| Total | 933 (100.0%) | 342 (100.0%) |
Household Income by Mortgage Status in Point Pleasant
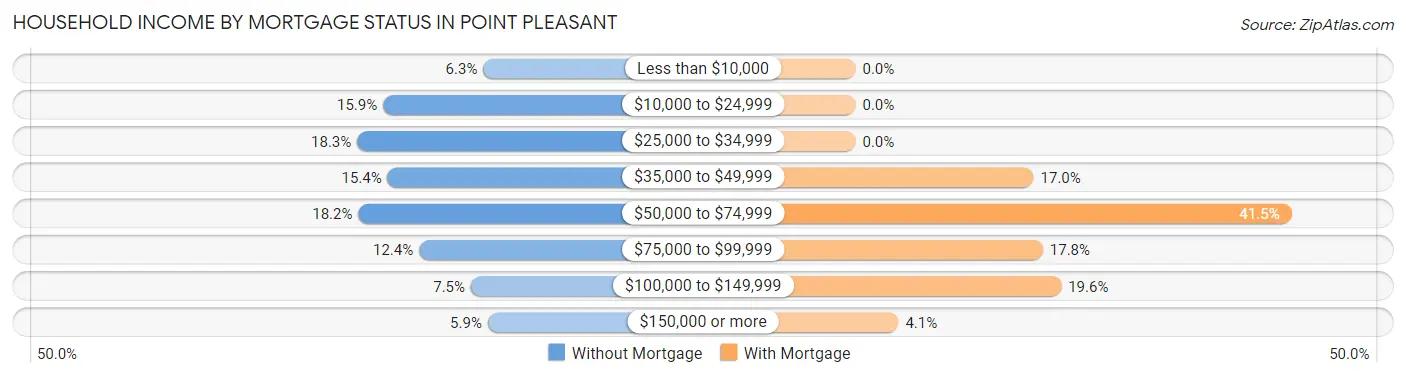
| Household Income | Without Mortgage | With Mortgage |
| Less than $10,000 | 59 (6.3%) | 0 (0.0%) |
| $10,000 to $24,999 | 148 (15.9%) | 0 (0.0%) |
| $25,000 to $34,999 | 171 (18.3%) | 0 (0.0%) |
| $35,000 to $49,999 | 144 (15.4%) | 58 (17.0%) |
| $50,000 to $74,999 | 170 (18.2%) | 142 (41.5%) |
| $75,000 to $99,999 | 116 (12.4%) | 61 (17.8%) |
| $100,000 to $149,999 | 70 (7.5%) | 67 (19.6%) |
| $150,000 or more | 55 (5.9%) | 14 (4.1%) |
| Total | 933 (100.0%) | 342 (100.0%) |
Property Value to Household Income Ratio in Point Pleasant
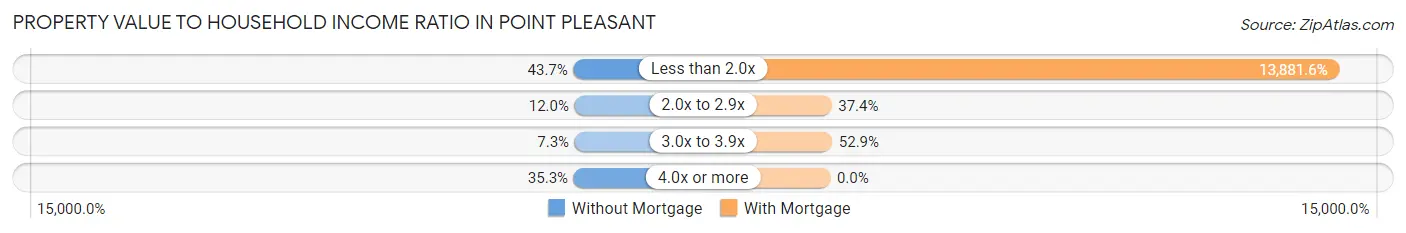
| Value-to-Income Ratio | Without Mortgage | With Mortgage |
| Less than 2.0x | 408 (43.7%) | 47,475 (13,881.6%) |
| 2.0x to 2.9x | 112 (12.0%) | 128 (37.4%) |
| 3.0x to 3.9x | 68 (7.3%) | 181 (52.9%) |
| 4.0x or more | 329 (35.3%) | 0 (0.0%) |
| Total | 933 (100.0%) | 342 (100.0%) |
Real Estate Taxes by Mortgage Status in Point Pleasant
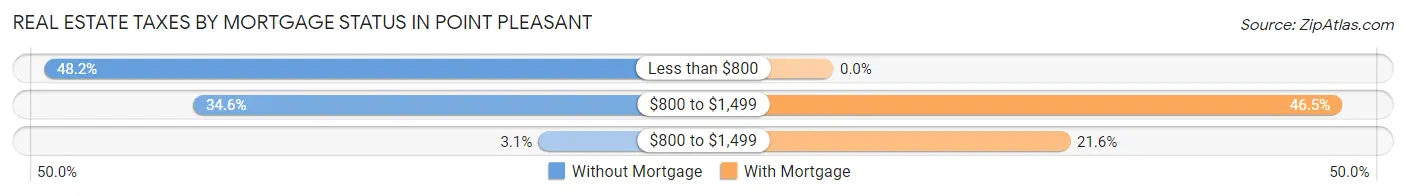
| Property Taxes | Without Mortgage | With Mortgage |
| Less than $800 | 450 (48.2%) | 0 (0.0%) |
| $800 to $1,499 | 323 (34.6%) | 159 (46.5%) |
| $800 to $1,499 | 29 (3.1%) | 74 (21.6%) |
| Total | 933 (100.0%) | 342 (100.0%) |
Health & Disability in Point Pleasant
Health Insurance Coverage by Age in Point Pleasant
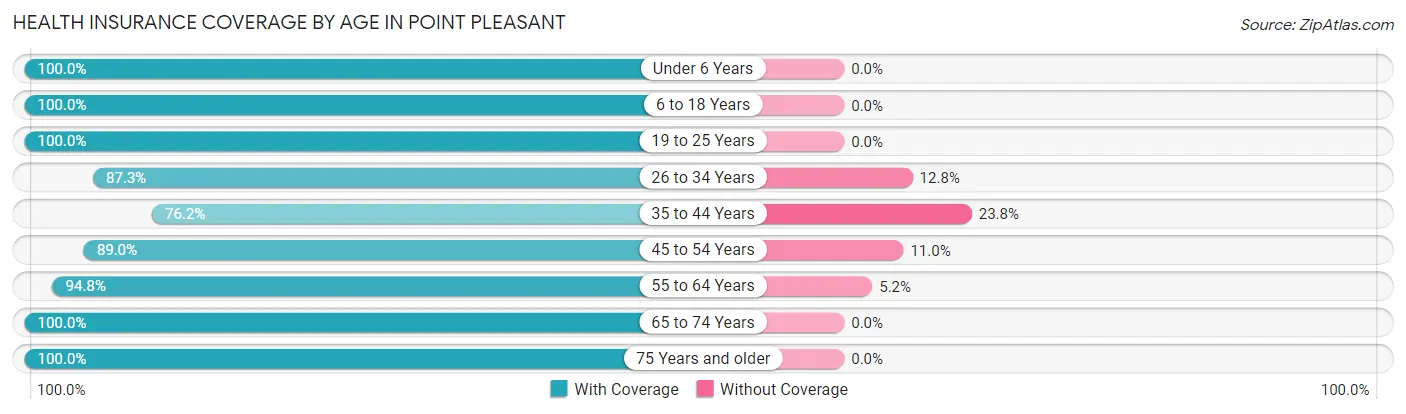
| Age Bracket | With Coverage | Without Coverage |
| Under 6 Years | 449 (100.0%) | 0 (0.0%) |
| 6 to 18 Years | 512 (100.0%) | 0 (0.0%) |
| 19 to 25 Years | 211 (100.0%) | 0 (0.0%) |
| 26 to 34 Years | 301 (87.3%) | 44 (12.8%) |
| 35 to 44 Years | 407 (76.2%) | 127 (23.8%) |
| 45 to 54 Years | 274 (89.0%) | 34 (11.0%) |
| 55 to 64 Years | 799 (94.8%) | 44 (5.2%) |
| 65 to 74 Years | 392 (100.0%) | 0 (0.0%) |
| 75 Years and older | 473 (100.0%) | 0 (0.0%) |
| Total | 3,818 (93.9%) | 249 (6.1%) |
Health Insurance Coverage by Citizenship Status in Point Pleasant
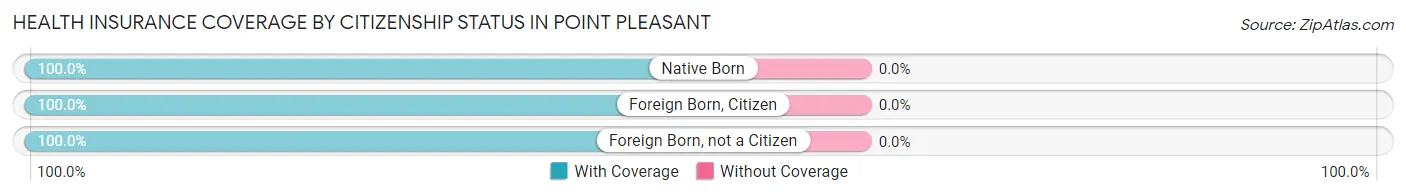
| Citizenship Status | With Coverage | Without Coverage |
| Native Born | 449 (100.0%) | 0 (0.0%) |
| Foreign Born, Citizen | 512 (100.0%) | 0 (0.0%) |
| Foreign Born, not a Citizen | 211 (100.0%) | 0 (0.0%) |
Health Insurance Coverage by Household Income in Point Pleasant
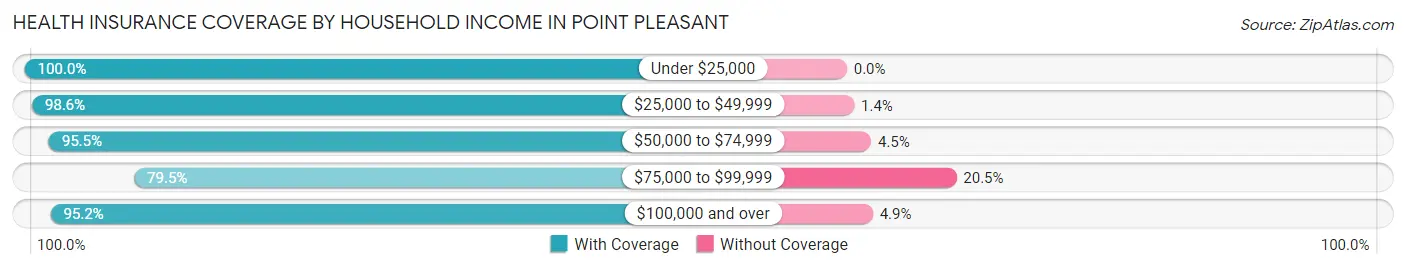
| Household Income | With Coverage | Without Coverage |
| Under $25,000 | 551 (100.0%) | 0 (0.0%) |
| $25,000 to $49,999 | 1,370 (98.6%) | 19 (1.4%) |
| $50,000 to $74,999 | 610 (95.5%) | 29 (4.5%) |
| $75,000 to $99,999 | 662 (79.5%) | 171 (20.5%) |
| $100,000 and over | 588 (95.2%) | 30 (4.9%) |
Public vs Private Health Insurance Coverage by Age in Point Pleasant
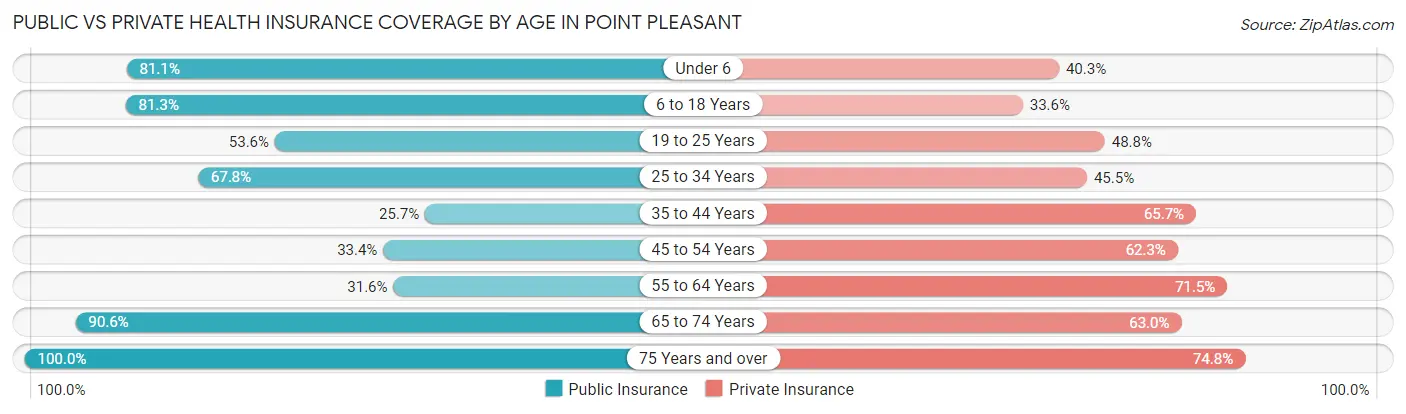
| Age Bracket | Public Insurance | Private Insurance |
| Under 6 | 364 (81.1%) | 181 (40.3%) |
| 6 to 18 Years | 416 (81.2%) | 172 (33.6%) |
| 19 to 25 Years | 113 (53.5%) | 103 (48.8%) |
| 25 to 34 Years | 234 (67.8%) | 157 (45.5%) |
| 35 to 44 Years | 137 (25.7%) | 351 (65.7%) |
| 45 to 54 Years | 103 (33.4%) | 192 (62.3%) |
| 55 to 64 Years | 266 (31.6%) | 603 (71.5%) |
| 65 to 74 Years | 355 (90.6%) | 247 (63.0%) |
| 75 Years and over | 473 (100.0%) | 354 (74.8%) |
| Total | 2,461 (60.5%) | 2,360 (58.0%) |
Disability Status by Sex by Age in Point Pleasant
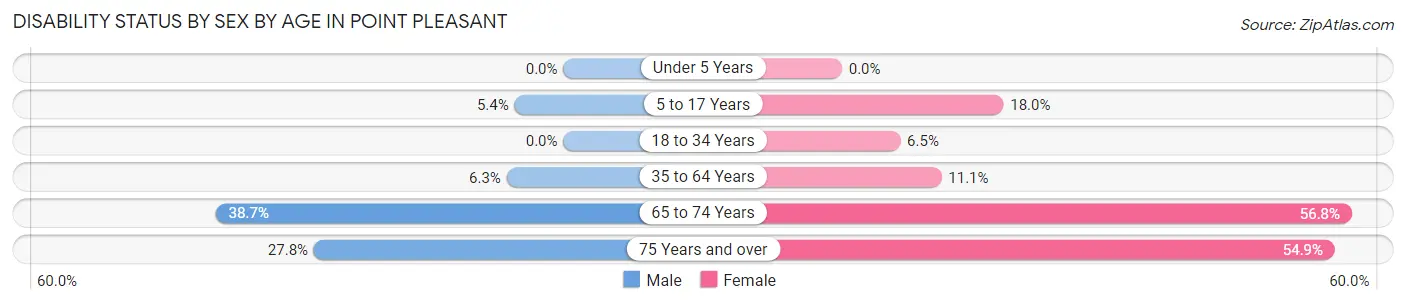
| Age Bracket | Male | Female |
| Under 5 Years | 0 (0.0%) | 0 (0.0%) |
| 5 to 17 Years | 19 (5.4%) | 43 (18.0%) |
| 18 to 34 Years | 0 (0.0%) | 21 (6.5%) |
| 35 to 64 Years | 50 (6.3%) | 99 (11.1%) |
| 65 to 74 Years | 55 (38.7%) | 142 (56.8%) |
| 75 Years and over | 55 (27.8%) | 151 (54.9%) |
Disability Class by Sex by Age in Point Pleasant
Disability Class: Hearing Difficulty
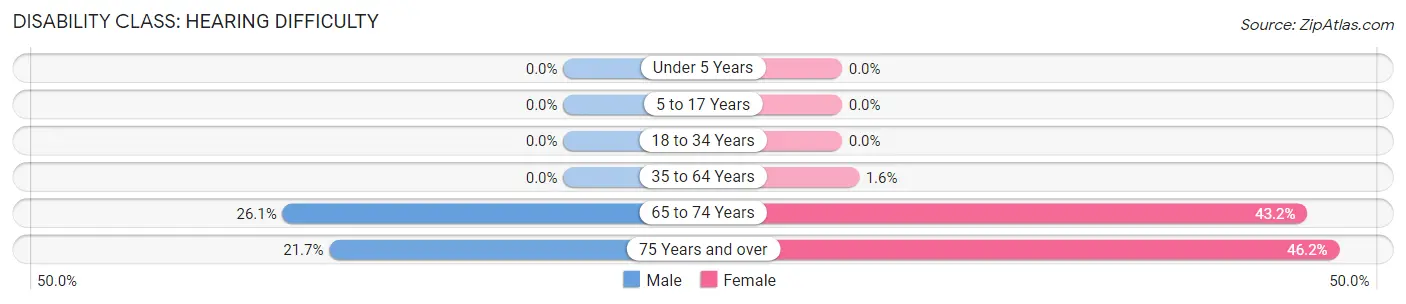
| Age Bracket | Male | Female |
| Under 5 Years | 0 (0.0%) | 0 (0.0%) |
| 5 to 17 Years | 0 (0.0%) | 0 (0.0%) |
| 18 to 34 Years | 0 (0.0%) | 0 (0.0%) |
| 35 to 64 Years | 0 (0.0%) | 14 (1.6%) |
| 65 to 74 Years | 37 (26.1%) | 108 (43.2%) |
| 75 Years and over | 43 (21.7%) | 127 (46.2%) |
Disability Class: Vision Difficulty
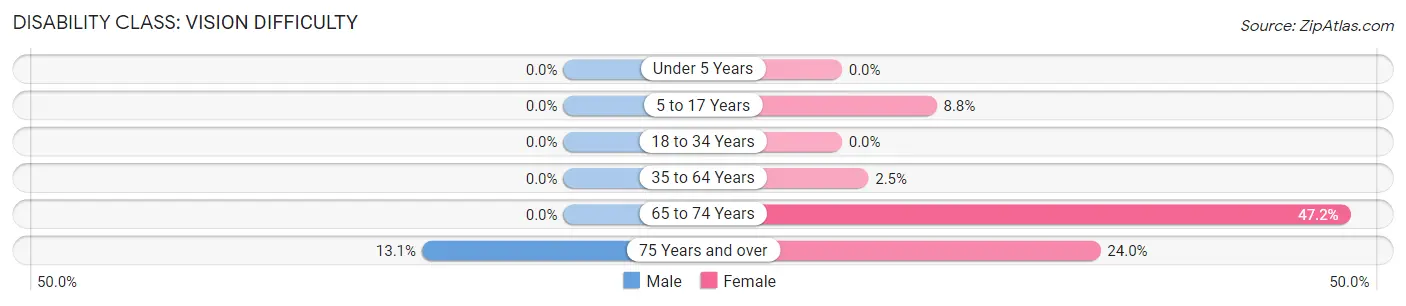
| Age Bracket | Male | Female |
| Under 5 Years | 0 (0.0%) | 0 (0.0%) |
| 5 to 17 Years | 0 (0.0%) | 21 (8.8%) |
| 18 to 34 Years | 0 (0.0%) | 0 (0.0%) |
| 35 to 64 Years | 0 (0.0%) | 22 (2.5%) |
| 65 to 74 Years | 0 (0.0%) | 118 (47.2%) |
| 75 Years and over | 26 (13.1%) | 66 (24.0%) |
Disability Class: Cognitive Difficulty
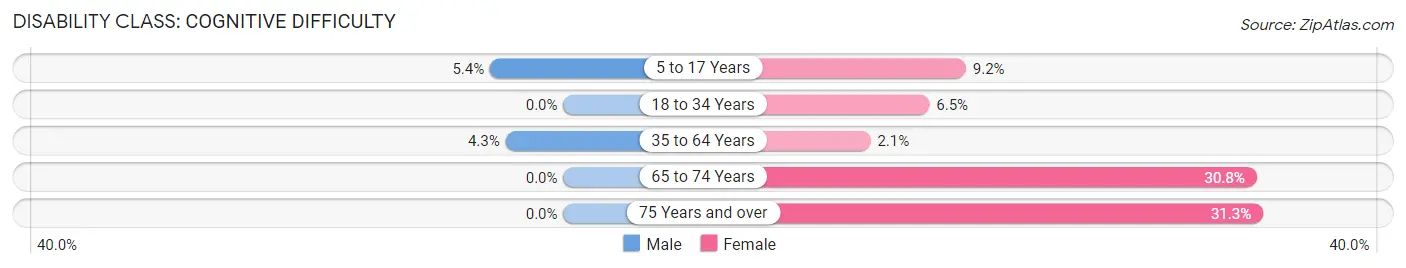
| Age Bracket | Male | Female |
| 5 to 17 Years | 19 (5.4%) | 22 (9.2%) |
| 18 to 34 Years | 0 (0.0%) | 21 (6.5%) |
| 35 to 64 Years | 34 (4.3%) | 19 (2.1%) |
| 65 to 74 Years | 0 (0.0%) | 77 (30.8%) |
| 75 Years and over | 0 (0.0%) | 86 (31.3%) |
Disability Class: Ambulatory Difficulty
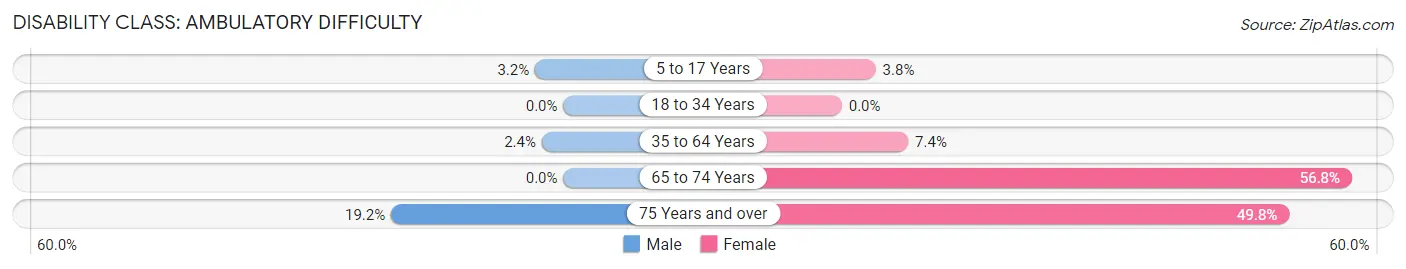
| Age Bracket | Male | Female |
| 5 to 17 Years | 11 (3.2%) | 9 (3.8%) |
| 18 to 34 Years | 0 (0.0%) | 0 (0.0%) |
| 35 to 64 Years | 19 (2.4%) | 66 (7.4%) |
| 65 to 74 Years | 0 (0.0%) | 142 (56.8%) |
| 75 Years and over | 38 (19.2%) | 137 (49.8%) |
Disability Class: Self-Care Difficulty
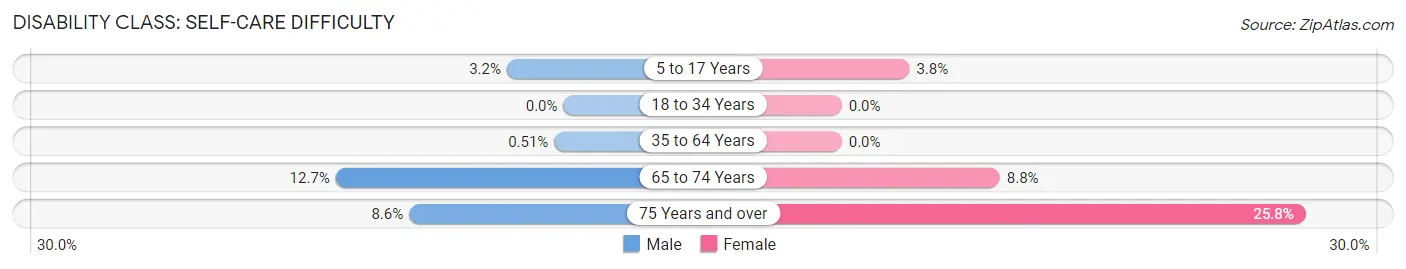
| Age Bracket | Male | Female |
| 5 to 17 Years | 11 (3.2%) | 9 (3.8%) |
| 18 to 34 Years | 0 (0.0%) | 0 (0.0%) |
| 35 to 64 Years | 4 (0.5%) | 0 (0.0%) |
| 65 to 74 Years | 18 (12.7%) | 22 (8.8%) |
| 75 Years and over | 17 (8.6%) | 71 (25.8%) |
Technology Access in Point Pleasant
Computing Device Access in Point Pleasant
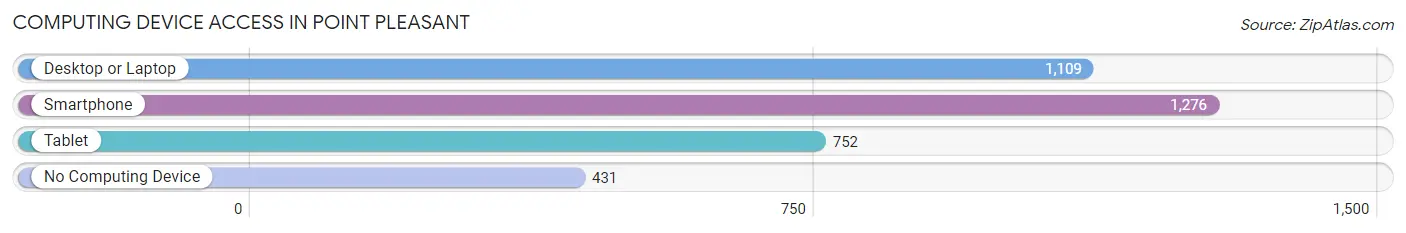
| Device Type | # Households | % Households |
| Desktop or Laptop | 1,109 | 58.8% |
| Smartphone | 1,276 | 67.7% |
| Tablet | 752 | 39.9% |
| No Computing Device | 431 | 22.9% |
| Total | 1,885 | 100.0% |
Internet Access in Point Pleasant
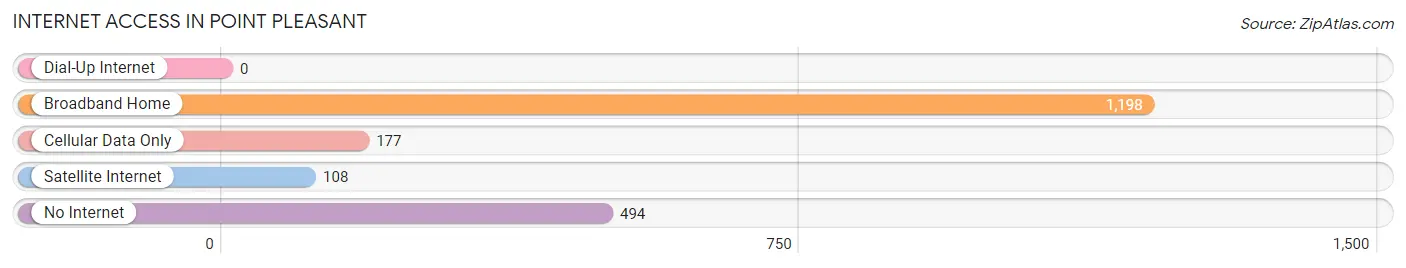
| Internet Type | # Households | % Households |
| Dial-Up Internet | 0 | 0.0% |
| Broadband Home | 1,198 | 63.5% |
| Cellular Data Only | 177 | 9.4% |
| Satellite Internet | 108 | 5.7% |
| No Internet | 494 | 26.2% |
| Total | 1,885 | 100.0% |
Point Pleasant Summary
Point Pleasant is a city located in Mason County, West Virginia, United States. It is the county seat of Mason County and the largest city in the county. The population was 4,350 at the 2010 census. It is the principal city of the Point Pleasant, WV-OH Micropolitan Statistical Area.
History
Point Pleasant was founded in 1774 by Colonel Andrew Lewis and named in honor of his father, General Andrew Lewis. The city was originally part of Virginia, but became part of West Virginia when it was admitted to the Union in 1863.
During the American Revolutionary War, Point Pleasant was the site of the Battle of Point Pleasant, a major battle between the American colonists and the Native Americans of the Shawnee and Mingo tribes. The battle was fought on October 10, 1774 and resulted in a victory for the colonists.
The city was incorporated in 1866 and has since grown to become the largest city in Mason County
Geography
Point Pleasant is located at the confluence of the Ohio and Kanawha Rivers. It is situated on the western bank of the Ohio River, approximately 50 miles downstream from Parkersburg, West Virginia.
The city has a total area of 4 2 square miles all of which is land
Economy
The economy of Point Pleasant is largely based on tourism and manufacturing. The city is home to several manufacturing companies, including the Point Pleasant Glass Company, which produces glassware, and the Point Pleasant Foundry, which produces cast iron products.
The city is also home to several tourist attractions, including the Tu-Endie-Wei State Park, the Point Pleasant River Museum, and the Mothman Museum.
Demographics
As of the 2010 census, the population of Point Pleasant was 4,350. The racial makeup of the city was 95.3% White, 1.2% African American, 0.3% Native American, 0.4% Asian, 0.1% Pacific Islander, 0.7% from other races, and 1.9% from two or more races. Hispanic or Latino of any race were 1.7% of the population.
The median income for a household in the city was $30,938, and the median income for a family was $37,917. The per capita income for the city was $17,845. About 15.2% of families and 17.7% of the population were below the poverty line, including 25.2% of those under age 18 and 11.2% of those age 65 or over.
Common Questions
What is Per Capita Income in Point Pleasant?
Per Capita income in Point Pleasant is $30,990.
What is the Median Family Income in Point Pleasant?
Median Family Income in Point Pleasant is $73,750.
What is the Median Household income in Point Pleasant?
Median Household Income in Point Pleasant is $45,996.
What is Income or Wage Gap in Point Pleasant?
Income or Wage Gap in Point Pleasant is 54.1%.
Women in Point Pleasant earn 45.9 cents for every dollar earned by a man.
What is Inequality or Gini Index in Point Pleasant?
Inequality or Gini Index in Point Pleasant is 0.48.
What is the Total Population of Point Pleasant?
Total Population of Point Pleasant is 4,067.
What is the Total Male Population of Point Pleasant?
Total Male Population of Point Pleasant is 2,030.
What is the Total Female Population of Point Pleasant?
Total Female Population of Point Pleasant is 2,037.
What is the Ratio of Males per 100 Females in Point Pleasant?
There are 99.66 Males per 100 Females in Point Pleasant.
What is the Ratio of Females per 100 Males in Point Pleasant?
There are 100.34 Females per 100 Males in Point Pleasant.
What is the Median Population Age in Point Pleasant?
Median Population Age in Point Pleasant is 44.5 Years.
What is the Average Family Size in Point Pleasant
Average Family Size in Point Pleasant is 3.1 People.
What is the Average Household Size in Point Pleasant
Average Household Size in Point Pleasant is 2.1 People.
How Large is the Labor Force in Point Pleasant?
There are 1,559 People in the Labor Forcein in Point Pleasant.
What is the Percentage of People in the Labor Force in Point Pleasant?
49.9% of People are in the Labor Force in Point Pleasant.
What is the Unemployment Rate in Point Pleasant?
Unemployment Rate in Point Pleasant is 3.3%.