Bath Berkeley Springs, WV Map & Demographics
Bath Berkeley Springs Map
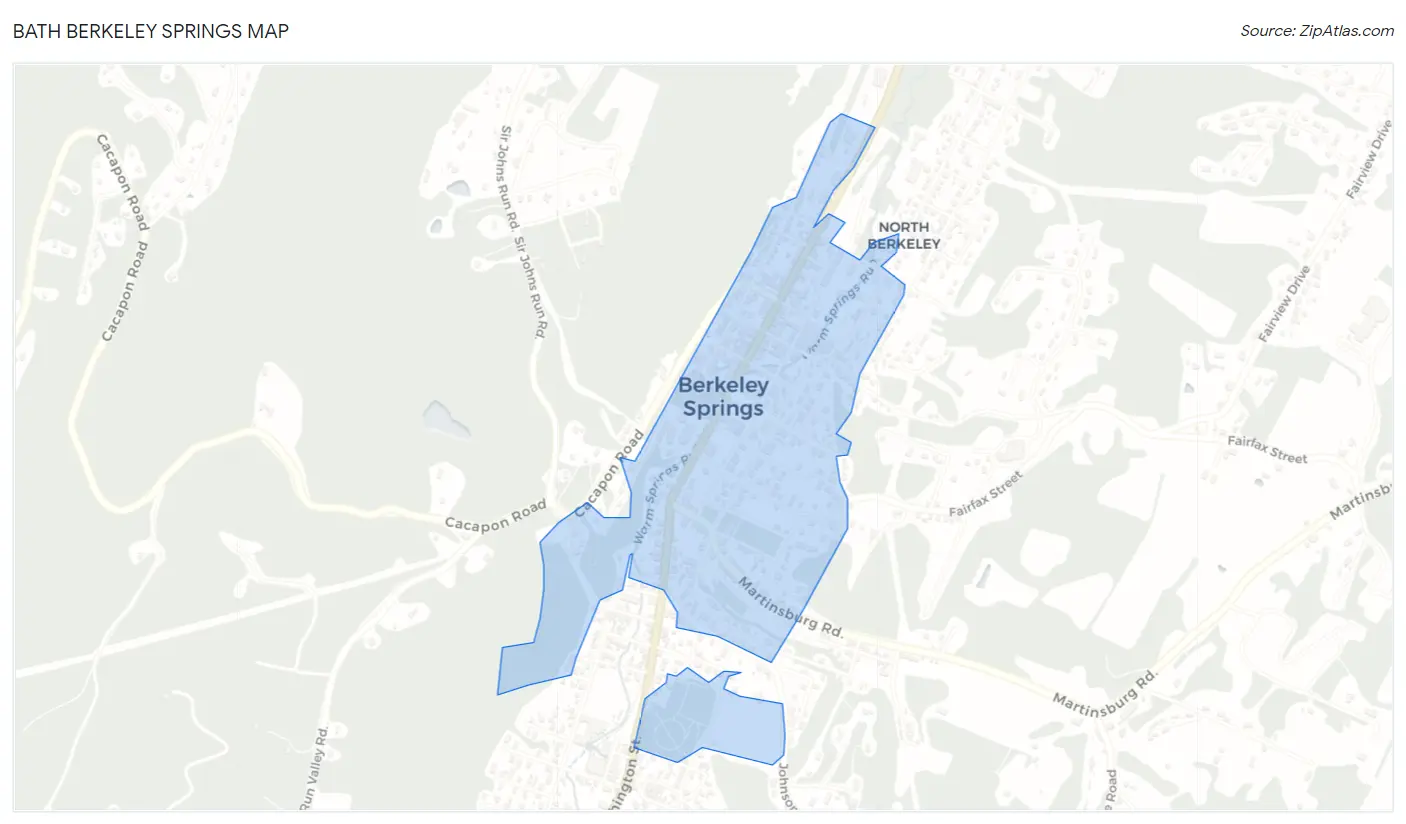
Bath Berkeley Springs Overview
$25,336
PER CAPITA INCOME
$53,250
AVG FAMILY INCOME
$31,094
AVG HOUSEHOLD INCOME
33.2%
WAGE / INCOME GAP [ % ]
66.8¢/ $1
WAGE / INCOME GAP [ $ ]
0.44
INEQUALITY / GINI INDEX
897
TOTAL POPULATION
487
MALE POPULATION
410
FEMALE POPULATION
118.78
MALES / 100 FEMALES
84.19
FEMALES / 100 MALES
47.4
MEDIAN AGE
2.9
AVG FAMILY SIZE
1.9
AVG HOUSEHOLD SIZE
322
LABOR FORCE [ PEOPLE ]
42.6%
PERCENT IN LABOR FORCE
2.2%
UNEMPLOYMENT RATE
Income in Bath Berkeley Springs
Income Overview in Bath Berkeley Springs
Per Capita Income in Bath Berkeley Springs is $25,336, while median incomes of families and households are $53,250 and $31,094 respectively.
| Characteristic | Number | Measure |
| Per Capita Income | 897 | $25,336 |
| Median Family Income | 187 | $53,250 |
| Mean Family Income | 187 | $61,650 |
| Median Household Income | 463 | $31,094 |
| Mean Household Income | 463 | $46,898 |
| Income Deficit | 187 | $0 |
| Wage / Income Gap (%) | 897 | 33.17% |
| Wage / Income Gap ($) | 897 | 66.83¢ per $1 |
| Gini / Inequality Index | 897 | 0.44 |
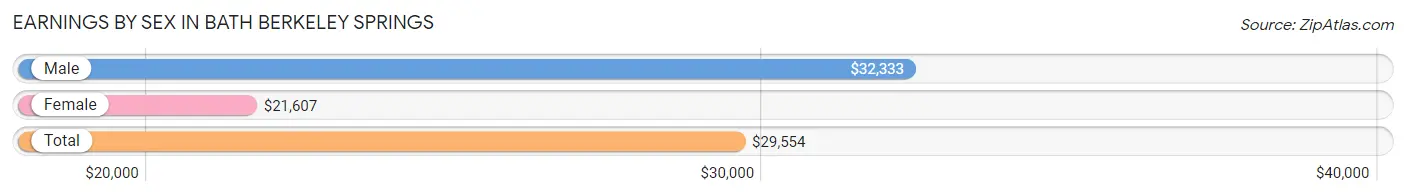
Earnings by Sex in Bath Berkeley Springs
Average Earnings in Bath Berkeley Springs are $29,554, $32,333 for men and $21,607 for women, a difference of 33.2%.
| Sex | Number | Average Earnings |
| Male | 222 (59.8%) | $32,333 |
| Female | 149 (40.2%) | $21,607 |
| Total | 371 (100.0%) | $29,554 |
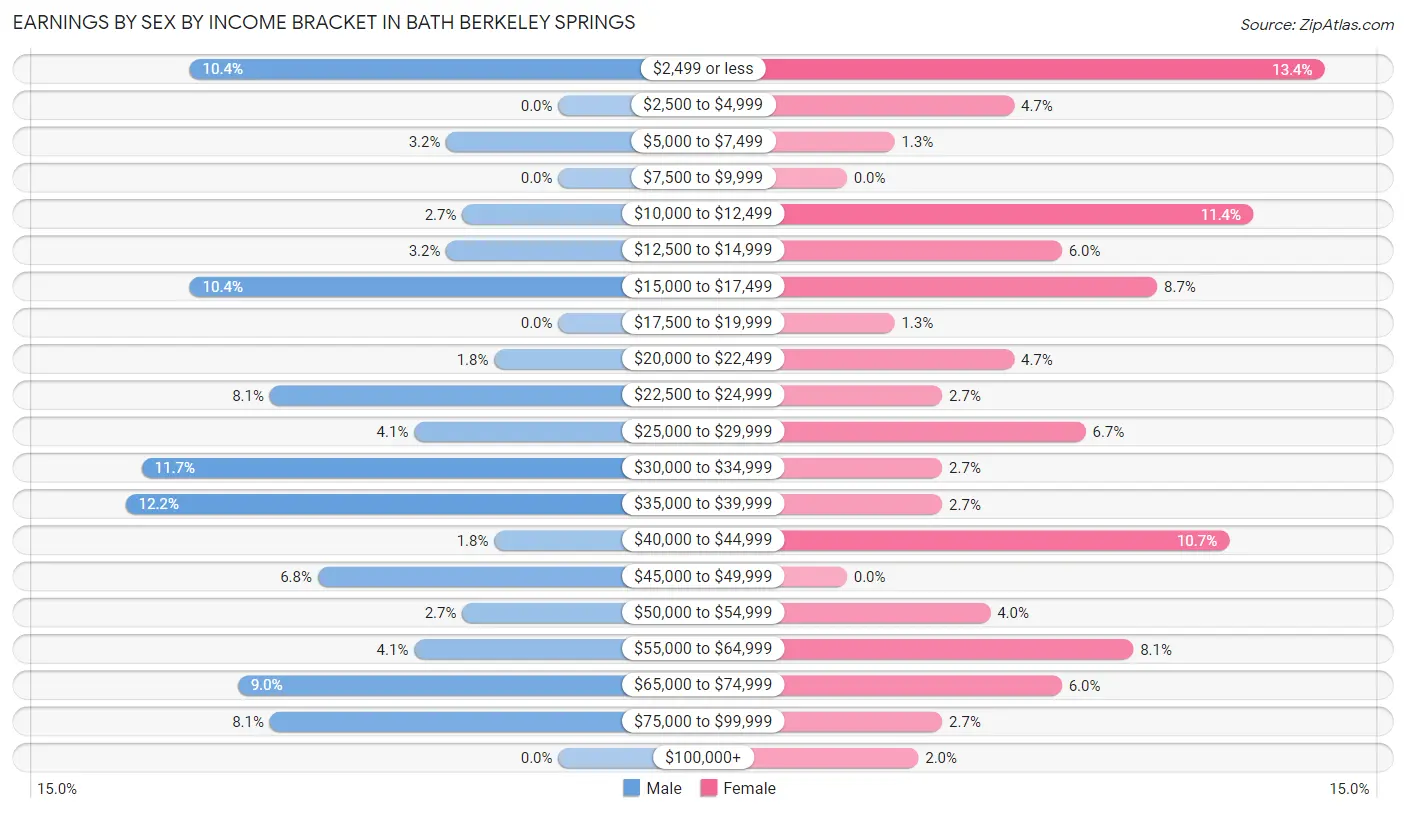
Earnings by Sex by Income Bracket in Bath Berkeley Springs
The most common earnings brackets in Bath Berkeley Springs are $35,000 to $39,999 for men (27 | 12.2%) and $2,499 or less for women (20 | 13.4%).
| Income | Male | Female |
| $2,499 or less | 23 (10.4%) | 20 (13.4%) |
| $2,500 to $4,999 | 0 (0.0%) | 7 (4.7%) |
| $5,000 to $7,499 | 7 (3.2%) | 2 (1.3%) |
| $7,500 to $9,999 | 0 (0.0%) | 0 (0.0%) |
| $10,000 to $12,499 | 6 (2.7%) | 17 (11.4%) |
| $12,500 to $14,999 | 7 (3.2%) | 9 (6.0%) |
| $15,000 to $17,499 | 23 (10.4%) | 13 (8.7%) |
| $17,500 to $19,999 | 0 (0.0%) | 2 (1.3%) |
| $20,000 to $22,499 | 4 (1.8%) | 7 (4.7%) |
| $22,500 to $24,999 | 18 (8.1%) | 4 (2.7%) |
| $25,000 to $29,999 | 9 (4.1%) | 10 (6.7%) |
| $30,000 to $34,999 | 26 (11.7%) | 4 (2.7%) |
| $35,000 to $39,999 | 27 (12.2%) | 4 (2.7%) |
| $40,000 to $44,999 | 4 (1.8%) | 16 (10.7%) |
| $45,000 to $49,999 | 15 (6.8%) | 0 (0.0%) |
| $50,000 to $54,999 | 6 (2.7%) | 6 (4.0%) |
| $55,000 to $64,999 | 9 (4.1%) | 12 (8.1%) |
| $65,000 to $74,999 | 20 (9.0%) | 9 (6.0%) |
| $75,000 to $99,999 | 18 (8.1%) | 4 (2.7%) |
| $100,000+ | 0 (0.0%) | 3 (2.0%) |
| Total | 222 (100.0%) | 149 (100.0%) |
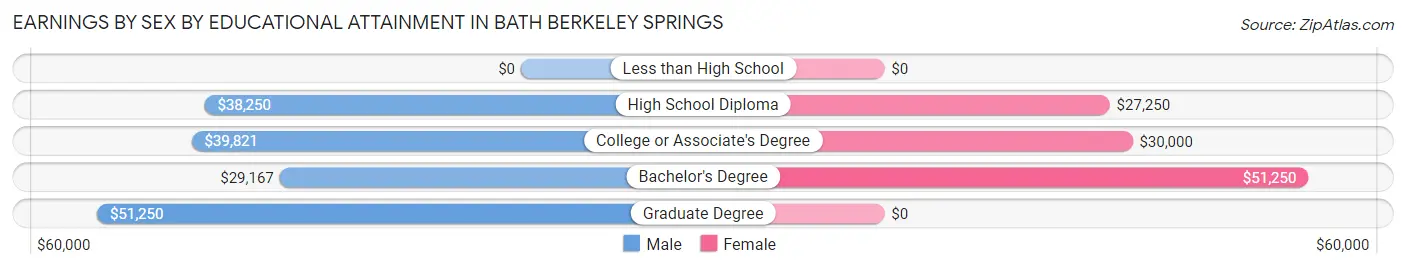
Earnings by Sex by Educational Attainment in Bath Berkeley Springs
Average earnings in Bath Berkeley Springs are $37,734 for men and $38,438 for women, a difference of 1.8%. Men with an educational attainment of graduate degree enjoy the highest average annual earnings of $51,250, while those with bachelor's degree education earn the least with $29,167. Women with an educational attainment of bachelor's degree earn the most with the average annual earnings of $51,250, while those with high school diploma education have the smallest earnings of $27,250.
| Educational Attainment | Male Income | Female Income |
| Less than High School | - | - |
| High School Diploma | $38,250 | $27,250 |
| College or Associate's Degree | $39,821 | $30,000 |
| Bachelor's Degree | $29,167 | $51,250 |
| Graduate Degree | $51,250 | $0 |
| Total | $37,734 | $38,438 |
Family Income in Bath Berkeley Springs
Family Income Brackets in Bath Berkeley Springs
According to the Bath Berkeley Springs family income data, there are 42 families falling into the $100,000 to $149,999 income range, which is the most common income bracket and makes up 22.5% of all families.
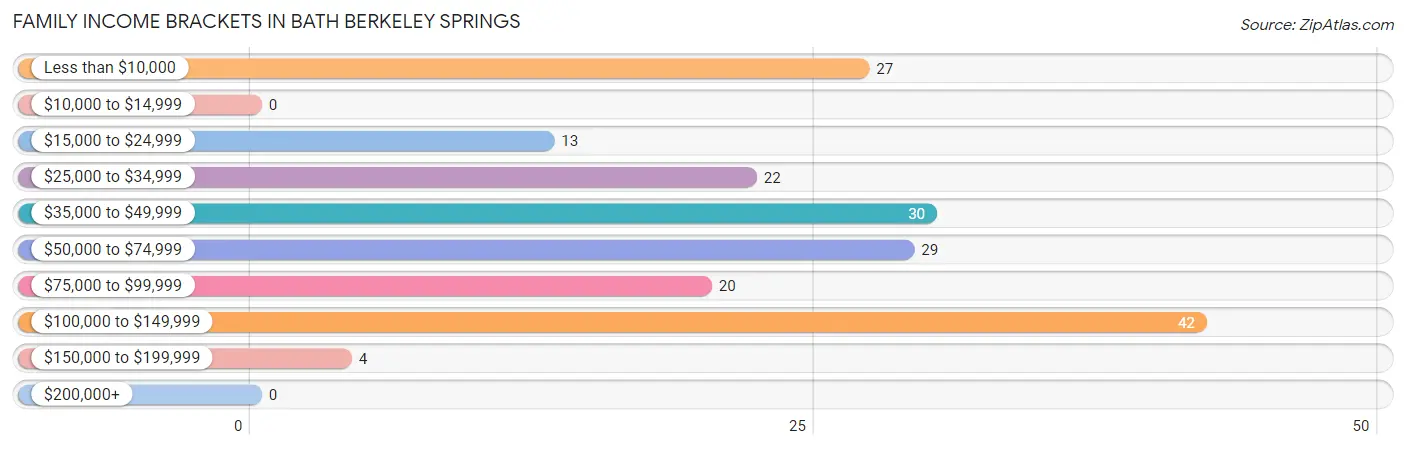
| Income Bracket | # Families | % Families |
| Less than $10,000 | 27 | 14.4% |
| $10,000 to $14,999 | 0 | 0.0% |
| $15,000 to $24,999 | 13 | 7.0% |
| $25,000 to $34,999 | 22 | 11.8% |
| $35,000 to $49,999 | 30 | 16.0% |
| $50,000 to $74,999 | 29 | 15.5% |
| $75,000 to $99,999 | 20 | 10.7% |
| $100,000 to $149,999 | 42 | 22.5% |
| $150,000 to $199,999 | 4 | 2.1% |
| $200,000+ | 0 | 0.0% |
Family Income by Famaliy Size in Bath Berkeley Springs
3-person families (26 | 13.9%) account for the highest median family income in Bath Berkeley Springs with $127,750 per family, while 3-person families (26 | 13.9%) have the highest median income of $42,583 per family member.
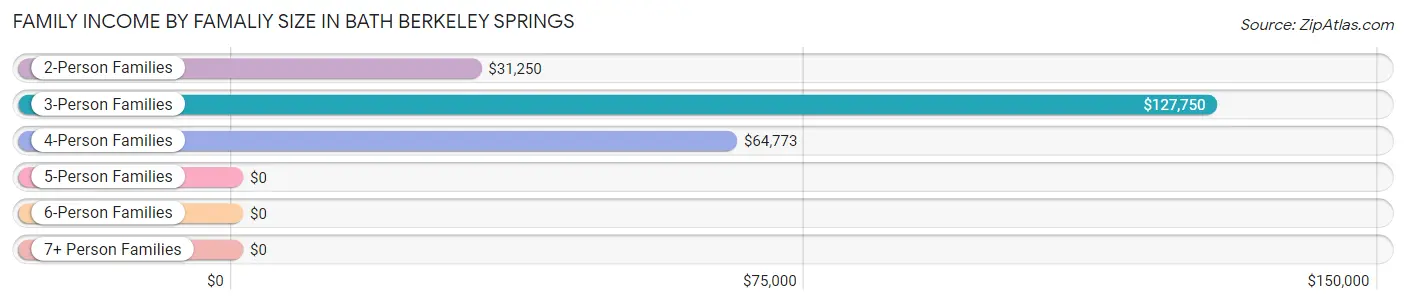
| Income Bracket | # Families | Median Income |
| 2-Person Families | 111 (59.4%) | $31,250 |
| 3-Person Families | 26 (13.9%) | $127,750 |
| 4-Person Families | 42 (22.5%) | $64,773 |
| 5-Person Families | 3 (1.6%) | $0 |
| 6-Person Families | 0 (0.0%) | $0 |
| 7+ Person Families | 5 (2.7%) | $0 |
| Total | 187 (100.0%) | $53,250 |
Family Income by Number of Earners in Bath Berkeley Springs
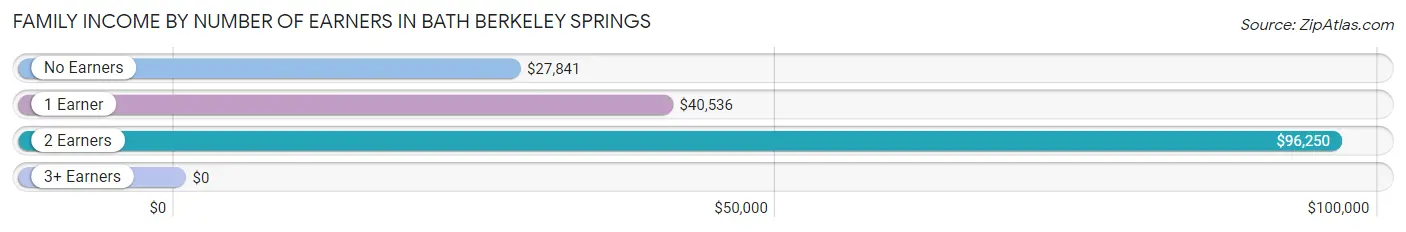
| Number of Earners | # Families | Median Income |
| No Earners | 43 (23.0%) | $27,841 |
| 1 Earner | 78 (41.7%) | $40,536 |
| 2 Earners | 49 (26.2%) | $96,250 |
| 3+ Earners | 17 (9.1%) | $0 |
| Total | 187 (100.0%) | $53,250 |
Household Income in Bath Berkeley Springs
Household Income Brackets in Bath Berkeley Springs
With 126 households falling in the category, the $15,000 to $24,999 income range is the most frequent in Bath Berkeley Springs, accounting for 27.2% of all households.
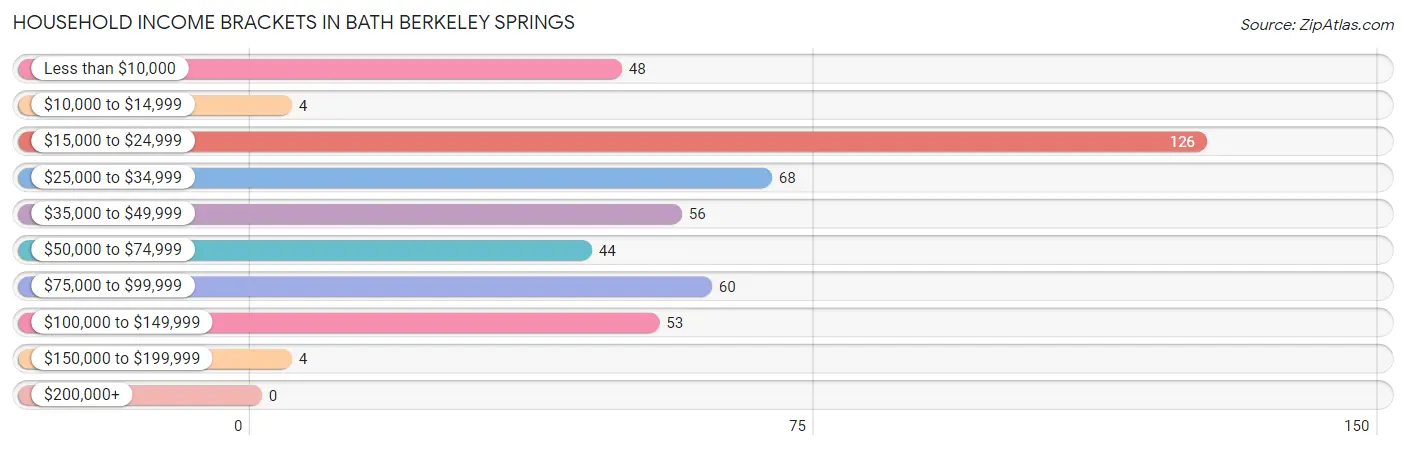
| Income Bracket | # Households | % Households |
| Less than $10,000 | 48 | 10.4% |
| $10,000 to $14,999 | 4 | 0.9% |
| $15,000 to $24,999 | 126 | 27.2% |
| $25,000 to $34,999 | 68 | 14.7% |
| $35,000 to $49,999 | 56 | 12.1% |
| $50,000 to $74,999 | 44 | 9.5% |
| $75,000 to $99,999 | 60 | 13.0% |
| $100,000 to $149,999 | 53 | 11.4% |
| $150,000 to $199,999 | 4 | 0.9% |
| $200,000+ | 0 | 0.0% |
Household Income by Householder Age in Bath Berkeley Springs
The median household income in Bath Berkeley Springs is $31,094, with the highest median household income of $65,417 found in the 25 to 44 years age bracket for the primary householder. A total of 76 households (16.4%) fall into this category. Meanwhile, the 15 to 24 years age bracket for the primary householder has the lowest median household income of $16,300, with 54 households (11.7%) in this group.
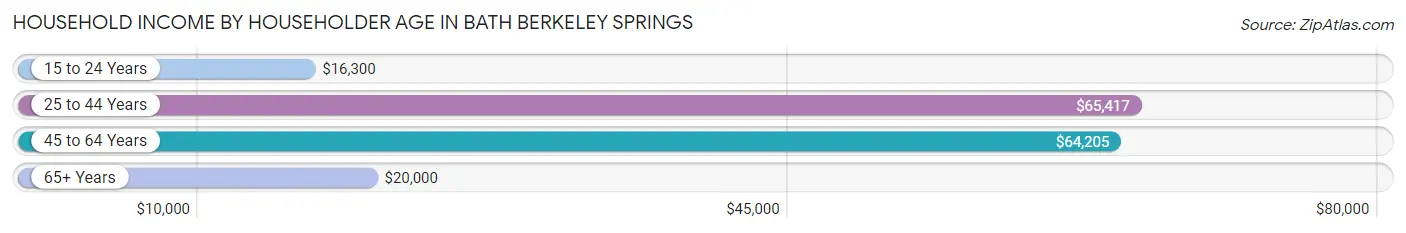
| Income Bracket | # Households | Median Income |
| 15 to 24 Years | 54 (11.7%) | $16,300 |
| 25 to 44 Years | 76 (16.4%) | $65,417 |
| 45 to 64 Years | 127 (27.4%) | $64,205 |
| 65+ Years | 206 (44.5%) | $20,000 |
| Total | 463 (100.0%) | $31,094 |
Poverty in Bath Berkeley Springs
Income Below Poverty by Sex and Age in Bath Berkeley Springs
With 13.1% poverty level for males and 24.3% for females among the residents of Bath Berkeley Springs, under 5 year old males and 18 to 24 year old females are the most vulnerable to poverty, with 15 males (78.9%) and 44 females (93.6%) in their respective age groups living below the poverty level.
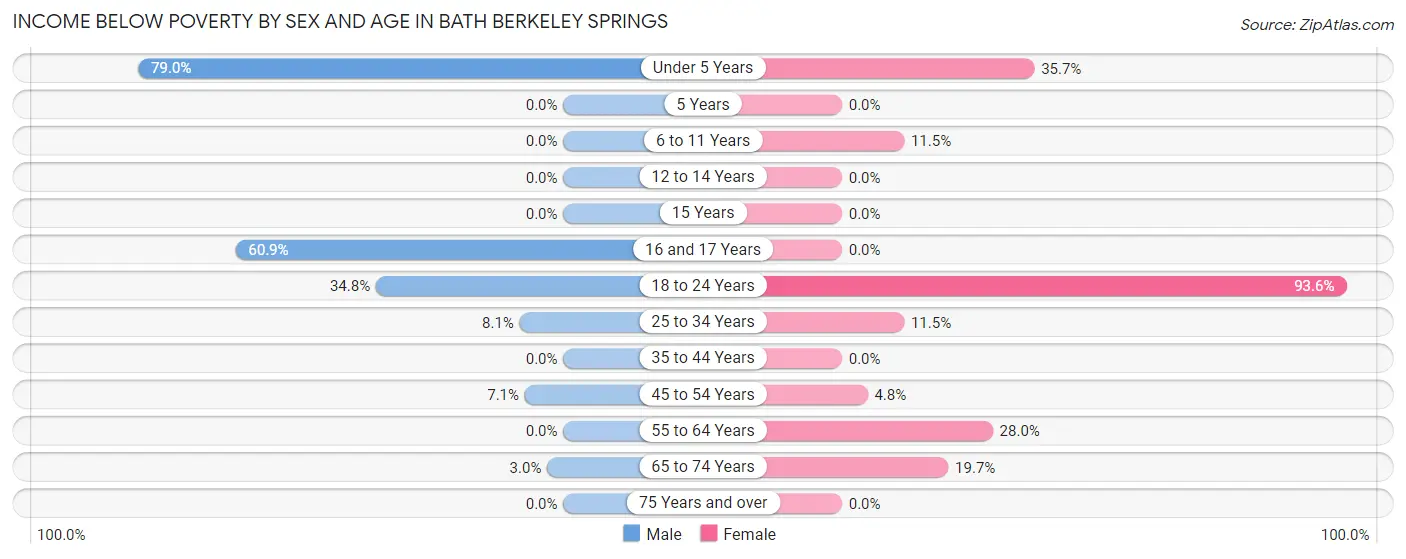
| Age Bracket | Male | Female |
| Under 5 Years | 15 (78.9%) | 5 (35.7%) |
| 5 Years | 0 (0.0%) | 0 (0.0%) |
| 6 to 11 Years | 0 (0.0%) | 3 (11.5%) |
| 12 to 14 Years | 0 (0.0%) | 0 (0.0%) |
| 15 Years | 0 (0.0%) | 0 (0.0%) |
| 16 and 17 Years | 14 (60.9%) | 0 (0.0%) |
| 18 to 24 Years | 24 (34.8%) | 44 (93.6%) |
| 25 to 34 Years | 3 (8.1%) | 3 (11.5%) |
| 35 to 44 Years | 0 (0.0%) | 0 (0.0%) |
| 45 to 54 Years | 4 (7.1%) | 1 (4.8%) |
| 55 to 64 Years | 0 (0.0%) | 21 (28.0%) |
| 65 to 74 Years | 4 (3.0%) | 15 (19.7%) |
| 75 Years and over | 0 (0.0%) | 0 (0.0%) |
| Total | 64 (13.1%) | 92 (24.3%) |
Income Above Poverty by Sex and Age in Bath Berkeley Springs
According to the poverty statistics in Bath Berkeley Springs, males aged 5 years and females aged 12 to 14 years are the age groups that are most secure financially, with 100.0% of males and 100.0% of females in these age groups living above the poverty line.
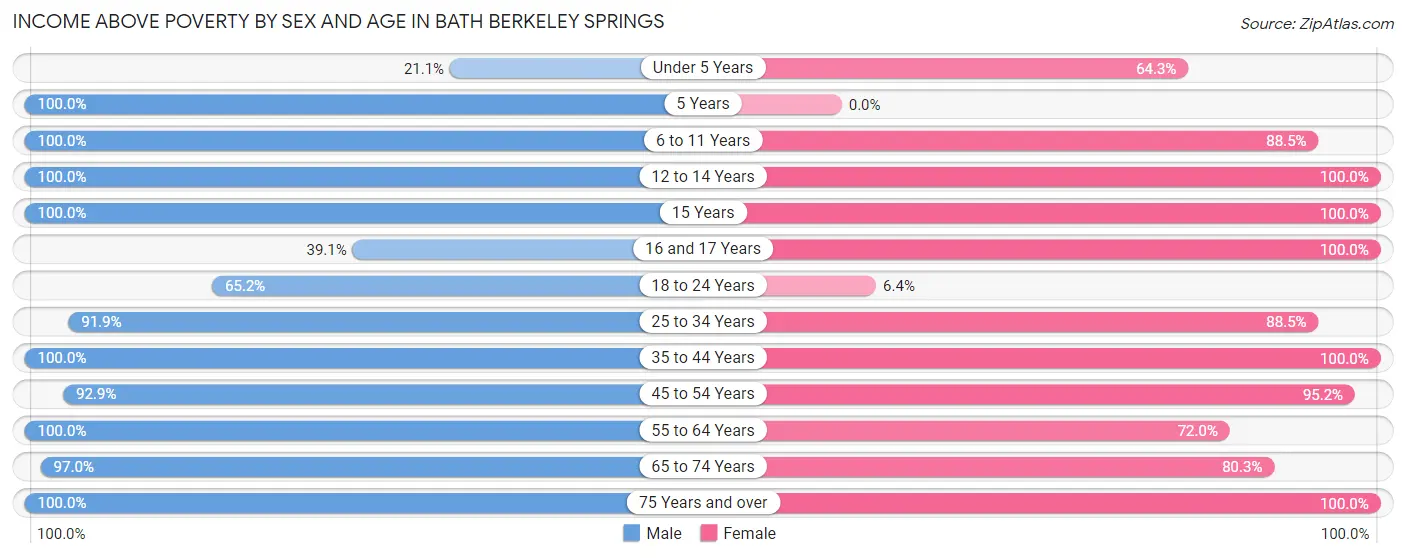
| Age Bracket | Male | Female |
| Under 5 Years | 4 (21.0%) | 9 (64.3%) |
| 5 Years | 9 (100.0%) | 0 (0.0%) |
| 6 to 11 Years | 18 (100.0%) | 23 (88.5%) |
| 12 to 14 Years | 6 (100.0%) | 11 (100.0%) |
| 15 Years | 2 (100.0%) | 5 (100.0%) |
| 16 and 17 Years | 9 (39.1%) | 3 (100.0%) |
| 18 to 24 Years | 45 (65.2%) | 3 (6.4%) |
| 25 to 34 Years | 34 (91.9%) | 23 (88.5%) |
| 35 to 44 Years | 36 (100.0%) | 47 (100.0%) |
| 45 to 54 Years | 52 (92.9%) | 20 (95.2%) |
| 55 to 64 Years | 38 (100.0%) | 54 (72.0%) |
| 65 to 74 Years | 130 (97.0%) | 61 (80.3%) |
| 75 Years and over | 40 (100.0%) | 28 (100.0%) |
| Total | 423 (86.9%) | 287 (75.7%) |
Income Below Poverty Among Married-Couple Families in Bath Berkeley Springs
The poverty statistics for married-couple families in Bath Berkeley Springs show that 2.7% or 3 of the total 111 families live below the poverty line. Families with 1 or 2 children have the highest poverty rate of 5.7%, comprising of 3 families. On the other hand, families with no children have the lowest poverty rate of 0.0%, which includes 0 families.
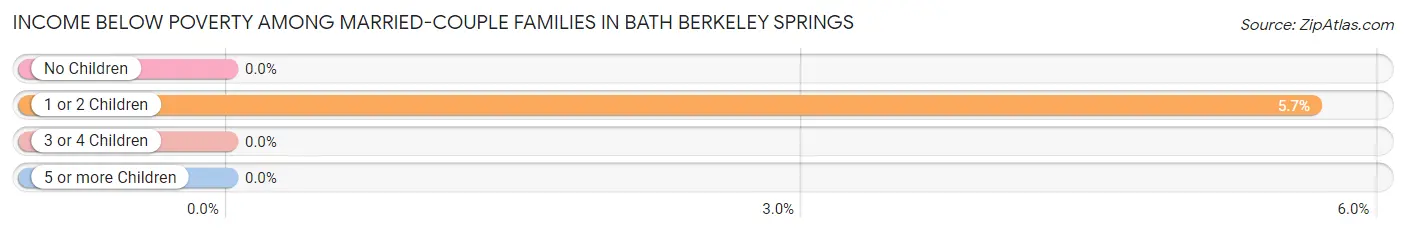
| Children | Above Poverty | Below Poverty |
| No Children | 53 (100.0%) | 0 (0.0%) |
| 1 or 2 Children | 50 (94.3%) | 3 (5.7%) |
| 3 or 4 Children | 5 (100.0%) | 0 (0.0%) |
| 5 or more Children | 0 (0.0%) | 0 (0.0%) |
| Total | 108 (97.3%) | 3 (2.7%) |
Income Below Poverty Among Single-Parent Households in Bath Berkeley Springs
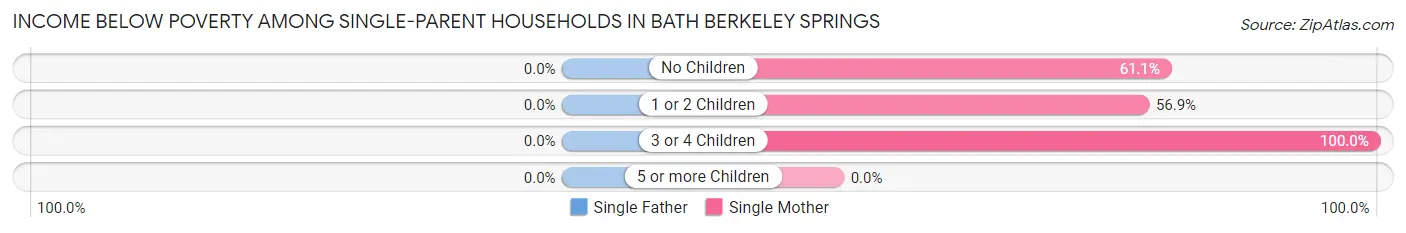
| Children | Single Father | Single Mother |
| No Children | 0 (0.0%) | 11 (61.1%) |
| 1 or 2 Children | 0 (0.0%) | 29 (56.9%) |
| 3 or 4 Children | 0 (0.0%) | 3 (100.0%) |
| 5 or more Children | 0 (0.0%) | 0 (0.0%) |
| Total | 0 (0.0%) | 43 (59.7%) |
Income Below Poverty Among Married-Couple vs Single-Parent Households in Bath Berkeley Springs
The poverty data for Bath Berkeley Springs shows that 3 of the married-couple family households (2.7%) and 43 of the single-parent households (56.6%) are living below the poverty level. Within the married-couple family households, those with 1 or 2 children have the highest poverty rate, with 3 households (5.7%) falling below the poverty line. Among the single-parent households, those with 3 or 4 children have the highest poverty rate, with 3 household (100.0%) living below poverty.
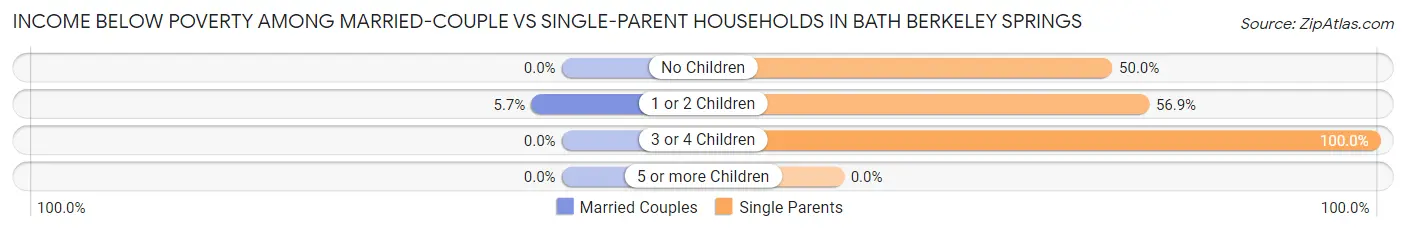
| Children | Married-Couple Families | Single-Parent Households |
| No Children | 0 (0.0%) | 11 (50.0%) |
| 1 or 2 Children | 3 (5.7%) | 29 (56.9%) |
| 3 or 4 Children | 0 (0.0%) | 3 (100.0%) |
| 5 or more Children | 0 (0.0%) | 0 (0.0%) |
| Total | 3 (2.7%) | 43 (56.6%) |
Race in Bath Berkeley Springs
The most populous races in Bath Berkeley Springs are White / Caucasian (775 | 86.4%), Some other Race (99 | 11.0%), and Hispanic or Latino (78 | 8.7%).
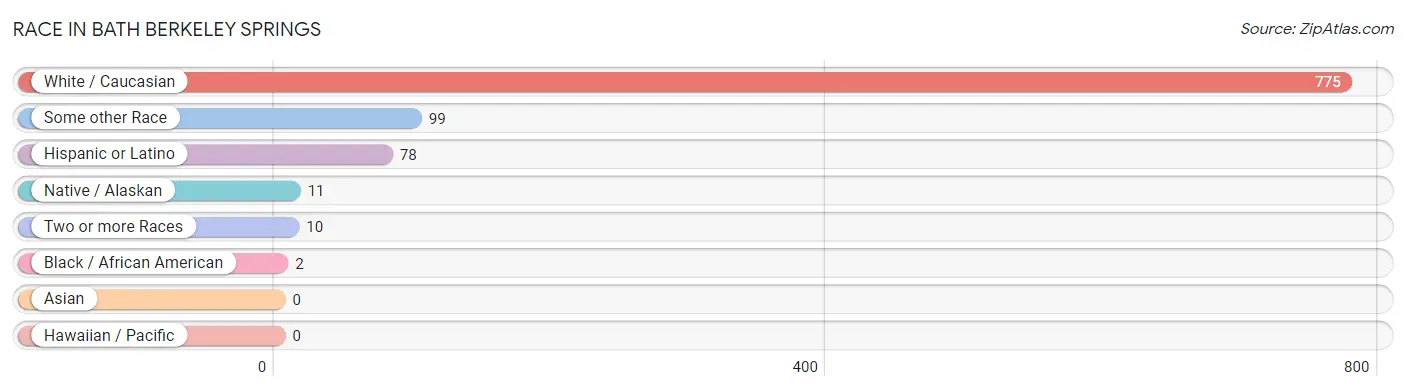
| Race | # Population | % Population |
| Asian | 0 | 0.0% |
| Black / African American | 2 | 0.2% |
| Hawaiian / Pacific | 0 | 0.0% |
| Hispanic or Latino | 78 | 8.7% |
| Native / Alaskan | 11 | 1.2% |
| White / Caucasian | 775 | 86.4% |
| Two or more Races | 10 | 1.1% |
| Some other Race | 99 | 11.0% |
| Total | 897 | 100.0% |
Ancestry in Bath Berkeley Springs
The most populous ancestries reported in Bath Berkeley Springs are German (122 | 13.6%), Irish (102 | 11.4%), English (72 | 8.0%), American (66 | 7.4%), and Mexican (38 | 4.2%), together accounting for 44.6% of all Bath Berkeley Springs residents.
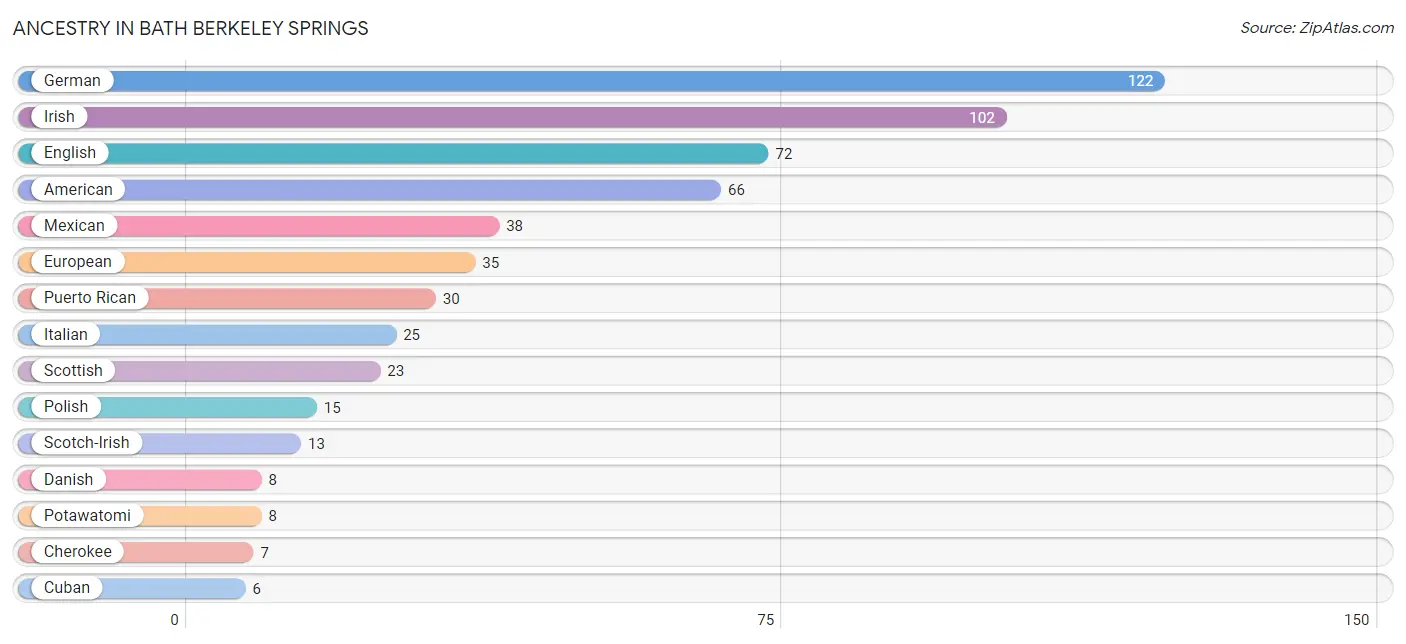
| Ancestry | # Population | % Population |
| American | 66 | 7.4% |
| British | 5 | 0.6% |
| Cherokee | 7 | 0.8% |
| Chilean | 4 | 0.4% |
| Cuban | 6 | 0.7% |
| Danish | 8 | 0.9% |
| Dutch | 1 | 0.1% |
| English | 72 | 8.0% |
| European | 35 | 3.9% |
| German | 122 | 13.6% |
| Irish | 102 | 11.4% |
| Italian | 25 | 2.8% |
| Latvian | 4 | 0.4% |
| Mexican | 38 | 4.2% |
| Nigerian | 1 | 0.1% |
| Polish | 15 | 1.7% |
| Potawatomi | 8 | 0.9% |
| Puerto Rican | 30 | 3.3% |
| Romanian | 4 | 0.4% |
| Scandinavian | 4 | 0.4% |
| Scotch-Irish | 13 | 1.5% |
| Scottish | 23 | 2.6% |
| Slovak | 3 | 0.3% |
| South American | 4 | 0.4% |
| Subsaharan African | 1 | 0.1% |
| Swiss | 5 | 0.6% |
| Yugoslavian | 3 | 0.3% | View All 27 Rows |
Immigrants in Bath Berkeley Springs

| Immigration Origin | # Population | % Population | View All 0 Rows |
Sex and Age in Bath Berkeley Springs
Sex and Age in Bath Berkeley Springs
The most populous age groups in Bath Berkeley Springs are 70 to 74 Years (118 | 24.2%) for men and 10 to 14 Years (65 | 15.9%) for women.
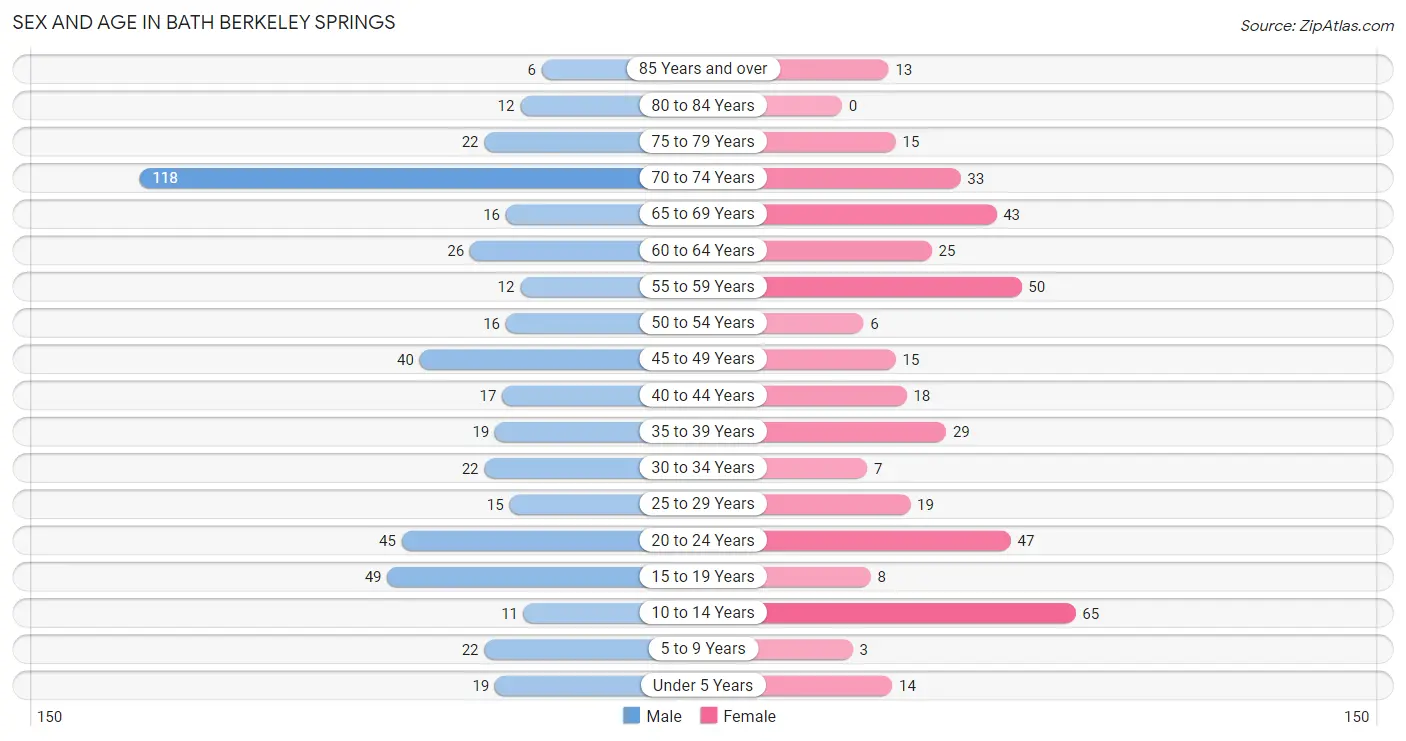
| Age Bracket | Male | Female |
| Under 5 Years | 19 (3.9%) | 14 (3.4%) |
| 5 to 9 Years | 22 (4.5%) | 3 (0.7%) |
| 10 to 14 Years | 11 (2.3%) | 65 (15.9%) |
| 15 to 19 Years | 49 (10.1%) | 8 (1.9%) |
| 20 to 24 Years | 45 (9.2%) | 47 (11.5%) |
| 25 to 29 Years | 15 (3.1%) | 19 (4.6%) |
| 30 to 34 Years | 22 (4.5%) | 7 (1.7%) |
| 35 to 39 Years | 19 (3.9%) | 29 (7.1%) |
| 40 to 44 Years | 17 (3.5%) | 18 (4.4%) |
| 45 to 49 Years | 40 (8.2%) | 15 (3.7%) |
| 50 to 54 Years | 16 (3.3%) | 6 (1.5%) |
| 55 to 59 Years | 12 (2.5%) | 50 (12.2%) |
| 60 to 64 Years | 26 (5.3%) | 25 (6.1%) |
| 65 to 69 Years | 16 (3.3%) | 43 (10.5%) |
| 70 to 74 Years | 118 (24.2%) | 33 (8.1%) |
| 75 to 79 Years | 22 (4.5%) | 15 (3.7%) |
| 80 to 84 Years | 12 (2.5%) | 0 (0.0%) |
| 85 Years and over | 6 (1.2%) | 13 (3.2%) |
| Total | 487 (100.0%) | 410 (100.0%) |
Families and Households in Bath Berkeley Springs
Median Family Size in Bath Berkeley Springs
The median family size in Bath Berkeley Springs is 2.93 persons per family, with single male/father families (4 | 2.1%) accounting for the largest median family size of 4.75 persons per family. On the other hand, single female/mother families (72 | 38.5%) represent the smallest median family size with 2.60 persons per family.
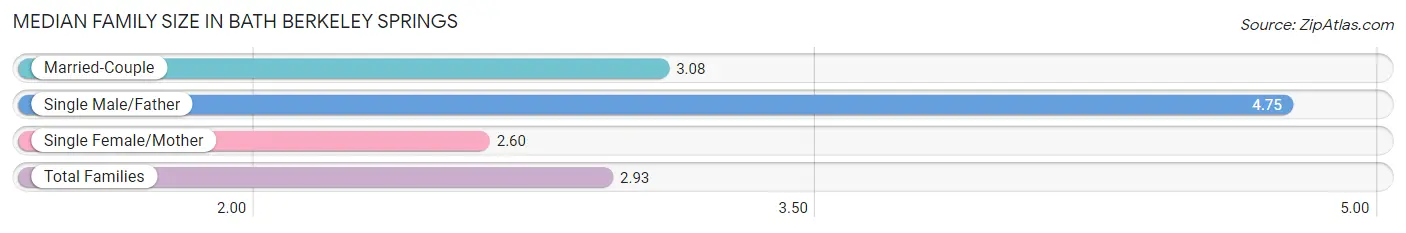
| Family Type | # Families | Family Size |
| Married-Couple | 111 (59.4%) | 3.08 |
| Single Male/Father | 4 (2.1%) | 4.75 |
| Single Female/Mother | 72 (38.5%) | 2.60 |
| Total Families | 187 (100.0%) | 2.93 |
Median Household Size in Bath Berkeley Springs
The median household size in Bath Berkeley Springs is 1.94 persons per household, with single male/father households (4 | 0.9%) accounting for the largest median household size of 4.75 persons per household. non-family households (276 | 59.6%) represent the smallest median household size with 1.20 persons per household.
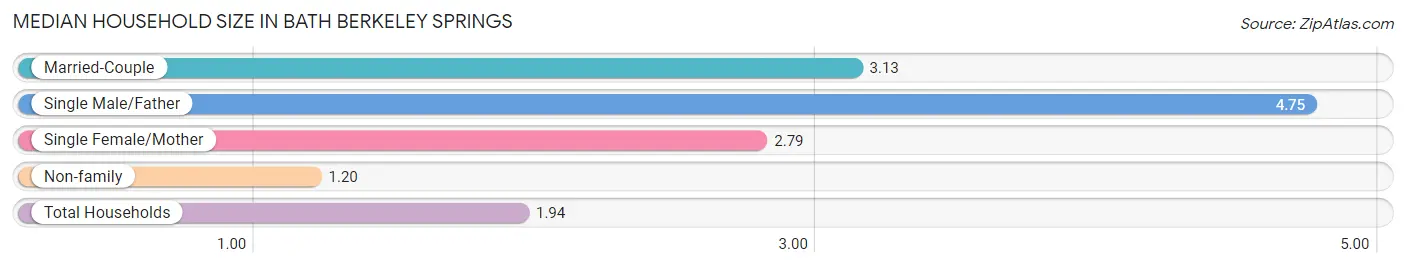
| Household Type | # Households | Household Size |
| Married-Couple | 111 (24.0%) | 3.13 |
| Single Male/Father | 4 (0.9%) | 4.75 |
| Single Female/Mother | 72 (15.5%) | 2.79 |
| Non-family | 276 (59.6%) | 1.20 |
| Total Households | 463 (100.0%) | 1.94 |
Household Size by Marriage Status in Bath Berkeley Springs
Out of a total of 463 households in Bath Berkeley Springs, 187 (40.4%) are family households, while 276 (59.6%) are nonfamily households. The most numerous type of family households are 2-person households, comprising 100, and the most common type of nonfamily households are 1-person households, comprising 241.
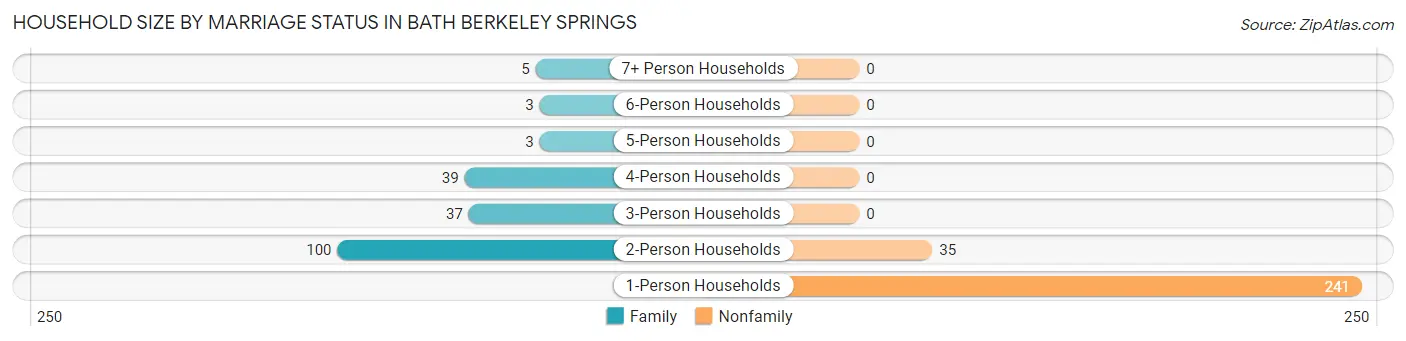
| Household Size | Family Households | Nonfamily Households |
| 1-Person Households | - | 241 (52.0%) |
| 2-Person Households | 100 (21.6%) | 35 (7.6%) |
| 3-Person Households | 37 (8.0%) | 0 (0.0%) |
| 4-Person Households | 39 (8.4%) | 0 (0.0%) |
| 5-Person Households | 3 (0.6%) | 0 (0.0%) |
| 6-Person Households | 3 (0.6%) | 0 (0.0%) |
| 7+ Person Households | 5 (1.1%) | 0 (0.0%) |
| Total | 187 (40.4%) | 276 (59.6%) |
Female Fertility in Bath Berkeley Springs
Fertility by Age in Bath Berkeley Springs
Average fertility rate in Bath Berkeley Springs is 63.0 births per 1,000 women. Women in the age bracket of 20 to 34 years have the highest fertility rate with 123.0 births per 1,000 women. Women in the age bracket of 20 to 34 years acount for 100.0% of all women with births.
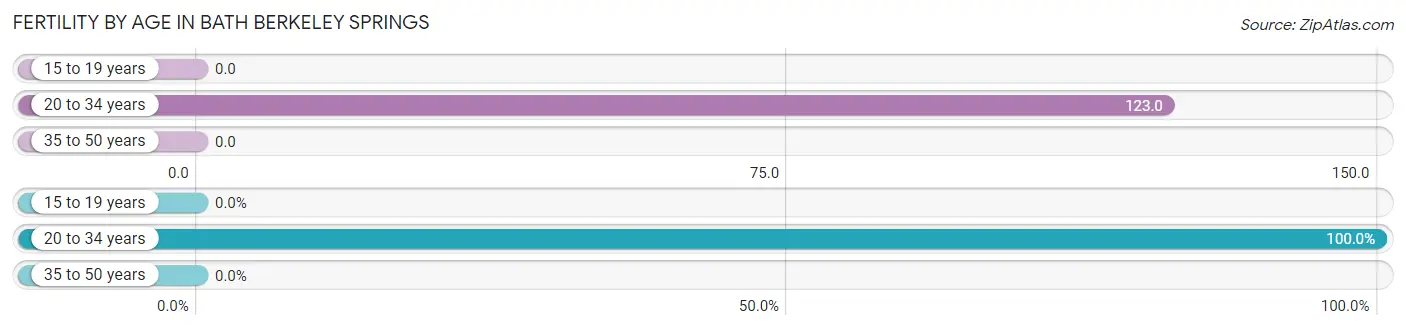
| Age Bracket | Women with Births | Births / 1,000 Women |
| 15 to 19 years | 0 (0.0%) | 0.0 |
| 20 to 34 years | 9 (100.0%) | 123.0 |
| 35 to 50 years | 0 (0.0%) | 0.0 |
| Total | 9 (100.0%) | 63.0 |
Fertility by Age by Marriage Status in Bath Berkeley Springs
66.7% of women with births (9) in Bath Berkeley Springs are married. The highest percentage of unmarried women with births falls into 20 to 34 years age bracket with 33.3% of them unmarried at the time of birth, while the lowest percentage of unmarried women with births belong to 20 to 34 years age bracket with 33.3% of them unmarried.
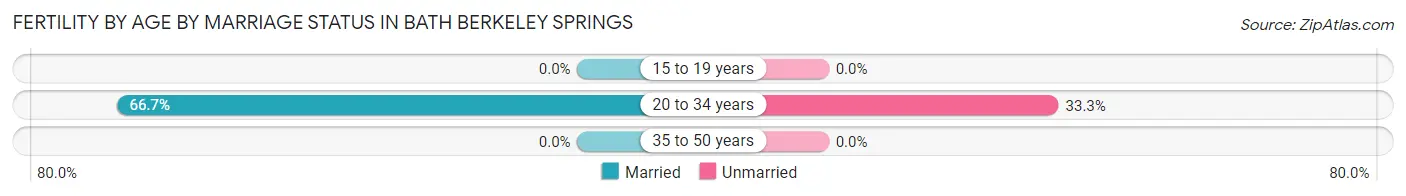
| Age Bracket | Married | Unmarried |
| 15 to 19 years | 0 (0.0%) | 0 (0.0%) |
| 20 to 34 years | 6 (66.7%) | 3 (33.3%) |
| 35 to 50 years | 0 (0.0%) | 0 (0.0%) |
| Total | 6 (66.7%) | 3 (33.3%) |
Fertility by Education in Bath Berkeley Springs
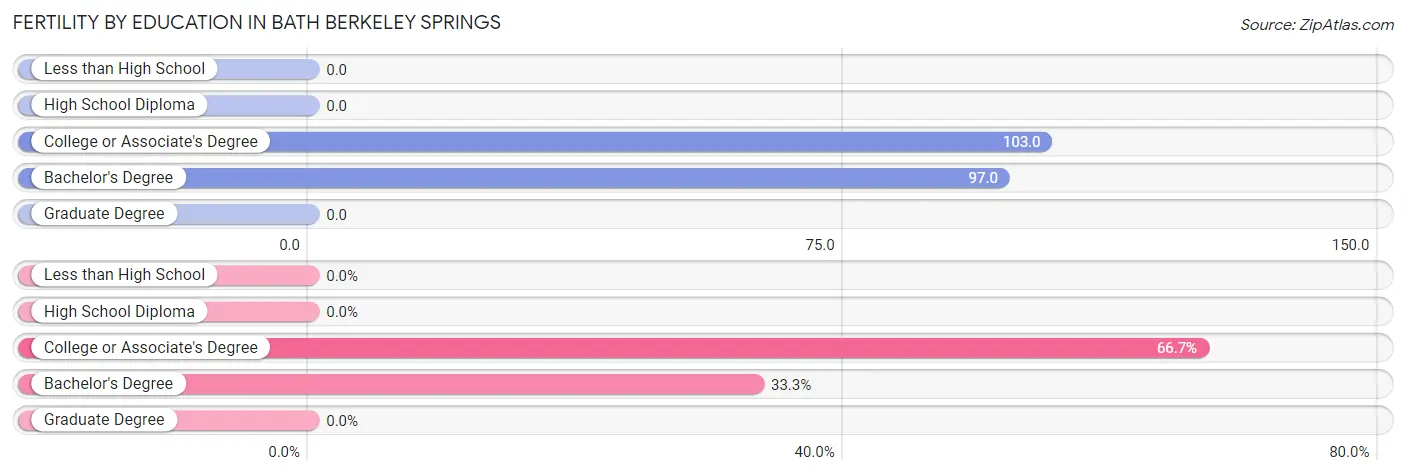
| Educational Attainment | Women with Births | Births / 1,000 Women |
| Less than High School | 0 (0.0%) | 0.0 |
| High School Diploma | 0 (0.0%) | 0.0 |
| College or Associate's Degree | 6 (66.7%) | 103.0 |
| Bachelor's Degree | 3 (33.3%) | 97.0 |
| Graduate Degree | 0 (0.0%) | 0.0 |
| Total | 9 (100.0%) | 63.0 |
Fertility by Education by Marriage Status in Bath Berkeley Springs
33.3% of women with births in Bath Berkeley Springs are unmarried. Women with the educational attainment of bachelor's degree are most likely to be married with 100.0% of them married at childbirth, while women with the educational attainment of college or associate's degree are least likely to be married with 50.0% of them unmarried at childbirth.
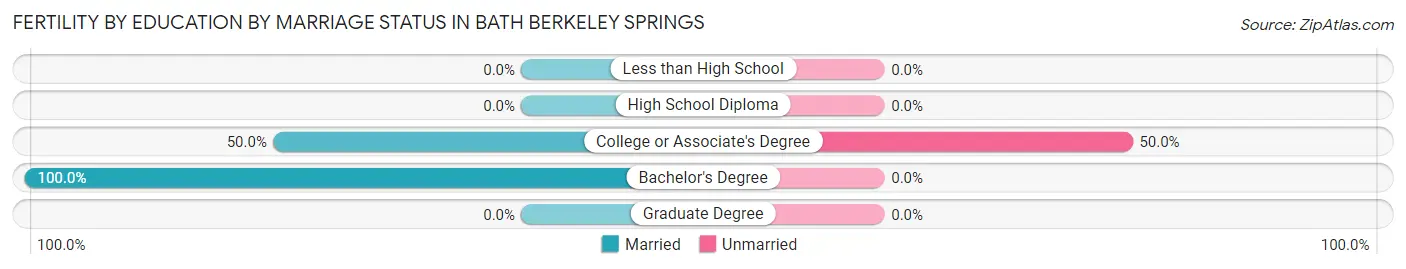
| Educational Attainment | Married | Unmarried |
| Less than High School | 0 (0.0%) | 0 (0.0%) |
| High School Diploma | 0 (0.0%) | 0 (0.0%) |
| College or Associate's Degree | 3 (50.0%) | 3 (50.0%) |
| Bachelor's Degree | 3 (100.0%) | 0 (0.0%) |
| Graduate Degree | 0 (0.0%) | 0 (0.0%) |
| Total | 6 (66.7%) | 3 (33.3%) |
Employment Characteristics in Bath Berkeley Springs
Employment by Class of Employer in Bath Berkeley Springs
Among the 307 employed individuals in Bath Berkeley Springs, private company employees (185 | 60.3%), state government employees (36 | 11.7%), and self-employed (incorporated) (24 | 7.8%) make up the most common classes of employment.
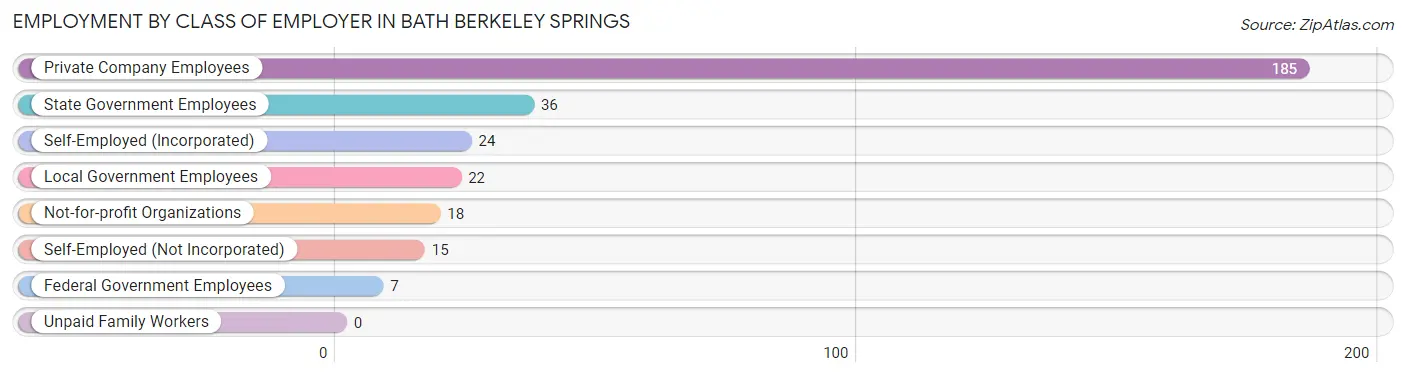
| Employer Class | # Employees | % Employees |
| Private Company Employees | 185 | 60.3% |
| Self-Employed (Incorporated) | 24 | 7.8% |
| Self-Employed (Not Incorporated) | 15 | 4.9% |
| Not-for-profit Organizations | 18 | 5.9% |
| Local Government Employees | 22 | 7.2% |
| State Government Employees | 36 | 11.7% |
| Federal Government Employees | 7 | 2.3% |
| Unpaid Family Workers | 0 | 0.0% |
| Total | 307 | 100.0% |
Employment Status by Age in Bath Berkeley Springs
According to the labor force statistics for Bath Berkeley Springs, out of the total population over 16 years of age (756), 42.6% or 322 individuals are in the labor force, with 2.2% or 7 of them unemployed. The age group with the highest labor force participation rate is 25 to 29 years, with 88.2% or 30 individuals in the labor force. Within the labor force, the 25 to 29 years age range has the highest percentage of unemployed individuals, with 13.3% or 4 of them being unemployed.
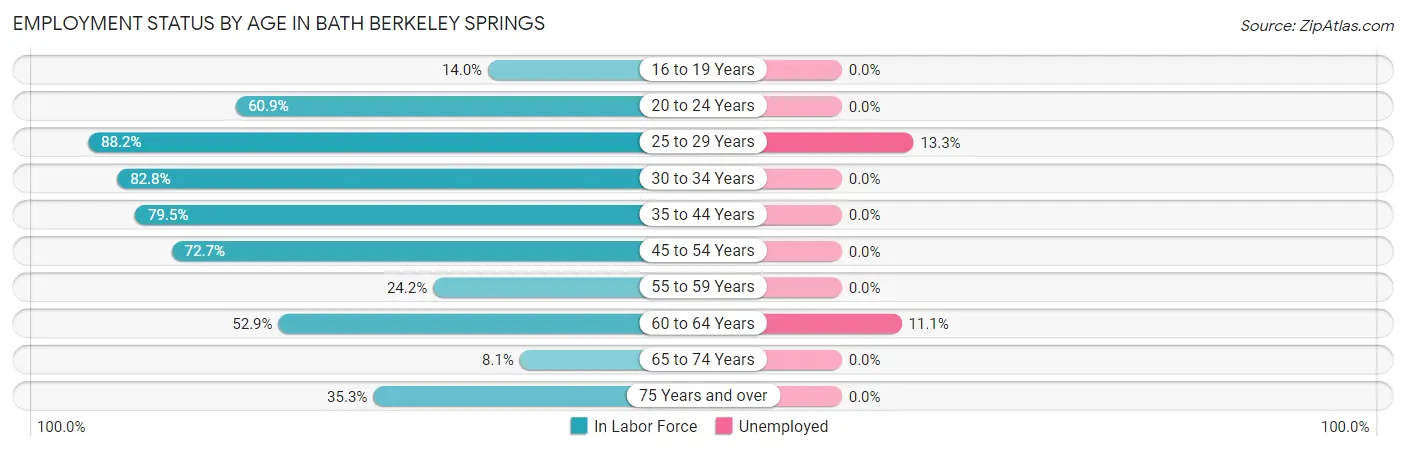
| Age Bracket | In Labor Force | Unemployed |
| 16 to 19 Years | 7 (14.0%) | 0 (0.0%) |
| 20 to 24 Years | 56 (60.9%) | 0 (0.0%) |
| 25 to 29 Years | 30 (88.2%) | 4 (13.3%) |
| 30 to 34 Years | 24 (82.8%) | 0 (0.0%) |
| 35 to 44 Years | 66 (79.5%) | 0 (0.0%) |
| 45 to 54 Years | 56 (72.7%) | 0 (0.0%) |
| 55 to 59 Years | 15 (24.2%) | 0 (0.0%) |
| 60 to 64 Years | 27 (52.9%) | 3 (11.1%) |
| 65 to 74 Years | 17 (8.1%) | 0 (0.0%) |
| 75 Years and over | 24 (35.3%) | 0 (0.0%) |
| Total | 322 (42.6%) | 7 (2.2%) |
Employment Status by Educational Attainment in Bath Berkeley Springs
According to labor force statistics for Bath Berkeley Springs, 64.9% of individuals (218) out of the total population between 25 and 64 years of age (336) are in the labor force, with 3.2% or 7 of them being unemployed. The group with the highest labor force participation rate are those with the educational attainment of college / associate degree, with 83.6% or 92 individuals in the labor force. Within the labor force, individuals with college / associate degree education have the highest percentage of unemployment, with 6.5% or 6 of them being unemployed.
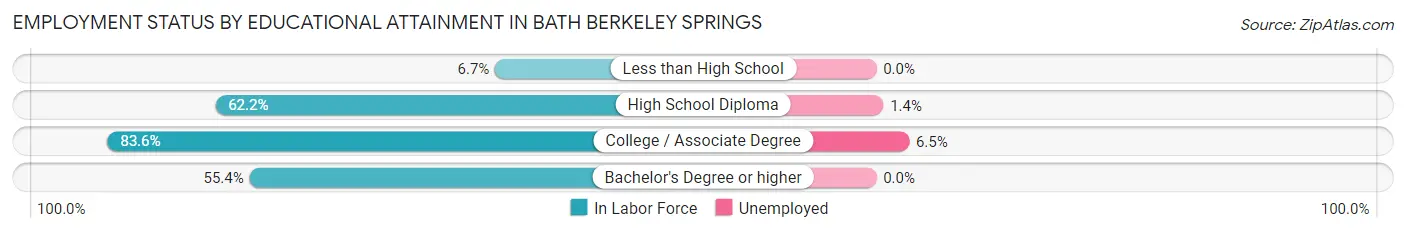
| Educational Attainment | In Labor Force | Unemployed |
| Less than High School | 1 (6.7%) | 0 (0.0%) |
| High School Diploma | 74 (62.2%) | 2 (1.4%) |
| College / Associate Degree | 92 (83.6%) | 7 (6.5%) |
| Bachelor's Degree or higher | 51 (55.4%) | 0 (0.0%) |
| Total | 218 (64.9%) | 11 (3.2%) |
Employment Occupations by Sex in Bath Berkeley Springs
Management, Business, Science and Arts Occupations
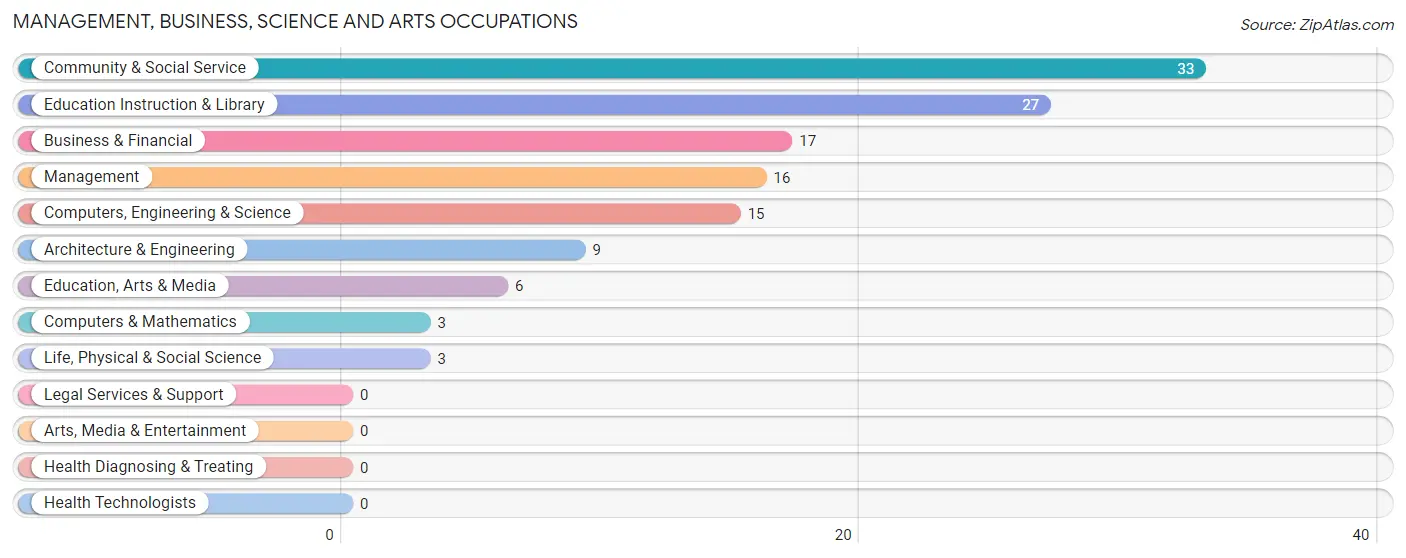
The most common Management, Business, Science and Arts occupations in Bath Berkeley Springs are Community & Social Service (33 | 10.5%), Education Instruction & Library (27 | 8.6%), Business & Financial (17 | 5.4%), Management (16 | 5.1%), and Computers, Engineering & Science (15 | 4.8%).
Management, Business, Science and Arts Occupations by Sex
Within the Management, Business, Science and Arts occupations in Bath Berkeley Springs, the most male-oriented occupations are Architecture & Engineering (100.0%), Life, Physical & Social Science (100.0%), and Computers, Engineering & Science (80.0%), while the most female-oriented occupations are Computers & Mathematics (100.0%), Management (62.5%), and Education Instruction & Library (59.3%).
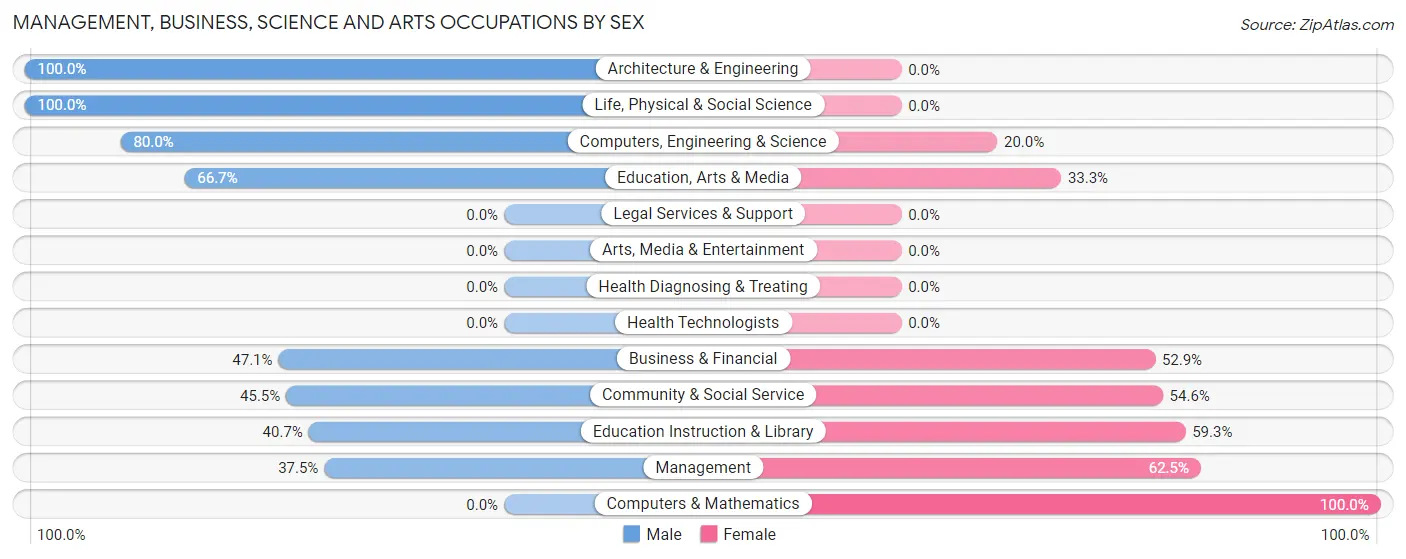
| Occupation | Male | Female |
| Management | 6 (37.5%) | 10 (62.5%) |
| Business & Financial | 8 (47.1%) | 9 (52.9%) |
| Computers, Engineering & Science | 12 (80.0%) | 3 (20.0%) |
| Computers & Mathematics | 0 (0.0%) | 3 (100.0%) |
| Architecture & Engineering | 9 (100.0%) | 0 (0.0%) |
| Life, Physical & Social Science | 3 (100.0%) | 0 (0.0%) |
| Community & Social Service | 15 (45.5%) | 18 (54.5%) |
| Education, Arts & Media | 4 (66.7%) | 2 (33.3%) |
| Legal Services & Support | 0 (0.0%) | 0 (0.0%) |
| Education Instruction & Library | 11 (40.7%) | 16 (59.3%) |
| Arts, Media & Entertainment | 0 (0.0%) | 0 (0.0%) |
| Health Diagnosing & Treating | 0 (0.0%) | 0 (0.0%) |
| Health Technologists | 0 (0.0%) | 0 (0.0%) |
| Total (Category) | 41 (50.6%) | 40 (49.4%) |
| Total (Overall) | 197 (62.5%) | 118 (37.5%) |
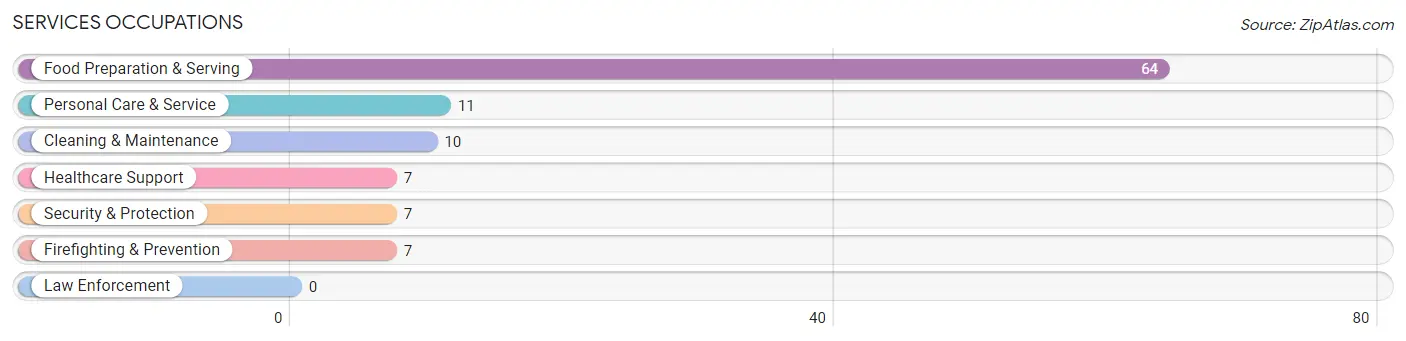
Services Occupations
The most common Services occupations in Bath Berkeley Springs are Food Preparation & Serving (64 | 20.3%), Personal Care & Service (11 | 3.5%), Cleaning & Maintenance (10 | 3.2%), Healthcare Support (7 | 2.2%), and Security & Protection (7 | 2.2%).
Services Occupations by Sex
Within the Services occupations in Bath Berkeley Springs, the most male-oriented occupations are Security & Protection (100.0%), Firefighting & Prevention (100.0%), and Cleaning & Maintenance (100.0%), while the most female-oriented occupations are Personal Care & Service (100.0%), Food Preparation & Serving (46.9%), and Healthcare Support (42.9%).
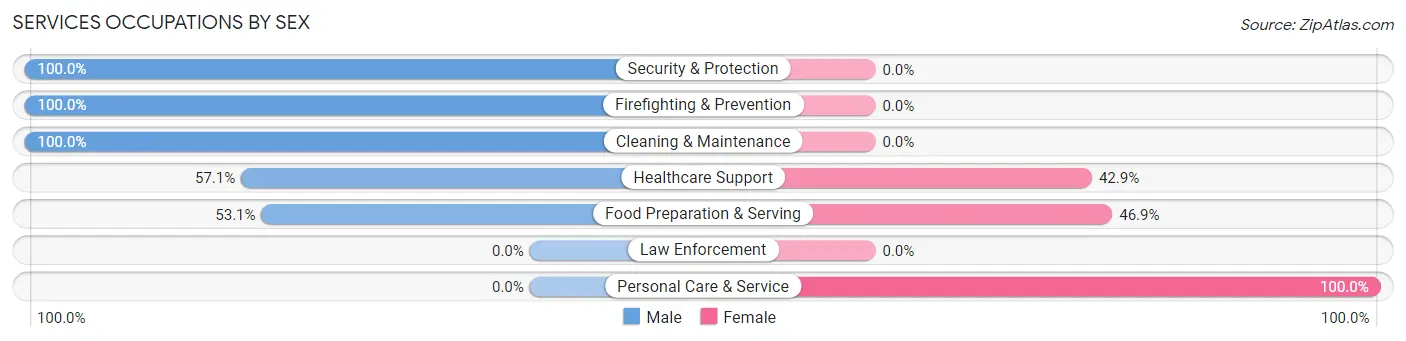
| Occupation | Male | Female |
| Healthcare Support | 4 (57.1%) | 3 (42.9%) |
| Security & Protection | 7 (100.0%) | 0 (0.0%) |
| Firefighting & Prevention | 7 (100.0%) | 0 (0.0%) |
| Law Enforcement | 0 (0.0%) | 0 (0.0%) |
| Food Preparation & Serving | 34 (53.1%) | 30 (46.9%) |
| Cleaning & Maintenance | 10 (100.0%) | 0 (0.0%) |
| Personal Care & Service | 0 (0.0%) | 11 (100.0%) |
| Total (Category) | 55 (55.6%) | 44 (44.4%) |
| Total (Overall) | 197 (62.5%) | 118 (37.5%) |
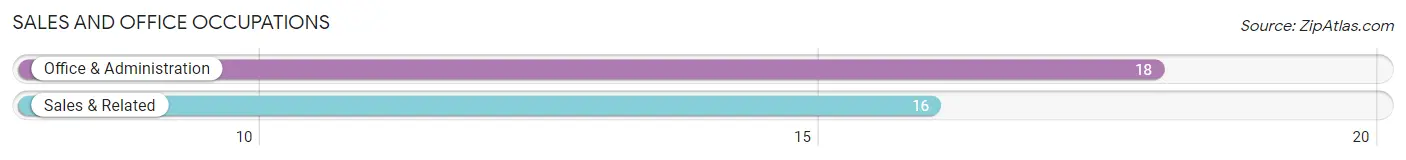
Sales and Office Occupations
The most common Sales and Office occupations in Bath Berkeley Springs are Office & Administration (18 | 5.7%), and Sales & Related (16 | 5.1%).
Sales and Office Occupations by Sex
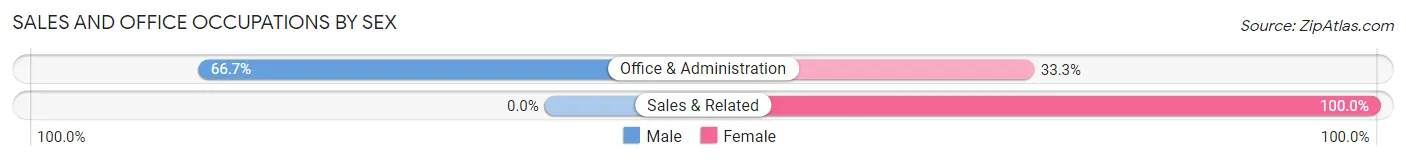
| Occupation | Male | Female |
| Sales & Related | 0 (0.0%) | 16 (100.0%) |
| Office & Administration | 12 (66.7%) | 6 (33.3%) |
| Total (Category) | 12 (35.3%) | 22 (64.7%) |
| Total (Overall) | 197 (62.5%) | 118 (37.5%) |
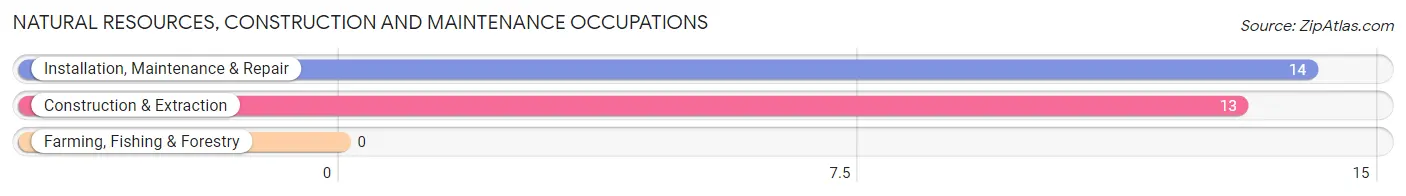
Natural Resources, Construction and Maintenance Occupations
The most common Natural Resources, Construction and Maintenance occupations in Bath Berkeley Springs are Installation, Maintenance & Repair (14 | 4.4%), and Construction & Extraction (13 | 4.1%).
Natural Resources, Construction and Maintenance Occupations by Sex
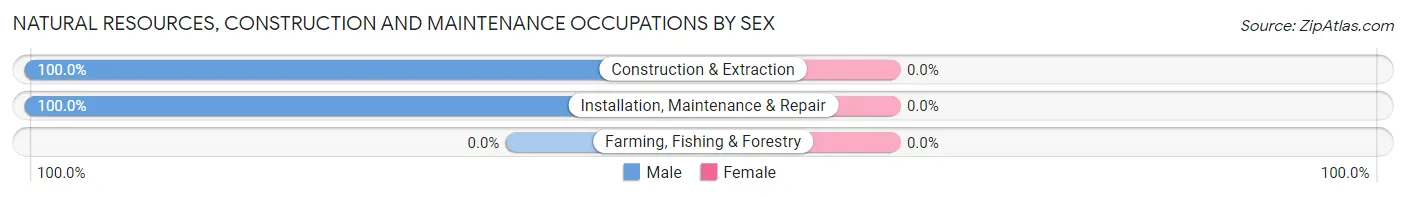
| Occupation | Male | Female |
| Farming, Fishing & Forestry | 0 (0.0%) | 0 (0.0%) |
| Construction & Extraction | 13 (100.0%) | 0 (0.0%) |
| Installation, Maintenance & Repair | 14 (100.0%) | 0 (0.0%) |
| Total (Category) | 27 (100.0%) | 0 (0.0%) |
| Total (Overall) | 197 (62.5%) | 118 (37.5%) |
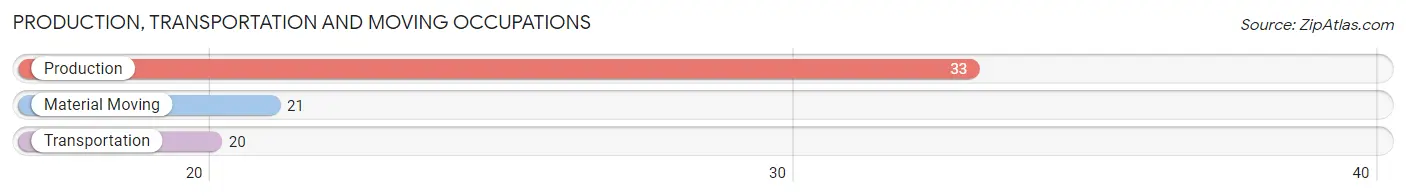
Production, Transportation and Moving Occupations
The most common Production, Transportation and Moving occupations in Bath Berkeley Springs are Production (33 | 10.5%), Material Moving (21 | 6.7%), and Transportation (20 | 6.4%).
Production, Transportation and Moving Occupations by Sex
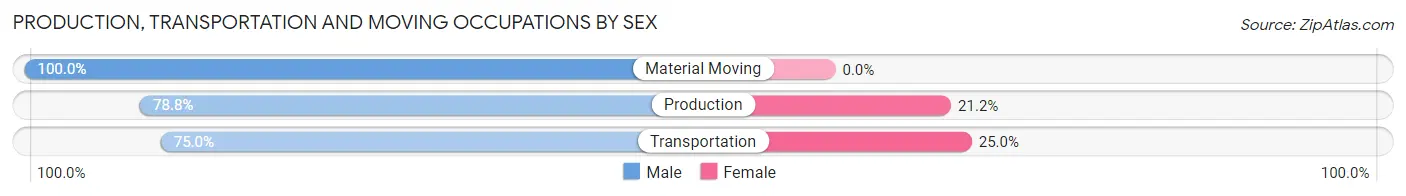
| Occupation | Male | Female |
| Production | 26 (78.8%) | 7 (21.2%) |
| Transportation | 15 (75.0%) | 5 (25.0%) |
| Material Moving | 21 (100.0%) | 0 (0.0%) |
| Total (Category) | 62 (83.8%) | 12 (16.2%) |
| Total (Overall) | 197 (62.5%) | 118 (37.5%) |
Employment Industries by Sex in Bath Berkeley Springs
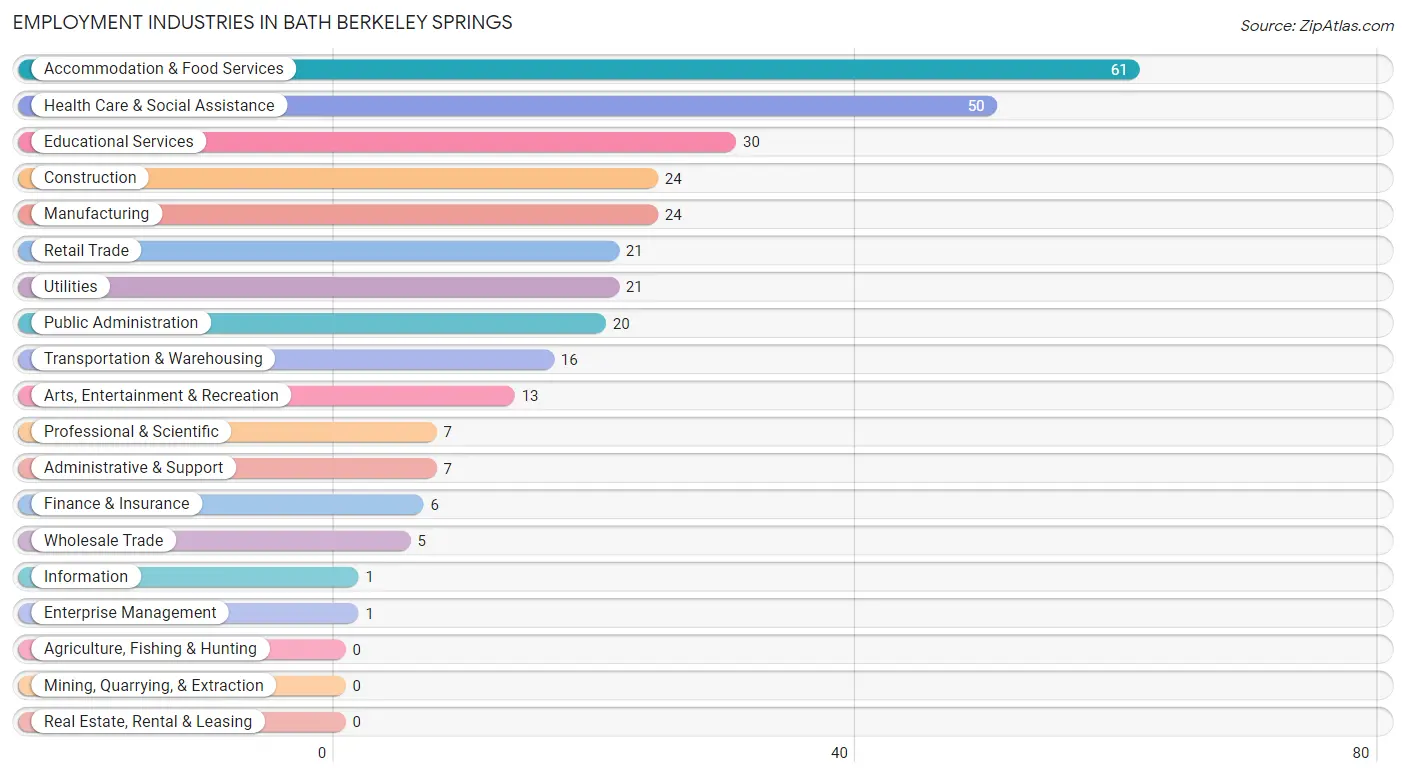
Employment Industries in Bath Berkeley Springs
The major employment industries in Bath Berkeley Springs include Accommodation & Food Services (61 | 19.4%), Health Care & Social Assistance (50 | 15.9%), Educational Services (30 | 9.5%), Construction (24 | 7.6%), and Manufacturing (24 | 7.6%).
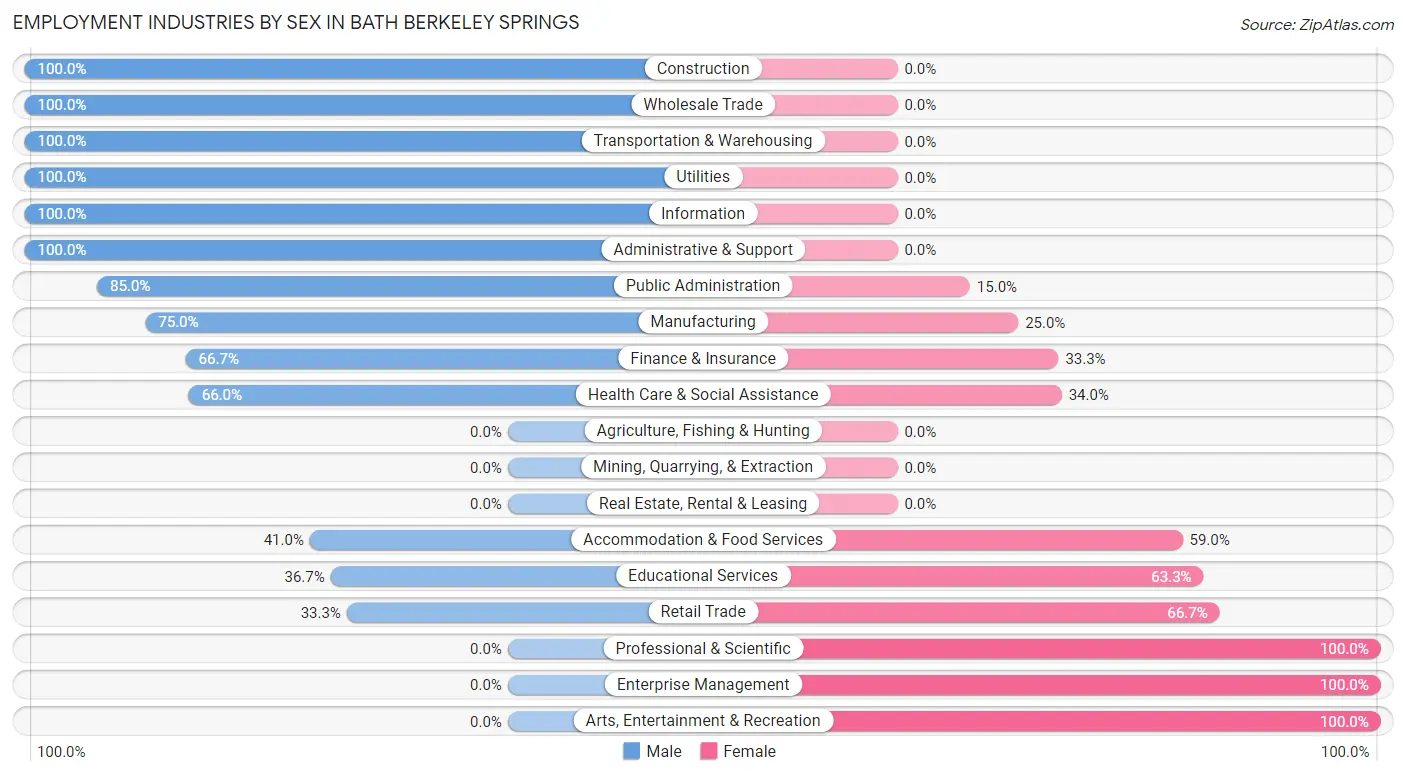
Employment Industries by Sex in Bath Berkeley Springs
The Bath Berkeley Springs industries that see more men than women are Construction (100.0%), Wholesale Trade (100.0%), and Transportation & Warehousing (100.0%), whereas the industries that tend to have a higher number of women are Professional & Scientific (100.0%), Enterprise Management (100.0%), and Arts, Entertainment & Recreation (100.0%).
| Industry | Male | Female |
| Agriculture, Fishing & Hunting | 0 (0.0%) | 0 (0.0%) |
| Mining, Quarrying, & Extraction | 0 (0.0%) | 0 (0.0%) |
| Construction | 24 (100.0%) | 0 (0.0%) |
| Manufacturing | 18 (75.0%) | 6 (25.0%) |
| Wholesale Trade | 5 (100.0%) | 0 (0.0%) |
| Retail Trade | 7 (33.3%) | 14 (66.7%) |
| Transportation & Warehousing | 16 (100.0%) | 0 (0.0%) |
| Utilities | 21 (100.0%) | 0 (0.0%) |
| Information | 1 (100.0%) | 0 (0.0%) |
| Finance & Insurance | 4 (66.7%) | 2 (33.3%) |
| Real Estate, Rental & Leasing | 0 (0.0%) | 0 (0.0%) |
| Professional & Scientific | 0 (0.0%) | 7 (100.0%) |
| Enterprise Management | 0 (0.0%) | 1 (100.0%) |
| Administrative & Support | 7 (100.0%) | 0 (0.0%) |
| Educational Services | 11 (36.7%) | 19 (63.3%) |
| Health Care & Social Assistance | 33 (66.0%) | 17 (34.0%) |
| Arts, Entertainment & Recreation | 0 (0.0%) | 13 (100.0%) |
| Accommodation & Food Services | 25 (41.0%) | 36 (59.0%) |
| Public Administration | 17 (85.0%) | 3 (15.0%) |
| Total | 197 (62.5%) | 118 (37.5%) |
Education in Bath Berkeley Springs
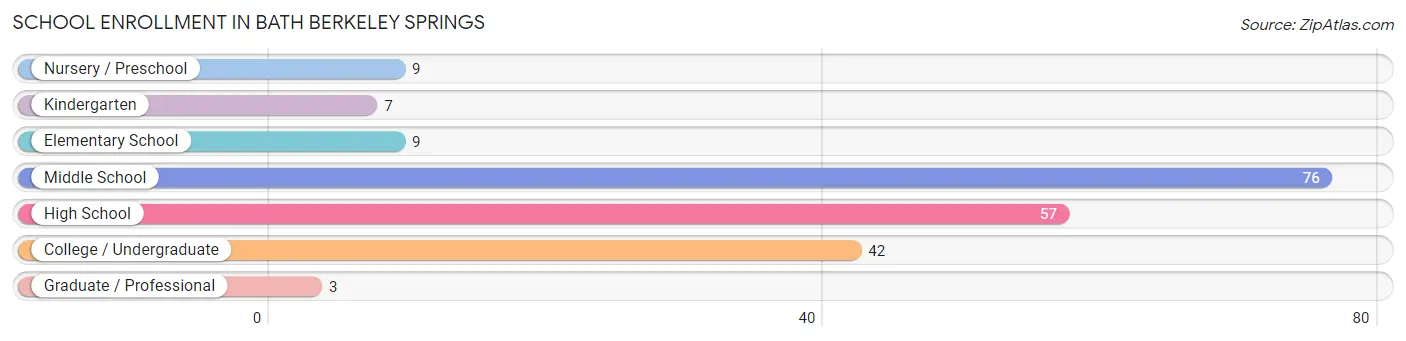
School Enrollment in Bath Berkeley Springs
The most common levels of schooling among the 203 students in Bath Berkeley Springs are middle school (76 | 37.4%), high school (57 | 28.1%), and college / undergraduate (42 | 20.7%).
| School Level | # Students | % Students |
| Nursery / Preschool | 9 | 4.4% |
| Kindergarten | 7 | 3.5% |
| Elementary School | 9 | 4.4% |
| Middle School | 76 | 37.4% |
| High School | 57 | 28.1% |
| College / Undergraduate | 42 | 20.7% |
| Graduate / Professional | 3 | 1.5% |
| Total | 203 | 100.0% |
School Enrollment by Age by Funding Source in Bath Berkeley Springs
Out of a total of 203 students who are enrolled in schools in Bath Berkeley Springs, 33 (16.3%) attend a private institution, while the remaining 170 (83.7%) are enrolled in public schools. The age group of 25 to 34 year olds has the highest likelihood of being enrolled in private schools, with 10 (100.0% in the age bracket) enrolled. Conversely, the age group of 35 years and over has the lowest likelihood of being enrolled in a private school, with 5 (100.0% in the age bracket) attending a public institution.
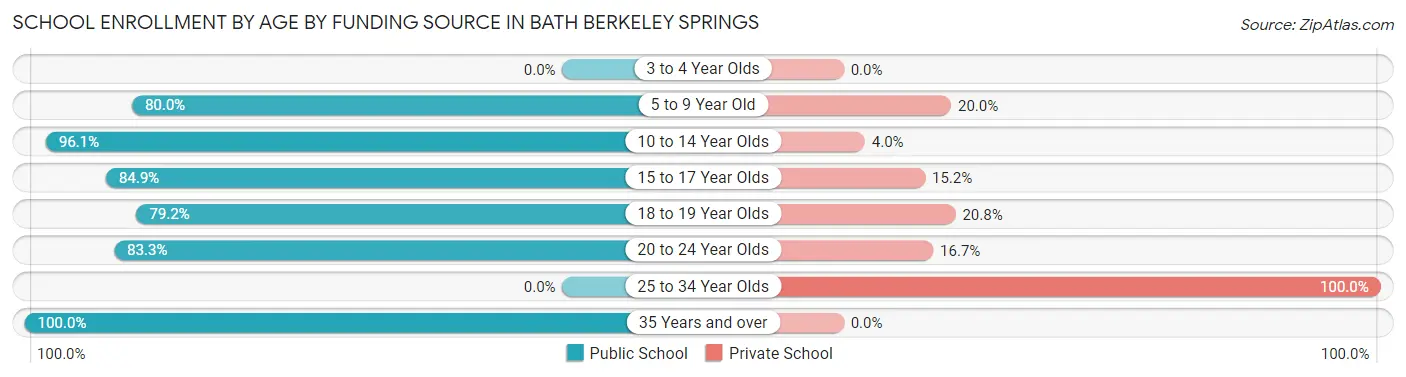
| Age Bracket | Public School | Private School |
| 3 to 4 Year Olds | 0 (0.0%) | 0 (0.0%) |
| 5 to 9 Year Old | 20 (80.0%) | 5 (20.0%) |
| 10 to 14 Year Olds | 73 (96.1%) | 3 (4.0%) |
| 15 to 17 Year Olds | 28 (84.9%) | 5 (15.1%) |
| 18 to 19 Year Olds | 19 (79.2%) | 5 (20.8%) |
| 20 to 24 Year Olds | 25 (83.3%) | 5 (16.7%) |
| 25 to 34 Year Olds | 0 (0.0%) | 10 (100.0%) |
| 35 Years and over | 5 (100.0%) | 0 (0.0%) |
| Total | 170 (83.7%) | 33 (16.3%) |
Educational Attainment by Field of Study in Bath Berkeley Springs
Business (33 | 21.8%), education (19 | 12.6%), visual & performing arts (15 | 9.9%), engineering (14 | 9.3%), and physical & health sciences (11 | 7.3%) are the most common fields of study among 151 individuals in Bath Berkeley Springs who have obtained a bachelor's degree or higher.
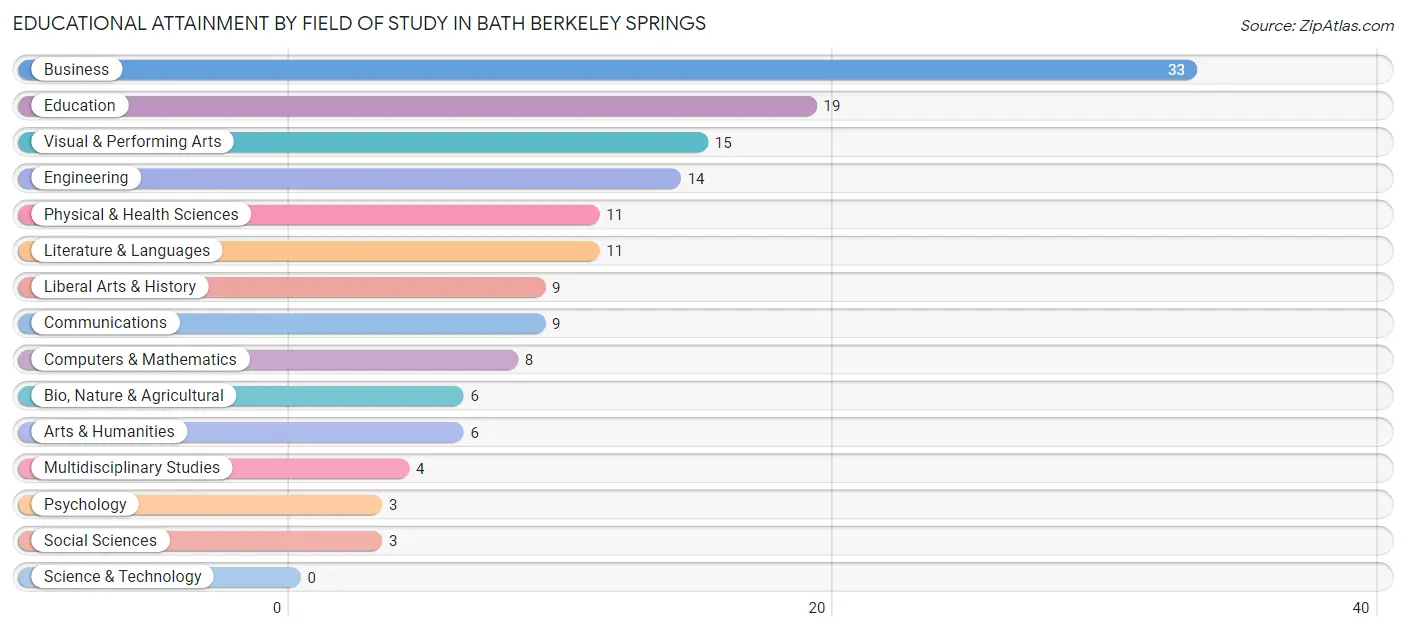
| Field of Study | # Graduates | % Graduates |
| Computers & Mathematics | 8 | 5.3% |
| Bio, Nature & Agricultural | 6 | 4.0% |
| Physical & Health Sciences | 11 | 7.3% |
| Psychology | 3 | 2.0% |
| Social Sciences | 3 | 2.0% |
| Engineering | 14 | 9.3% |
| Multidisciplinary Studies | 4 | 2.6% |
| Science & Technology | 0 | 0.0% |
| Business | 33 | 21.8% |
| Education | 19 | 12.6% |
| Literature & Languages | 11 | 7.3% |
| Liberal Arts & History | 9 | 6.0% |
| Visual & Performing Arts | 15 | 9.9% |
| Communications | 9 | 6.0% |
| Arts & Humanities | 6 | 4.0% |
| Total | 151 | 100.0% |
Transportation & Commute in Bath Berkeley Springs
Vehicle Availability by Sex in Bath Berkeley Springs
The most prevalent vehicle ownership categories in Bath Berkeley Springs are males with 2 vehicles (76, accounting for 40.2%) and females with 2 vehicles (36, making up 64.4%).
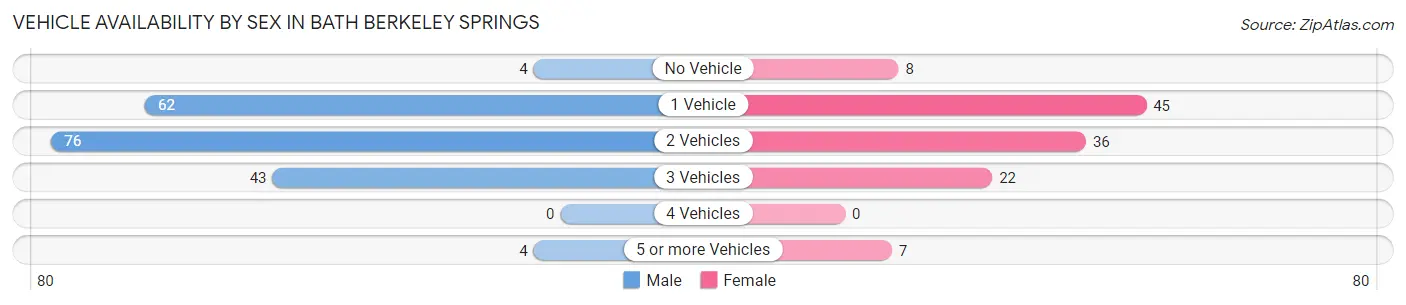
| Vehicles Available | Male | Female |
| No Vehicle | 4 (2.1%) | 8 (6.8%) |
| 1 Vehicle | 62 (32.8%) | 45 (38.1%) |
| 2 Vehicles | 76 (40.2%) | 36 (30.5%) |
| 3 Vehicles | 43 (22.8%) | 22 (18.6%) |
| 4 Vehicles | 0 (0.0%) | 0 (0.0%) |
| 5 or more Vehicles | 4 (2.1%) | 7 (5.9%) |
| Total | 189 (100.0%) | 118 (100.0%) |
Commute Time in Bath Berkeley Springs
The most frequently occuring commute durations in Bath Berkeley Springs are 45 to 59 minutes (53 commuters, 18.2%), 60 to 89 minutes (43 commuters, 14.8%), and 5 to 9 minutes (38 commuters, 13.1%).
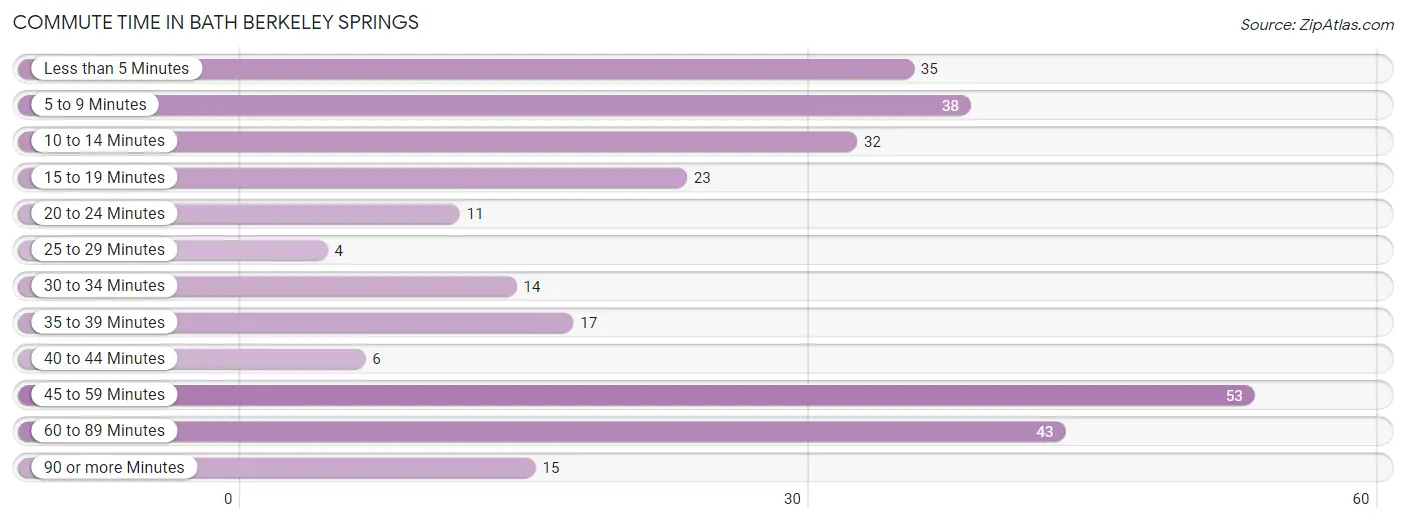
| Commute Time | # Commuters | % Commuters |
| Less than 5 Minutes | 35 | 12.0% |
| 5 to 9 Minutes | 38 | 13.1% |
| 10 to 14 Minutes | 32 | 11.0% |
| 15 to 19 Minutes | 23 | 7.9% |
| 20 to 24 Minutes | 11 | 3.8% |
| 25 to 29 Minutes | 4 | 1.4% |
| 30 to 34 Minutes | 14 | 4.8% |
| 35 to 39 Minutes | 17 | 5.8% |
| 40 to 44 Minutes | 6 | 2.1% |
| 45 to 59 Minutes | 53 | 18.2% |
| 60 to 89 Minutes | 43 | 14.8% |
| 90 or more Minutes | 15 | 5.1% |
Commute Time by Sex in Bath Berkeley Springs
The most common commute times in Bath Berkeley Springs are less than 5 minutes (30 commuters, 16.2%) for males and 45 to 59 minutes (27 commuters, 25.5%) for females.
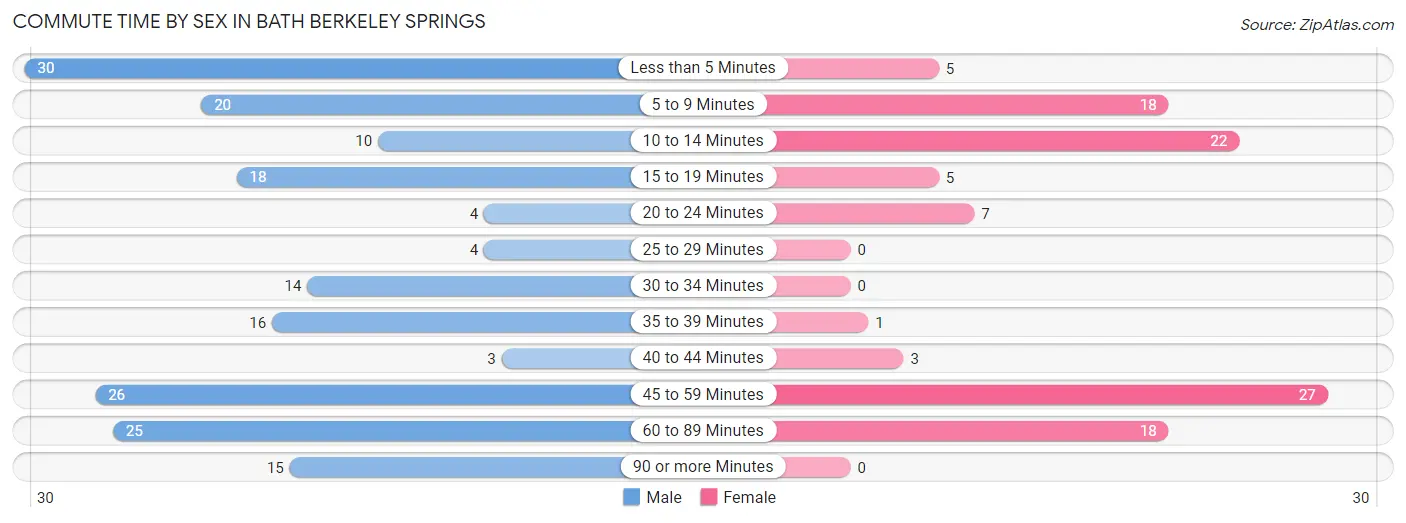
| Commute Time | Male | Female |
| Less than 5 Minutes | 30 (16.2%) | 5 (4.7%) |
| 5 to 9 Minutes | 20 (10.8%) | 18 (17.0%) |
| 10 to 14 Minutes | 10 (5.4%) | 22 (20.7%) |
| 15 to 19 Minutes | 18 (9.7%) | 5 (4.7%) |
| 20 to 24 Minutes | 4 (2.2%) | 7 (6.6%) |
| 25 to 29 Minutes | 4 (2.2%) | 0 (0.0%) |
| 30 to 34 Minutes | 14 (7.6%) | 0 (0.0%) |
| 35 to 39 Minutes | 16 (8.6%) | 1 (0.9%) |
| 40 to 44 Minutes | 3 (1.6%) | 3 (2.8%) |
| 45 to 59 Minutes | 26 (14.1%) | 27 (25.5%) |
| 60 to 89 Minutes | 25 (13.5%) | 18 (17.0%) |
| 90 or more Minutes | 15 (8.1%) | 0 (0.0%) |
Time of Departure to Work by Sex in Bath Berkeley Springs
The most frequent times of departure to work in Bath Berkeley Springs are 4:00 PM to 11:59 PM (39, 21.1%) for males and 12:00 PM to 3:59 PM (24, 22.6%) for females.
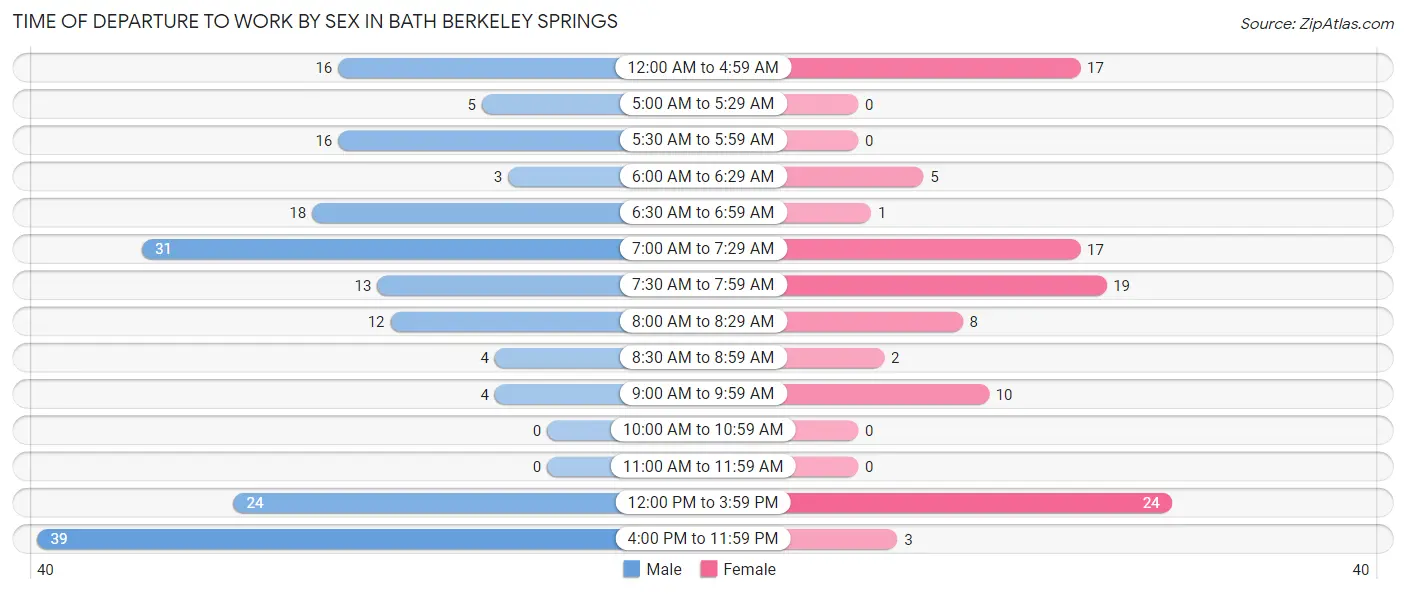
| Time of Departure | Male | Female |
| 12:00 AM to 4:59 AM | 16 (8.6%) | 17 (16.0%) |
| 5:00 AM to 5:29 AM | 5 (2.7%) | 0 (0.0%) |
| 5:30 AM to 5:59 AM | 16 (8.6%) | 0 (0.0%) |
| 6:00 AM to 6:29 AM | 3 (1.6%) | 5 (4.7%) |
| 6:30 AM to 6:59 AM | 18 (9.7%) | 1 (0.9%) |
| 7:00 AM to 7:29 AM | 31 (16.8%) | 17 (16.0%) |
| 7:30 AM to 7:59 AM | 13 (7.0%) | 19 (17.9%) |
| 8:00 AM to 8:29 AM | 12 (6.5%) | 8 (7.5%) |
| 8:30 AM to 8:59 AM | 4 (2.2%) | 2 (1.9%) |
| 9:00 AM to 9:59 AM | 4 (2.2%) | 10 (9.4%) |
| 10:00 AM to 10:59 AM | 0 (0.0%) | 0 (0.0%) |
| 11:00 AM to 11:59 AM | 0 (0.0%) | 0 (0.0%) |
| 12:00 PM to 3:59 PM | 24 (13.0%) | 24 (22.6%) |
| 4:00 PM to 11:59 PM | 39 (21.1%) | 3 (2.8%) |
| Total | 185 (100.0%) | 106 (100.0%) |
Housing Occupancy in Bath Berkeley Springs
Occupancy by Ownership in Bath Berkeley Springs
Of the total 463 dwellings in Bath Berkeley Springs, owner-occupied units account for 155 (33.5%), while renter-occupied units make up 308 (66.5%).
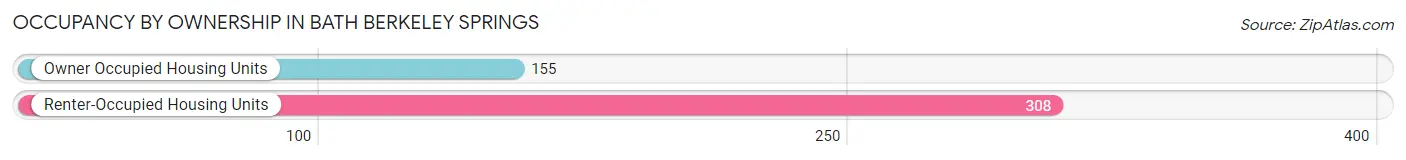
| Occupancy | # Housing Units | % Housing Units |
| Owner Occupied Housing Units | 155 | 33.5% |
| Renter-Occupied Housing Units | 308 | 66.5% |
| Total Occupied Housing Units | 463 | 100.0% |
Occupancy by Household Size in Bath Berkeley Springs
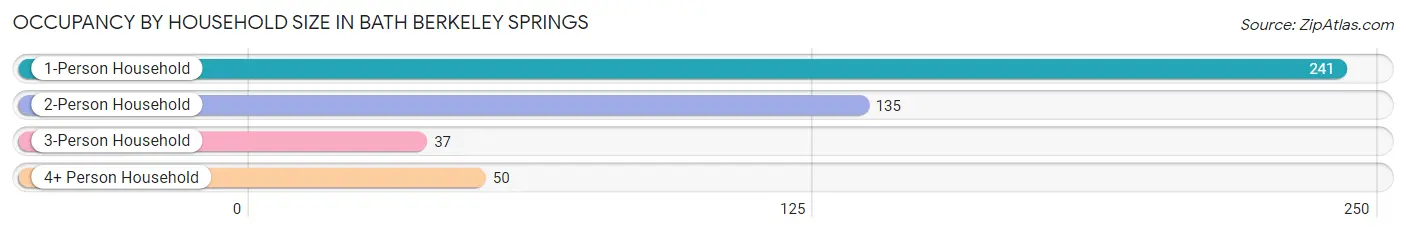
| Household Size | # Housing Units | % Housing Units |
| 1-Person Household | 241 | 52.0% |
| 2-Person Household | 135 | 29.2% |
| 3-Person Household | 37 | 8.0% |
| 4+ Person Household | 50 | 10.8% |
| Total Housing Units | 463 | 100.0% |
Occupancy by Ownership by Household Size in Bath Berkeley Springs
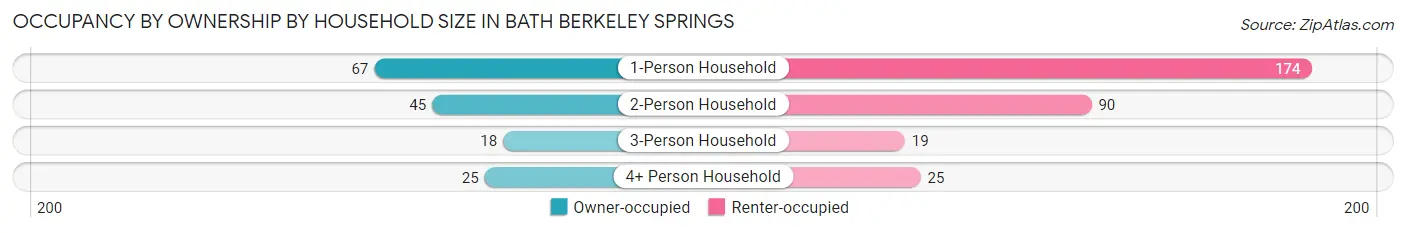
| Household Size | Owner-occupied | Renter-occupied |
| 1-Person Household | 67 (27.8%) | 174 (72.2%) |
| 2-Person Household | 45 (33.3%) | 90 (66.7%) |
| 3-Person Household | 18 (48.6%) | 19 (51.3%) |
| 4+ Person Household | 25 (50.0%) | 25 (50.0%) |
| Total Housing Units | 155 (33.5%) | 308 (66.5%) |
Occupancy by Educational Attainment in Bath Berkeley Springs
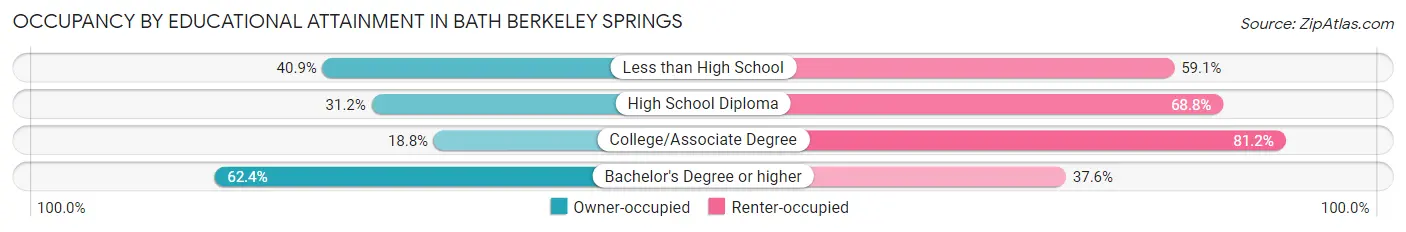
| Household Size | Owner-occupied | Renter-occupied |
| Less than High School | 9 (40.9%) | 13 (59.1%) |
| High School Diploma | 39 (31.2%) | 86 (68.8%) |
| College/Associate Degree | 39 (18.8%) | 168 (81.2%) |
| Bachelor's Degree or higher | 68 (62.4%) | 41 (37.6%) |
Occupancy by Age of Householder in Bath Berkeley Springs
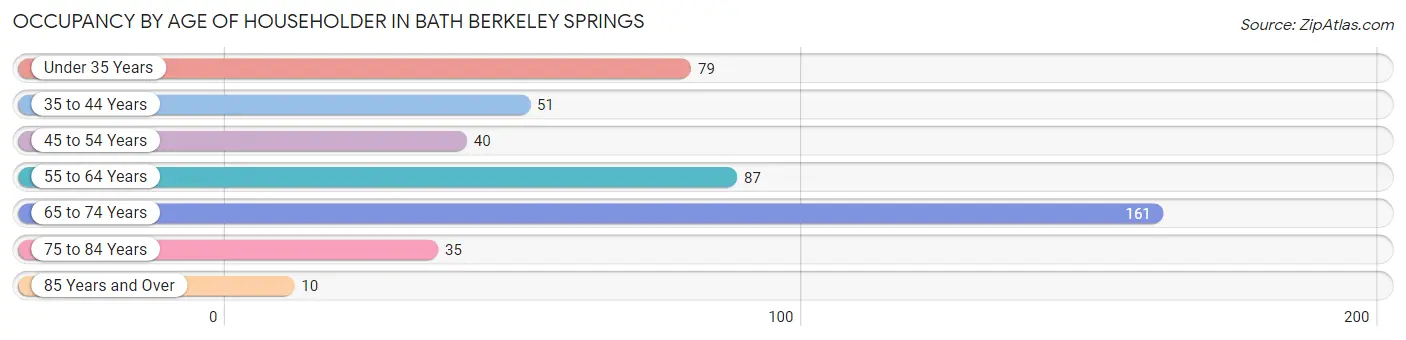
| Age Bracket | # Households | % Households |
| Under 35 Years | 79 | 17.1% |
| 35 to 44 Years | 51 | 11.0% |
| 45 to 54 Years | 40 | 8.6% |
| 55 to 64 Years | 87 | 18.8% |
| 65 to 74 Years | 161 | 34.8% |
| 75 to 84 Years | 35 | 7.6% |
| 85 Years and Over | 10 | 2.2% |
| Total | 463 | 100.0% |
Housing Finances in Bath Berkeley Springs
Median Income by Occupancy in Bath Berkeley Springs
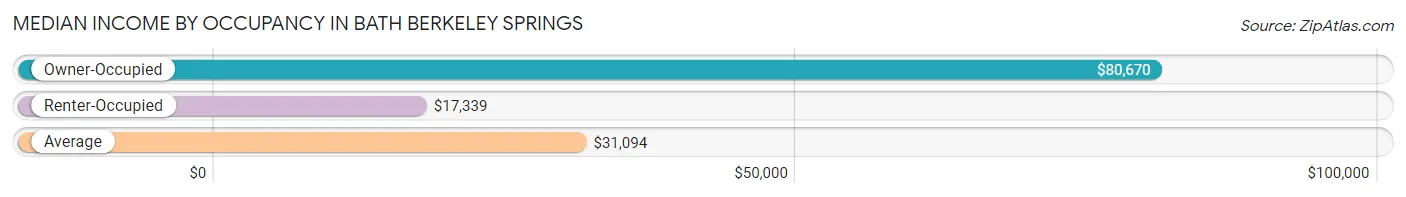
| Occupancy Type | # Households | Median Income |
| Owner-Occupied | 155 (33.5%) | $80,670 |
| Renter-Occupied | 308 (66.5%) | $17,339 |
| Average | 463 (100.0%) | $31,094 |
Occupancy by Householder Income Bracket in Bath Berkeley Springs
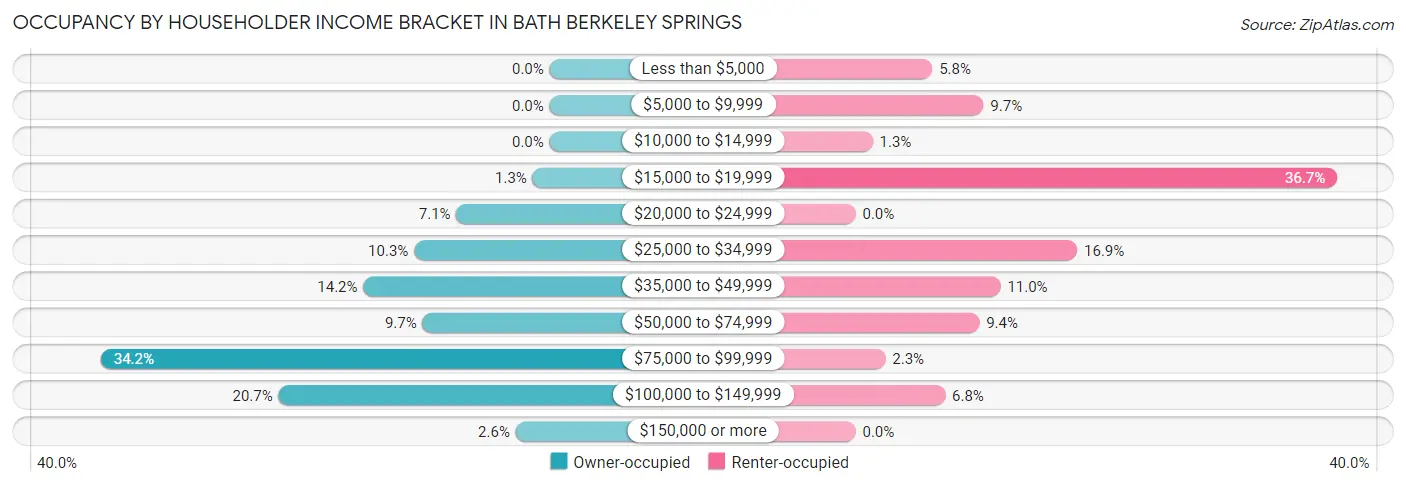
| Income Bracket | Owner-occupied | Renter-occupied |
| Less than $5,000 | 0 (0.0%) | 18 (5.8%) |
| $5,000 to $9,999 | 0 (0.0%) | 30 (9.7%) |
| $10,000 to $14,999 | 0 (0.0%) | 4 (1.3%) |
| $15,000 to $19,999 | 2 (1.3%) | 113 (36.7%) |
| $20,000 to $24,999 | 11 (7.1%) | 0 (0.0%) |
| $25,000 to $34,999 | 16 (10.3%) | 52 (16.9%) |
| $35,000 to $49,999 | 22 (14.2%) | 34 (11.0%) |
| $50,000 to $74,999 | 15 (9.7%) | 29 (9.4%) |
| $75,000 to $99,999 | 53 (34.2%) | 7 (2.3%) |
| $100,000 to $149,999 | 32 (20.6%) | 21 (6.8%) |
| $150,000 or more | 4 (2.6%) | 0 (0.0%) |
| Total | 155 (100.0%) | 308 (100.0%) |
Monthly Housing Cost Tiers in Bath Berkeley Springs
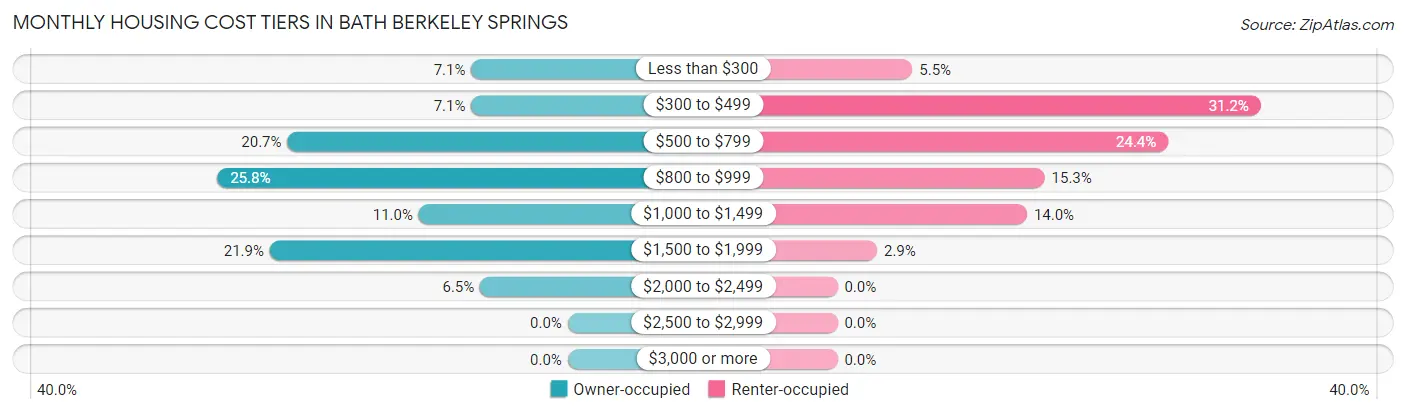
| Monthly Cost | Owner-occupied | Renter-occupied |
| Less than $300 | 11 (7.1%) | 17 (5.5%) |
| $300 to $499 | 11 (7.1%) | 96 (31.2%) |
| $500 to $799 | 32 (20.6%) | 75 (24.3%) |
| $800 to $999 | 40 (25.8%) | 47 (15.3%) |
| $1,000 to $1,499 | 17 (11.0%) | 43 (14.0%) |
| $1,500 to $1,999 | 34 (21.9%) | 9 (2.9%) |
| $2,000 to $2,499 | 10 (6.5%) | 0 (0.0%) |
| $2,500 to $2,999 | 0 (0.0%) | 0 (0.0%) |
| $3,000 or more | 0 (0.0%) | 0 (0.0%) |
| Total | 155 (100.0%) | 308 (100.0%) |
Physical Housing Characteristics in Bath Berkeley Springs
Housing Structures in Bath Berkeley Springs
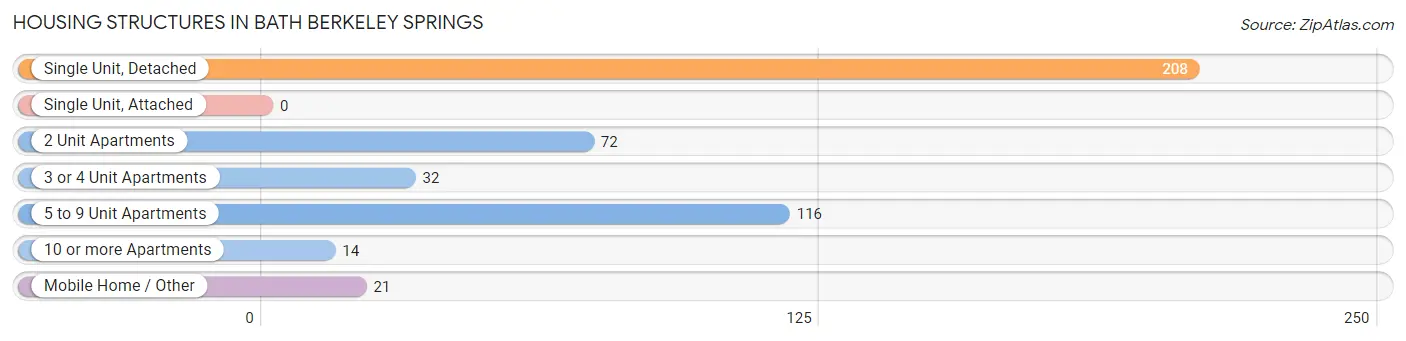
| Structure Type | # Housing Units | % Housing Units |
| Single Unit, Detached | 208 | 44.9% |
| Single Unit, Attached | 0 | 0.0% |
| 2 Unit Apartments | 72 | 15.5% |
| 3 or 4 Unit Apartments | 32 | 6.9% |
| 5 to 9 Unit Apartments | 116 | 25.1% |
| 10 or more Apartments | 14 | 3.0% |
| Mobile Home / Other | 21 | 4.5% |
| Total | 463 | 100.0% |
Housing Structures by Occupancy in Bath Berkeley Springs
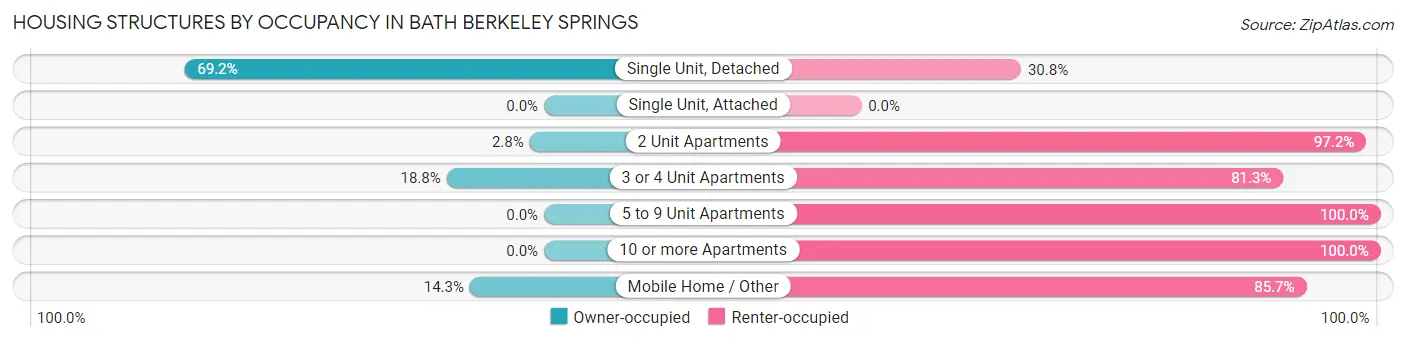
| Structure Type | Owner-occupied | Renter-occupied |
| Single Unit, Detached | 144 (69.2%) | 64 (30.8%) |
| Single Unit, Attached | 0 (0.0%) | 0 (0.0%) |
| 2 Unit Apartments | 2 (2.8%) | 70 (97.2%) |
| 3 or 4 Unit Apartments | 6 (18.8%) | 26 (81.2%) |
| 5 to 9 Unit Apartments | 0 (0.0%) | 116 (100.0%) |
| 10 or more Apartments | 0 (0.0%) | 14 (100.0%) |
| Mobile Home / Other | 3 (14.3%) | 18 (85.7%) |
| Total | 155 (33.5%) | 308 (66.5%) |
Housing Structures by Number of Rooms in Bath Berkeley Springs
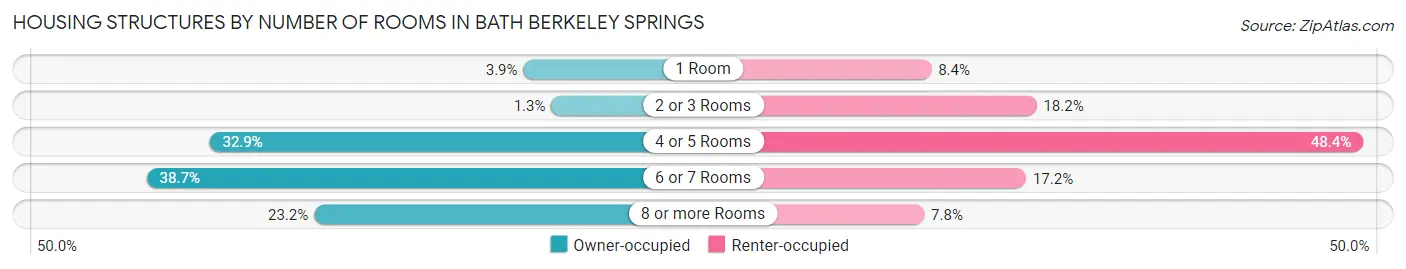
| Number of Rooms | Owner-occupied | Renter-occupied |
| 1 Room | 6 (3.9%) | 26 (8.4%) |
| 2 or 3 Rooms | 2 (1.3%) | 56 (18.2%) |
| 4 or 5 Rooms | 51 (32.9%) | 149 (48.4%) |
| 6 or 7 Rooms | 60 (38.7%) | 53 (17.2%) |
| 8 or more Rooms | 36 (23.2%) | 24 (7.8%) |
| Total | 155 (100.0%) | 308 (100.0%) |
Housing Structure by Heating Type in Bath Berkeley Springs
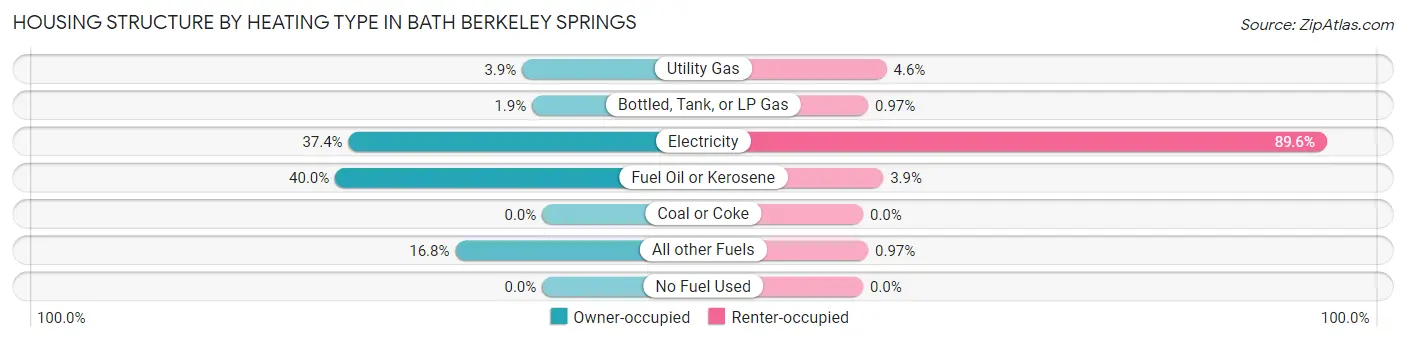
| Heating Type | Owner-occupied | Renter-occupied |
| Utility Gas | 6 (3.9%) | 14 (4.5%) |
| Bottled, Tank, or LP Gas | 3 (1.9%) | 3 (1.0%) |
| Electricity | 58 (37.4%) | 276 (89.6%) |
| Fuel Oil or Kerosene | 62 (40.0%) | 12 (3.9%) |
| Coal or Coke | 0 (0.0%) | 0 (0.0%) |
| All other Fuels | 26 (16.8%) | 3 (1.0%) |
| No Fuel Used | 0 (0.0%) | 0 (0.0%) |
| Total | 155 (100.0%) | 308 (100.0%) |
Household Vehicle Usage in Bath Berkeley Springs
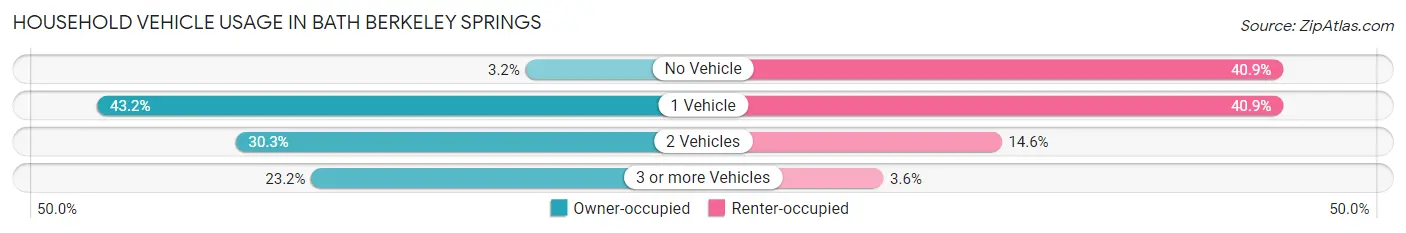
| Vehicles per Household | Owner-occupied | Renter-occupied |
| No Vehicle | 5 (3.2%) | 126 (40.9%) |
| 1 Vehicle | 67 (43.2%) | 126 (40.9%) |
| 2 Vehicles | 47 (30.3%) | 45 (14.6%) |
| 3 or more Vehicles | 36 (23.2%) | 11 (3.6%) |
| Total | 155 (100.0%) | 308 (100.0%) |
Real Estate & Mortgages in Bath Berkeley Springs
Real Estate and Mortgage Overview in Bath Berkeley Springs
| Characteristic | Without Mortgage | With Mortgage |
| Housing Units | 47 | 108 |
| Median Property Value | $157,500 | $163,800 |
| Median Household Income | - | - |
| Monthly Housing Costs | $521 | $0 |
| Real Estate Taxes | $830 | $0 |
Property Value by Mortgage Status in Bath Berkeley Springs
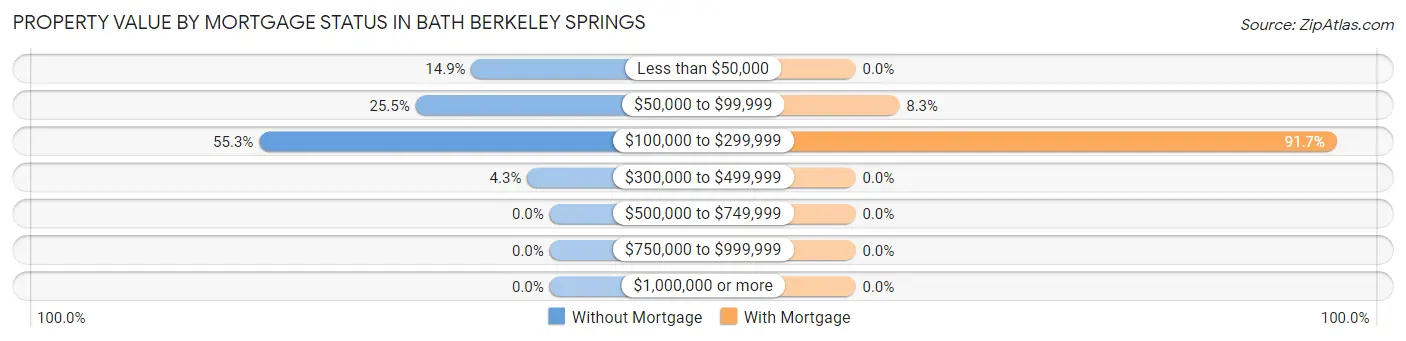
| Property Value | Without Mortgage | With Mortgage |
| Less than $50,000 | 7 (14.9%) | 0 (0.0%) |
| $50,000 to $99,999 | 12 (25.5%) | 9 (8.3%) |
| $100,000 to $299,999 | 26 (55.3%) | 99 (91.7%) |
| $300,000 to $499,999 | 2 (4.3%) | 0 (0.0%) |
| $500,000 to $749,999 | 0 (0.0%) | 0 (0.0%) |
| $750,000 to $999,999 | 0 (0.0%) | 0 (0.0%) |
| $1,000,000 or more | 0 (0.0%) | 0 (0.0%) |
| Total | 47 (100.0%) | 108 (100.0%) |
Household Income by Mortgage Status in Bath Berkeley Springs
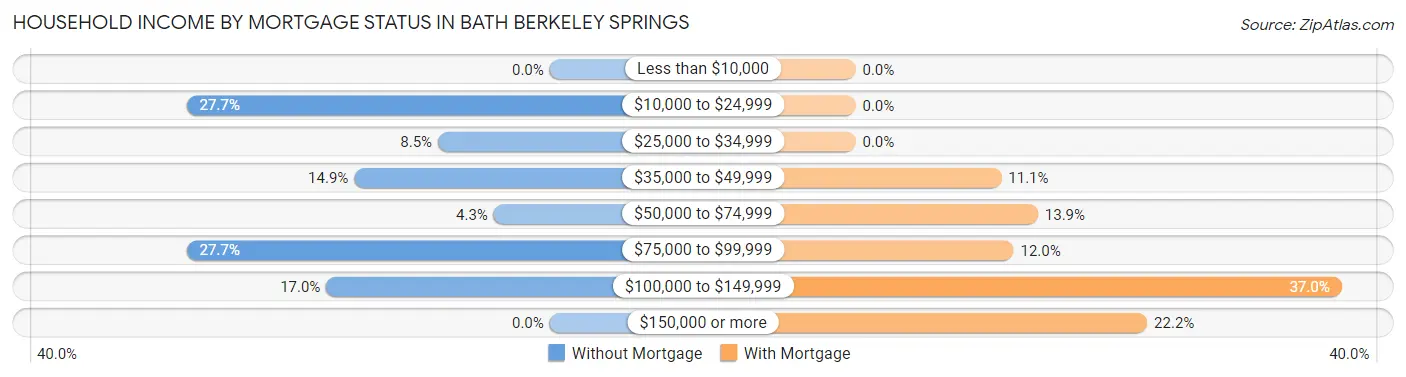
| Household Income | Without Mortgage | With Mortgage |
| Less than $10,000 | 0 (0.0%) | 0 (0.0%) |
| $10,000 to $24,999 | 13 (27.7%) | 0 (0.0%) |
| $25,000 to $34,999 | 4 (8.5%) | 0 (0.0%) |
| $35,000 to $49,999 | 7 (14.9%) | 12 (11.1%) |
| $50,000 to $74,999 | 2 (4.3%) | 15 (13.9%) |
| $75,000 to $99,999 | 13 (27.7%) | 13 (12.0%) |
| $100,000 to $149,999 | 8 (17.0%) | 40 (37.0%) |
| $150,000 or more | 0 (0.0%) | 24 (22.2%) |
| Total | 47 (100.0%) | 108 (100.0%) |
Property Value to Household Income Ratio in Bath Berkeley Springs
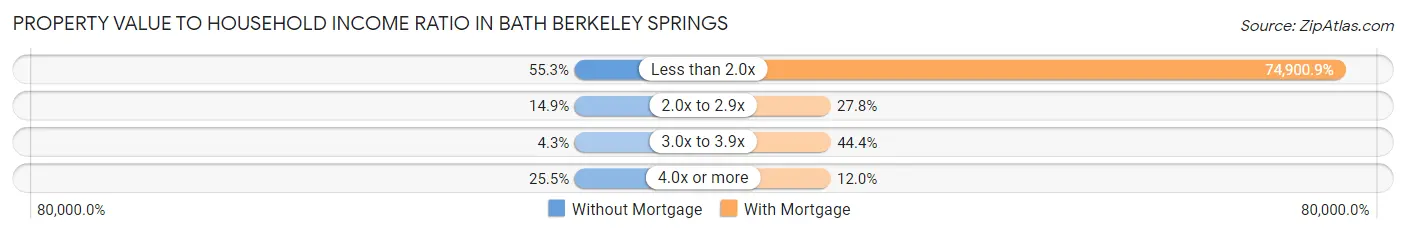
| Value-to-Income Ratio | Without Mortgage | With Mortgage |
| Less than 2.0x | 26 (55.3%) | 80,893 (74,900.9%) |
| 2.0x to 2.9x | 7 (14.9%) | 30 (27.8%) |
| 3.0x to 3.9x | 2 (4.3%) | 48 (44.4%) |
| 4.0x or more | 12 (25.5%) | 13 (12.0%) |
| Total | 47 (100.0%) | 108 (100.0%) |
Real Estate Taxes by Mortgage Status in Bath Berkeley Springs
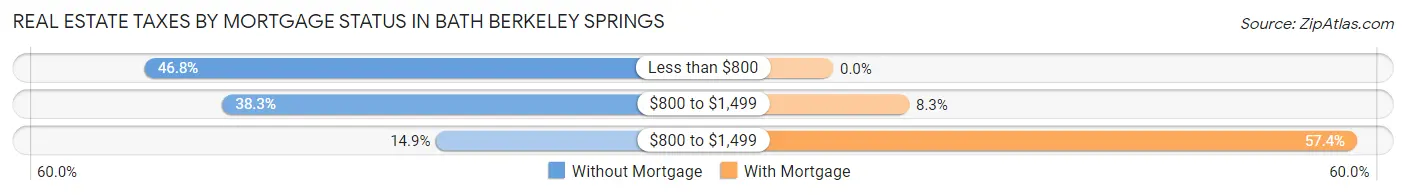
| Property Taxes | Without Mortgage | With Mortgage |
| Less than $800 | 22 (46.8%) | 0 (0.0%) |
| $800 to $1,499 | 18 (38.3%) | 9 (8.3%) |
| $800 to $1,499 | 7 (14.9%) | 62 (57.4%) |
| Total | 47 (100.0%) | 108 (100.0%) |
Health & Disability in Bath Berkeley Springs
Health Insurance Coverage by Age in Bath Berkeley Springs
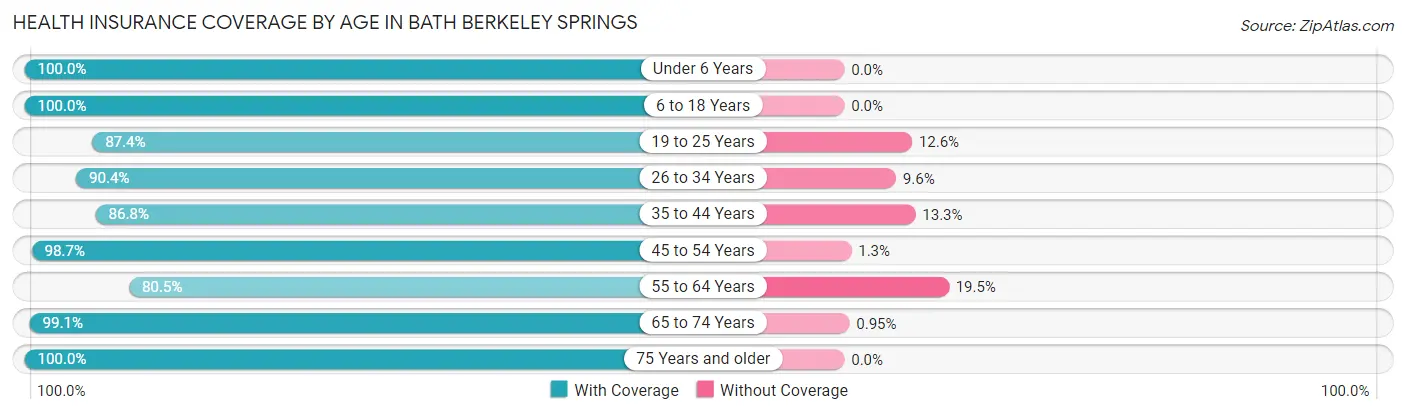
| Age Bracket | With Coverage | Without Coverage |
| Under 6 Years | 42 (100.0%) | 0 (0.0%) |
| 6 to 18 Years | 149 (100.0%) | 0 (0.0%) |
| 19 to 25 Years | 90 (87.4%) | 13 (12.6%) |
| 26 to 34 Years | 47 (90.4%) | 5 (9.6%) |
| 35 to 44 Years | 72 (86.8%) | 11 (13.3%) |
| 45 to 54 Years | 76 (98.7%) | 1 (1.3%) |
| 55 to 64 Years | 91 (80.5%) | 22 (19.5%) |
| 65 to 74 Years | 208 (99.1%) | 2 (0.9%) |
| 75 Years and older | 68 (100.0%) | 0 (0.0%) |
| Total | 843 (94.0%) | 54 (6.0%) |
Health Insurance Coverage by Citizenship Status in Bath Berkeley Springs
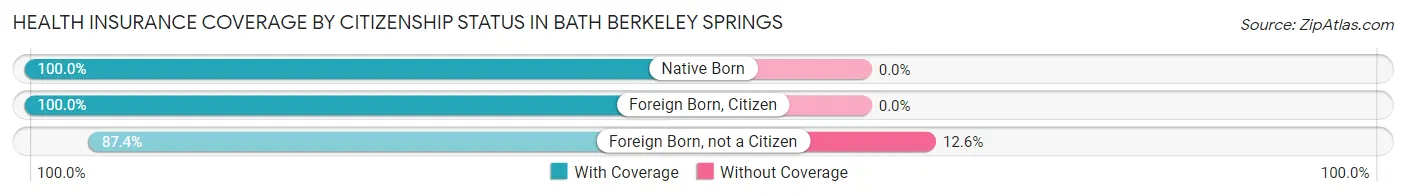
| Citizenship Status | With Coverage | Without Coverage |
| Native Born | 42 (100.0%) | 0 (0.0%) |
| Foreign Born, Citizen | 149 (100.0%) | 0 (0.0%) |
| Foreign Born, not a Citizen | 90 (87.4%) | 13 (12.6%) |
Health Insurance Coverage by Household Income in Bath Berkeley Springs
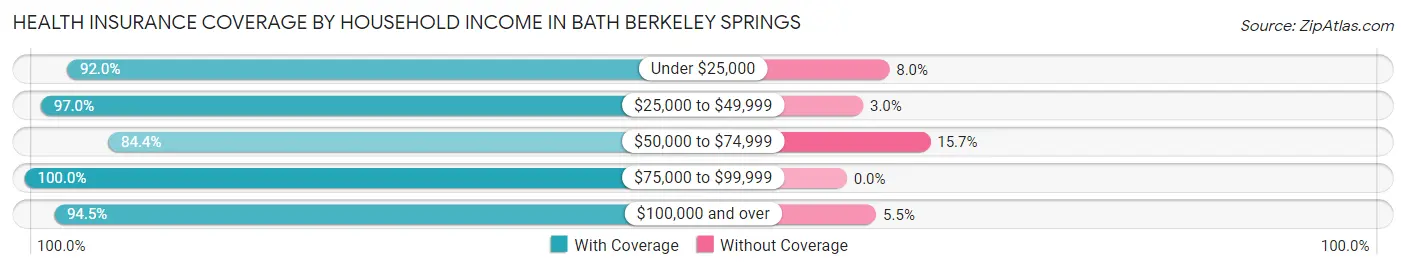
| Household Income | With Coverage | Without Coverage |
| Under $25,000 | 208 (92.0%) | 18 (8.0%) |
| $25,000 to $49,999 | 223 (97.0%) | 7 (3.0%) |
| $50,000 to $74,999 | 97 (84.4%) | 18 (15.7%) |
| $75,000 to $99,999 | 126 (100.0%) | 0 (0.0%) |
| $100,000 and over | 189 (94.5%) | 11 (5.5%) |
Public vs Private Health Insurance Coverage by Age in Bath Berkeley Springs
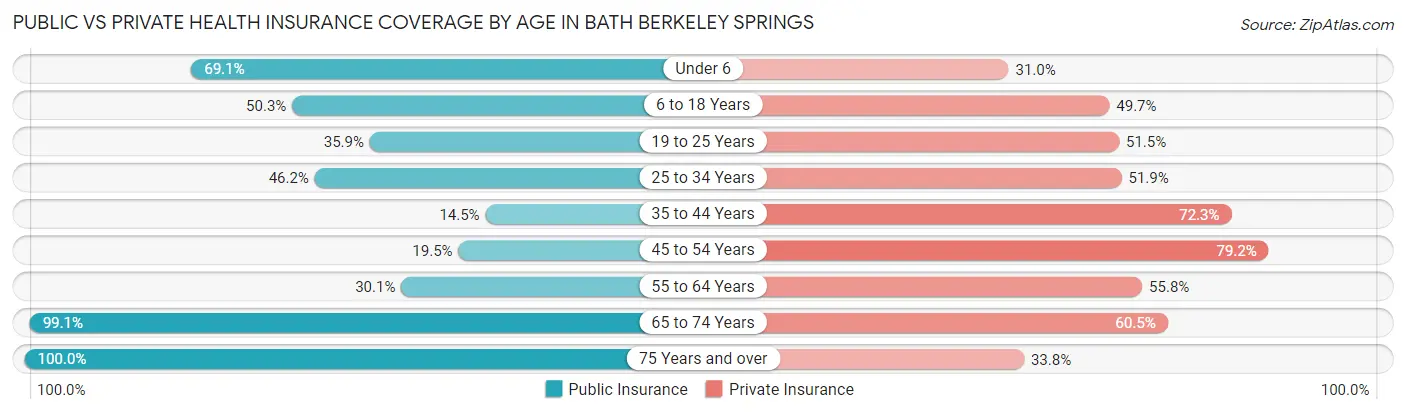
| Age Bracket | Public Insurance | Private Insurance |
| Under 6 | 29 (69.1%) | 13 (30.9%) |
| 6 to 18 Years | 75 (50.3%) | 74 (49.7%) |
| 19 to 25 Years | 37 (35.9%) | 53 (51.5%) |
| 25 to 34 Years | 24 (46.2%) | 27 (51.9%) |
| 35 to 44 Years | 12 (14.5%) | 60 (72.3%) |
| 45 to 54 Years | 15 (19.5%) | 61 (79.2%) |
| 55 to 64 Years | 34 (30.1%) | 63 (55.7%) |
| 65 to 74 Years | 208 (99.1%) | 127 (60.5%) |
| 75 Years and over | 68 (100.0%) | 23 (33.8%) |
| Total | 502 (56.0%) | 501 (55.8%) |
Disability Status by Sex by Age in Bath Berkeley Springs
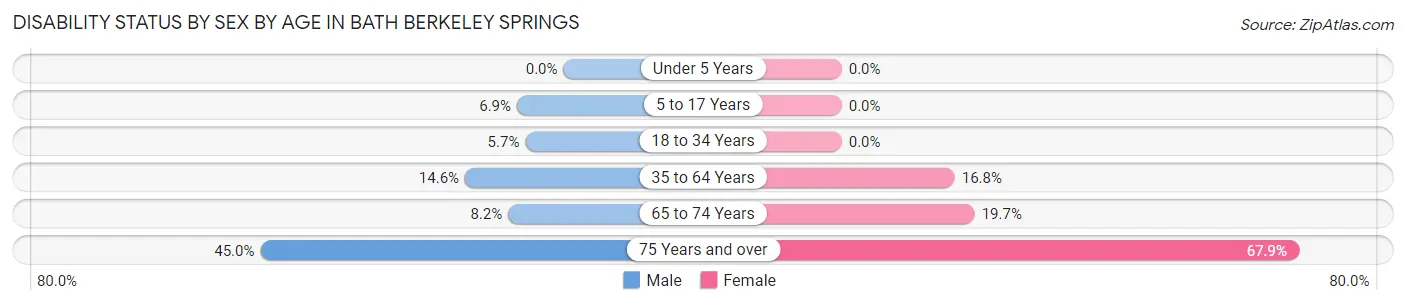
| Age Bracket | Male | Female |
| Under 5 Years | 0 (0.0%) | 0 (0.0%) |
| 5 to 17 Years | 4 (6.9%) | 0 (0.0%) |
| 18 to 34 Years | 6 (5.7%) | 0 (0.0%) |
| 35 to 64 Years | 19 (14.6%) | 24 (16.8%) |
| 65 to 74 Years | 11 (8.2%) | 15 (19.7%) |
| 75 Years and over | 18 (45.0%) | 19 (67.9%) |
Disability Class by Sex by Age in Bath Berkeley Springs
Disability Class: Hearing Difficulty
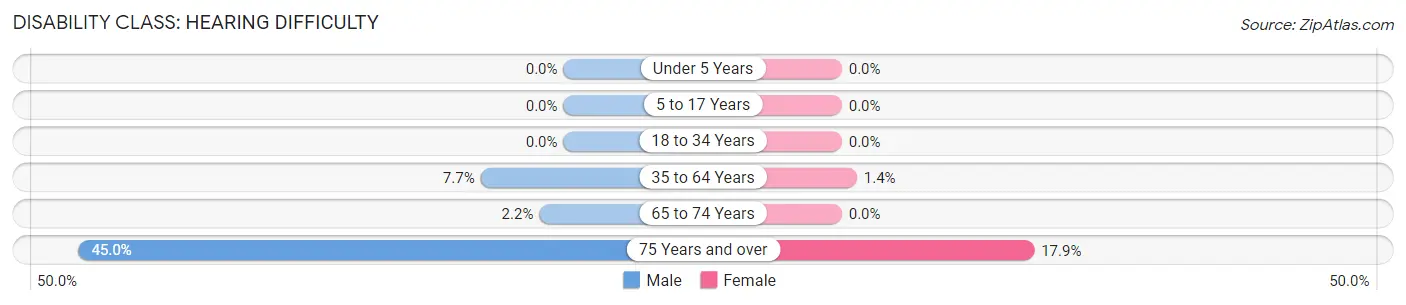
| Age Bracket | Male | Female |
| Under 5 Years | 0 (0.0%) | 0 (0.0%) |
| 5 to 17 Years | 0 (0.0%) | 0 (0.0%) |
| 18 to 34 Years | 0 (0.0%) | 0 (0.0%) |
| 35 to 64 Years | 10 (7.7%) | 2 (1.4%) |
| 65 to 74 Years | 3 (2.2%) | 0 (0.0%) |
| 75 Years and over | 18 (45.0%) | 5 (17.9%) |
Disability Class: Vision Difficulty
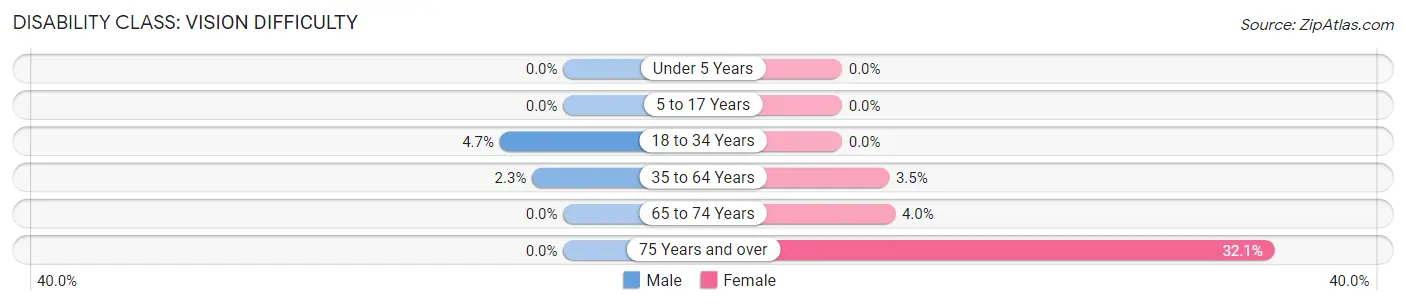
| Age Bracket | Male | Female |
| Under 5 Years | 0 (0.0%) | 0 (0.0%) |
| 5 to 17 Years | 0 (0.0%) | 0 (0.0%) |
| 18 to 34 Years | 5 (4.7%) | 0 (0.0%) |
| 35 to 64 Years | 3 (2.3%) | 5 (3.5%) |
| 65 to 74 Years | 0 (0.0%) | 3 (4.0%) |
| 75 Years and over | 0 (0.0%) | 9 (32.1%) |
Disability Class: Cognitive Difficulty
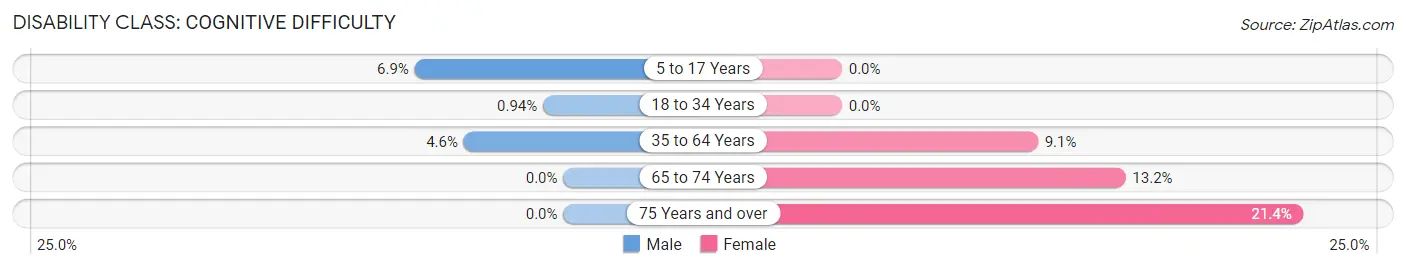
| Age Bracket | Male | Female |
| 5 to 17 Years | 4 (6.9%) | 0 (0.0%) |
| 18 to 34 Years | 1 (0.9%) | 0 (0.0%) |
| 35 to 64 Years | 6 (4.6%) | 13 (9.1%) |
| 65 to 74 Years | 0 (0.0%) | 10 (13.2%) |
| 75 Years and over | 0 (0.0%) | 6 (21.4%) |
Disability Class: Ambulatory Difficulty
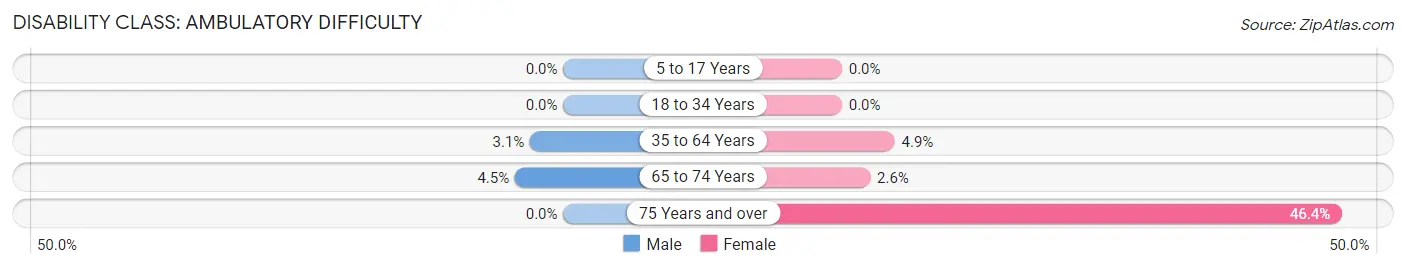
| Age Bracket | Male | Female |
| 5 to 17 Years | 0 (0.0%) | 0 (0.0%) |
| 18 to 34 Years | 0 (0.0%) | 0 (0.0%) |
| 35 to 64 Years | 4 (3.1%) | 7 (4.9%) |
| 65 to 74 Years | 6 (4.5%) | 2 (2.6%) |
| 75 Years and over | 0 (0.0%) | 13 (46.4%) |
Disability Class: Self-Care Difficulty
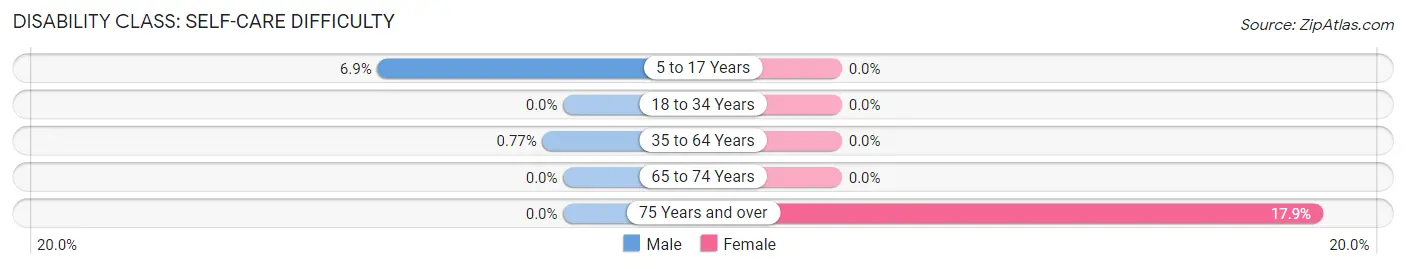
| Age Bracket | Male | Female |
| 5 to 17 Years | 4 (6.9%) | 0 (0.0%) |
| 18 to 34 Years | 0 (0.0%) | 0 (0.0%) |
| 35 to 64 Years | 1 (0.8%) | 0 (0.0%) |
| 65 to 74 Years | 0 (0.0%) | 0 (0.0%) |
| 75 Years and over | 0 (0.0%) | 5 (17.9%) |
Technology Access in Bath Berkeley Springs
Computing Device Access in Bath Berkeley Springs
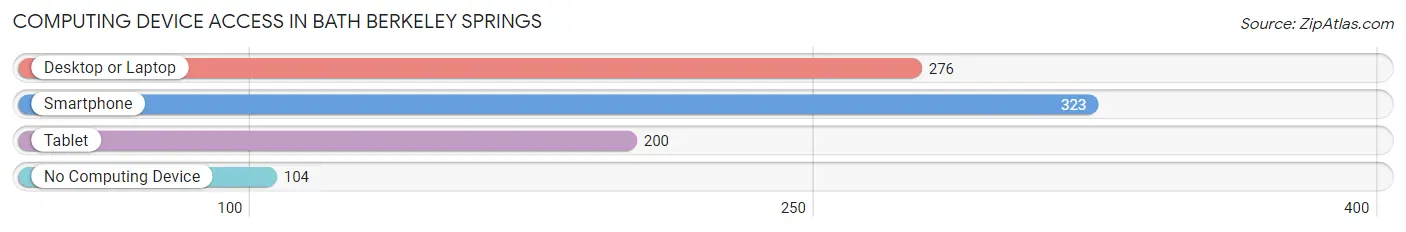
| Device Type | # Households | % Households |
| Desktop or Laptop | 276 | 59.6% |
| Smartphone | 323 | 69.8% |
| Tablet | 200 | 43.2% |
| No Computing Device | 104 | 22.5% |
| Total | 463 | 100.0% |
Internet Access in Bath Berkeley Springs
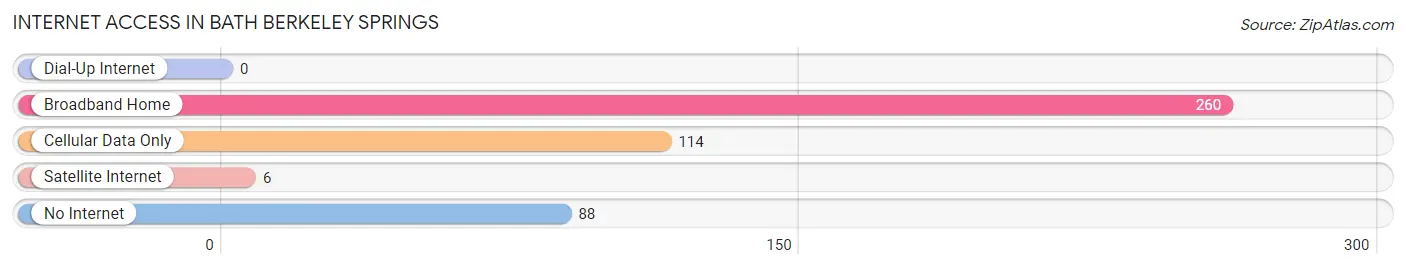
| Internet Type | # Households | % Households |
| Dial-Up Internet | 0 | 0.0% |
| Broadband Home | 260 | 56.2% |
| Cellular Data Only | 114 | 24.6% |
| Satellite Internet | 6 | 1.3% |
| No Internet | 88 | 19.0% |
| Total | 463 | 100.0% |
Bath Berkeley Springs Summary
Bath Berkeley Springs, West Virginia is a small town located in the eastern panhandle of the state. It is situated in Morgan County, and is the county seat. The town is known for its natural hot springs, which have been used for centuries by Native Americans and early settlers. The town is also known for its historic architecture, which includes the Berkeley Springs State Park and the Berkeley Springs Castle.
History
The area that is now Bath Berkeley Springs has been inhabited for thousands of years. Native Americans, including the Shawnee, Iroquois, and Susquehannock, used the hot springs for healing and spiritual purposes. The springs were also a popular destination for early settlers, who believed that the waters had healing properties.
In 1776, the town was officially established as Bath, named after the English spa town of Bath. The town was later renamed Berkeley Springs in honor of Norborne Berkeley, the colonial governor of Virginia.
In the 19th century, the town became a popular destination for wealthy Americans, who built grand homes and resorts in the area. The town was also home to several prominent figures, including George Washington, who visited the town in 1784 and 1785.
Geography
Bath Berkeley Springs is located in the eastern panhandle of West Virginia, in Morgan County. The town is situated in the Appalachian Mountains, and is surrounded by forests and rolling hills. The town is located near the Potomac River, and is approximately 90 miles from Washington, D.C.
The town has a humid continental climate, with hot summers and cold winters. The average annual temperature is 54 degrees Fahrenheit, and the average annual precipitation is 40 inches.
Economy
The economy of Bath Berkeley Springs is largely based on tourism. The town is home to several resorts and spas, which attract visitors from around the world. The town is also home to several wineries, breweries, and distilleries, which produce a variety of local wines, beers, and spirits.
The town is also home to several manufacturing companies, including a paper mill and a furniture factory. The town is also home to several retail stores, restaurants, and other businesses.
Demographics
As of the 2010 census, the population of Bath Berkeley Springs was 624. The town is predominantly white, with a small African American population. The median household income is $37,500, and the median home value is $150,000.
The town is home to several churches, including the Berkeley Springs United Methodist Church, the Berkeley Springs Presbyterian Church, and the Berkeley Springs Baptist Church. The town is also home to several schools, including Berkeley Springs High School and Berkeley Springs Elementary School.
Conclusion
Bath Berkeley Springs is a small town located in the eastern panhandle of West Virginia. The town is known for its natural hot springs, which have been used for centuries by Native Americans and early settlers. The town is also known for its historic architecture, which includes the Berkeley Springs State Park and the Berkeley Springs Castle. The economy of the town is largely based on tourism, and the town is home to several resorts, wineries, breweries, and distilleries. The population of the town is predominantly white, with a small African American population. The town is home to several churches and schools, and is a popular destination for visitors from around the world.
Common Questions
What is Per Capita Income in Bath Berkeley Springs?
Per Capita income in Bath Berkeley Springs is $25,336.
What is the Median Family Income in Bath Berkeley Springs?
Median Family Income in Bath Berkeley Springs is $53,250.
What is the Median Household income in Bath Berkeley Springs?
Median Household Income in Bath Berkeley Springs is $31,094.
What is Income or Wage Gap in Bath Berkeley Springs?
Income or Wage Gap in Bath Berkeley Springs is 33.2%.
Women in Bath Berkeley Springs earn 66.8 cents for every dollar earned by a man.
What is Inequality or Gini Index in Bath Berkeley Springs?
Inequality or Gini Index in Bath Berkeley Springs is 0.44.
What is the Total Population of Bath Berkeley Springs?
Total Population of Bath Berkeley Springs is 897.
What is the Total Male Population of Bath Berkeley Springs?
Total Male Population of Bath Berkeley Springs is 487.
What is the Total Female Population of Bath Berkeley Springs?
Total Female Population of Bath Berkeley Springs is 410.
What is the Ratio of Males per 100 Females in Bath Berkeley Springs?
There are 118.78 Males per 100 Females in Bath Berkeley Springs.
What is the Ratio of Females per 100 Males in Bath Berkeley Springs?
There are 84.19 Females per 100 Males in Bath Berkeley Springs.
What is the Median Population Age in Bath Berkeley Springs?
Median Population Age in Bath Berkeley Springs is 47.4 Years.
What is the Average Family Size in Bath Berkeley Springs
Average Family Size in Bath Berkeley Springs is 2.9 People.
What is the Average Household Size in Bath Berkeley Springs
Average Household Size in Bath Berkeley Springs is 1.9 People.
How Large is the Labor Force in Bath Berkeley Springs?
There are 322 People in the Labor Forcein in Bath Berkeley Springs.
What is the Percentage of People in the Labor Force in Bath Berkeley Springs?
42.6% of People are in the Labor Force in Bath Berkeley Springs.
What is the Unemployment Rate in Bath Berkeley Springs?
Unemployment Rate in Bath Berkeley Springs is 2.2%.