Cities with the Highest Percentage of Families with Income Above $200,000 in West Virginia
RELATED REPORTS & OPTIONS
Family Income | $200k+
West Virginia
Compare Cities
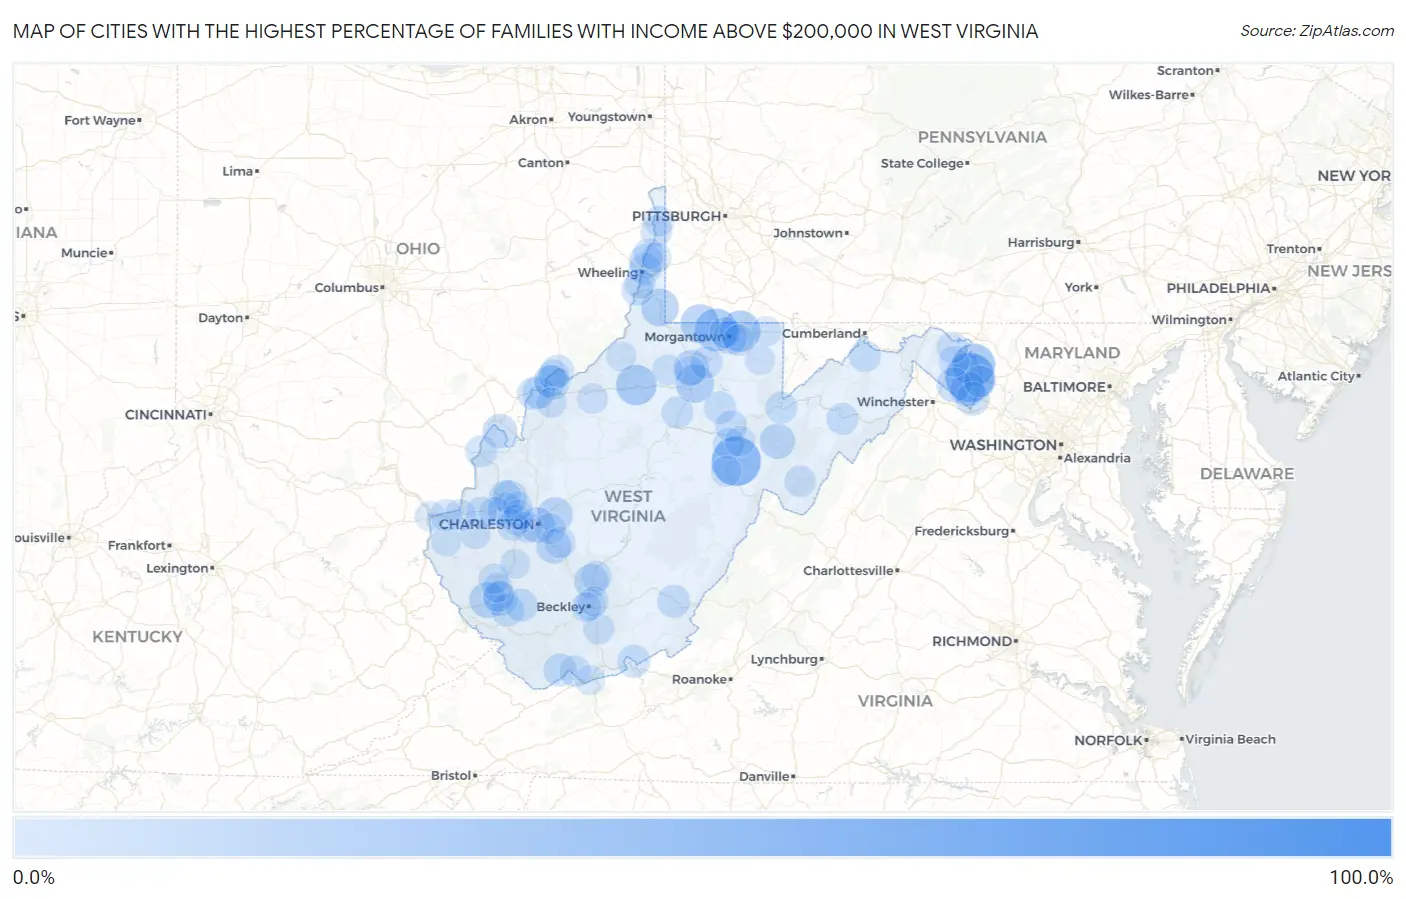
Map of Cities with the Highest Percentage of Families with Income Above $200,000 in West Virginia
0.0%
100.0%
Cities with the Highest Percentage of Families with Income Above $200,000 in West Virginia
| City | Families with Income > $200k | vs State | vs National | |
| 1. | Peach Creek | 100.0% | 6.6%(+93.4)#1 | 14.8%(+85.2)#27 |
| 2. | East Dailey | 49.5% | 6.6%(+42.9)#2 | 14.8%(+34.7)#818 |
| 3. | Shenandoah Junction | 48.9% | 6.6%(+42.3)#3 | 14.8%(+34.1)#847 |
| 4. | Norton | 42.9% | 6.6%(+36.3)#4 | 14.8%(+28.1)#1,182 |
| 5. | Booth | 37.0% | 6.6%(+30.4)#5 | 14.8%(+22.2)#1,659 |
| 6. | Shepherdstown | 34.1% | 6.6%(+27.5)#6 | 14.8%(+19.3)#1,933 |
| 7. | Cassville | 33.7% | 6.6%(+27.1)#7 | 14.8%(+18.9)#1,971 |
| 8. | Cheat Lake | 30.1% | 6.6%(+23.5)#8 | 14.8%(+15.3)#2,358 |
| 9. | West Union | 28.6% | 6.6%(+22.0)#9 | 14.8%(+13.8)#2,569 |
| 10. | Blacksville | 25.0% | 6.6%(+18.4)#10 | 14.8%(+10.2)#3,126 |
| 11. | Bridgeport | 23.4% | 6.6%(+16.8)#11 | 14.8%(+8.60)#3,393 |
| 12. | Cameron | 22.0% | 6.6%(+15.4)#12 | 14.8%(+7.20)#3,687 |
| 13. | Holden | 18.5% | 6.6%(+11.9)#13 | 14.8%(+3.70)#4,498 |
| 14. | Pinch | 17.3% | 6.6%(+10.7)#14 | 14.8%(+2.50)#4,866 |
| 15. | Charleston | 17.1% | 6.6%(+10.5)#15 | 14.8%(+2.30)#4,917 |
| 16. | Harman | 16.7% | 6.6%(+10.1)#16 | 14.8%(+1.90)#5,055 |
| 17. | Enterprise | 16.5% | 6.6%(+9.90)#17 | 14.8%(+1.70)#5,117 |
| 18. | Charles Town | 15.7% | 6.6%(+9.10)#18 | 14.8%(+0.900)#5,383 |
| 19. | Chelyan | 15.3% | 6.6%(+8.70)#19 | 14.8%(+0.500)#5,536 |
| 20. | Middleway | 15.0% | 6.6%(+8.40)#20 | 14.8%(+0.200)#5,655 |
| 21. | Scarbro | 14.8% | 6.6%(+8.20)#21 | 14.8%(=0.000)#5,730 |
| 22. | Teays Valley | 14.4% | 6.6%(+7.80)#22 | 14.8%(-0.400)#5,863 |
| 23. | Winfield | 14.3% | 6.6%(+7.70)#23 | 14.8%(-0.500)#5,907 |
| 24. | New Haven | 14.3% | 6.6%(+7.70)#24 | 14.8%(-0.500)#5,911 |
| 25. | North Hills | 14.0% | 6.6%(+7.40)#25 | 14.8%(-0.800)#6,056 |
| 26. | Mcconnell | 13.8% | 6.6%(+7.20)#26 | 14.8%(-1.00)#6,161 |
| 27. | Clearview | 13.8% | 6.6%(+7.20)#27 | 14.8%(-1.00)#6,166 |
| 28. | Morgantown | 13.3% | 6.6%(+6.70)#28 | 14.8%(-1.50)#6,362 |
| 29. | Shannondale | 12.9% | 6.6%(+6.30)#29 | 14.8%(-1.90)#6,568 |
| 30. | Anawalt | 11.8% | 6.6%(+5.20)#30 | 14.8%(-3.00)#7,138 |
| 31. | Washington | 11.4% | 6.6%(+4.80)#31 | 14.8%(-3.40)#7,381 |
| 32. | Williamstown | 11.3% | 6.6%(+4.70)#32 | 14.8%(-3.50)#7,424 |
| 33. | Lewisburg | 11.2% | 6.6%(+4.60)#33 | 14.8%(-3.60)#7,480 |
| 34. | Peterstown | 11.2% | 6.6%(+4.60)#34 | 14.8%(-3.60)#7,504 |
| 35. | Man | 11.1% | 6.6%(+4.50)#35 | 14.8%(-3.70)#7,566 |
| 36. | Robinette | 11.0% | 6.6%(+4.40)#36 | 14.8%(-3.80)#7,650 |
| 37. | Philippi | 10.2% | 6.6%(+3.60)#37 | 14.8%(-4.60)#8,109 |
| 38. | Blennerhassett | 10.1% | 6.6%(+3.50)#38 | 14.8%(-4.70)#8,180 |
| 39. | Vienna | 9.8% | 6.6%(+3.20)#39 | 14.8%(-5.00)#8,404 |
| 40. | Pleasant Valley | 9.8% | 6.6%(+3.20)#40 | 14.8%(-5.00)#8,418 |
| 41. | Eleanor | 9.4% | 6.6%(+2.80)#41 | 14.8%(-5.40)#8,709 |
| 42. | Jane Lew | 9.4% | 6.6%(+2.80)#42 | 14.8%(-5.40)#8,724 |
| 43. | Point Pleasant | 9.3% | 6.6%(+2.70)#43 | 14.8%(-5.50)#8,776 |
| 44. | Moorefield | 9.1% | 6.6%(+2.50)#44 | 14.8%(-5.70)#8,926 |
| 45. | Wheeling | 9.0% | 6.6%(+2.40)#45 | 14.8%(-5.80)#9,001 |
| 46. | Belington | 8.9% | 6.6%(+2.30)#46 | 14.8%(-5.90)#9,093 |
| 47. | Arthurdale | 8.8% | 6.6%(+2.20)#47 | 14.8%(-6.00)#9,178 |
| 48. | Glen Dale | 8.7% | 6.6%(+2.10)#48 | 14.8%(-6.10)#9,268 |
| 49. | Fort Ashby | 8.7% | 6.6%(+2.10)#49 | 14.8%(-6.10)#9,275 |
| 50. | Thomas | 8.7% | 6.6%(+2.10)#50 | 14.8%(-6.10)#9,291 |
| 51. | Bolivar | 8.6% | 6.6%(+2.00)#51 | 14.8%(-6.20)#9,373 |
| 52. | Tornado | 8.5% | 6.6%(+1.90)#52 | 14.8%(-6.30)#9,468 |
| 53. | Follansbee | 8.3% | 6.6%(+1.70)#53 | 14.8%(-6.50)#9,603 |
| 54. | Womelsdorf Coalton | 8.3% | 6.6%(+1.70)#54 | 14.8%(-6.50)#9,650 |
| 55. | Dupont | 8.2% | 6.6%(+1.60)#55 | 14.8%(-6.60)#9,757 |
| 56. | Huntington | 8.1% | 6.6%(+1.50)#56 | 14.8%(-6.70)#9,777 |
| 57. | Pea Ridge | 8.1% | 6.6%(+1.50)#57 | 14.8%(-6.70)#9,797 |
| 58. | Hurricane | 8.0% | 6.6%(+1.40)#58 | 14.8%(-6.80)#9,898 |
| 59. | Reynoldsville | 7.9% | 6.6%(+1.30)#59 | 14.8%(-6.90)#10,058 |
| 60. | Logan | 7.7% | 6.6%(+1.10)#60 | 14.8%(-7.10)#10,205 |
| 61. | Clifton | 7.7% | 6.6%(+1.10)#61 | 14.8%(-7.10)#10,226 |
| 62. | Star City | 7.6% | 6.6%(+1.000)#62 | 14.8%(-7.20)#10,304 |
| 63. | Cedar Grove | 7.6% | 6.6%(+1.000)#63 | 14.8%(-7.20)#10,328 |
| 64. | Ghent | 7.5% | 6.6%(+0.900)#64 | 14.8%(-7.30)#10,435 |
| 65. | Franklin | 7.5% | 6.6%(+0.900)#65 | 14.8%(-7.30)#10,437 |
| 66. | Hedgesville | 7.5% | 6.6%(+0.900)#66 | 14.8%(-7.30)#10,443 |
| 67. | Milton | 7.4% | 6.6%(+0.800)#67 | 14.8%(-7.40)#10,497 |
| 68. | Bramwell | 7.4% | 6.6%(+0.800)#68 | 14.8%(-7.40)#10,554 |
| 69. | Beckley | 7.3% | 6.6%(+0.700)#69 | 14.8%(-7.50)#10,581 |
| 70. | Brookhaven | 7.2% | 6.6%(+0.600)#70 | 14.8%(-7.60)#10,697 |
| 71. | Boaz | 7.1% | 6.6%(+0.500)#71 | 14.8%(-7.70)#10,838 |
| 72. | Shinnston | 6.9% | 6.6%(+0.300)#72 | 14.8%(-7.90)#11,049 |
| 73. | Coal Fork | 6.8% | 6.6%(+0.200)#73 | 14.8%(-8.00)#11,167 |
| 74. | Windsor Heights | 6.7% | 6.6%(+0.100)#74 | 14.8%(-8.10)#11,310 |
| 75. | Huttonsville | 6.7% | 6.6%(+0.100)#75 | 14.8%(-8.10)#11,340 |
| 76. | Martinsburg | 6.6% | 6.6%(=0.000)#76 | 14.8%(-8.20)#11,370 |
| 77. | South Charleston | 6.6% | 6.6%(=0.000)#77 | 14.8%(-8.20)#11,378 |
| 78. | Oak Hill | 6.5% | 6.6%(-0.100)#78 | 14.8%(-8.30)#11,485 |
| 79. | St Albans | 6.4% | 6.6%(-0.200)#79 | 14.8%(-8.40)#11,622 |
| 80. | Weirton | 5.9% | 6.6%(-0.700)#80 | 14.8%(-8.90)#12,214 |
| 81. | Cairo | 5.9% | 6.6%(-0.700)#81 | 14.8%(-8.90)#12,332 |
| 82. | Chapmanville | 5.8% | 6.6%(-0.800)#82 | 14.8%(-9.00)#12,423 |
| 83. | Wallace | 5.7% | 6.6%(-0.900)#83 | 14.8%(-9.10)#12,592 |
| 84. | West Hamlin | 5.6% | 6.6%(-1.00)#84 | 14.8%(-9.20)#12,707 |
| 85. | Elkins | 5.5% | 6.6%(-1.10)#85 | 14.8%(-9.30)#12,770 |
| 86. | Mineralwells | 5.5% | 6.6%(-1.10)#86 | 14.8%(-9.30)#12,801 |
| 87. | Mcmechen | 5.5% | 6.6%(-1.10)#87 | 14.8%(-9.30)#12,808 |
| 88. | Nitro | 5.4% | 6.6%(-1.20)#88 | 14.8%(-9.40)#12,885 |
| 89. | Kenova | 5.3% | 6.6%(-1.30)#89 | 14.8%(-9.50)#13,023 |
| 90. | Wayne | 5.3% | 6.6%(-1.30)#90 | 14.8%(-9.50)#13,066 |
| 91. | Mitchell Heights | 5.1% | 6.6%(-1.50)#91 | 14.8%(-9.70)#13,370 |
| 92. | Kingwood | 5.0% | 6.6%(-1.60)#92 | 14.8%(-9.80)#13,452 |
| 93. | West Liberty | 4.9% | 6.6%(-1.70)#93 | 14.8%(-9.90)#13,617 |
| 94. | Stanaford | 4.9% | 6.6%(-1.70)#94 | 14.8%(-9.90)#13,630 |
| 95. | Danville | 4.9% | 6.6%(-1.70)#95 | 14.8%(-9.90)#13,668 |
| 96. | Mabscott | 4.8% | 6.6%(-1.80)#96 | 14.8%(-10.0)#13,777 |
| 97. | Bluefield | 4.7% | 6.6%(-1.90)#97 | 14.8%(-10.1)#13,874 |
| 98. | Poca | 4.7% | 6.6%(-1.90)#98 | 14.8%(-10.1)#13,936 |
| 99. | Middlebourne | 4.7% | 6.6%(-1.90)#99 | 14.8%(-10.1)#13,956 |
| 100. | Brandonville | 4.7% | 6.6%(-1.90)#100 | 14.8%(-10.1)#14,002 |
Common Questions
What are the Top 10 Cities with the Highest Percentage of Families with Income Above $200,000 in West Virginia?
Top 10 Cities with the Highest Percentage of Families with Income Above $200,000 in West Virginia are:
#1
49.5%
#2
48.9%
#3
34.1%
#4
33.7%
#5
30.1%
#6
28.6%
#7
25.0%
#8
23.4%
#9
22.0%
#10
18.5%
What city has the Highest Percentage of Families with Income Above $200,000 in West Virginia?
East Dailey has the Highest Percentage of Families with Income Above $200,000 in West Virginia with 49.5%.
What is the Percentage of Families with Income Above $200,000 in the State of West Virginia?
Percentage of Families with Income Above $200,000 in West Virginia is 6.6%.
What is the Percentage of Families with Income Above $200,000 in the United States?
Percentage of Families with Income Above $200,000 in the United States is 14.8%.