Flemington, WV Map & Demographics
Flemington Map
Flemington Overview
$20,099
PER CAPITA INCOME
$83,750
AVG FAMILY INCOME
$54,286
AVG HOUSEHOLD INCOME
14.9%
WAGE / INCOME GAP [ % ]
85.1¢/ $1
WAGE / INCOME GAP [ $ ]
0.39
INEQUALITY / GINI INDEX
291
TOTAL POPULATION
148
MALE POPULATION
143
FEMALE POPULATION
103.50
MALES / 100 FEMALES
96.62
FEMALES / 100 MALES
32.4
MEDIAN AGE
4.7
AVG FAMILY SIZE
3.3
AVG HOUSEHOLD SIZE
118
LABOR FORCE [ PEOPLE ]
62.4%
PERCENT IN LABOR FORCE
21.2%
UNEMPLOYMENT RATE
Flemington Zip Codes
Flemington Area Codes
Income in Flemington
Income Overview in Flemington
Per Capita Income in Flemington is $20,099, while median incomes of families and households are $83,750 and $54,286 respectively.
| Characteristic | Number | Measure |
| Per Capita Income | 291 | $20,099 |
| Median Family Income | 50 | $83,750 |
| Mean Family Income | 50 | $82,380 |
| Median Household Income | 88 | $54,286 |
| Mean Household Income | 88 | $64,865 |
| Income Deficit | 50 | $0 |
| Wage / Income Gap (%) | 291 | 14.92% |
| Wage / Income Gap ($) | 291 | 85.08¢ per $1 |
| Gini / Inequality Index | 291 | 0.39 |
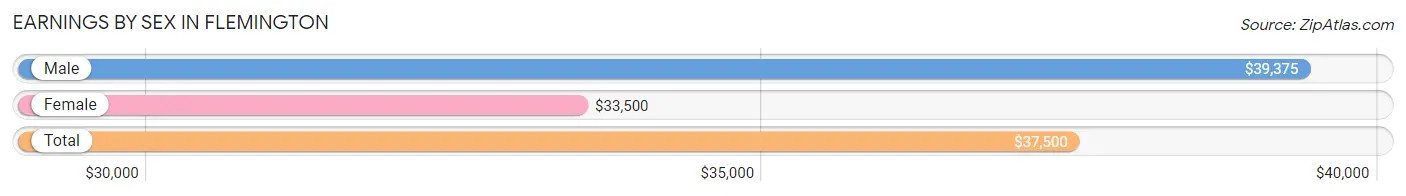
Earnings by Sex in Flemington
Average Earnings in Flemington are $37,500, $39,375 for men and $33,500 for women, a difference of 14.9%.
| Sex | Number | Average Earnings |
| Male | 60 (57.7%) | $39,375 |
| Female | 44 (42.3%) | $33,500 |
| Total | 104 (100.0%) | $37,500 |
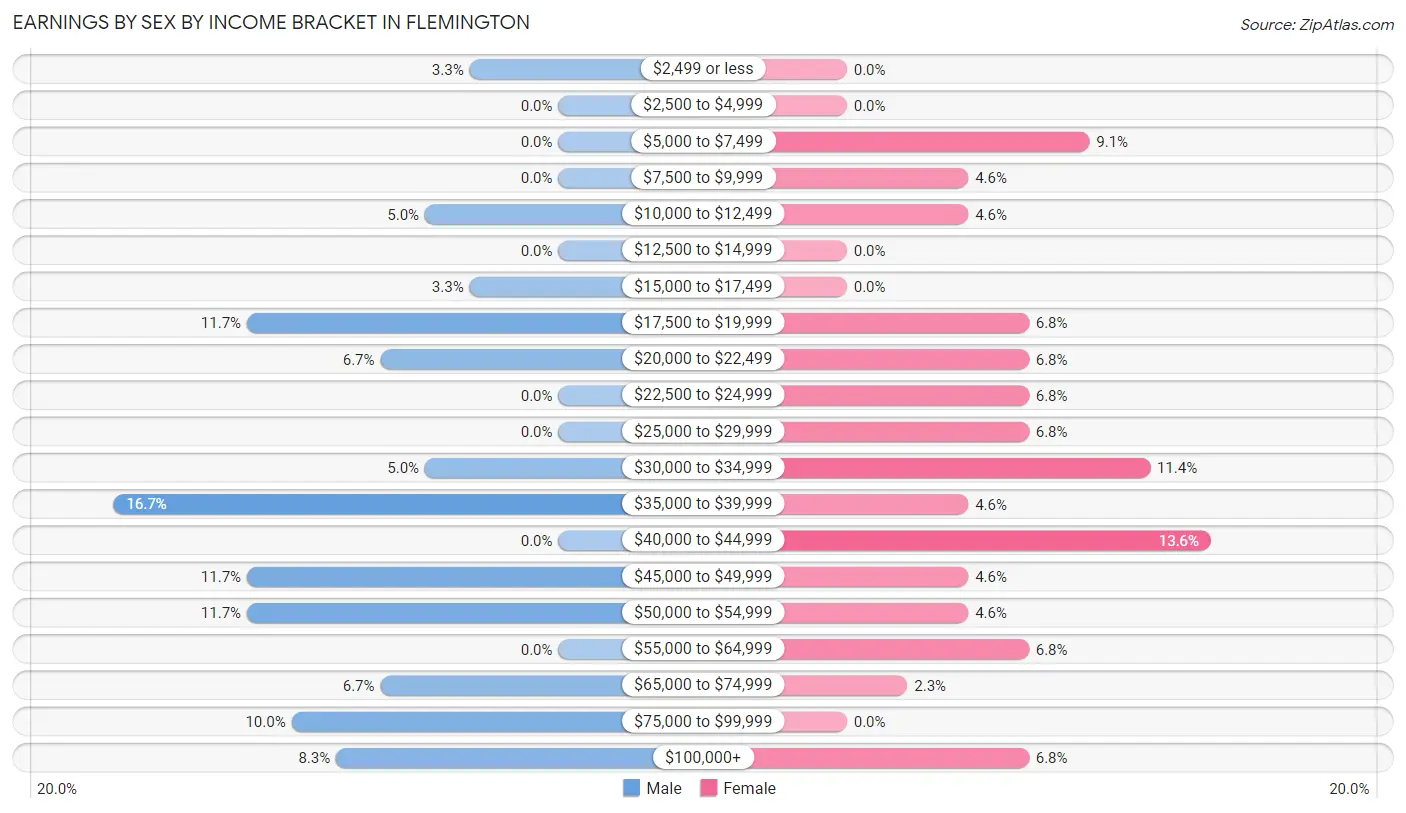
Earnings by Sex by Income Bracket in Flemington
The most common earnings brackets in Flemington are $35,000 to $39,999 for men (10 | 16.7%) and $40,000 to $44,999 for women (6 | 13.6%).
| Income | Male | Female |
| $2,499 or less | 2 (3.3%) | 0 (0.0%) |
| $2,500 to $4,999 | 0 (0.0%) | 0 (0.0%) |
| $5,000 to $7,499 | 0 (0.0%) | 4 (9.1%) |
| $7,500 to $9,999 | 0 (0.0%) | 2 (4.5%) |
| $10,000 to $12,499 | 3 (5.0%) | 2 (4.5%) |
| $12,500 to $14,999 | 0 (0.0%) | 0 (0.0%) |
| $15,000 to $17,499 | 2 (3.3%) | 0 (0.0%) |
| $17,500 to $19,999 | 7 (11.7%) | 3 (6.8%) |
| $20,000 to $22,499 | 4 (6.7%) | 3 (6.8%) |
| $22,500 to $24,999 | 0 (0.0%) | 3 (6.8%) |
| $25,000 to $29,999 | 0 (0.0%) | 3 (6.8%) |
| $30,000 to $34,999 | 3 (5.0%) | 5 (11.4%) |
| $35,000 to $39,999 | 10 (16.7%) | 2 (4.5%) |
| $40,000 to $44,999 | 0 (0.0%) | 6 (13.6%) |
| $45,000 to $49,999 | 7 (11.7%) | 2 (4.5%) |
| $50,000 to $54,999 | 7 (11.7%) | 2 (4.5%) |
| $55,000 to $64,999 | 0 (0.0%) | 3 (6.8%) |
| $65,000 to $74,999 | 4 (6.7%) | 1 (2.3%) |
| $75,000 to $99,999 | 6 (10.0%) | 0 (0.0%) |
| $100,000+ | 5 (8.3%) | 3 (6.8%) |
| Total | 60 (100.0%) | 44 (100.0%) |
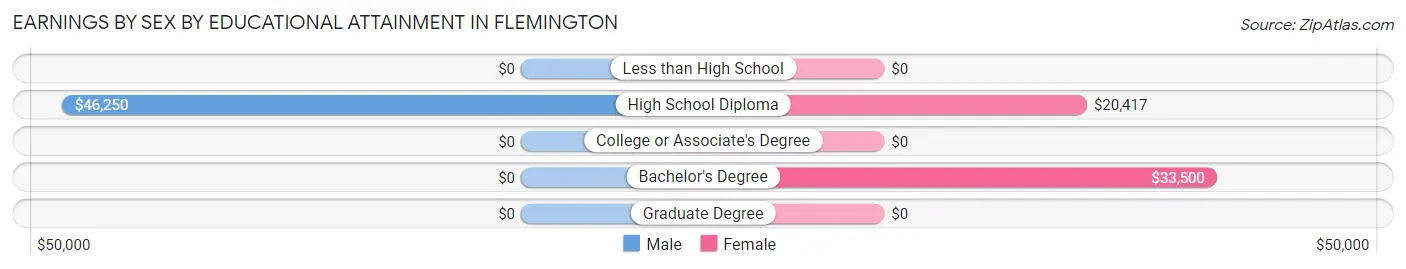
Earnings by Sex by Educational Attainment in Flemington
Average earnings in Flemington are $48,750 for men and $33,000 for women, a difference of 32.3%. Men with an educational attainment of high school diploma enjoy the highest average annual earnings of $46,250, while those with high school diploma education earn the least with $46,250. Women with an educational attainment of bachelor's degree earn the most with the average annual earnings of $33,500, while those with high school diploma education have the smallest earnings of $20,417.
| Educational Attainment | Male Income | Female Income |
| Less than High School | - | - |
| High School Diploma | $46,250 | $20,417 |
| College or Associate's Degree | - | - |
| Bachelor's Degree | - | - |
| Graduate Degree | - | - |
| Total | $48,750 | $33,000 |
Family Income in Flemington
Family Income Brackets in Flemington
According to the Flemington family income data, there are 18 families falling into the $75,000 to $99,999 income range, which is the most common income bracket and makes up 36.0% of all families.
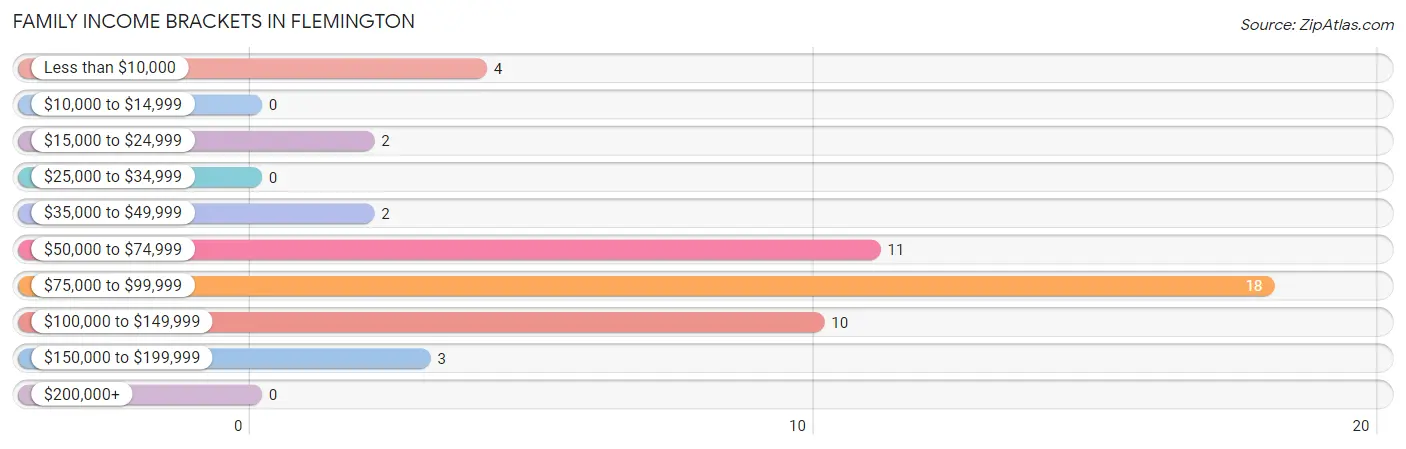
| Income Bracket | # Families | % Families |
| Less than $10,000 | 4 | 8.0% |
| $10,000 to $14,999 | 0 | 0.0% |
| $15,000 to $24,999 | 2 | 4.0% |
| $25,000 to $34,999 | 0 | 0.0% |
| $35,000 to $49,999 | 2 | 4.0% |
| $50,000 to $74,999 | 11 | 22.0% |
| $75,000 to $99,999 | 18 | 36.0% |
| $100,000 to $149,999 | 10 | 20.0% |
| $150,000 to $199,999 | 3 | 6.0% |
| $200,000+ | 0 | 0.0% |
Family Income by Famaliy Size in Flemington
2-person families (19 | 38.0%) account for the highest median family income in Flemington with $99,688 per family, while 2-person families (19 | 38.0%) have the highest median income of $49,844 per family member.
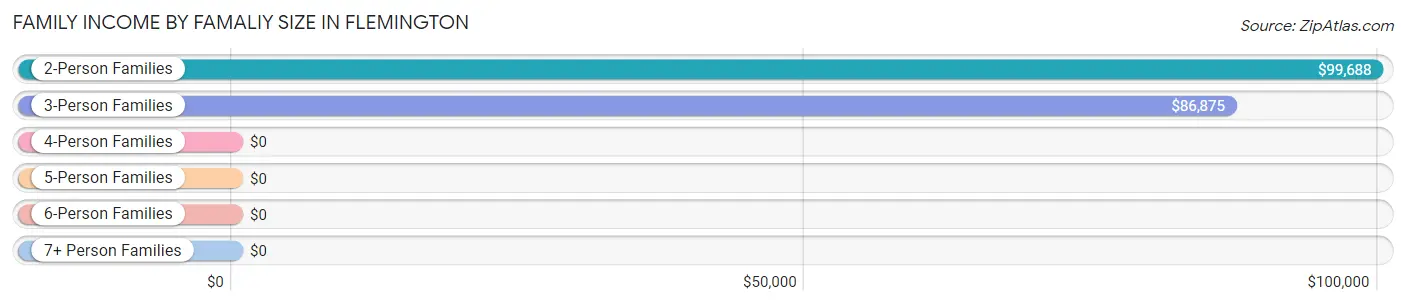
| Income Bracket | # Families | Median Income |
| 2-Person Families | 19 (38.0%) | $99,688 |
| 3-Person Families | 10 (20.0%) | $86,875 |
| 4-Person Families | 10 (20.0%) | $0 |
| 5-Person Families | 11 (22.0%) | $0 |
| 6-Person Families | 0 (0.0%) | $0 |
| 7+ Person Families | 0 (0.0%) | $0 |
| Total | 50 (100.0%) | $83,750 |
Family Income by Number of Earners in Flemington
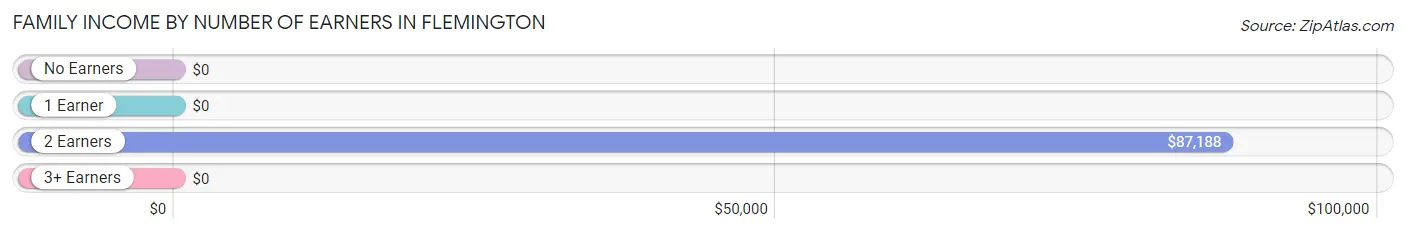
| Number of Earners | # Families | Median Income |
| No Earners | 4 (8.0%) | $0 |
| 1 Earner | 21 (42.0%) | $0 |
| 2 Earners | 23 (46.0%) | $87,188 |
| 3+ Earners | 2 (4.0%) | $0 |
| Total | 50 (100.0%) | $83,750 |
Household Income in Flemington
Household Income Brackets in Flemington
With 18 households falling in the category, the $75,000 to $99,999 income range is the most frequent in Flemington, accounting for 20.4% of all households.
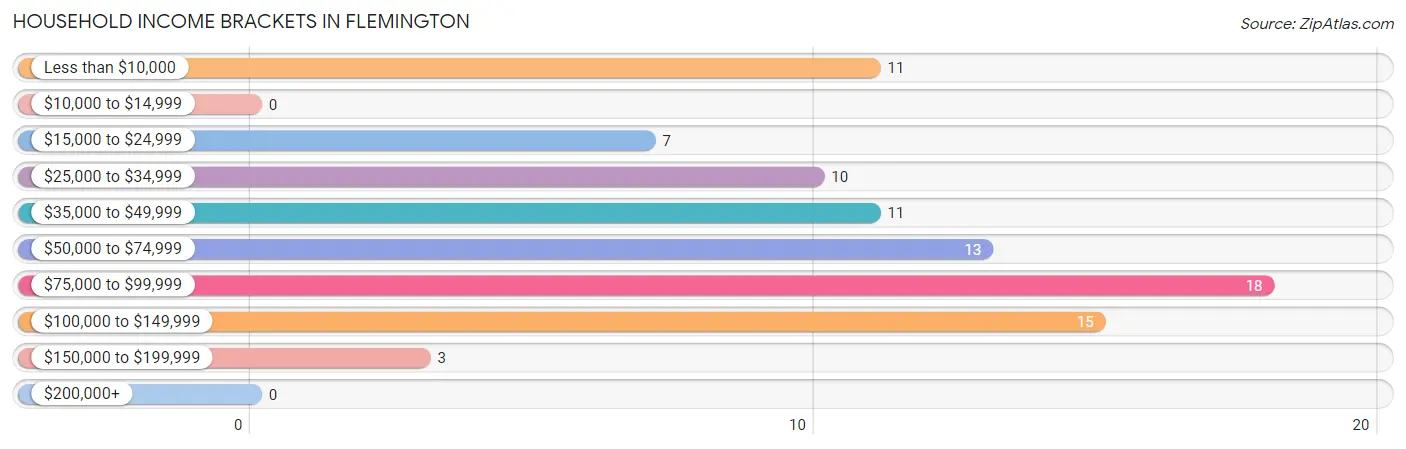
| Income Bracket | # Households | % Households |
| Less than $10,000 | 11 | 12.5% |
| $10,000 to $14,999 | 0 | 0.0% |
| $15,000 to $24,999 | 7 | 8.0% |
| $25,000 to $34,999 | 10 | 11.4% |
| $35,000 to $49,999 | 11 | 12.5% |
| $50,000 to $74,999 | 13 | 14.8% |
| $75,000 to $99,999 | 18 | 20.5% |
| $100,000 to $149,999 | 15 | 17.0% |
| $150,000 to $199,999 | 3 | 3.4% |
| $200,000+ | 0 | 0.0% |
Household Income by Householder Age in Flemington
The median household income in Flemington is $54,286, with the highest median household income of $82,500 found in the 65+ years age bracket for the primary householder. A total of 30 households (34.1%) fall into this category. Meanwhile, the 15 to 24 years age bracket for the primary householder has the lowest median household income of $0, with 8 households (9.1%) in this group.
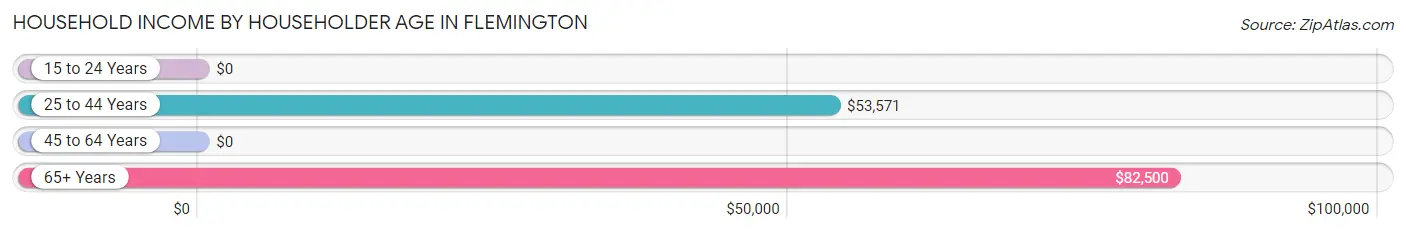
| Income Bracket | # Households | Median Income |
| 15 to 24 Years | 8 (9.1%) | $0 |
| 25 to 44 Years | 26 (29.5%) | $53,571 |
| 45 to 64 Years | 24 (27.3%) | $0 |
| 65+ Years | 30 (34.1%) | $82,500 |
| Total | 88 (100.0%) | $54,286 |
Poverty in Flemington
Income Below Poverty by Sex and Age in Flemington
With 13.5% poverty level for males and 10.5% for females among the residents of Flemington, under 5 year old males and 5 year old females are the most vulnerable to poverty, with 7 males (100.0%) and 4 females (100.0%) in their respective age groups living below the poverty level.
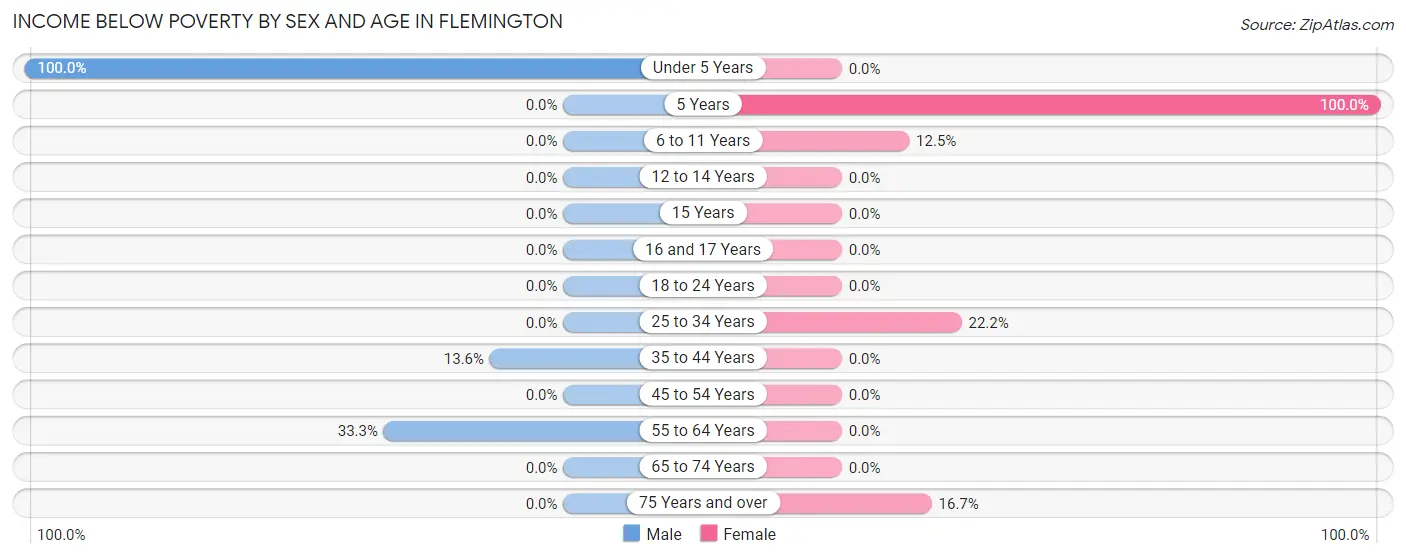
| Age Bracket | Male | Female |
| Under 5 Years | 7 (100.0%) | 0 (0.0%) |
| 5 Years | 0 (0.0%) | 4 (100.0%) |
| 6 to 11 Years | 0 (0.0%) | 5 (12.5%) |
| 12 to 14 Years | 0 (0.0%) | 0 (0.0%) |
| 15 Years | 0 (0.0%) | 0 (0.0%) |
| 16 and 17 Years | 0 (0.0%) | 0 (0.0%) |
| 18 to 24 Years | 0 (0.0%) | 0 (0.0%) |
| 25 to 34 Years | 0 (0.0%) | 4 (22.2%) |
| 35 to 44 Years | 3 (13.6%) | 0 (0.0%) |
| 45 to 54 Years | 0 (0.0%) | 0 (0.0%) |
| 55 to 64 Years | 10 (33.3%) | 0 (0.0%) |
| 65 to 74 Years | 0 (0.0%) | 0 (0.0%) |
| 75 Years and over | 0 (0.0%) | 2 (16.7%) |
| Total | 20 (13.5%) | 15 (10.5%) |
Income Above Poverty by Sex and Age in Flemington
According to the poverty statistics in Flemington, males aged 5 years and females aged under 5 years are the age groups that are most secure financially, with 100.0% of males and 100.0% of females in these age groups living above the poverty line.
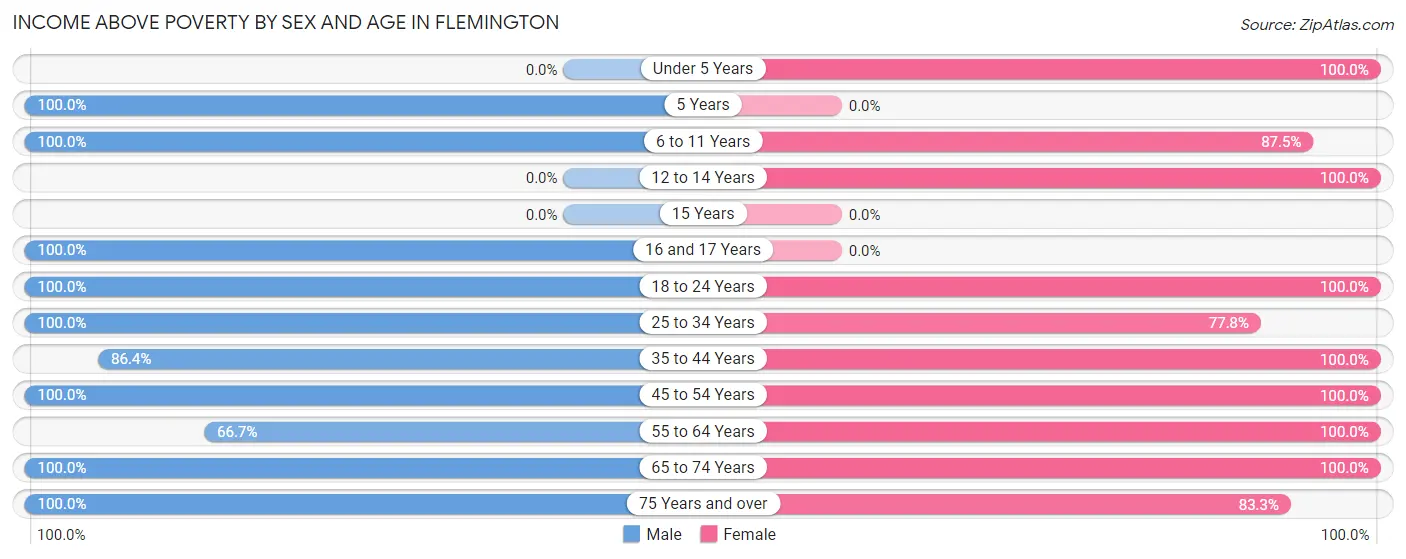
| Age Bracket | Male | Female |
| Under 5 Years | 0 (0.0%) | 3 (100.0%) |
| 5 Years | 18 (100.0%) | 0 (0.0%) |
| 6 to 11 Years | 26 (100.0%) | 35 (87.5%) |
| 12 to 14 Years | 0 (0.0%) | 4 (100.0%) |
| 15 Years | 0 (0.0%) | 0 (0.0%) |
| 16 and 17 Years | 3 (100.0%) | 0 (0.0%) |
| 18 to 24 Years | 15 (100.0%) | 6 (100.0%) |
| 25 to 34 Years | 4 (100.0%) | 14 (77.8%) |
| 35 to 44 Years | 19 (86.4%) | 8 (100.0%) |
| 45 to 54 Years | 5 (100.0%) | 19 (100.0%) |
| 55 to 64 Years | 20 (66.7%) | 9 (100.0%) |
| 65 to 74 Years | 14 (100.0%) | 20 (100.0%) |
| 75 Years and over | 4 (100.0%) | 10 (83.3%) |
| Total | 128 (86.5%) | 128 (89.5%) |
Income Below Poverty Among Married-Couple Families in Flemington
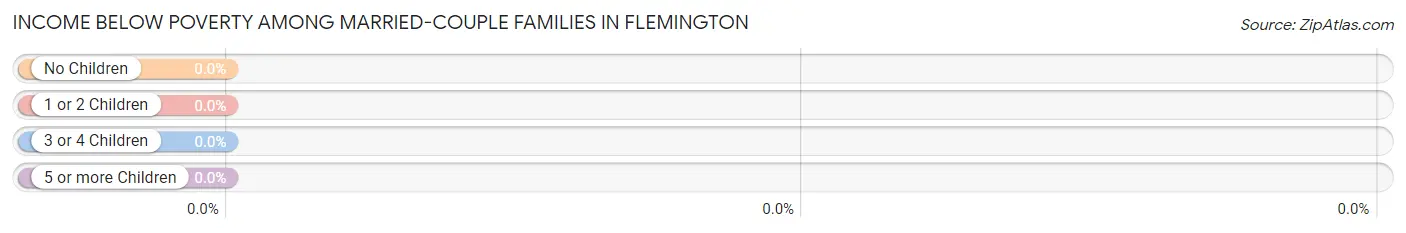
| Children | Above Poverty | Below Poverty |
| No Children | 22 (100.0%) | 0 (0.0%) |
| 1 or 2 Children | 20 (100.0%) | 0 (0.0%) |
| 3 or 4 Children | 0 (0.0%) | 0 (0.0%) |
| 5 or more Children | 0 (0.0%) | 0 (0.0%) |
| Total | 42 (100.0%) | 0 (0.0%) |
Income Below Poverty Among Single-Parent Households in Flemington
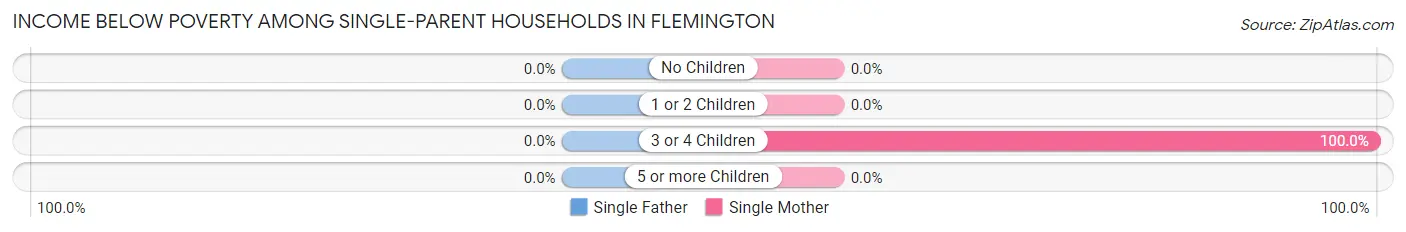
| Children | Single Father | Single Mother |
| No Children | 0 (0.0%) | 0 (0.0%) |
| 1 or 2 Children | 0 (0.0%) | 0 (0.0%) |
| 3 or 4 Children | 0 (0.0%) | 4 (100.0%) |
| 5 or more Children | 0 (0.0%) | 0 (0.0%) |
| Total | 0 (0.0%) | 4 (66.7%) |
Income Below Poverty Among Married-Couple vs Single-Parent Households in Flemington
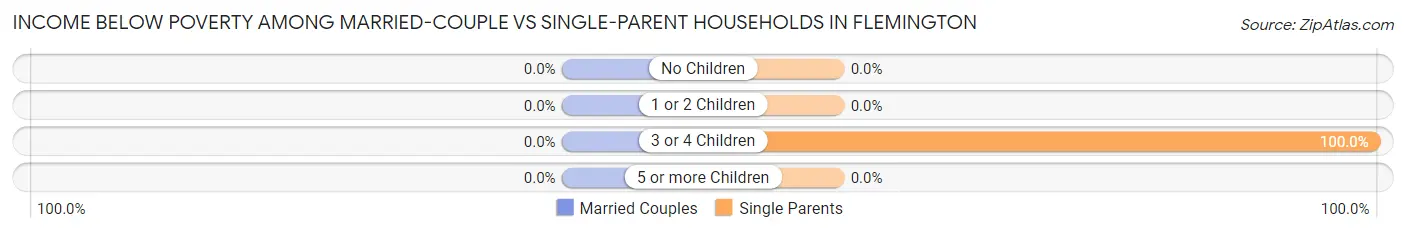
| Children | Married-Couple Families | Single-Parent Households |
| No Children | 0 (0.0%) | 0 (0.0%) |
| 1 or 2 Children | 0 (0.0%) | 0 (0.0%) |
| 3 or 4 Children | 0 (0.0%) | 4 (100.0%) |
| 5 or more Children | 0 (0.0%) | 0 (0.0%) |
| Total | 0 (0.0%) | 4 (50.0%) |
Race in Flemington
The most populous races in Flemington are , and White / Caucasian (291 | 100.0%).
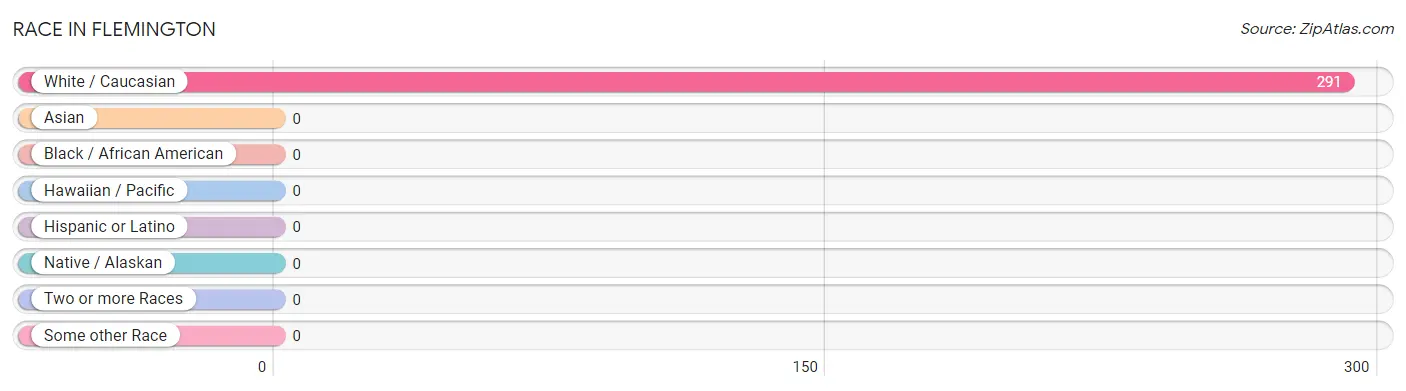
| Race | # Population | % Population |
| Asian | 0 | 0.0% |
| Black / African American | 0 | 0.0% |
| Hawaiian / Pacific | 0 | 0.0% |
| Hispanic or Latino | 0 | 0.0% |
| Native / Alaskan | 0 | 0.0% |
| White / Caucasian | 291 | 100.0% |
| Two or more Races | 0 | 0.0% |
| Some other Race | 0 | 0.0% |
| Total | 291 | 100.0% |
Ancestry in Flemington
The most populous ancestries reported in Flemington are American (105 | 36.1%), German (32 | 11.0%), Irish (26 | 8.9%), English (23 | 7.9%), and Hungarian (22 | 7.6%), together accounting for 71.5% of all Flemington residents.
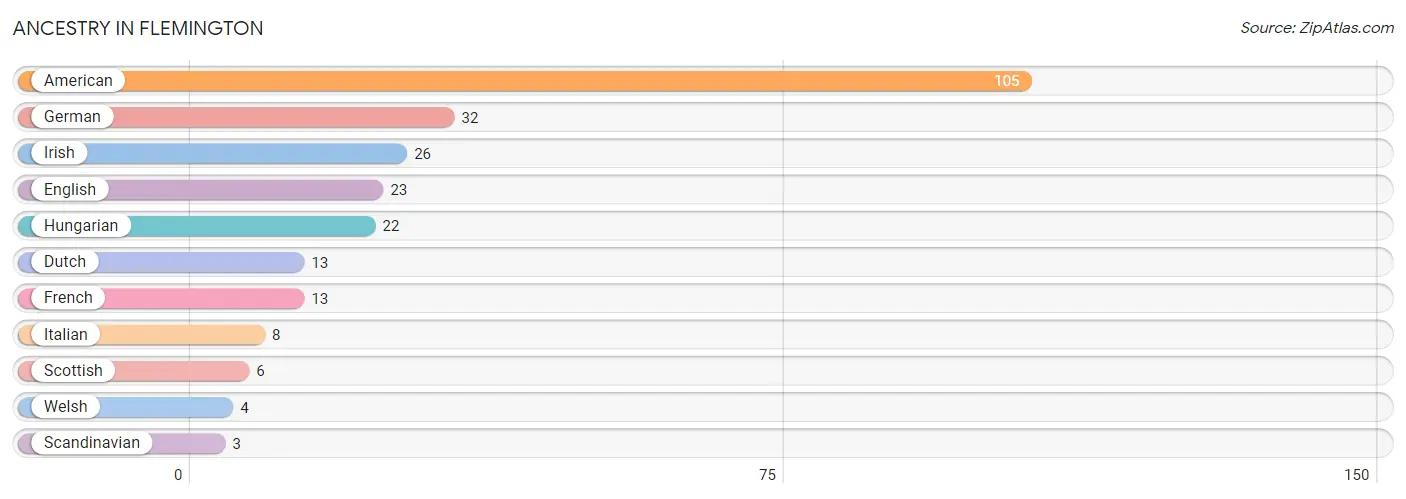
| Ancestry | # Population | % Population |
| American | 105 | 36.1% |
| Dutch | 13 | 4.5% |
| English | 23 | 7.9% |
| French | 13 | 4.5% |
| German | 32 | 11.0% |
| Hungarian | 22 | 7.6% |
| Irish | 26 | 8.9% |
| Italian | 8 | 2.8% |
| Scandinavian | 3 | 1.0% |
| Scottish | 6 | 2.1% |
| Welsh | 4 | 1.4% | View All 11 Rows |
Immigrants in Flemington

| Immigration Origin | # Population | % Population | View All 0 Rows |
Sex and Age in Flemington
Sex and Age in Flemington
The most populous age groups in Flemington are 5 to 9 Years (44 | 29.7%) for men and 5 to 9 Years (44 | 30.8%) for women.
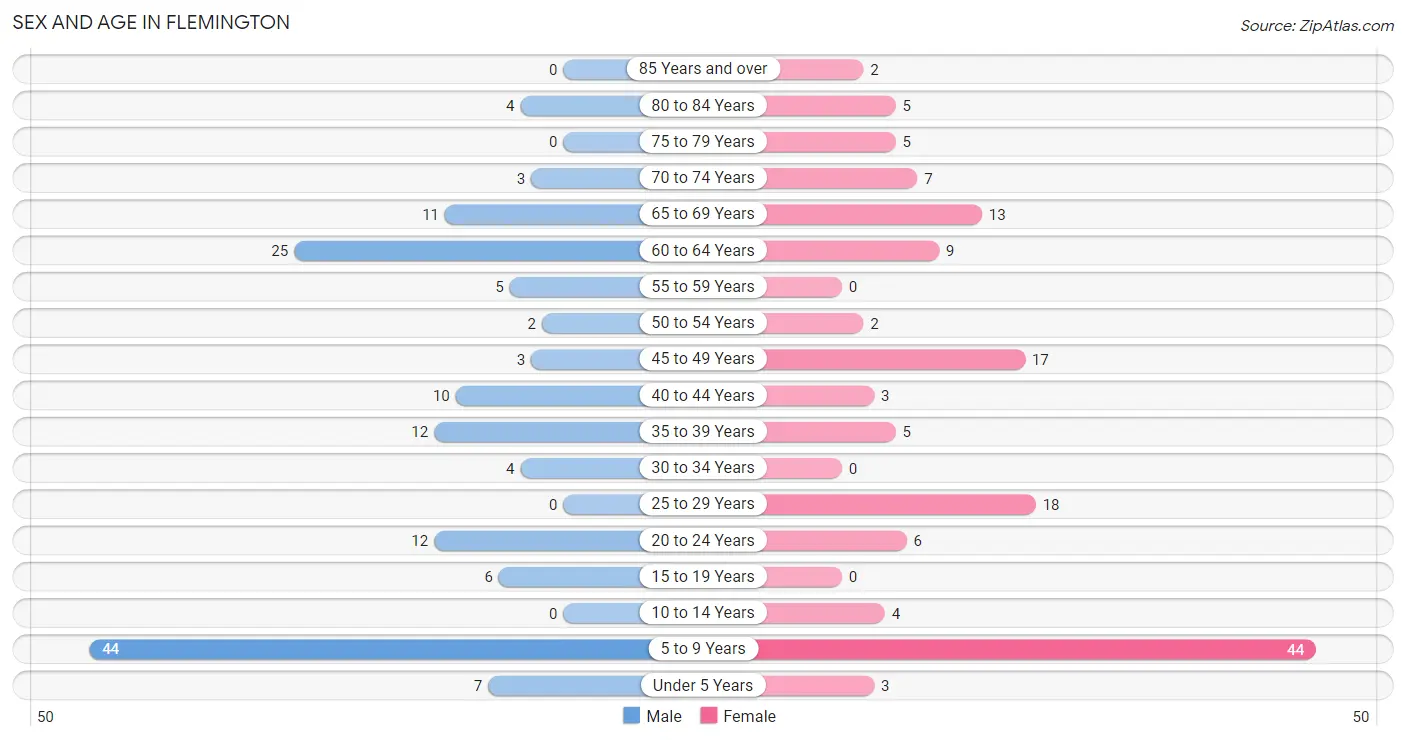
| Age Bracket | Male | Female |
| Under 5 Years | 7 (4.7%) | 3 (2.1%) |
| 5 to 9 Years | 44 (29.7%) | 44 (30.8%) |
| 10 to 14 Years | 0 (0.0%) | 4 (2.8%) |
| 15 to 19 Years | 6 (4.1%) | 0 (0.0%) |
| 20 to 24 Years | 12 (8.1%) | 6 (4.2%) |
| 25 to 29 Years | 0 (0.0%) | 18 (12.6%) |
| 30 to 34 Years | 4 (2.7%) | 0 (0.0%) |
| 35 to 39 Years | 12 (8.1%) | 5 (3.5%) |
| 40 to 44 Years | 10 (6.8%) | 3 (2.1%) |
| 45 to 49 Years | 3 (2.0%) | 17 (11.9%) |
| 50 to 54 Years | 2 (1.3%) | 2 (1.4%) |
| 55 to 59 Years | 5 (3.4%) | 0 (0.0%) |
| 60 to 64 Years | 25 (16.9%) | 9 (6.3%) |
| 65 to 69 Years | 11 (7.4%) | 13 (9.1%) |
| 70 to 74 Years | 3 (2.0%) | 7 (4.9%) |
| 75 to 79 Years | 0 (0.0%) | 5 (3.5%) |
| 80 to 84 Years | 4 (2.7%) | 5 (3.5%) |
| 85 Years and over | 0 (0.0%) | 2 (1.4%) |
| Total | 148 (100.0%) | 143 (100.0%) |
Families and Households in Flemington
Median Family Size in Flemington
The median family size in Flemington is 4.74 persons per family, with married-couple families (42 | 84.0%) accounting for the largest median family size of 4.93 persons per family. On the other hand, single male/father families (2 | 4.0%) represent the smallest median family size with 2.50 persons per family.
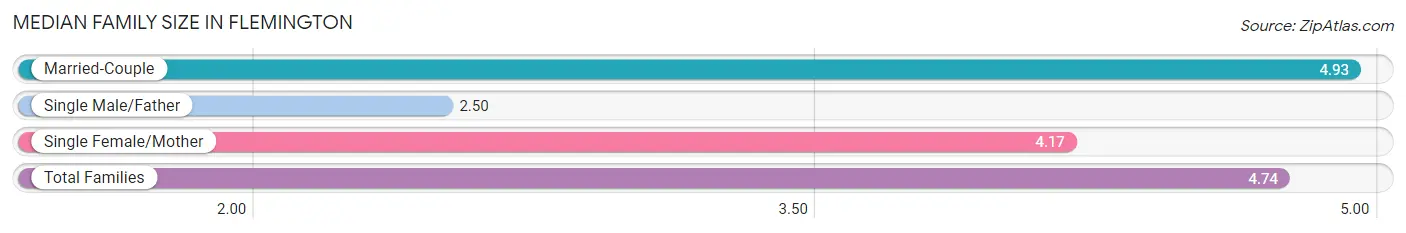
| Family Type | # Families | Family Size |
| Married-Couple | 42 (84.0%) | 4.93 |
| Single Male/Father | 2 (4.0%) | 2.50 |
| Single Female/Mother | 6 (12.0%) | 4.17 |
| Total Families | 50 (100.0%) | 4.74 |
Median Household Size in Flemington
The median household size in Flemington is 3.31 persons per household, with married-couple households (42 | 47.7%) accounting for the largest median household size of 4.93 persons per household. non-family households (38 | 43.2%) represent the smallest median household size with 1.42 persons per household.
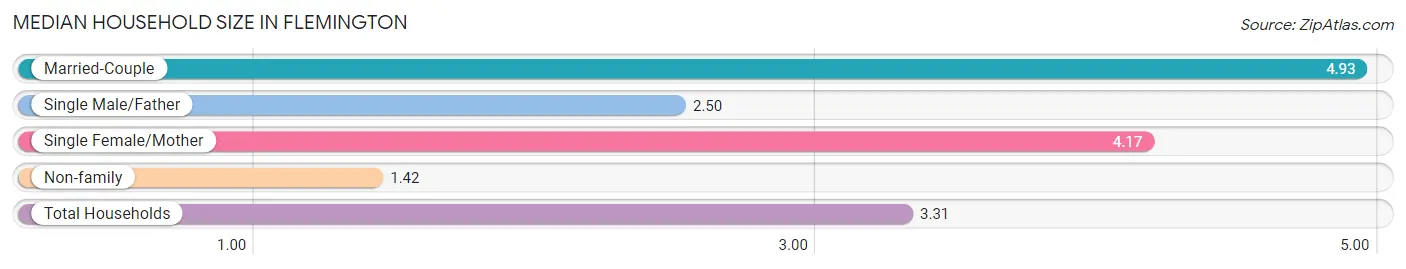
| Household Type | # Households | Household Size |
| Married-Couple | 42 (47.7%) | 4.93 |
| Single Male/Father | 2 (2.3%) | 2.50 |
| Single Female/Mother | 6 (6.8%) | 4.17 |
| Non-family | 38 (43.2%) | 1.42 |
| Total Households | 88 (100.0%) | 3.31 |
Household Size by Marriage Status in Flemington
Out of a total of 88 households in Flemington, 50 (56.8%) are family households, while 38 (43.2%) are nonfamily households. The most numerous type of family households are 2-person households, comprising 19, and the most common type of nonfamily households are 1-person households, comprising 21.
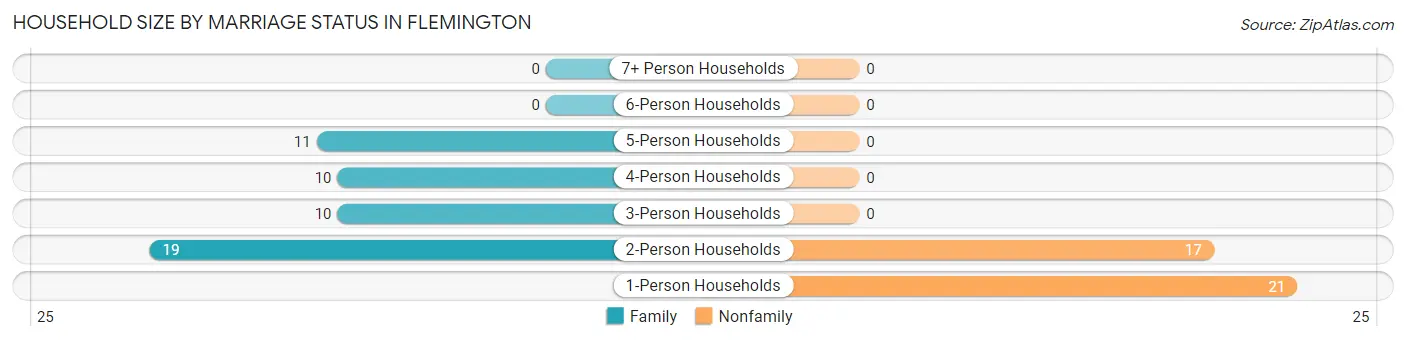
| Household Size | Family Households | Nonfamily Households |
| 1-Person Households | - | 21 (23.9%) |
| 2-Person Households | 19 (21.6%) | 17 (19.3%) |
| 3-Person Households | 10 (11.4%) | 0 (0.0%) |
| 4-Person Households | 10 (11.4%) | 0 (0.0%) |
| 5-Person Households | 11 (12.5%) | 0 (0.0%) |
| 6-Person Households | 0 (0.0%) | 0 (0.0%) |
| 7+ Person Households | 0 (0.0%) | 0 (0.0%) |
| Total | 50 (56.8%) | 38 (43.2%) |
Female Fertility in Flemington
Fertility by Age in Flemington
| Age Bracket | Women with Births | Births / 1,000 Women |
| 15 to 19 years | 0 (0.0%) | 0.0 |
| 20 to 34 years | 0 (0.0%) | 0.0 |
| 35 to 50 years | 0 (0.0%) | 0.0 |
| Total | 0 (0.0%) | 0.0 |
Fertility by Age by Marriage Status in Flemington
| Age Bracket | Married | Unmarried |
| 15 to 19 years | 0 (0.0%) | 0 (0.0%) |
| 20 to 34 years | 0 (0.0%) | 0 (0.0%) |
| 35 to 50 years | 0 (0.0%) | 0 (0.0%) |
| Total | 0 (0.0%) | 0 (0.0%) |
Fertility by Education in Flemington
| Educational Attainment | Women with Births | Births / 1,000 Women |
| Less than High School | 0 (0.0%) | 0.0 |
| High School Diploma | 0 (0.0%) | 0.0 |
| College or Associate's Degree | 0 (0.0%) | 0.0 |
| Bachelor's Degree | 0 (0.0%) | 0.0 |
| Graduate Degree | 0 (0.0%) | 0.0 |
| Total | 0 (0.0%) | 0.0 |
Fertility by Education by Marriage Status in Flemington
| Educational Attainment | Married | Unmarried |
| Less than High School | 0 (0.0%) | 0 (0.0%) |
| High School Diploma | 0 (0.0%) | 0 (0.0%) |
| College or Associate's Degree | 0 (0.0%) | 0 (0.0%) |
| Bachelor's Degree | 0 (0.0%) | 0 (0.0%) |
| Graduate Degree | 0 (0.0%) | 0 (0.0%) |
| Total | 0 (0.0%) | 0 (0.0%) |
Employment Characteristics in Flemington
Employment by Class of Employer in Flemington
Among the 91 employed individuals in Flemington, private company employees (75 | 82.4%), federal government employees (7 | 7.7%), and self-employed (not incorporated) (4 | 4.4%) make up the most common classes of employment.
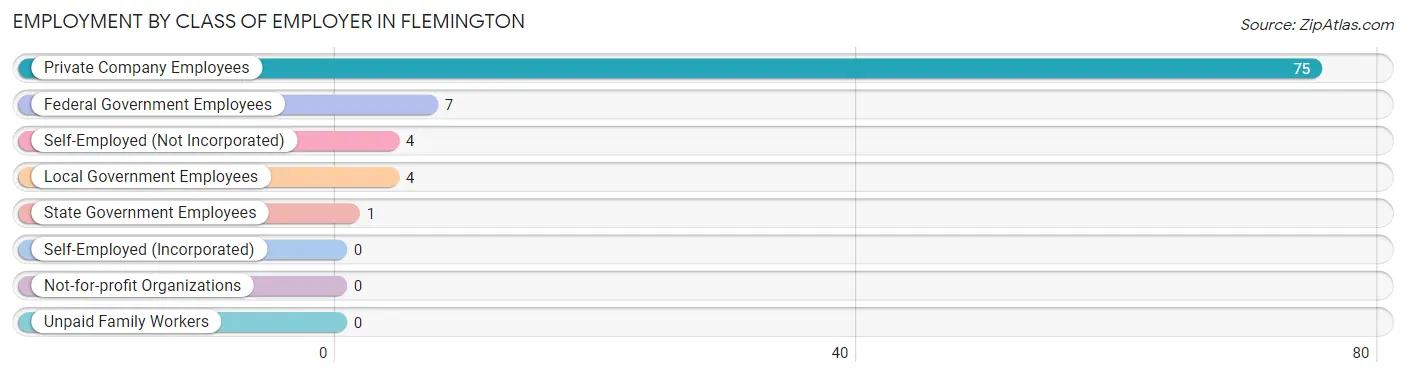
| Employer Class | # Employees | % Employees |
| Private Company Employees | 75 | 82.4% |
| Self-Employed (Incorporated) | 0 | 0.0% |
| Self-Employed (Not Incorporated) | 4 | 4.4% |
| Not-for-profit Organizations | 0 | 0.0% |
| Local Government Employees | 4 | 4.4% |
| State Government Employees | 1 | 1.1% |
| Federal Government Employees | 7 | 7.7% |
| Unpaid Family Workers | 0 | 0.0% |
| Total | 91 | 100.0% |
Employment Status by Age in Flemington
According to the labor force statistics for Flemington, out of the total population over 16 years of age (189), 62.4% or 118 individuals are in the labor force, with 21.2% or 25 of them unemployed. The age group with the highest labor force participation rate is 20 to 24 years, with 100.0% or 18 individuals in the labor force. Within the labor force, the 25 to 29 years age range has the highest percentage of unemployed individuals, with 83.3% or 15 of them being unemployed.
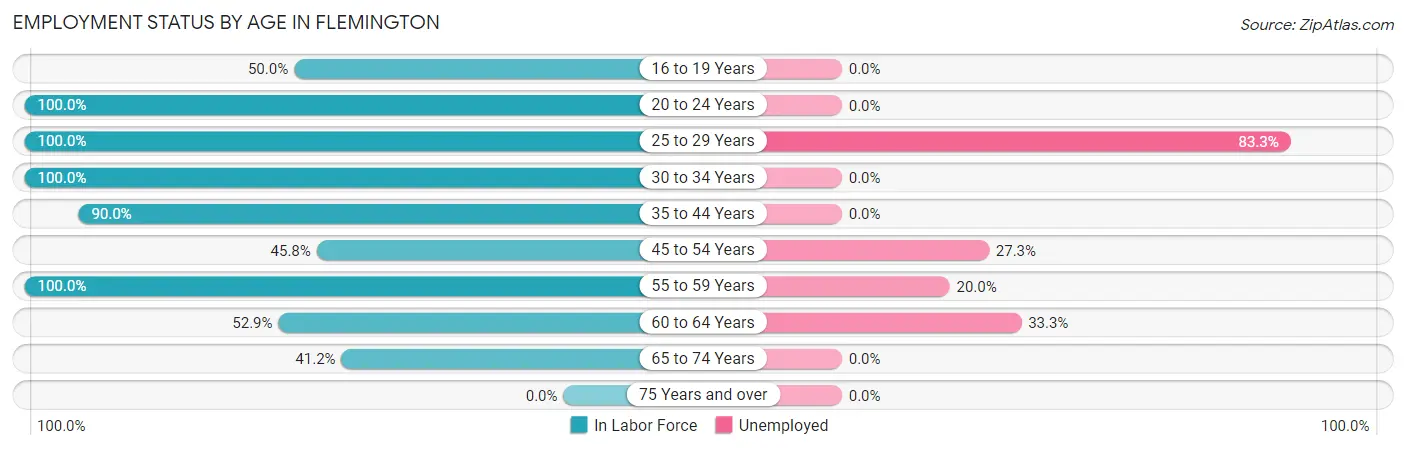
| Age Bracket | In Labor Force | Unemployed |
| 16 to 19 Years | 3 (50.0%) | 0 (0.0%) |
| 20 to 24 Years | 18 (100.0%) | 0 (0.0%) |
| 25 to 29 Years | 18 (100.0%) | 15 (83.3%) |
| 30 to 34 Years | 4 (100.0%) | 0 (0.0%) |
| 35 to 44 Years | 27 (90.0%) | 0 (0.0%) |
| 45 to 54 Years | 11 (45.8%) | 3 (27.3%) |
| 55 to 59 Years | 5 (100.0%) | 1 (20.0%) |
| 60 to 64 Years | 18 (52.9%) | 6 (33.3%) |
| 65 to 74 Years | 14 (41.2%) | 0 (0.0%) |
| 75 Years and over | 0 (0.0%) | 0 (0.0%) |
| Total | 118 (62.4%) | 25 (21.2%) |
Employment Status by Educational Attainment in Flemington
According to labor force statistics for Flemington, 72.2% of individuals (83) out of the total population between 25 and 64 years of age (115) are in the labor force, with 30.1% or 25 of them being unemployed. The group with the highest labor force participation rate are those with the educational attainment of college / associate degree, with 100.0% or 19 individuals in the labor force. Within the labor force, individuals with less than high school education have the highest percentage of unemployment, with 100.0% or 5 of them being unemployed.
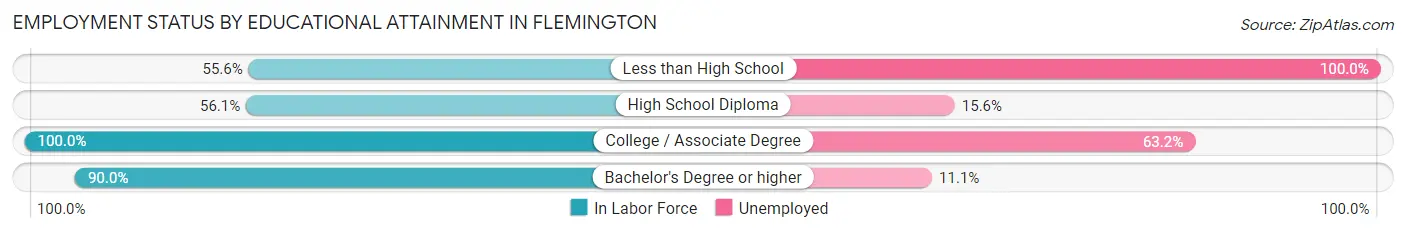
| Educational Attainment | In Labor Force | Unemployed |
| Less than High School | 5 (55.6%) | 9 (100.0%) |
| High School Diploma | 32 (56.1%) | 9 (15.6%) |
| College / Associate Degree | 19 (100.0%) | 12 (63.2%) |
| Bachelor's Degree or higher | 27 (90.0%) | 3 (11.1%) |
| Total | 83 (72.2%) | 35 (30.1%) |
Employment Occupations by Sex in Flemington
Management, Business, Science and Arts Occupations
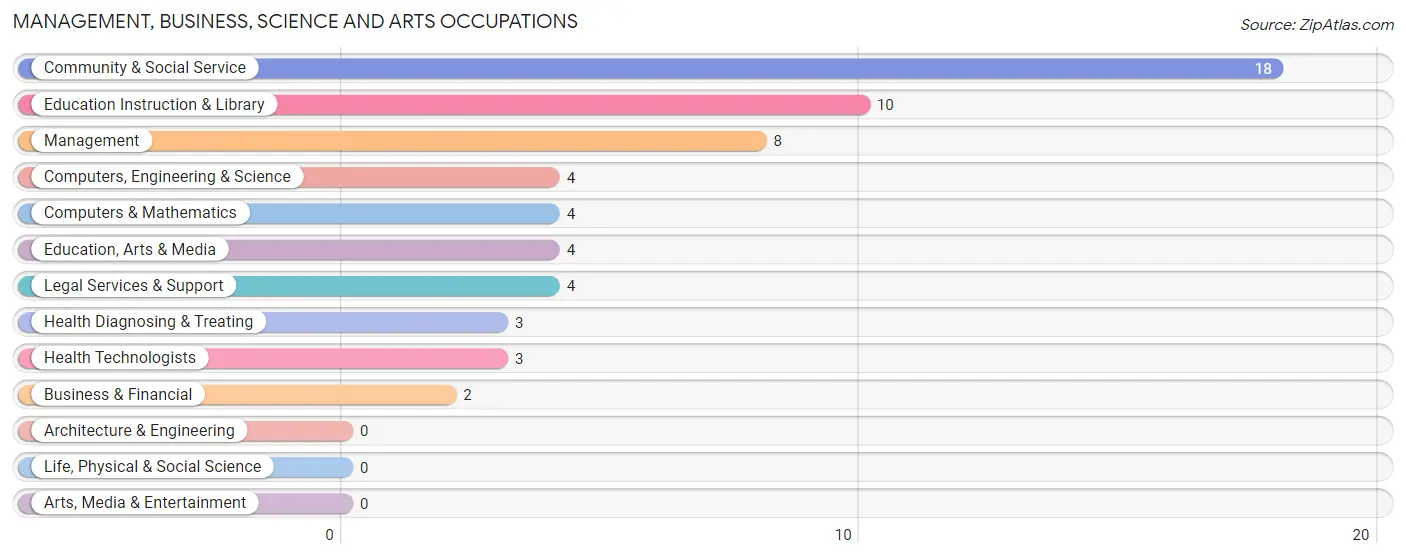
The most common Management, Business, Science and Arts occupations in Flemington are Community & Social Service (18 | 19.4%), Education Instruction & Library (10 | 10.7%), Management (8 | 8.6%), Computers, Engineering & Science (4 | 4.3%), and Computers & Mathematics (4 | 4.3%).
Management, Business, Science and Arts Occupations by Sex
Within the Management, Business, Science and Arts occupations in Flemington, the most male-oriented occupations are Management (100.0%), Business & Financial (100.0%), and Computers, Engineering & Science (100.0%), while the most female-oriented occupations are Education, Arts & Media (100.0%), Health Diagnosing & Treating (100.0%), and Health Technologists (100.0%).
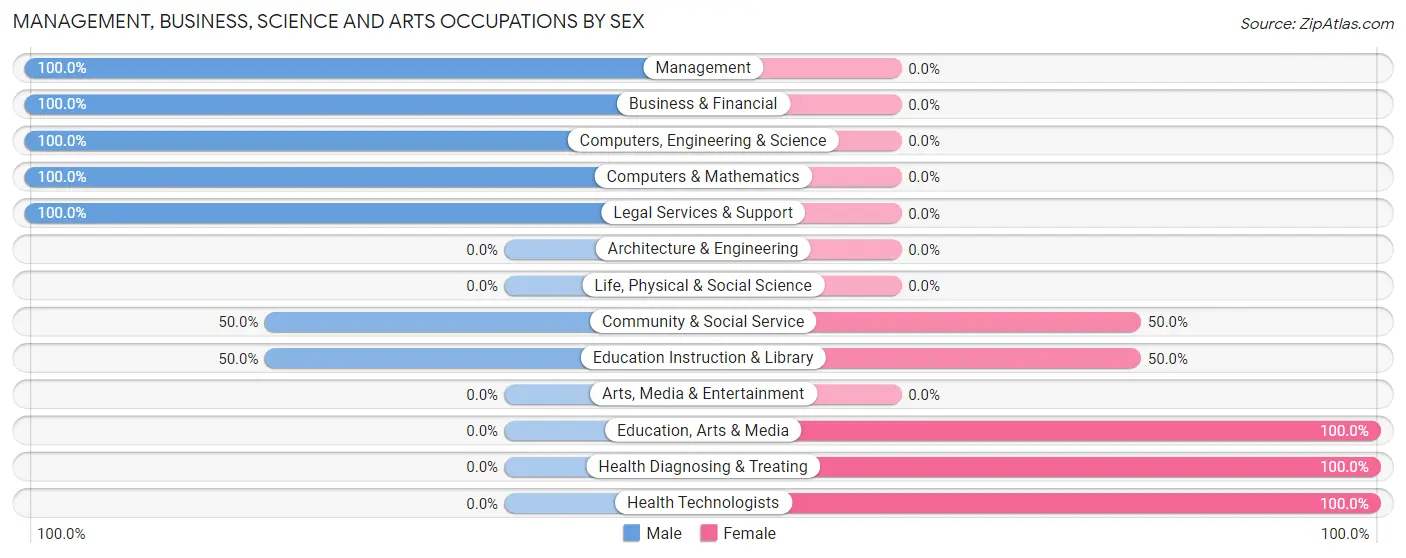
| Occupation | Male | Female |
| Management | 8 (100.0%) | 0 (0.0%) |
| Business & Financial | 2 (100.0%) | 0 (0.0%) |
| Computers, Engineering & Science | 4 (100.0%) | 0 (0.0%) |
| Computers & Mathematics | 4 (100.0%) | 0 (0.0%) |
| Architecture & Engineering | 0 (0.0%) | 0 (0.0%) |
| Life, Physical & Social Science | 0 (0.0%) | 0 (0.0%) |
| Community & Social Service | 9 (50.0%) | 9 (50.0%) |
| Education, Arts & Media | 0 (0.0%) | 4 (100.0%) |
| Legal Services & Support | 4 (100.0%) | 0 (0.0%) |
| Education Instruction & Library | 5 (50.0%) | 5 (50.0%) |
| Arts, Media & Entertainment | 0 (0.0%) | 0 (0.0%) |
| Health Diagnosing & Treating | 0 (0.0%) | 3 (100.0%) |
| Health Technologists | 0 (0.0%) | 3 (100.0%) |
| Total (Category) | 23 (65.7%) | 12 (34.3%) |
| Total (Overall) | 56 (60.2%) | 37 (39.8%) |
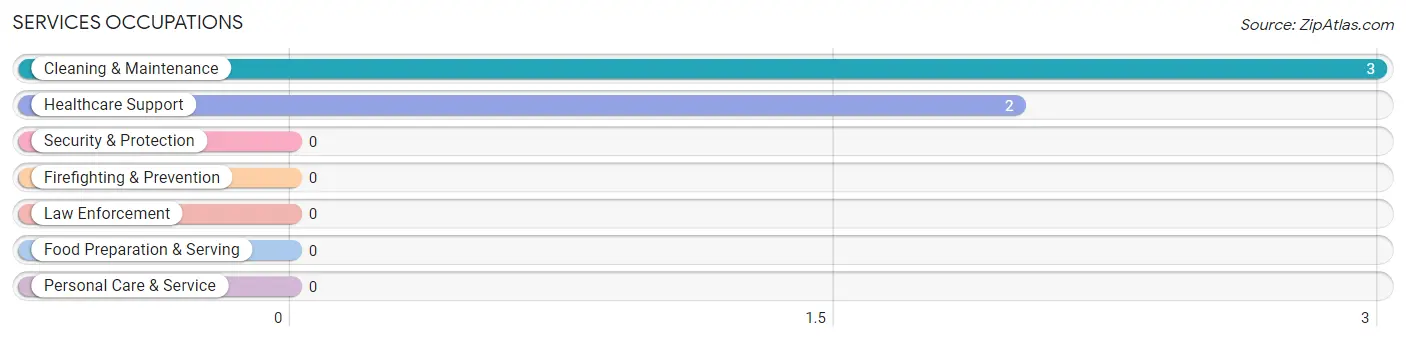
Services Occupations
The most common Services occupations in Flemington are Cleaning & Maintenance (3 | 3.2%), and Healthcare Support (2 | 2.1%).
Services Occupations by Sex
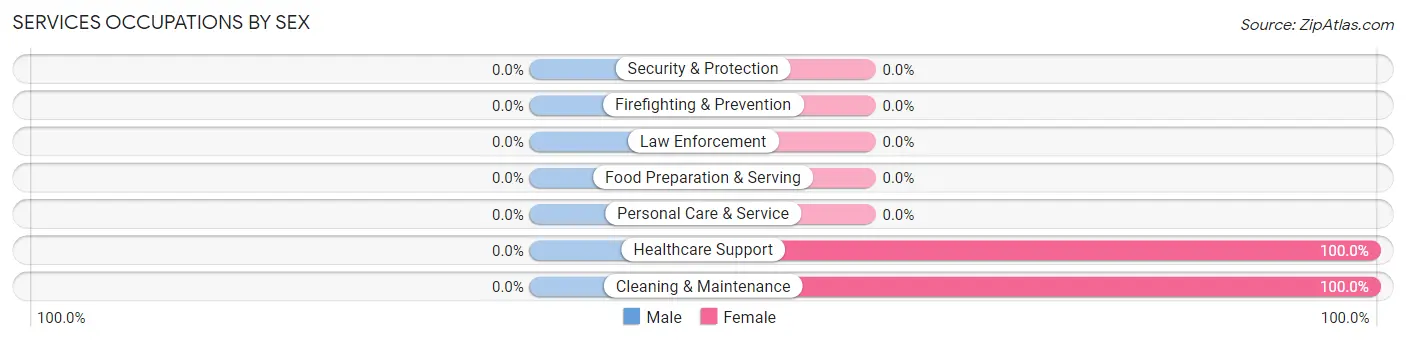
| Occupation | Male | Female |
| Healthcare Support | 0 (0.0%) | 2 (100.0%) |
| Security & Protection | 0 (0.0%) | 0 (0.0%) |
| Firefighting & Prevention | 0 (0.0%) | 0 (0.0%) |
| Law Enforcement | 0 (0.0%) | 0 (0.0%) |
| Food Preparation & Serving | 0 (0.0%) | 0 (0.0%) |
| Cleaning & Maintenance | 0 (0.0%) | 3 (100.0%) |
| Personal Care & Service | 0 (0.0%) | 0 (0.0%) |
| Total (Category) | 0 (0.0%) | 5 (100.0%) |
| Total (Overall) | 56 (60.2%) | 37 (39.8%) |
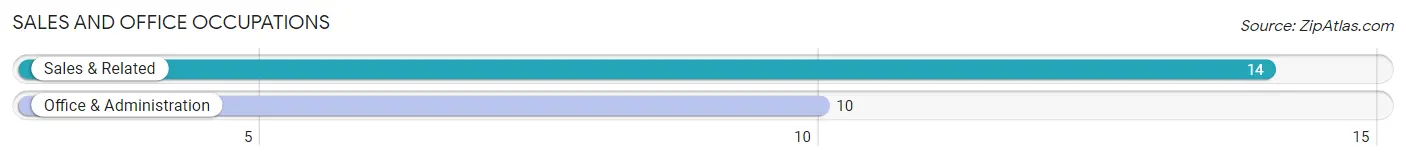
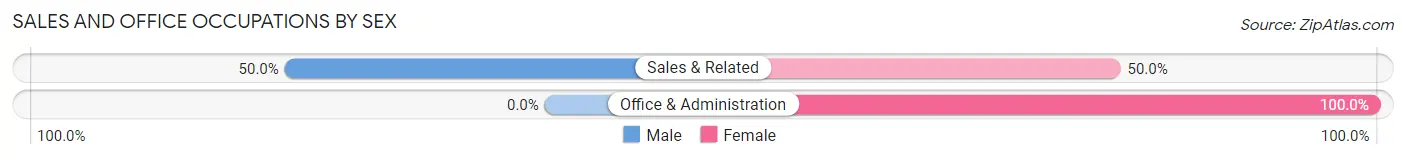
Sales and Office Occupations
The most common Sales and Office occupations in Flemington are Sales & Related (14 | 15.0%), and Office & Administration (10 | 10.7%).
Sales and Office Occupations by Sex
| Occupation | Male | Female |
| Sales & Related | 7 (50.0%) | 7 (50.0%) |
| Office & Administration | 0 (0.0%) | 10 (100.0%) |
| Total (Category) | 7 (29.2%) | 17 (70.8%) |
| Total (Overall) | 56 (60.2%) | 37 (39.8%) |
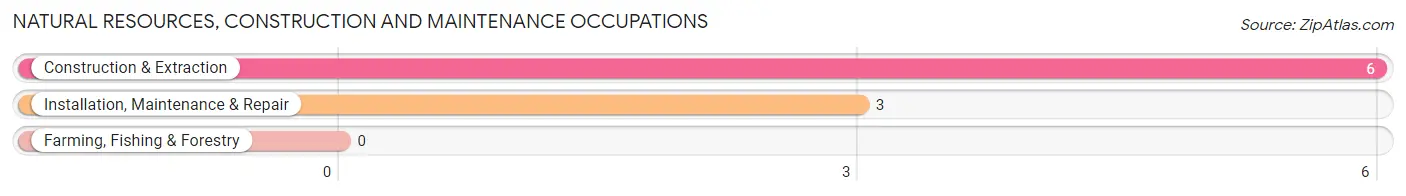
Natural Resources, Construction and Maintenance Occupations
The most common Natural Resources, Construction and Maintenance occupations in Flemington are Construction & Extraction (6 | 6.5%), and Installation, Maintenance & Repair (3 | 3.2%).
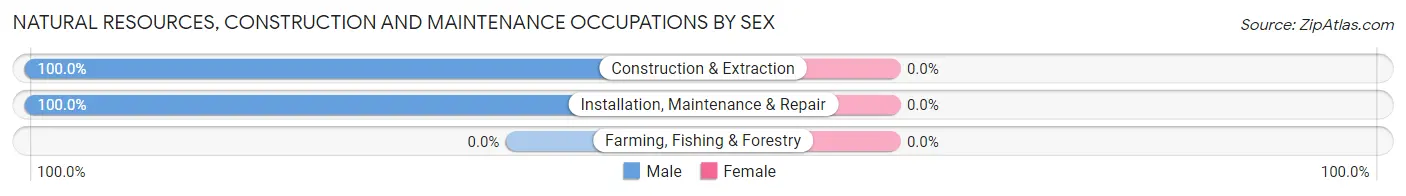
Natural Resources, Construction and Maintenance Occupations by Sex
| Occupation | Male | Female |
| Farming, Fishing & Forestry | 0 (0.0%) | 0 (0.0%) |
| Construction & Extraction | 6 (100.0%) | 0 (0.0%) |
| Installation, Maintenance & Repair | 3 (100.0%) | 0 (0.0%) |
| Total (Category) | 9 (100.0%) | 0 (0.0%) |
| Total (Overall) | 56 (60.2%) | 37 (39.8%) |
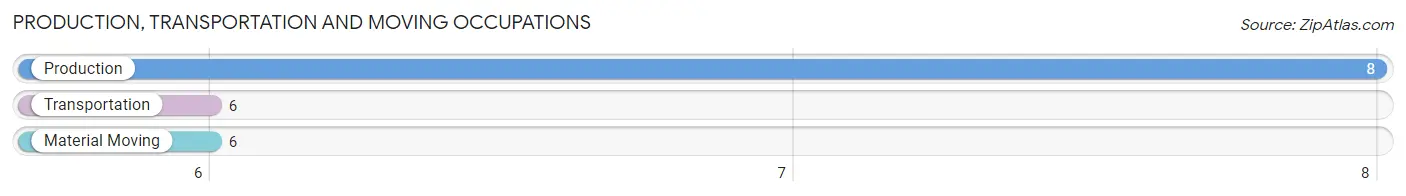
Production, Transportation and Moving Occupations
The most common Production, Transportation and Moving occupations in Flemington are Production (8 | 8.6%), Transportation (6 | 6.5%), and Material Moving (6 | 6.5%).
Production, Transportation and Moving Occupations by Sex
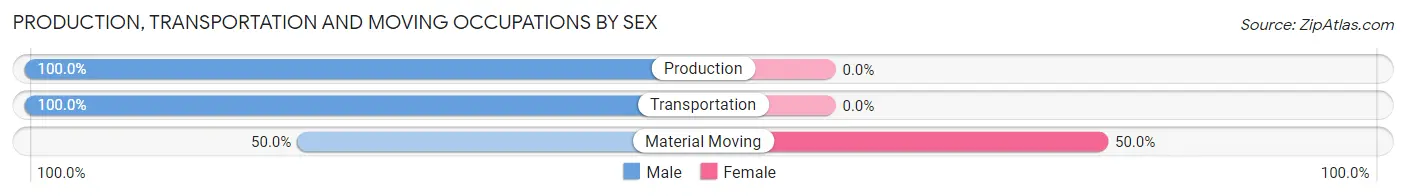
| Occupation | Male | Female |
| Production | 8 (100.0%) | 0 (0.0%) |
| Transportation | 6 (100.0%) | 0 (0.0%) |
| Material Moving | 3 (50.0%) | 3 (50.0%) |
| Total (Category) | 17 (85.0%) | 3 (15.0%) |
| Total (Overall) | 56 (60.2%) | 37 (39.8%) |
Employment Industries by Sex in Flemington
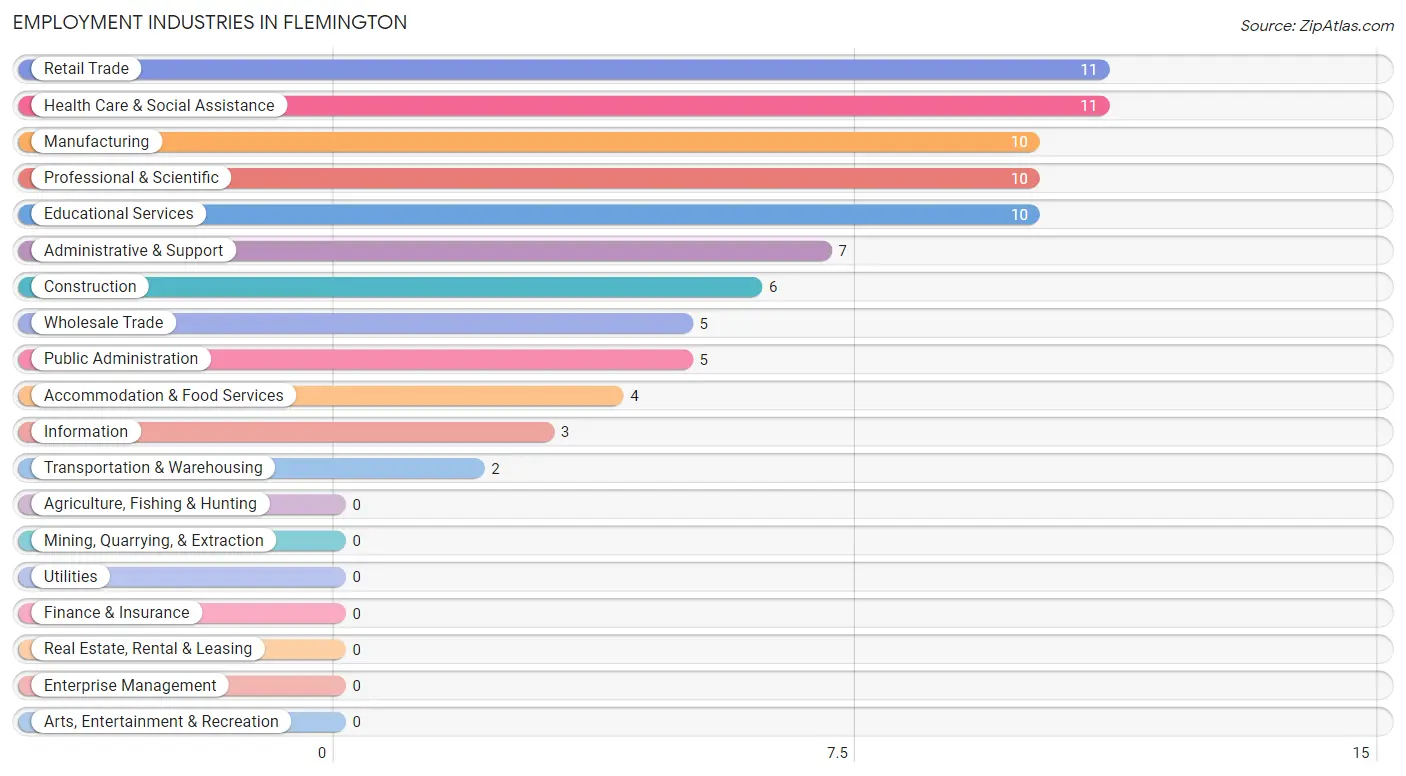
Employment Industries in Flemington
The major employment industries in Flemington include Retail Trade (11 | 11.8%), Health Care & Social Assistance (11 | 11.8%), Manufacturing (10 | 10.7%), Professional & Scientific (10 | 10.7%), and Educational Services (10 | 10.7%).
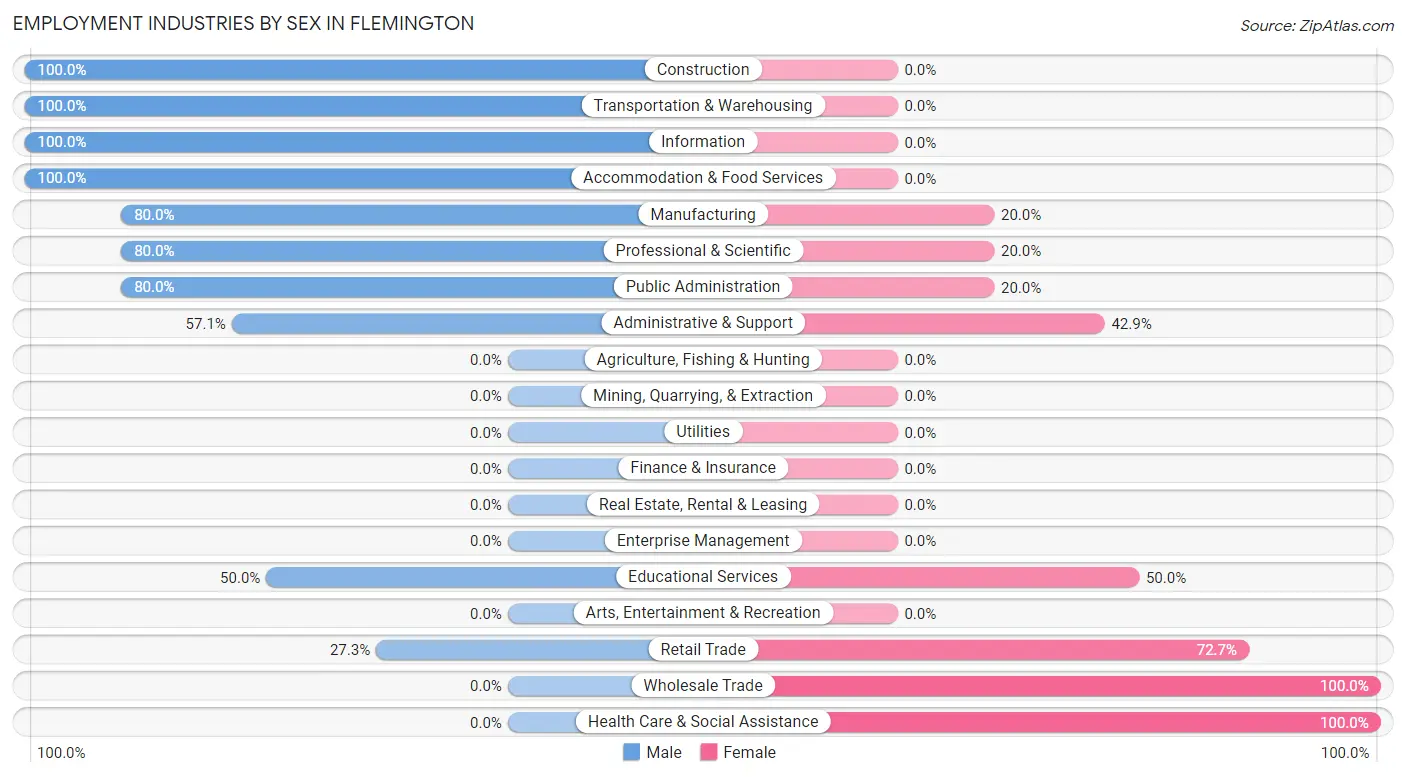
Employment Industries by Sex in Flemington
The Flemington industries that see more men than women are Construction (100.0%), Transportation & Warehousing (100.0%), and Information (100.0%), whereas the industries that tend to have a higher number of women are Wholesale Trade (100.0%), Health Care & Social Assistance (100.0%), and Retail Trade (72.7%).
| Industry | Male | Female |
| Agriculture, Fishing & Hunting | 0 (0.0%) | 0 (0.0%) |
| Mining, Quarrying, & Extraction | 0 (0.0%) | 0 (0.0%) |
| Construction | 6 (100.0%) | 0 (0.0%) |
| Manufacturing | 8 (80.0%) | 2 (20.0%) |
| Wholesale Trade | 0 (0.0%) | 5 (100.0%) |
| Retail Trade | 3 (27.3%) | 8 (72.7%) |
| Transportation & Warehousing | 2 (100.0%) | 0 (0.0%) |
| Utilities | 0 (0.0%) | 0 (0.0%) |
| Information | 3 (100.0%) | 0 (0.0%) |
| Finance & Insurance | 0 (0.0%) | 0 (0.0%) |
| Real Estate, Rental & Leasing | 0 (0.0%) | 0 (0.0%) |
| Professional & Scientific | 8 (80.0%) | 2 (20.0%) |
| Enterprise Management | 0 (0.0%) | 0 (0.0%) |
| Administrative & Support | 4 (57.1%) | 3 (42.9%) |
| Educational Services | 5 (50.0%) | 5 (50.0%) |
| Health Care & Social Assistance | 0 (0.0%) | 11 (100.0%) |
| Arts, Entertainment & Recreation | 0 (0.0%) | 0 (0.0%) |
| Accommodation & Food Services | 4 (100.0%) | 0 (0.0%) |
| Public Administration | 4 (80.0%) | 1 (20.0%) |
| Total | 56 (60.2%) | 37 (39.8%) |
Education in Flemington
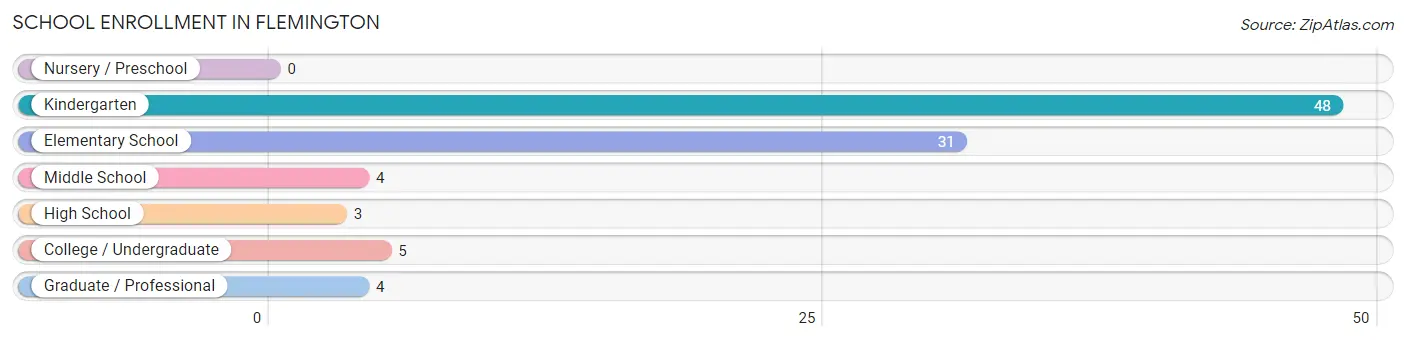
School Enrollment in Flemington
The most common levels of schooling among the 95 students in Flemington are kindergarten (48 | 50.5%), elementary school (31 | 32.6%), and college / undergraduate (5 | 5.3%).
| School Level | # Students | % Students |
| Nursery / Preschool | 0 | 0.0% |
| Kindergarten | 48 | 50.5% |
| Elementary School | 31 | 32.6% |
| Middle School | 4 | 4.2% |
| High School | 3 | 3.2% |
| College / Undergraduate | 5 | 5.3% |
| Graduate / Professional | 4 | 4.2% |
| Total | 95 | 100.0% |
School Enrollment by Age by Funding Source in Flemington
Out of a total of 95 students who are enrolled in schools in Flemington, 5 (5.3%) attend a private institution, while the remaining 90 (94.7%) are enrolled in public schools. The age group of 18 to 19 year olds has the highest likelihood of being enrolled in private schools, with 3 (100.0% in the age bracket) enrolled. Conversely, the age group of 5 to 9 year old has the lowest likelihood of being enrolled in a private school, with 79 (100.0% in the age bracket) attending a public institution.
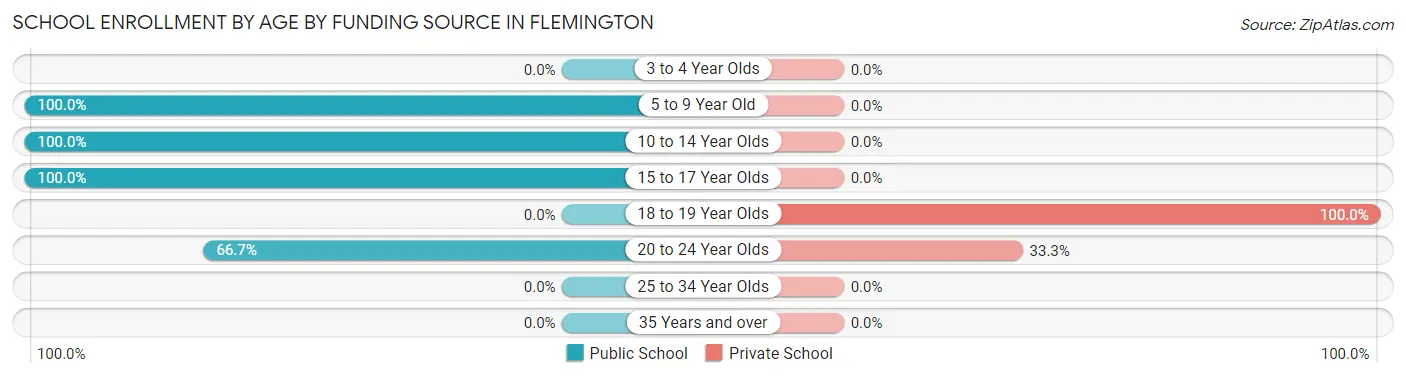
| Age Bracket | Public School | Private School |
| 3 to 4 Year Olds | 0 (0.0%) | 0 (0.0%) |
| 5 to 9 Year Old | 79 (100.0%) | 0 (0.0%) |
| 10 to 14 Year Olds | 4 (100.0%) | 0 (0.0%) |
| 15 to 17 Year Olds | 3 (100.0%) | 0 (0.0%) |
| 18 to 19 Year Olds | 0 (0.0%) | 3 (100.0%) |
| 20 to 24 Year Olds | 4 (66.7%) | 2 (33.3%) |
| 25 to 34 Year Olds | 0 (0.0%) | 0 (0.0%) |
| 35 Years and over | 0 (0.0%) | 0 (0.0%) |
| Total | 90 (94.7%) | 5 (5.3%) |
Educational Attainment by Field of Study in Flemington
Business (22 | 44.0%), education (6 | 12.0%), computers & mathematics (5 | 10.0%), bio, nature & agricultural (4 | 8.0%), and physical & health sciences (4 | 8.0%) are the most common fields of study among 50 individuals in Flemington who have obtained a bachelor's degree or higher.
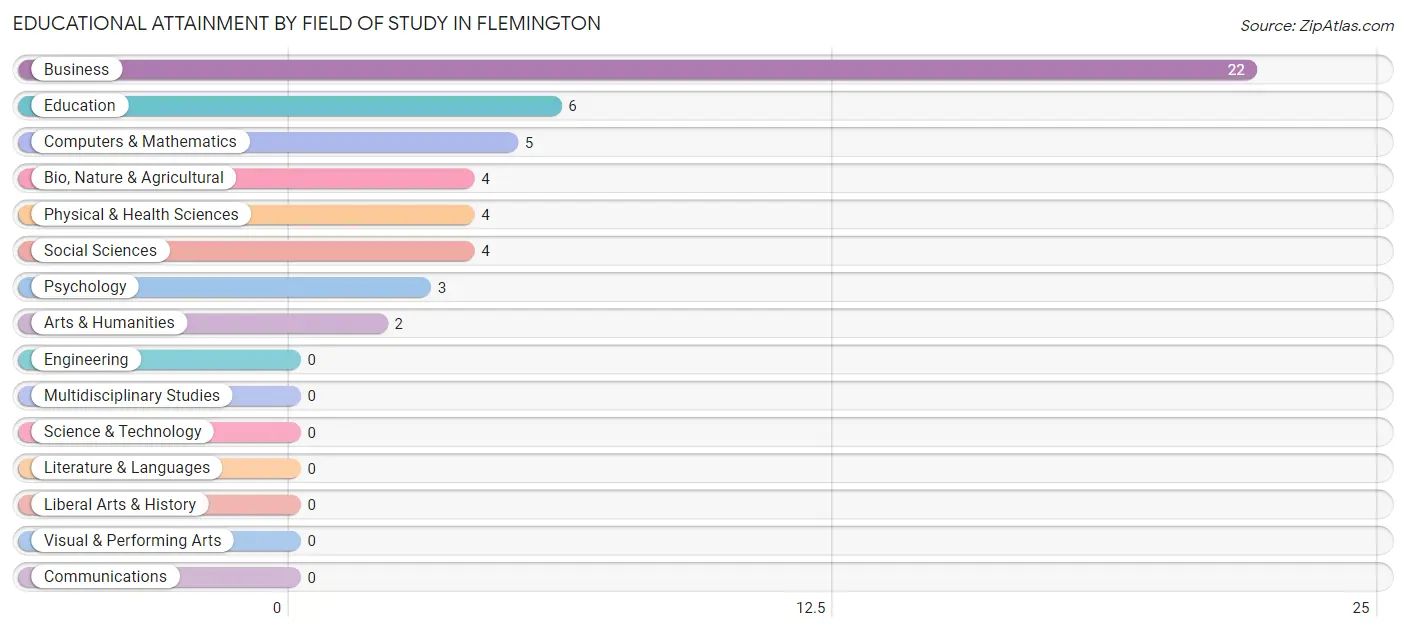
| Field of Study | # Graduates | % Graduates |
| Computers & Mathematics | 5 | 10.0% |
| Bio, Nature & Agricultural | 4 | 8.0% |
| Physical & Health Sciences | 4 | 8.0% |
| Psychology | 3 | 6.0% |
| Social Sciences | 4 | 8.0% |
| Engineering | 0 | 0.0% |
| Multidisciplinary Studies | 0 | 0.0% |
| Science & Technology | 0 | 0.0% |
| Business | 22 | 44.0% |
| Education | 6 | 12.0% |
| Literature & Languages | 0 | 0.0% |
| Liberal Arts & History | 0 | 0.0% |
| Visual & Performing Arts | 0 | 0.0% |
| Communications | 0 | 0.0% |
| Arts & Humanities | 2 | 4.0% |
| Total | 50 | 100.0% |
Transportation & Commute in Flemington
Vehicle Availability by Sex in Flemington
The most prevalent vehicle ownership categories in Flemington are males with 3 vehicles (21, accounting for 38.9%) and females with 3 vehicles (17, making up 56.8%).
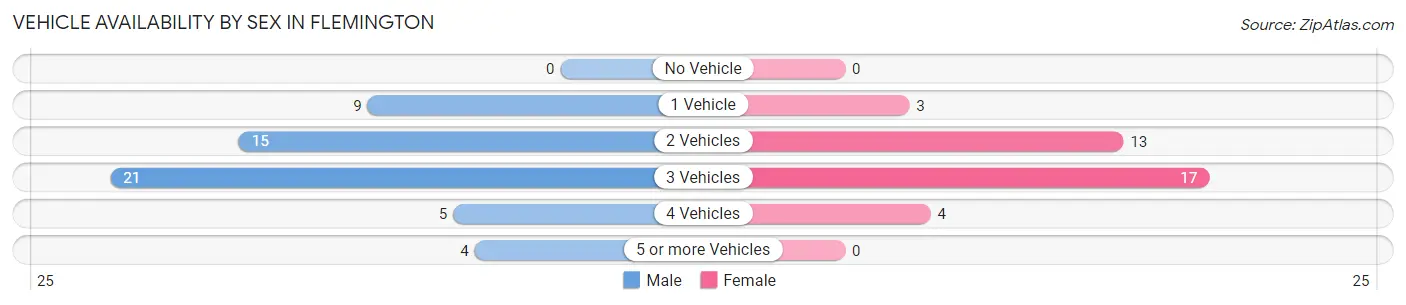
| Vehicles Available | Male | Female |
| No Vehicle | 0 (0.0%) | 0 (0.0%) |
| 1 Vehicle | 9 (16.7%) | 3 (8.1%) |
| 2 Vehicles | 15 (27.8%) | 13 (35.1%) |
| 3 Vehicles | 21 (38.9%) | 17 (46.0%) |
| 4 Vehicles | 5 (9.3%) | 4 (10.8%) |
| 5 or more Vehicles | 4 (7.4%) | 0 (0.0%) |
| Total | 54 (100.0%) | 37 (100.0%) |
Commute Time in Flemington
The most frequently occuring commute durations in Flemington are 15 to 19 minutes (23 commuters, 27.4%), 20 to 24 minutes (15 commuters, 17.9%), and 25 to 29 minutes (15 commuters, 17.9%).
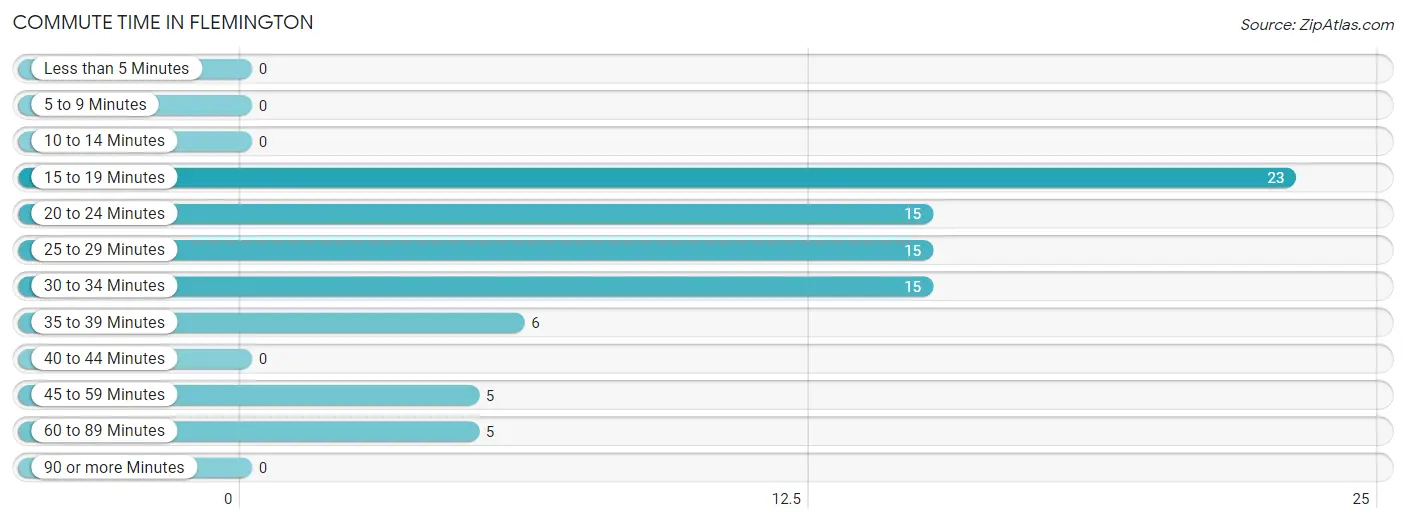
| Commute Time | # Commuters | % Commuters |
| Less than 5 Minutes | 0 | 0.0% |
| 5 to 9 Minutes | 0 | 0.0% |
| 10 to 14 Minutes | 0 | 0.0% |
| 15 to 19 Minutes | 23 | 27.4% |
| 20 to 24 Minutes | 15 | 17.9% |
| 25 to 29 Minutes | 15 | 17.9% |
| 30 to 34 Minutes | 15 | 17.9% |
| 35 to 39 Minutes | 6 | 7.1% |
| 40 to 44 Minutes | 0 | 0.0% |
| 45 to 59 Minutes | 5 | 5.9% |
| 60 to 89 Minutes | 5 | 5.9% |
| 90 or more Minutes | 0 | 0.0% |
Commute Time by Sex in Flemington
The most common commute times in Flemington are 15 to 19 minutes (18 commuters, 38.3%) for males and 20 to 24 minutes (10 commuters, 27.0%) for females.
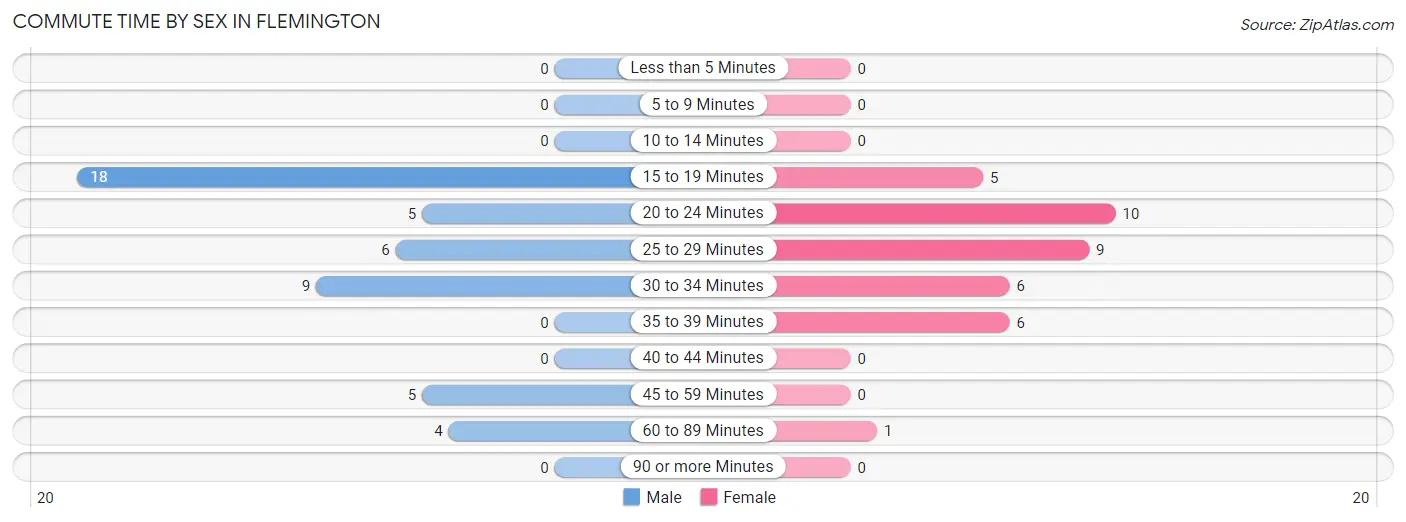
| Commute Time | Male | Female |
| Less than 5 Minutes | 0 (0.0%) | 0 (0.0%) |
| 5 to 9 Minutes | 0 (0.0%) | 0 (0.0%) |
| 10 to 14 Minutes | 0 (0.0%) | 0 (0.0%) |
| 15 to 19 Minutes | 18 (38.3%) | 5 (13.5%) |
| 20 to 24 Minutes | 5 (10.6%) | 10 (27.0%) |
| 25 to 29 Minutes | 6 (12.8%) | 9 (24.3%) |
| 30 to 34 Minutes | 9 (19.2%) | 6 (16.2%) |
| 35 to 39 Minutes | 0 (0.0%) | 6 (16.2%) |
| 40 to 44 Minutes | 0 (0.0%) | 0 (0.0%) |
| 45 to 59 Minutes | 5 (10.6%) | 0 (0.0%) |
| 60 to 89 Minutes | 4 (8.5%) | 1 (2.7%) |
| 90 or more Minutes | 0 (0.0%) | 0 (0.0%) |
Time of Departure to Work by Sex in Flemington
The most frequent times of departure to work in Flemington are 7:00 AM to 7:29 AM (19, 40.4%) for males and 6:30 AM to 6:59 AM (9, 24.3%) for females.
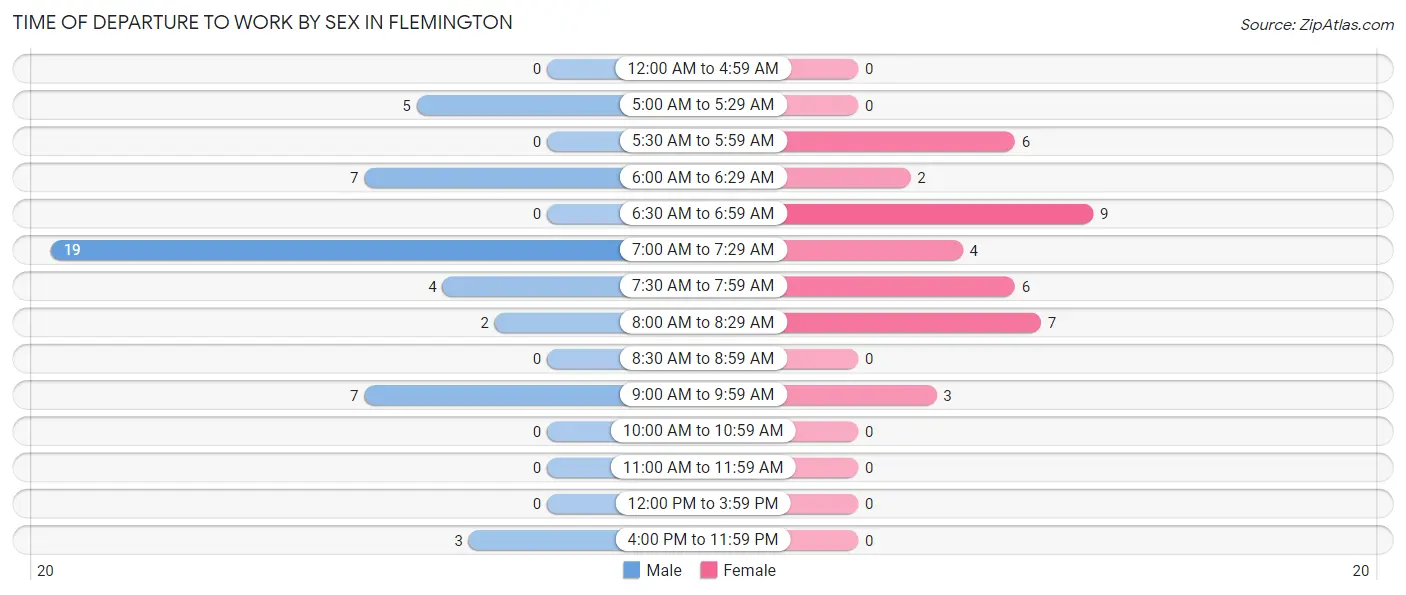
| Time of Departure | Male | Female |
| 12:00 AM to 4:59 AM | 0 (0.0%) | 0 (0.0%) |
| 5:00 AM to 5:29 AM | 5 (10.6%) | 0 (0.0%) |
| 5:30 AM to 5:59 AM | 0 (0.0%) | 6 (16.2%) |
| 6:00 AM to 6:29 AM | 7 (14.9%) | 2 (5.4%) |
| 6:30 AM to 6:59 AM | 0 (0.0%) | 9 (24.3%) |
| 7:00 AM to 7:29 AM | 19 (40.4%) | 4 (10.8%) |
| 7:30 AM to 7:59 AM | 4 (8.5%) | 6 (16.2%) |
| 8:00 AM to 8:29 AM | 2 (4.3%) | 7 (18.9%) |
| 8:30 AM to 8:59 AM | 0 (0.0%) | 0 (0.0%) |
| 9:00 AM to 9:59 AM | 7 (14.9%) | 3 (8.1%) |
| 10:00 AM to 10:59 AM | 0 (0.0%) | 0 (0.0%) |
| 11:00 AM to 11:59 AM | 0 (0.0%) | 0 (0.0%) |
| 12:00 PM to 3:59 PM | 0 (0.0%) | 0 (0.0%) |
| 4:00 PM to 11:59 PM | 3 (6.4%) | 0 (0.0%) |
| Total | 47 (100.0%) | 37 (100.0%) |
Housing Occupancy in Flemington
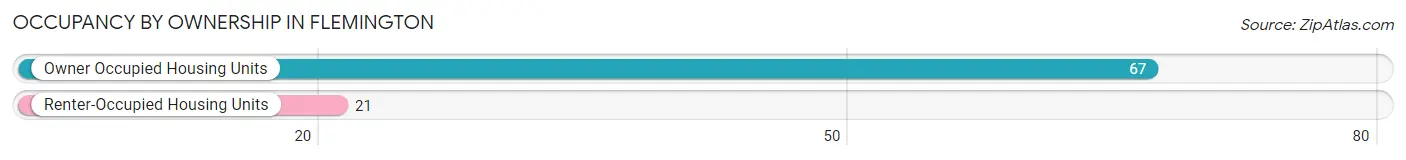
Occupancy by Ownership in Flemington
Of the total 88 dwellings in Flemington, owner-occupied units account for 67 (76.1%), while renter-occupied units make up 21 (23.9%).
| Occupancy | # Housing Units | % Housing Units |
| Owner Occupied Housing Units | 67 | 76.1% |
| Renter-Occupied Housing Units | 21 | 23.9% |
| Total Occupied Housing Units | 88 | 100.0% |
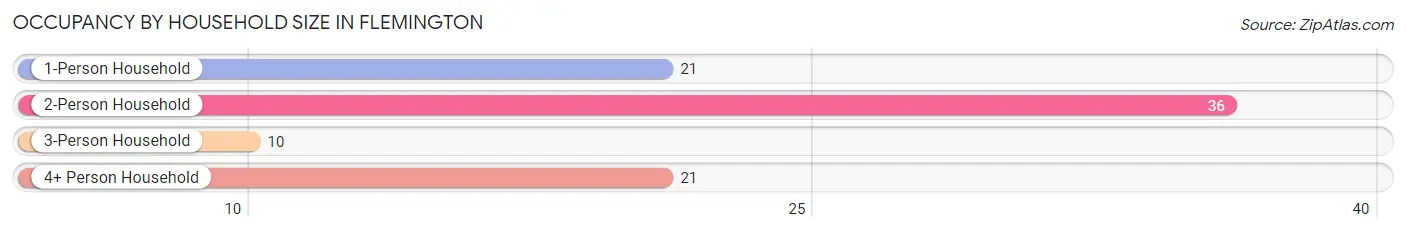
Occupancy by Household Size in Flemington
| Household Size | # Housing Units | % Housing Units |
| 1-Person Household | 21 | 23.9% |
| 2-Person Household | 36 | 40.9% |
| 3-Person Household | 10 | 11.4% |
| 4+ Person Household | 21 | 23.9% |
| Total Housing Units | 88 | 100.0% |
Occupancy by Ownership by Household Size in Flemington
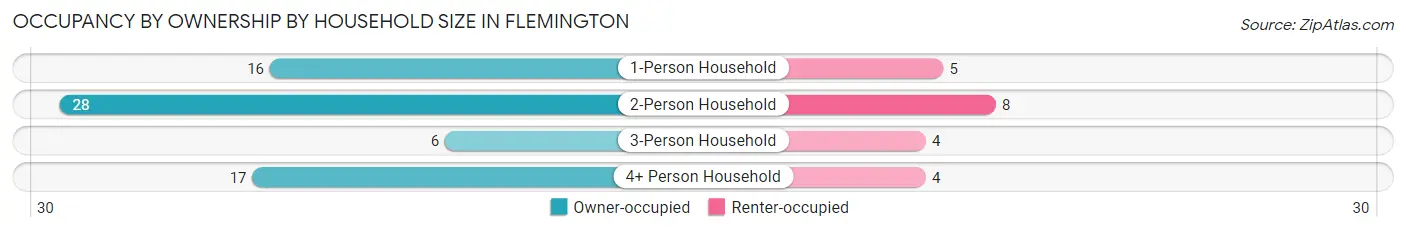
| Household Size | Owner-occupied | Renter-occupied |
| 1-Person Household | 16 (76.2%) | 5 (23.8%) |
| 2-Person Household | 28 (77.8%) | 8 (22.2%) |
| 3-Person Household | 6 (60.0%) | 4 (40.0%) |
| 4+ Person Household | 17 (80.9%) | 4 (19.1%) |
| Total Housing Units | 67 (76.1%) | 21 (23.9%) |
Occupancy by Educational Attainment in Flemington
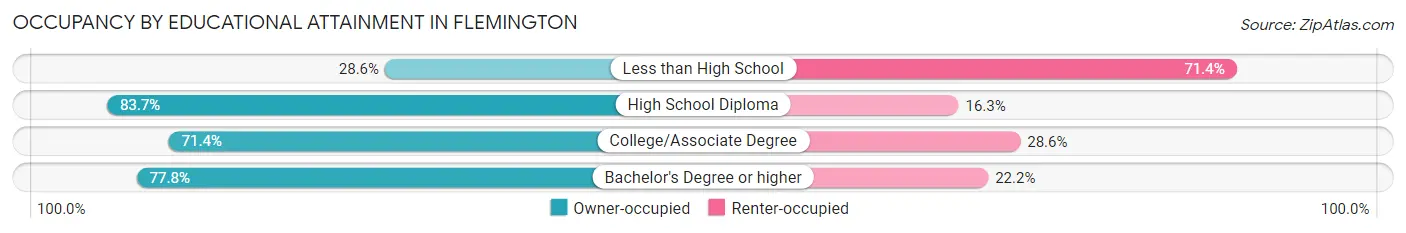
| Household Size | Owner-occupied | Renter-occupied |
| Less than High School | 2 (28.6%) | 5 (71.4%) |
| High School Diploma | 41 (83.7%) | 8 (16.3%) |
| College/Associate Degree | 10 (71.4%) | 4 (28.6%) |
| Bachelor's Degree or higher | 14 (77.8%) | 4 (22.2%) |
Occupancy by Age of Householder in Flemington
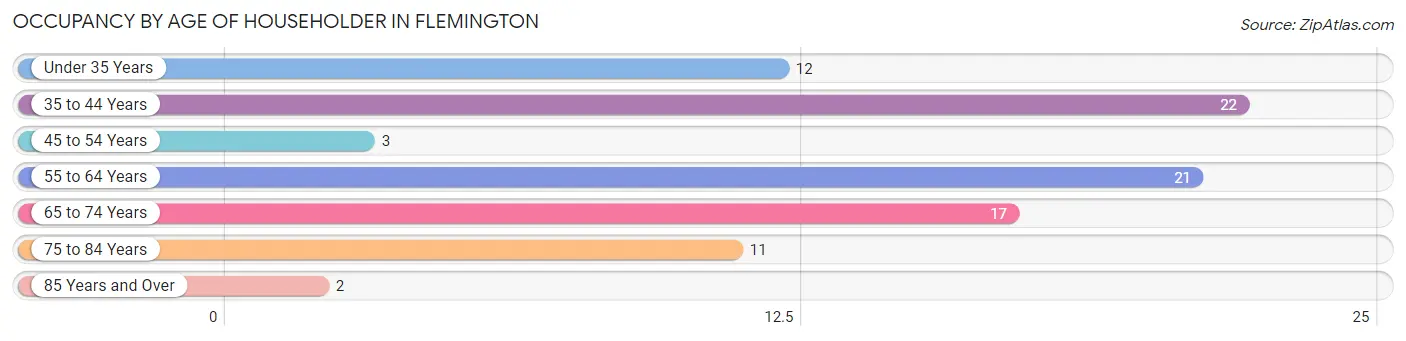
| Age Bracket | # Households | % Households |
| Under 35 Years | 12 | 13.6% |
| 35 to 44 Years | 22 | 25.0% |
| 45 to 54 Years | 3 | 3.4% |
| 55 to 64 Years | 21 | 23.9% |
| 65 to 74 Years | 17 | 19.3% |
| 75 to 84 Years | 11 | 12.5% |
| 85 Years and Over | 2 | 2.3% |
| Total | 88 | 100.0% |
Housing Finances in Flemington
Median Income by Occupancy in Flemington
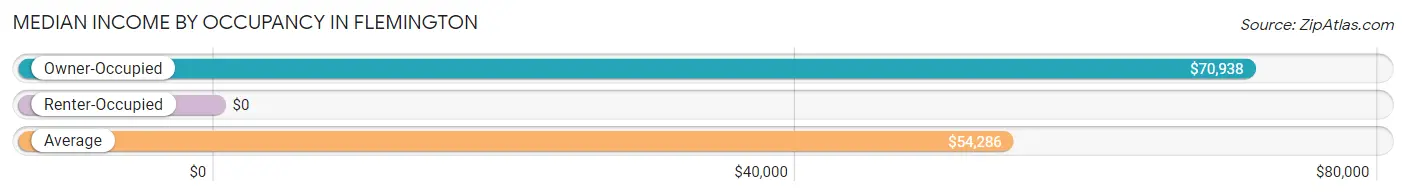
| Occupancy Type | # Households | Median Income |
| Owner-Occupied | 67 (76.1%) | $70,938 |
| Renter-Occupied | 21 (23.9%) | $0 |
| Average | 88 (100.0%) | $54,286 |
Occupancy by Householder Income Bracket in Flemington
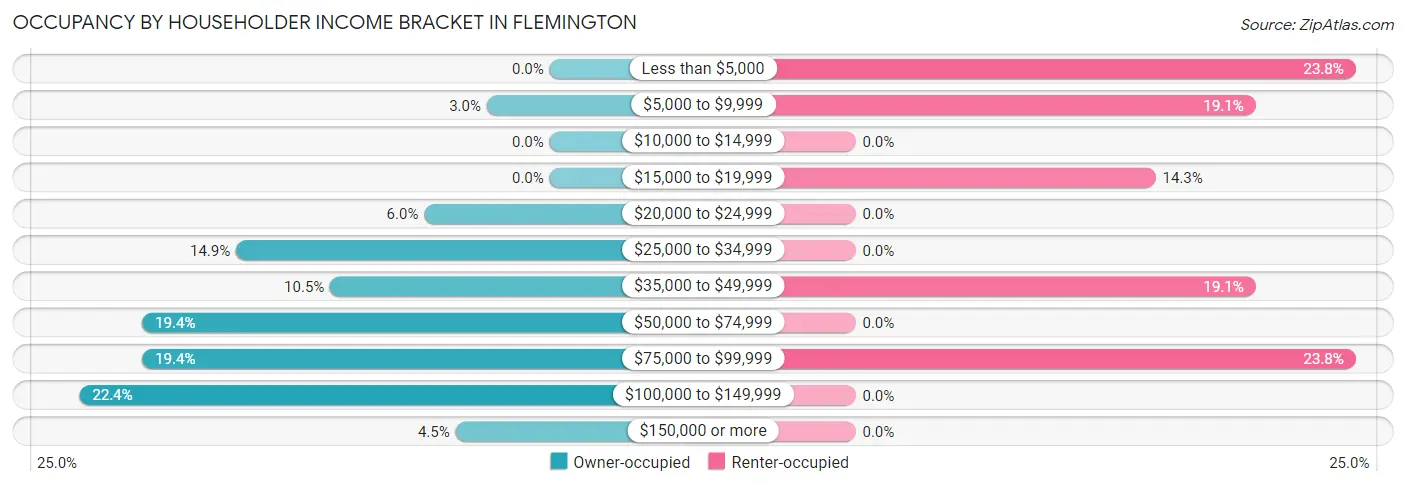
| Income Bracket | Owner-occupied | Renter-occupied |
| Less than $5,000 | 0 (0.0%) | 5 (23.8%) |
| $5,000 to $9,999 | 2 (3.0%) | 4 (19.1%) |
| $10,000 to $14,999 | 0 (0.0%) | 0 (0.0%) |
| $15,000 to $19,999 | 0 (0.0%) | 3 (14.3%) |
| $20,000 to $24,999 | 4 (6.0%) | 0 (0.0%) |
| $25,000 to $34,999 | 10 (14.9%) | 0 (0.0%) |
| $35,000 to $49,999 | 7 (10.4%) | 4 (19.1%) |
| $50,000 to $74,999 | 13 (19.4%) | 0 (0.0%) |
| $75,000 to $99,999 | 13 (19.4%) | 5 (23.8%) |
| $100,000 to $149,999 | 15 (22.4%) | 0 (0.0%) |
| $150,000 or more | 3 (4.5%) | 0 (0.0%) |
| Total | 67 (100.0%) | 21 (100.0%) |
Monthly Housing Cost Tiers in Flemington
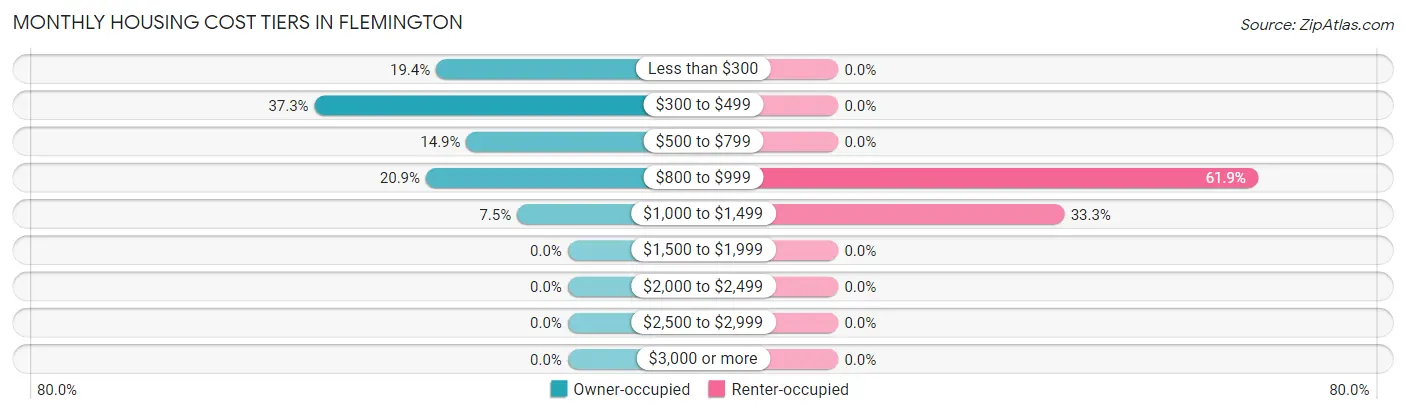
| Monthly Cost | Owner-occupied | Renter-occupied |
| Less than $300 | 13 (19.4%) | 0 (0.0%) |
| $300 to $499 | 25 (37.3%) | 0 (0.0%) |
| $500 to $799 | 10 (14.9%) | 0 (0.0%) |
| $800 to $999 | 14 (20.9%) | 13 (61.9%) |
| $1,000 to $1,499 | 5 (7.5%) | 7 (33.3%) |
| $1,500 to $1,999 | 0 (0.0%) | 0 (0.0%) |
| $2,000 to $2,499 | 0 (0.0%) | 0 (0.0%) |
| $2,500 to $2,999 | 0 (0.0%) | 0 (0.0%) |
| $3,000 or more | 0 (0.0%) | 0 (0.0%) |
| Total | 67 (100.0%) | 21 (100.0%) |
Physical Housing Characteristics in Flemington
Housing Structures in Flemington
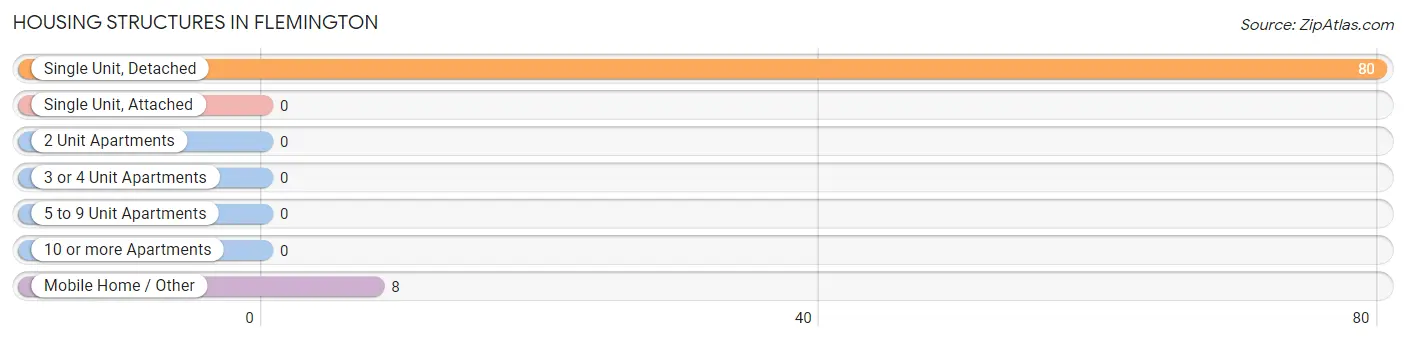
| Structure Type | # Housing Units | % Housing Units |
| Single Unit, Detached | 80 | 90.9% |
| Single Unit, Attached | 0 | 0.0% |
| 2 Unit Apartments | 0 | 0.0% |
| 3 or 4 Unit Apartments | 0 | 0.0% |
| 5 to 9 Unit Apartments | 0 | 0.0% |
| 10 or more Apartments | 0 | 0.0% |
| Mobile Home / Other | 8 | 9.1% |
| Total | 88 | 100.0% |
Housing Structures by Occupancy in Flemington
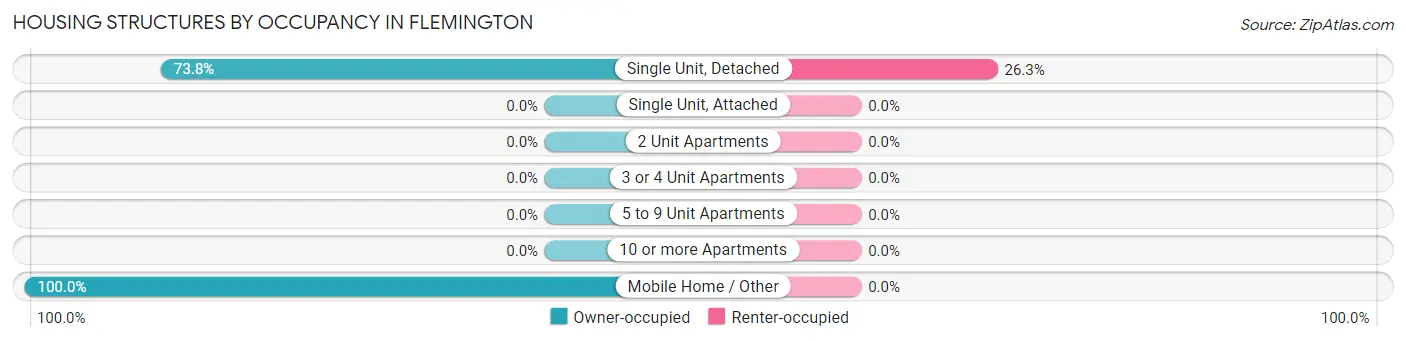
| Structure Type | Owner-occupied | Renter-occupied |
| Single Unit, Detached | 59 (73.8%) | 21 (26.3%) |
| Single Unit, Attached | 0 (0.0%) | 0 (0.0%) |
| 2 Unit Apartments | 0 (0.0%) | 0 (0.0%) |
| 3 or 4 Unit Apartments | 0 (0.0%) | 0 (0.0%) |
| 5 to 9 Unit Apartments | 0 (0.0%) | 0 (0.0%) |
| 10 or more Apartments | 0 (0.0%) | 0 (0.0%) |
| Mobile Home / Other | 8 (100.0%) | 0 (0.0%) |
| Total | 67 (76.1%) | 21 (23.9%) |
Housing Structures by Number of Rooms in Flemington
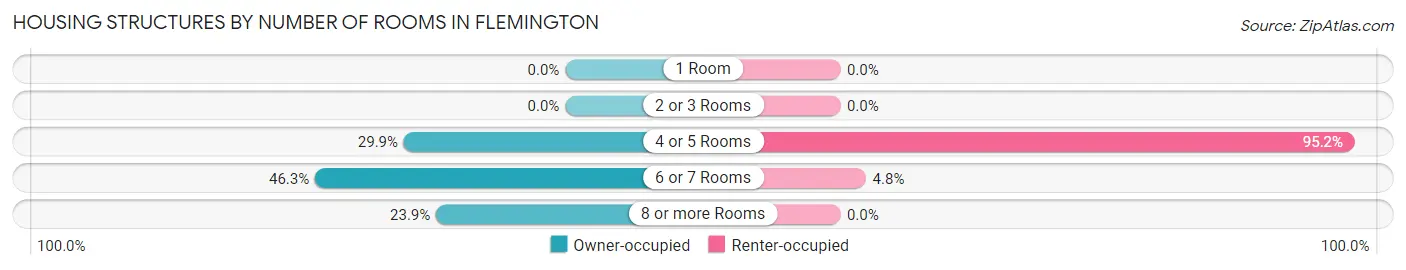
| Number of Rooms | Owner-occupied | Renter-occupied |
| 1 Room | 0 (0.0%) | 0 (0.0%) |
| 2 or 3 Rooms | 0 (0.0%) | 0 (0.0%) |
| 4 or 5 Rooms | 20 (29.8%) | 20 (95.2%) |
| 6 or 7 Rooms | 31 (46.3%) | 1 (4.8%) |
| 8 or more Rooms | 16 (23.9%) | 0 (0.0%) |
| Total | 67 (100.0%) | 21 (100.0%) |
Housing Structure by Heating Type in Flemington
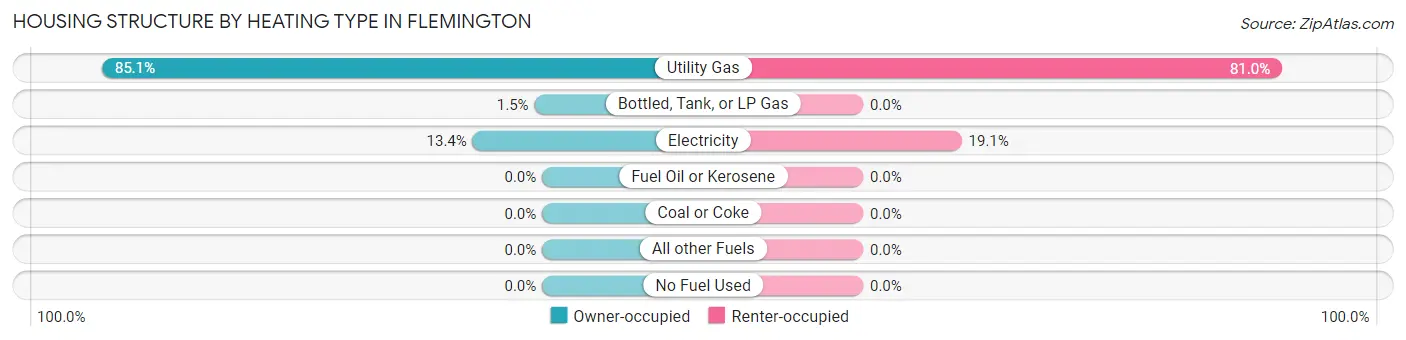
| Heating Type | Owner-occupied | Renter-occupied |
| Utility Gas | 57 (85.1%) | 17 (80.9%) |
| Bottled, Tank, or LP Gas | 1 (1.5%) | 0 (0.0%) |
| Electricity | 9 (13.4%) | 4 (19.1%) |
| Fuel Oil or Kerosene | 0 (0.0%) | 0 (0.0%) |
| Coal or Coke | 0 (0.0%) | 0 (0.0%) |
| All other Fuels | 0 (0.0%) | 0 (0.0%) |
| No Fuel Used | 0 (0.0%) | 0 (0.0%) |
| Total | 67 (100.0%) | 21 (100.0%) |
Household Vehicle Usage in Flemington
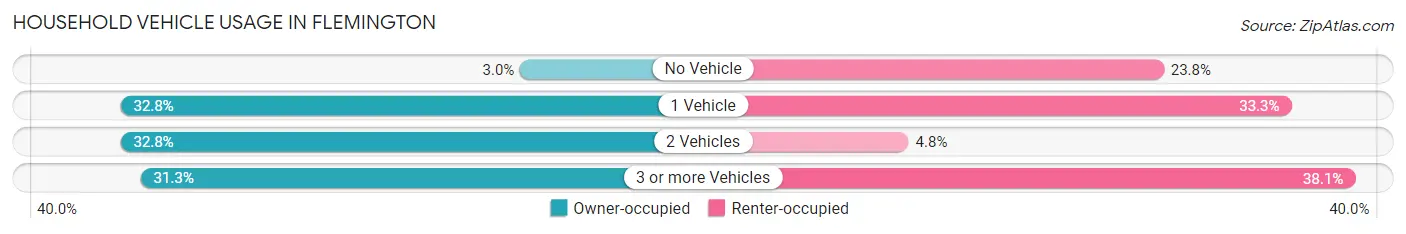
| Vehicles per Household | Owner-occupied | Renter-occupied |
| No Vehicle | 2 (3.0%) | 5 (23.8%) |
| 1 Vehicle | 22 (32.8%) | 7 (33.3%) |
| 2 Vehicles | 22 (32.8%) | 1 (4.8%) |
| 3 or more Vehicles | 21 (31.3%) | 8 (38.1%) |
| Total | 67 (100.0%) | 21 (100.0%) |
Real Estate & Mortgages in Flemington
Real Estate and Mortgage Overview in Flemington
| Characteristic | Without Mortgage | With Mortgage |
| Housing Units | 44 | 23 |
| Median Property Value | $74,000 | $137,500 |
| Median Household Income | $53,929 | $0 |
| Monthly Housing Costs | $338 | $0 |
| Real Estate Taxes | $325 | $0 |
Property Value by Mortgage Status in Flemington
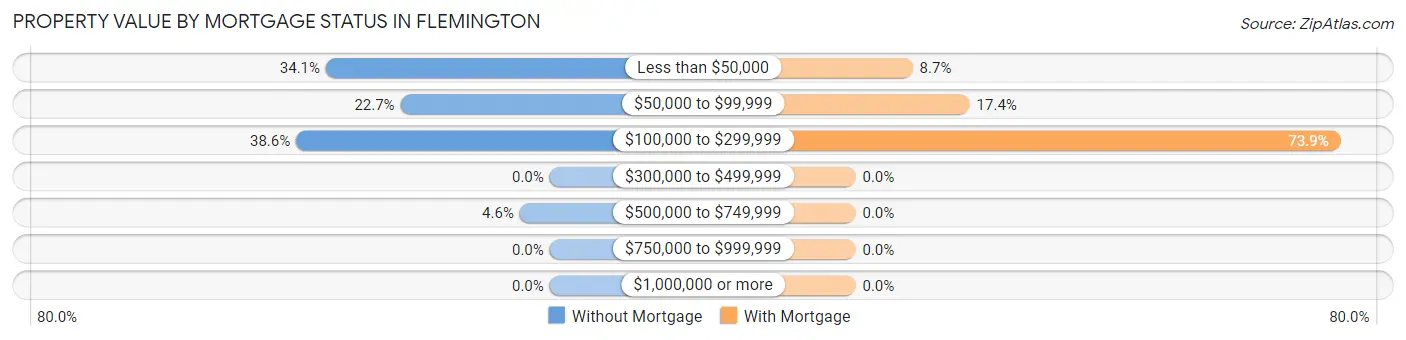
| Property Value | Without Mortgage | With Mortgage |
| Less than $50,000 | 15 (34.1%) | 2 (8.7%) |
| $50,000 to $99,999 | 10 (22.7%) | 4 (17.4%) |
| $100,000 to $299,999 | 17 (38.6%) | 17 (73.9%) |
| $300,000 to $499,999 | 0 (0.0%) | 0 (0.0%) |
| $500,000 to $749,999 | 2 (4.5%) | 0 (0.0%) |
| $750,000 to $999,999 | 0 (0.0%) | 0 (0.0%) |
| $1,000,000 or more | 0 (0.0%) | 0 (0.0%) |
| Total | 44 (100.0%) | 23 (100.0%) |
Household Income by Mortgage Status in Flemington
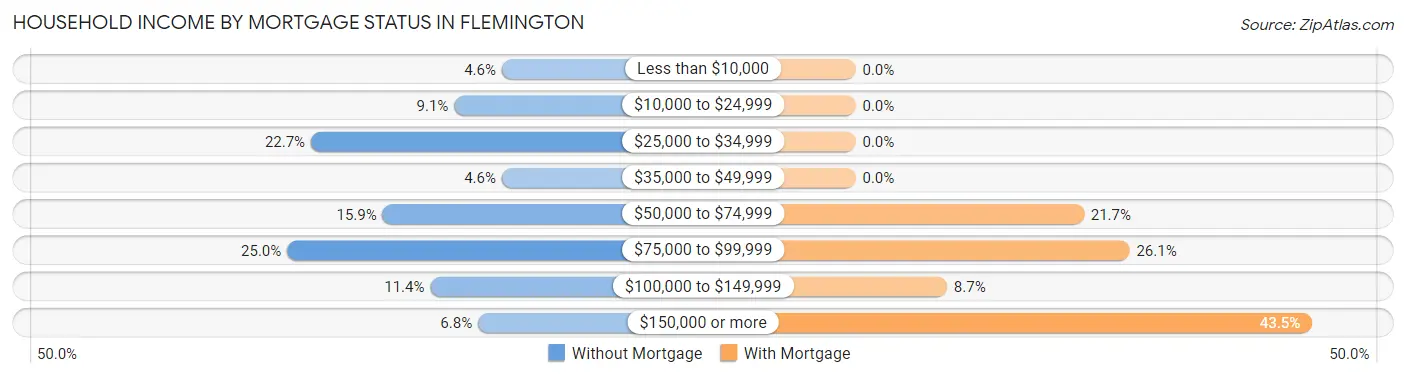
| Household Income | Without Mortgage | With Mortgage |
| Less than $10,000 | 2 (4.5%) | 0 (0.0%) |
| $10,000 to $24,999 | 4 (9.1%) | 0 (0.0%) |
| $25,000 to $34,999 | 10 (22.7%) | 0 (0.0%) |
| $35,000 to $49,999 | 2 (4.5%) | 0 (0.0%) |
| $50,000 to $74,999 | 7 (15.9%) | 5 (21.7%) |
| $75,000 to $99,999 | 11 (25.0%) | 6 (26.1%) |
| $100,000 to $149,999 | 5 (11.4%) | 2 (8.7%) |
| $150,000 or more | 3 (6.8%) | 10 (43.5%) |
| Total | 44 (100.0%) | 23 (100.0%) |
Property Value to Household Income Ratio in Flemington
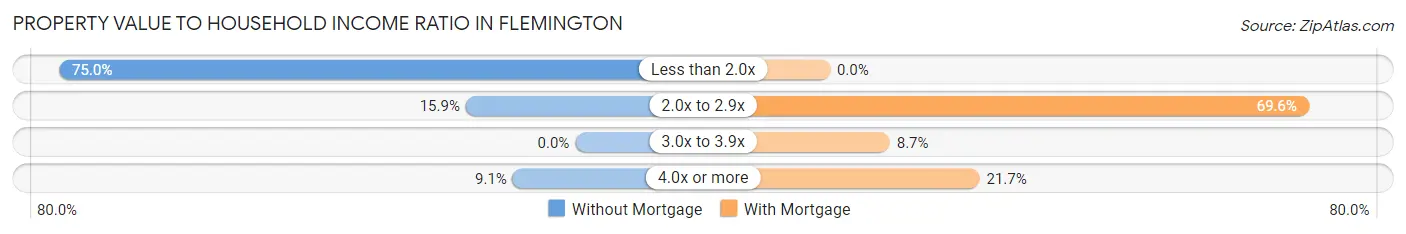
| Value-to-Income Ratio | Without Mortgage | With Mortgage |
| Less than 2.0x | 33 (75.0%) | 0 (0.0%) |
| 2.0x to 2.9x | 7 (15.9%) | 16 (69.6%) |
| 3.0x to 3.9x | 0 (0.0%) | 2 (8.7%) |
| 4.0x or more | 4 (9.1%) | 5 (21.7%) |
| Total | 44 (100.0%) | 23 (100.0%) |
Real Estate Taxes by Mortgage Status in Flemington
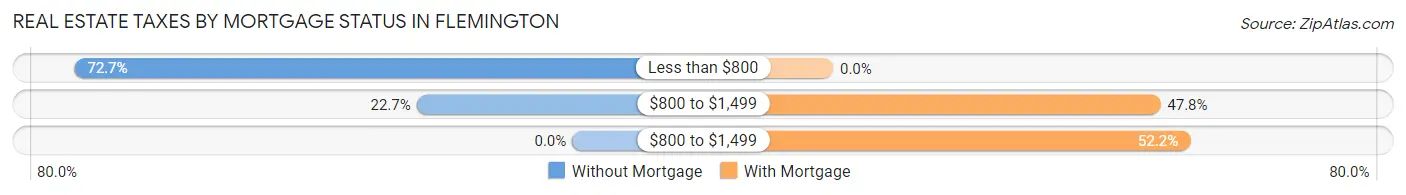
| Property Taxes | Without Mortgage | With Mortgage |
| Less than $800 | 32 (72.7%) | 0 (0.0%) |
| $800 to $1,499 | 10 (22.7%) | 11 (47.8%) |
| $800 to $1,499 | 0 (0.0%) | 12 (52.2%) |
| Total | 44 (100.0%) | 23 (100.0%) |
Health & Disability in Flemington
Health Insurance Coverage by Age in Flemington
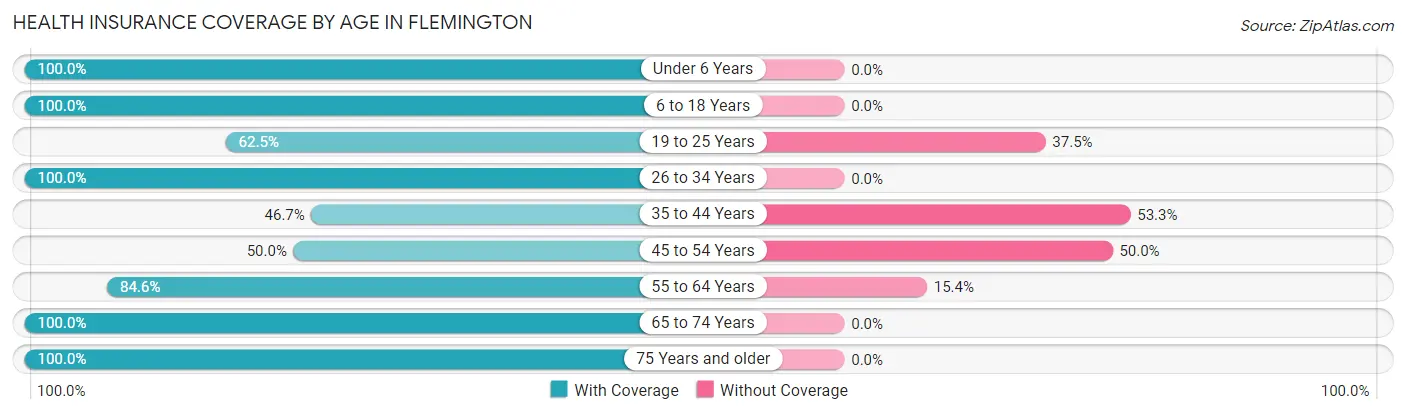
| Age Bracket | With Coverage | Without Coverage |
| Under 6 Years | 32 (100.0%) | 0 (0.0%) |
| 6 to 18 Years | 73 (100.0%) | 0 (0.0%) |
| 19 to 25 Years | 15 (62.5%) | 9 (37.5%) |
| 26 to 34 Years | 19 (100.0%) | 0 (0.0%) |
| 35 to 44 Years | 14 (46.7%) | 16 (53.3%) |
| 45 to 54 Years | 12 (50.0%) | 12 (50.0%) |
| 55 to 64 Years | 33 (84.6%) | 6 (15.4%) |
| 65 to 74 Years | 34 (100.0%) | 0 (0.0%) |
| 75 Years and older | 16 (100.0%) | 0 (0.0%) |
| Total | 248 (85.2%) | 43 (14.8%) |
Health Insurance Coverage by Citizenship Status in Flemington
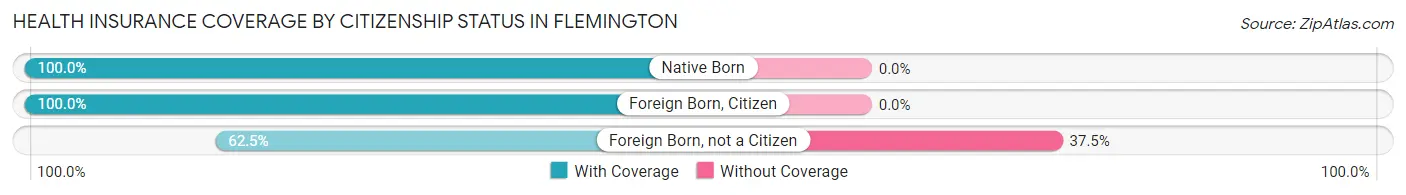
| Citizenship Status | With Coverage | Without Coverage |
| Native Born | 32 (100.0%) | 0 (0.0%) |
| Foreign Born, Citizen | 73 (100.0%) | 0 (0.0%) |
| Foreign Born, not a Citizen | 15 (62.5%) | 9 (37.5%) |
Health Insurance Coverage by Household Income in Flemington
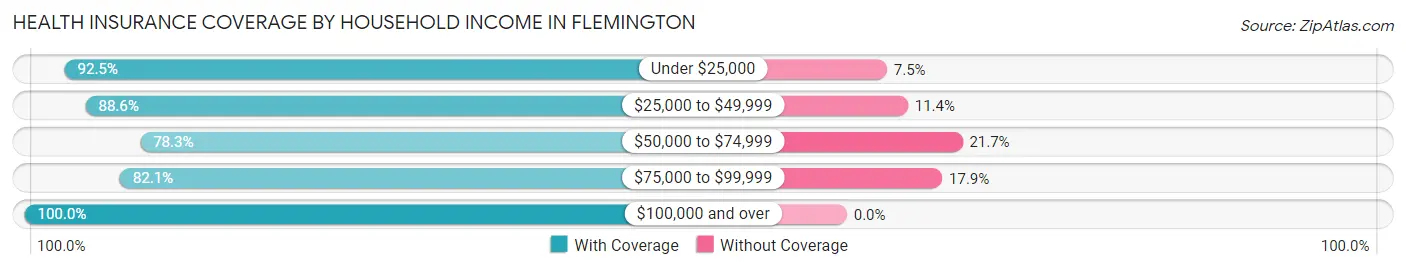
| Household Income | With Coverage | Without Coverage |
| Under $25,000 | 37 (92.5%) | 3 (7.5%) |
| $25,000 to $49,999 | 31 (88.6%) | 4 (11.4%) |
| $50,000 to $74,999 | 94 (78.3%) | 26 (21.7%) |
| $75,000 to $99,999 | 46 (82.1%) | 10 (17.9%) |
| $100,000 and over | 40 (100.0%) | 0 (0.0%) |
Public vs Private Health Insurance Coverage by Age in Flemington
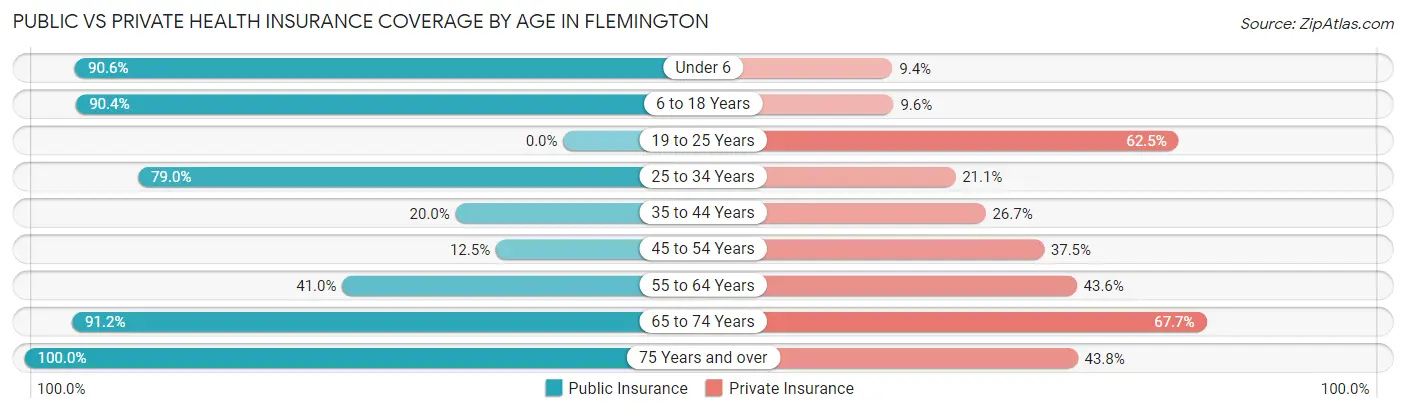
| Age Bracket | Public Insurance | Private Insurance |
| Under 6 | 29 (90.6%) | 3 (9.4%) |
| 6 to 18 Years | 66 (90.4%) | 7 (9.6%) |
| 19 to 25 Years | 0 (0.0%) | 15 (62.5%) |
| 25 to 34 Years | 15 (78.9%) | 4 (21.0%) |
| 35 to 44 Years | 6 (20.0%) | 8 (26.7%) |
| 45 to 54 Years | 3 (12.5%) | 9 (37.5%) |
| 55 to 64 Years | 16 (41.0%) | 17 (43.6%) |
| 65 to 74 Years | 31 (91.2%) | 23 (67.6%) |
| 75 Years and over | 16 (100.0%) | 7 (43.8%) |
| Total | 182 (62.5%) | 93 (32.0%) |
Disability Status by Sex by Age in Flemington
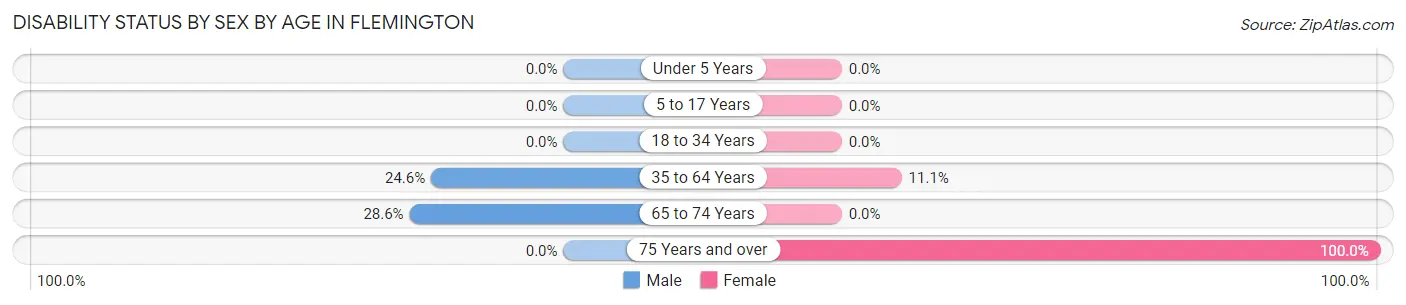
| Age Bracket | Male | Female |
| Under 5 Years | 0 (0.0%) | 0 (0.0%) |
| 5 to 17 Years | 0 (0.0%) | 0 (0.0%) |
| 18 to 34 Years | 0 (0.0%) | 0 (0.0%) |
| 35 to 64 Years | 14 (24.6%) | 4 (11.1%) |
| 65 to 74 Years | 4 (28.6%) | 0 (0.0%) |
| 75 Years and over | 0 (0.0%) | 12 (100.0%) |
Disability Class by Sex by Age in Flemington
Disability Class: Hearing Difficulty
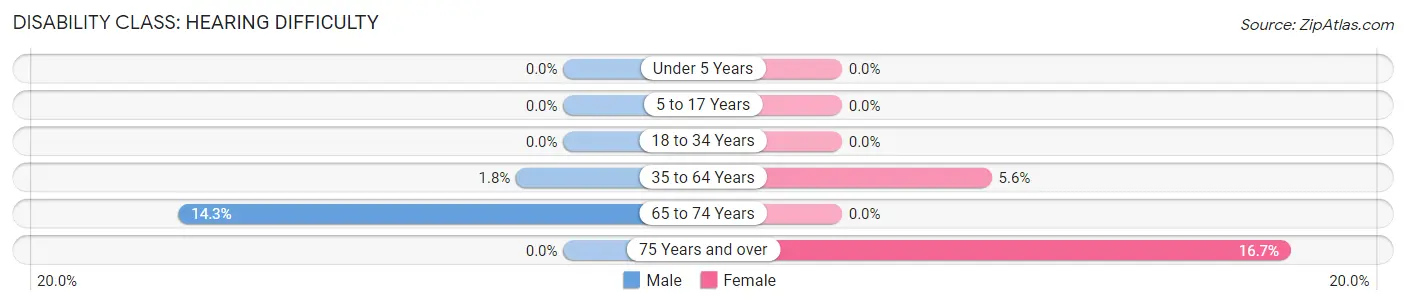
| Age Bracket | Male | Female |
| Under 5 Years | 0 (0.0%) | 0 (0.0%) |
| 5 to 17 Years | 0 (0.0%) | 0 (0.0%) |
| 18 to 34 Years | 0 (0.0%) | 0 (0.0%) |
| 35 to 64 Years | 1 (1.8%) | 2 (5.6%) |
| 65 to 74 Years | 2 (14.3%) | 0 (0.0%) |
| 75 Years and over | 0 (0.0%) | 2 (16.7%) |
Disability Class: Vision Difficulty
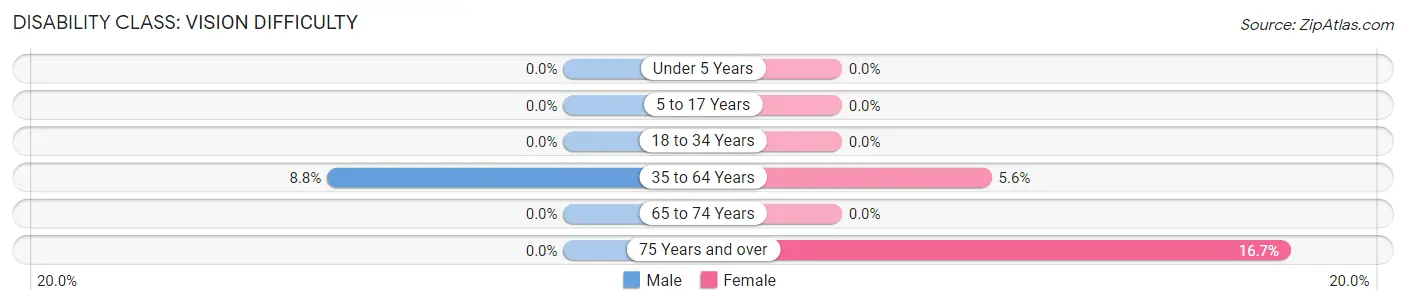
| Age Bracket | Male | Female |
| Under 5 Years | 0 (0.0%) | 0 (0.0%) |
| 5 to 17 Years | 0 (0.0%) | 0 (0.0%) |
| 18 to 34 Years | 0 (0.0%) | 0 (0.0%) |
| 35 to 64 Years | 5 (8.8%) | 2 (5.6%) |
| 65 to 74 Years | 0 (0.0%) | 0 (0.0%) |
| 75 Years and over | 0 (0.0%) | 2 (16.7%) |
Disability Class: Cognitive Difficulty
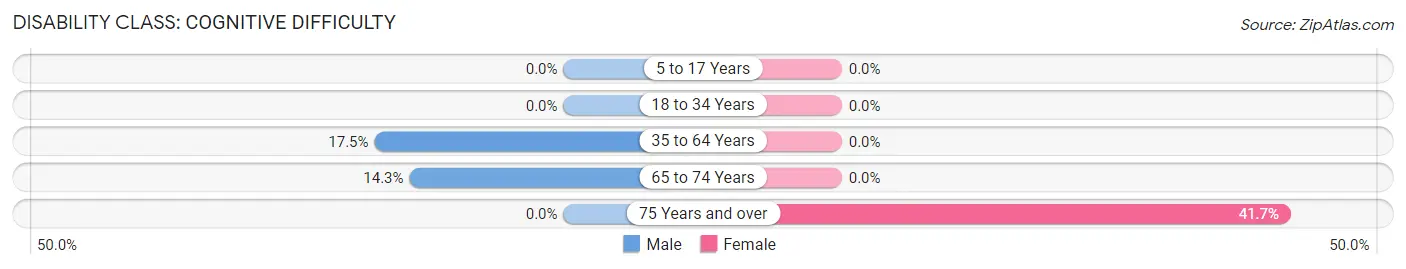
| Age Bracket | Male | Female |
| 5 to 17 Years | 0 (0.0%) | 0 (0.0%) |
| 18 to 34 Years | 0 (0.0%) | 0 (0.0%) |
| 35 to 64 Years | 10 (17.5%) | 0 (0.0%) |
| 65 to 74 Years | 2 (14.3%) | 0 (0.0%) |
| 75 Years and over | 0 (0.0%) | 5 (41.7%) |
Disability Class: Ambulatory Difficulty
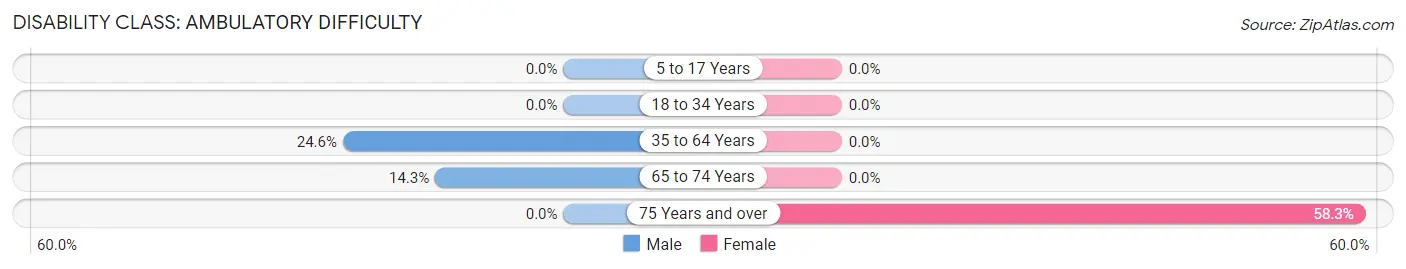
| Age Bracket | Male | Female |
| 5 to 17 Years | 0 (0.0%) | 0 (0.0%) |
| 18 to 34 Years | 0 (0.0%) | 0 (0.0%) |
| 35 to 64 Years | 14 (24.6%) | 0 (0.0%) |
| 65 to 74 Years | 2 (14.3%) | 0 (0.0%) |
| 75 Years and over | 0 (0.0%) | 7 (58.3%) |
Disability Class: Self-Care Difficulty
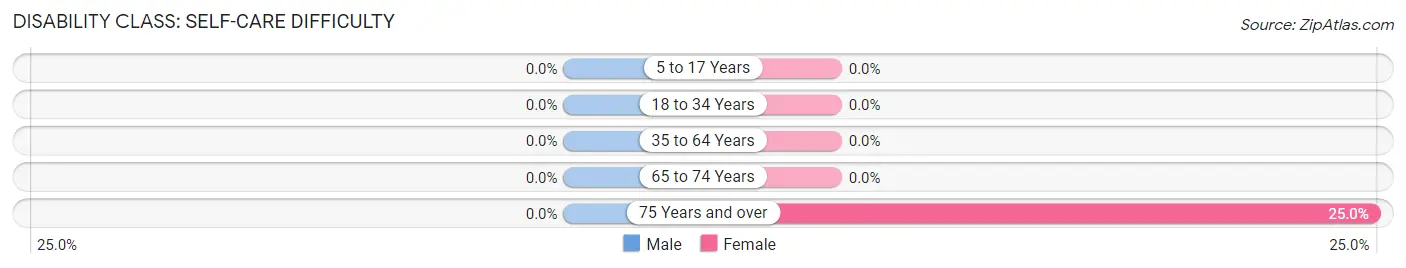
| Age Bracket | Male | Female |
| 5 to 17 Years | 0 (0.0%) | 0 (0.0%) |
| 18 to 34 Years | 0 (0.0%) | 0 (0.0%) |
| 35 to 64 Years | 0 (0.0%) | 0 (0.0%) |
| 65 to 74 Years | 0 (0.0%) | 0 (0.0%) |
| 75 Years and over | 0 (0.0%) | 3 (25.0%) |
Technology Access in Flemington
Computing Device Access in Flemington
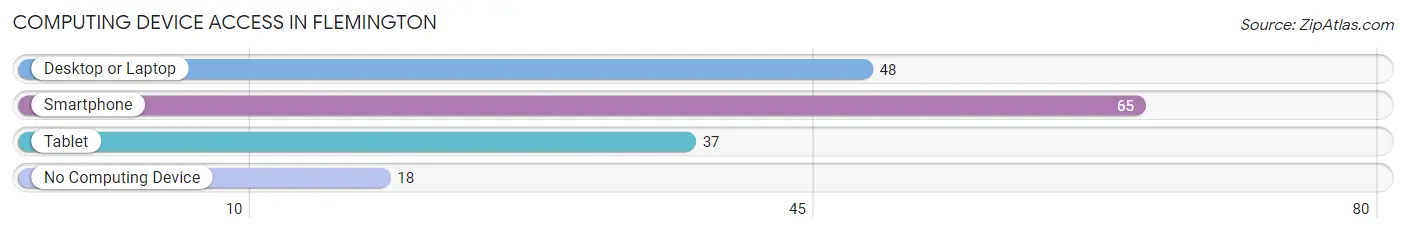
| Device Type | # Households | % Households |
| Desktop or Laptop | 48 | 54.5% |
| Smartphone | 65 | 73.9% |
| Tablet | 37 | 42.0% |
| No Computing Device | 18 | 20.4% |
| Total | 88 | 100.0% |
Internet Access in Flemington
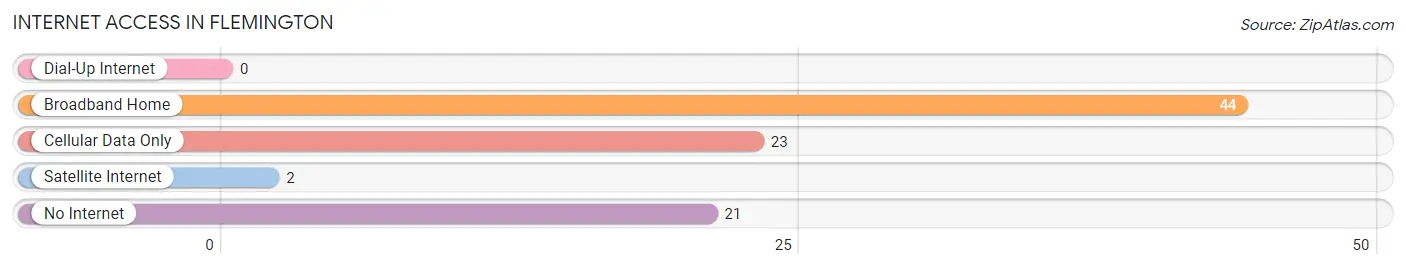
| Internet Type | # Households | % Households |
| Dial-Up Internet | 0 | 0.0% |
| Broadband Home | 44 | 50.0% |
| Cellular Data Only | 23 | 26.1% |
| Satellite Internet | 2 | 2.3% |
| No Internet | 21 | 23.9% |
| Total | 88 | 100.0% |
Flemington Summary
Flemington, West Virginia is a small town located in the eastern part of the state, in Taylor County. It is situated along the banks of the Tygart Valley River, and is surrounded by the Allegheny Mountains. The town has a population of just over 500 people, and is known for its rural charm and small-town atmosphere.
History
The area that is now Flemington was first settled in the late 1700s by a group of German immigrants. The town was originally known as “Flemingsburg”, after the family who founded it. The town was officially incorporated in 1891, and the name was changed to Flemington.
The town was an important stop on the Baltimore and Ohio Railroad, and was a major hub for the coal industry in the late 19th and early 20th centuries. The town was also home to a number of factories, including a glass factory, a furniture factory, and a brickyard.
Geography
Flemington is located in the eastern part of West Virginia, in Taylor County. It is situated along the banks of the Tygart Valley River, and is surrounded by the Allegheny Mountains. The town has a total area of 0.7 square miles, all of which is land.
The climate in Flemington is classified as humid continental, with hot summers and cold winters. The average annual temperature is around 50 degrees Fahrenheit, and the average annual precipitation is around 40 inches.
Economy
The economy of Flemington is largely based on agriculture and tourism. The town is home to a number of farms, and the surrounding area is known for its apple orchards and vineyards. The town is also a popular destination for outdoor recreation, such as fishing, hunting, and camping.
The town is also home to a number of small businesses, including restaurants, shops, and a few manufacturing companies. The town is also home to a number of government offices, including the Taylor County Courthouse and the Taylor County Sheriff’s Office.
Demographics
As of the 2010 census, the population of Flemington was 514 people. The racial makeup of the town was 97.3% White, 0.6% African American, 0.2% Native American, 0.2% Asian, and 1.7% from other races. The median household income was $30,000, and the median family income was $35,000.
The town is home to a number of churches, including the Flemington United Methodist Church, the Flemington Baptist Church, and the Flemington Presbyterian Church. The town is also home to a number of schools, including the Flemington Elementary School, the Flemington Middle School, and the Flemington High School.
Conclusion
Flemington, West Virginia is a small town located in the eastern part of the state, in Taylor County. It is situated along the banks of the Tygart Valley River, and is surrounded by the Allegheny Mountains. The town has a population of just over 500 people, and is known for its rural charm and small-town atmosphere. The economy of Flemington is largely based on agriculture and tourism, and the town is home to a number of small businesses, churches, and schools. The town is also home to a number of government offices, including the Taylor County Courthouse and the Taylor County Sheriff’s Office.
Common Questions
What is Per Capita Income in Flemington?
Per Capita income in Flemington is $20,099.
What is the Median Family Income in Flemington?
Median Family Income in Flemington is $83,750.
What is the Median Household income in Flemington?
Median Household Income in Flemington is $54,286.
What is Income or Wage Gap in Flemington?
Income or Wage Gap in Flemington is 14.9%.
Women in Flemington earn 85.1 cents for every dollar earned by a man.
What is Inequality or Gini Index in Flemington?
Inequality or Gini Index in Flemington is 0.39.
What is the Total Population of Flemington?
Total Population of Flemington is 291.
What is the Total Male Population of Flemington?
Total Male Population of Flemington is 148.
What is the Total Female Population of Flemington?
Total Female Population of Flemington is 143.
What is the Ratio of Males per 100 Females in Flemington?
There are 103.50 Males per 100 Females in Flemington.
What is the Ratio of Females per 100 Males in Flemington?
There are 96.62 Females per 100 Males in Flemington.
What is the Median Population Age in Flemington?
Median Population Age in Flemington is 32.4 Years.
What is the Average Family Size in Flemington
Average Family Size in Flemington is 4.7 People.
What is the Average Household Size in Flemington
Average Household Size in Flemington is 3.3 People.
How Large is the Labor Force in Flemington?
There are 118 People in the Labor Forcein in Flemington.
What is the Percentage of People in the Labor Force in Flemington?
62.4% of People are in the Labor Force in Flemington.
What is the Unemployment Rate in Flemington?
Unemployment Rate in Flemington is 21.2%.