Matewan, WV Map & Demographics
Matewan Map
Matewan Overview
$14,868
PER CAPITA INCOME
$42,988
AVG FAMILY INCOME
$22,250
AVG HOUSEHOLD INCOME
22.2%
WAGE / INCOME GAP [ % ]
77.8¢/ $1
WAGE / INCOME GAP [ $ ]
0.42
INEQUALITY / GINI INDEX
558
TOTAL POPULATION
232
MALE POPULATION
326
FEMALE POPULATION
71.17
MALES / 100 FEMALES
140.52
FEMALES / 100 MALES
46.9
MEDIAN AGE
3.0
AVG FAMILY SIZE
2.0
AVG HOUSEHOLD SIZE
152
LABOR FORCE [ PEOPLE ]
32.9%
PERCENT IN LABOR FORCE
21.1%
UNEMPLOYMENT RATE
Matewan Zip Codes
Matewan Area Codes
Income in Matewan
Income Overview in Matewan
Per Capita Income in Matewan is $14,868, while median incomes of families and households are $42,988 and $22,250 respectively.
| Characteristic | Number | Measure |
| Per Capita Income | 558 | $14,868 |
| Median Family Income | 126 | $42,988 |
| Mean Family Income | 126 | $44,577 |
| Median Household Income | 283 | $22,250 |
| Mean Household Income | 283 | $28,698 |
| Income Deficit | 126 | $0 |
| Wage / Income Gap (%) | 558 | 22.23% |
| Wage / Income Gap ($) | 558 | 77.77¢ per $1 |
| Gini / Inequality Index | 558 | 0.42 |
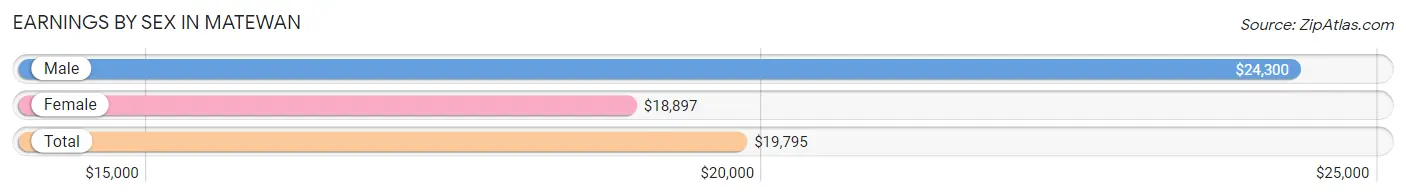
Earnings by Sex in Matewan
Average Earnings in Matewan are $19,795, $24,300 for men and $18,897 for women, a difference of 22.2%.
| Sex | Number | Average Earnings |
| Male | 72 (45.9%) | $24,300 |
| Female | 85 (54.1%) | $18,897 |
| Total | 157 (100.0%) | $19,795 |
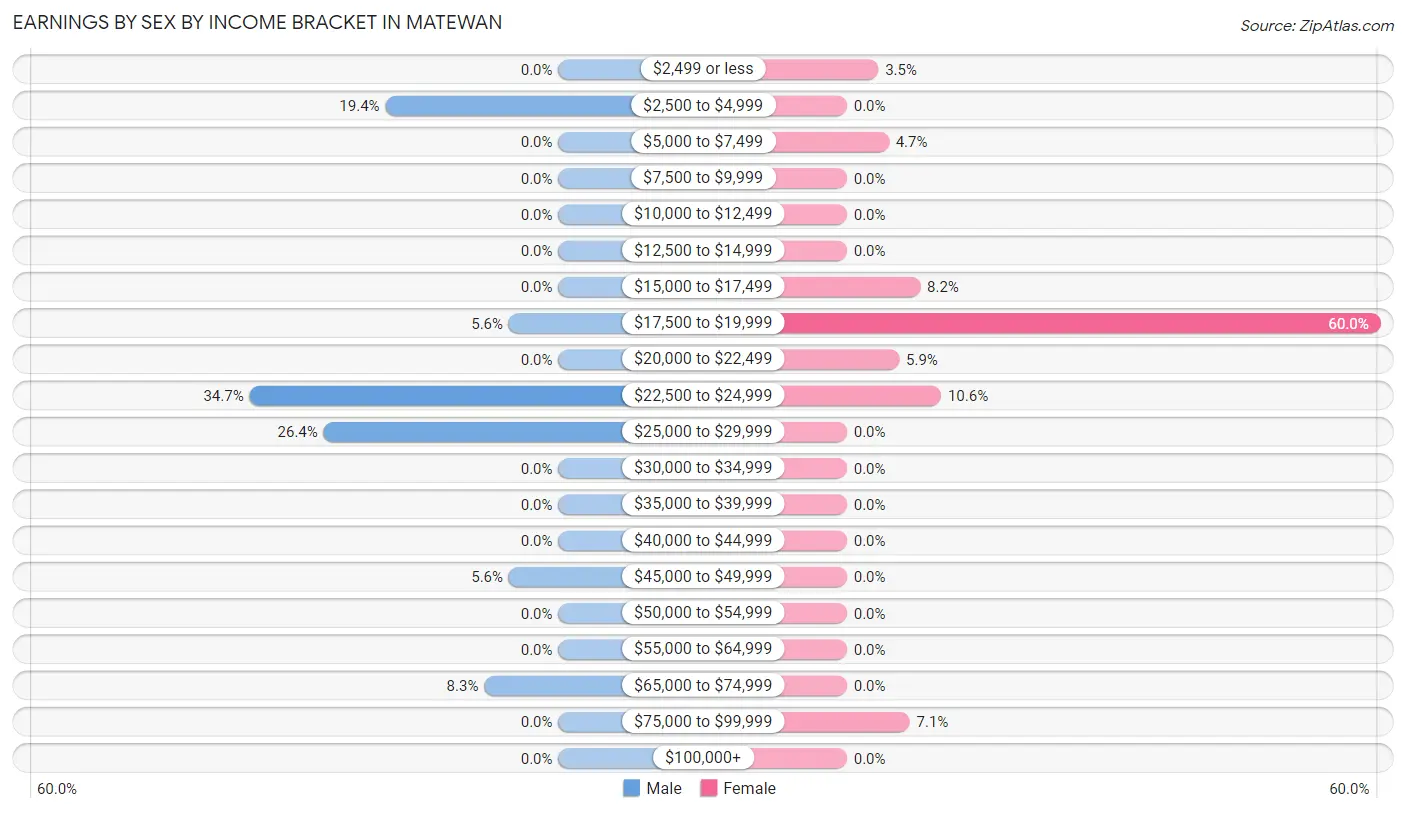
Earnings by Sex by Income Bracket in Matewan
The most common earnings brackets in Matewan are $22,500 to $24,999 for men (25 | 34.7%) and $17,500 to $19,999 for women (51 | 60.0%).
| Income | Male | Female |
| $2,499 or less | 0 (0.0%) | 3 (3.5%) |
| $2,500 to $4,999 | 14 (19.4%) | 0 (0.0%) |
| $5,000 to $7,499 | 0 (0.0%) | 4 (4.7%) |
| $7,500 to $9,999 | 0 (0.0%) | 0 (0.0%) |
| $10,000 to $12,499 | 0 (0.0%) | 0 (0.0%) |
| $12,500 to $14,999 | 0 (0.0%) | 0 (0.0%) |
| $15,000 to $17,499 | 0 (0.0%) | 7 (8.2%) |
| $17,500 to $19,999 | 4 (5.6%) | 51 (60.0%) |
| $20,000 to $22,499 | 0 (0.0%) | 5 (5.9%) |
| $22,500 to $24,999 | 25 (34.7%) | 9 (10.6%) |
| $25,000 to $29,999 | 19 (26.4%) | 0 (0.0%) |
| $30,000 to $34,999 | 0 (0.0%) | 0 (0.0%) |
| $35,000 to $39,999 | 0 (0.0%) | 0 (0.0%) |
| $40,000 to $44,999 | 0 (0.0%) | 0 (0.0%) |
| $45,000 to $49,999 | 4 (5.6%) | 0 (0.0%) |
| $50,000 to $54,999 | 0 (0.0%) | 0 (0.0%) |
| $55,000 to $64,999 | 0 (0.0%) | 0 (0.0%) |
| $65,000 to $74,999 | 6 (8.3%) | 0 (0.0%) |
| $75,000 to $99,999 | 0 (0.0%) | 6 (7.1%) |
| $100,000+ | 0 (0.0%) | 0 (0.0%) |
| Total | 72 (100.0%) | 85 (100.0%) |
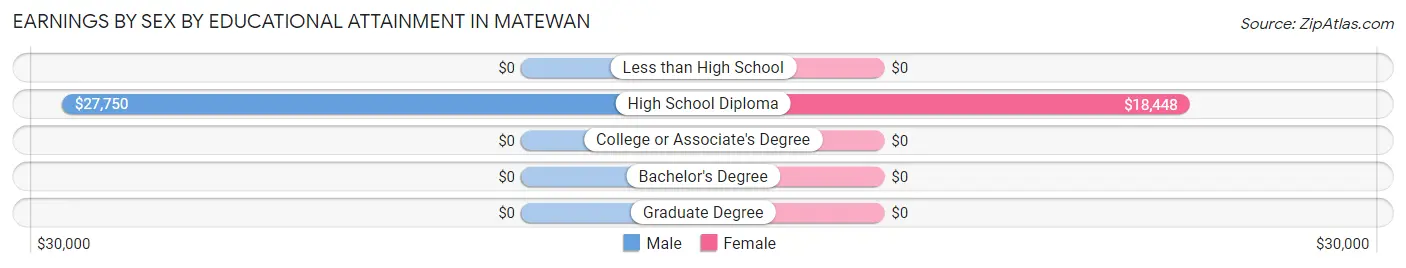
Earnings by Sex by Educational Attainment in Matewan
Average earnings in Matewan are $24,300 for men and $18,667 for women, a difference of 23.2%. Men with an educational attainment of high school diploma enjoy the highest average annual earnings of $27,750, while those with high school diploma education earn the least with $27,750. Women with an educational attainment of high school diploma earn the most with the average annual earnings of $18,448, while those with high school diploma education have the smallest earnings of $18,448.
| Educational Attainment | Male Income | Female Income |
| Less than High School | - | - |
| High School Diploma | $27,750 | $18,448 |
| College or Associate's Degree | - | - |
| Bachelor's Degree | - | - |
| Graduate Degree | - | - |
| Total | $24,300 | $18,667 |
Family Income in Matewan
Family Income Brackets in Matewan
According to the Matewan family income data, there are 71 families falling into the $35,000 to $49,999 income range, which is the most common income bracket and makes up 56.4% of all families.
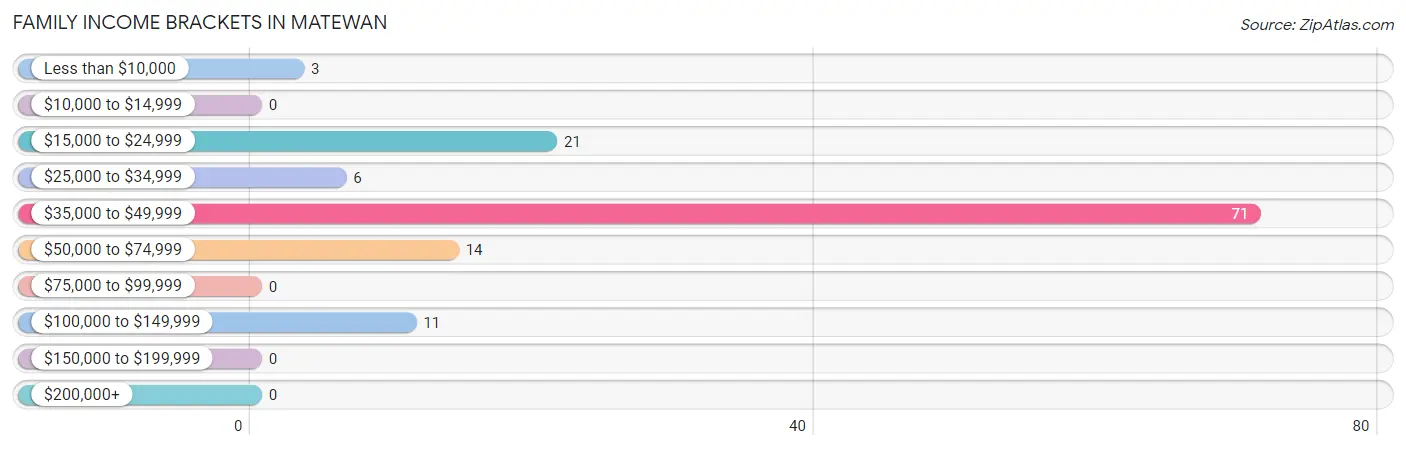
| Income Bracket | # Families | % Families |
| Less than $10,000 | 3 | 2.4% |
| $10,000 to $14,999 | 0 | 0.0% |
| $15,000 to $24,999 | 21 | 16.7% |
| $25,000 to $34,999 | 6 | 4.8% |
| $35,000 to $49,999 | 71 | 56.3% |
| $50,000 to $74,999 | 14 | 11.1% |
| $75,000 to $99,999 | 0 | 0.0% |
| $100,000 to $149,999 | 11 | 8.7% |
| $150,000 to $199,999 | 0 | 0.0% |
| $200,000+ | 0 | 0.0% |
Family Income by Famaliy Size in Matewan
3-person families (42 | 33.3%) account for the highest median family income in Matewan with $44,333 per family, while 2-person families (61 | 48.4%) have the highest median income of $21,658 per family member.
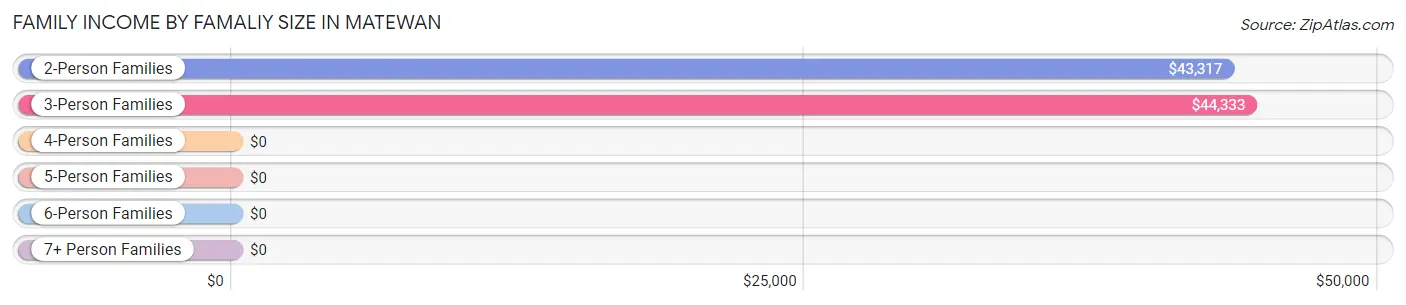
| Income Bracket | # Families | Median Income |
| 2-Person Families | 61 (48.4%) | $43,317 |
| 3-Person Families | 42 (33.3%) | $44,333 |
| 4-Person Families | 3 (2.4%) | $0 |
| 5-Person Families | 3 (2.4%) | $0 |
| 6-Person Families | 17 (13.5%) | $0 |
| 7+ Person Families | 0 (0.0%) | $0 |
| Total | 126 (100.0%) | $42,988 |
Family Income by Number of Earners in Matewan
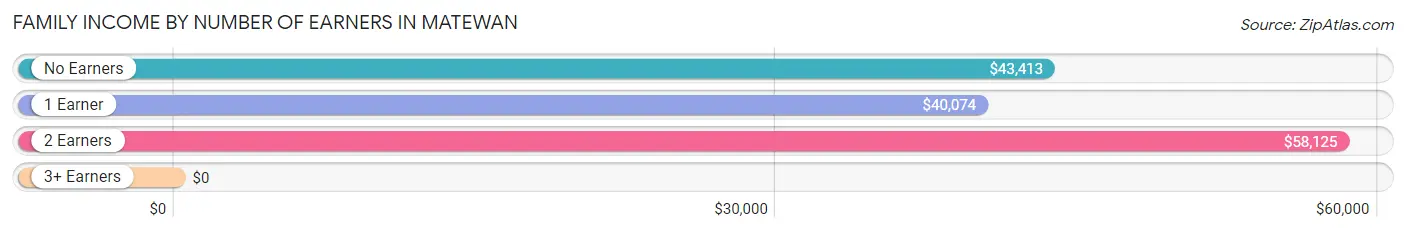
| Number of Earners | # Families | Median Income |
| No Earners | 47 (37.3%) | $43,413 |
| 1 Earner | 49 (38.9%) | $40,074 |
| 2 Earners | 30 (23.8%) | $58,125 |
| 3+ Earners | 0 (0.0%) | $0 |
| Total | 126 (100.0%) | $42,988 |
Household Income in Matewan
Household Income Brackets in Matewan
With 71 households falling in the category, the $35,000 to $49,999 income range is the most frequent in Matewan, accounting for 25.1% of all households.
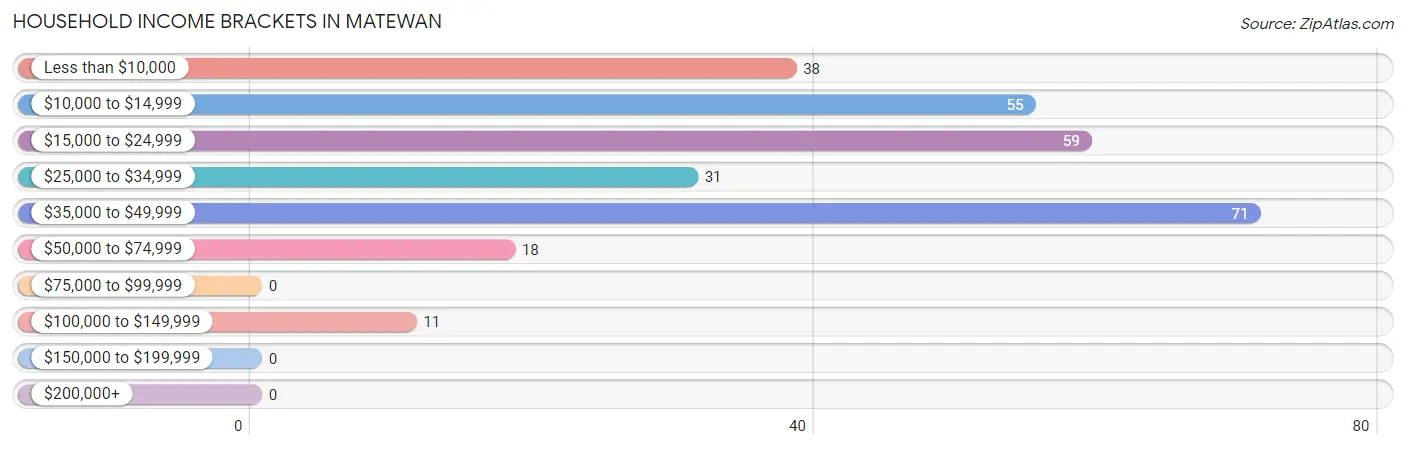
| Income Bracket | # Households | % Households |
| Less than $10,000 | 38 | 13.4% |
| $10,000 to $14,999 | 55 | 19.4% |
| $15,000 to $24,999 | 59 | 20.8% |
| $25,000 to $34,999 | 31 | 11.0% |
| $35,000 to $49,999 | 71 | 25.1% |
| $50,000 to $74,999 | 18 | 6.4% |
| $75,000 to $99,999 | 0 | 0.0% |
| $100,000 to $149,999 | 11 | 3.9% |
| $150,000 to $199,999 | 0 | 0.0% |
| $200,000+ | 0 | 0.0% |
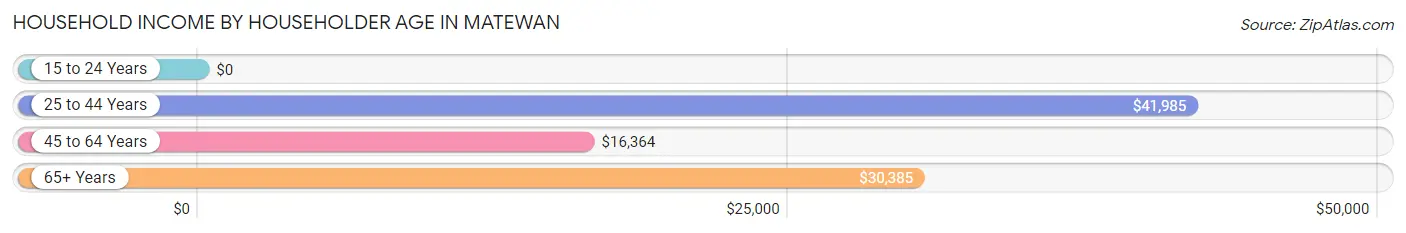
Household Income by Householder Age in Matewan
The median household income in Matewan is $22,250, with the highest median household income of $41,985 found in the 25 to 44 years age bracket for the primary householder. A total of 57 households (20.1%) fall into this category.
| Income Bracket | # Households | Median Income |
| 15 to 24 Years | 0 (0.0%) | $0 |
| 25 to 44 Years | 57 (20.1%) | $41,985 |
| 45 to 64 Years | 128 (45.2%) | $16,364 |
| 65+ Years | 98 (34.6%) | $30,385 |
| Total | 283 (100.0%) | $22,250 |
Poverty in Matewan
Income Below Poverty by Sex and Age in Matewan
With 23.7% poverty level for males and 35.9% for females among the residents of Matewan, 55 to 64 year old males and 12 to 14 year old females are the most vulnerable to poverty, with 13 males (46.4%) and 5 females (100.0%) in their respective age groups living below the poverty level.
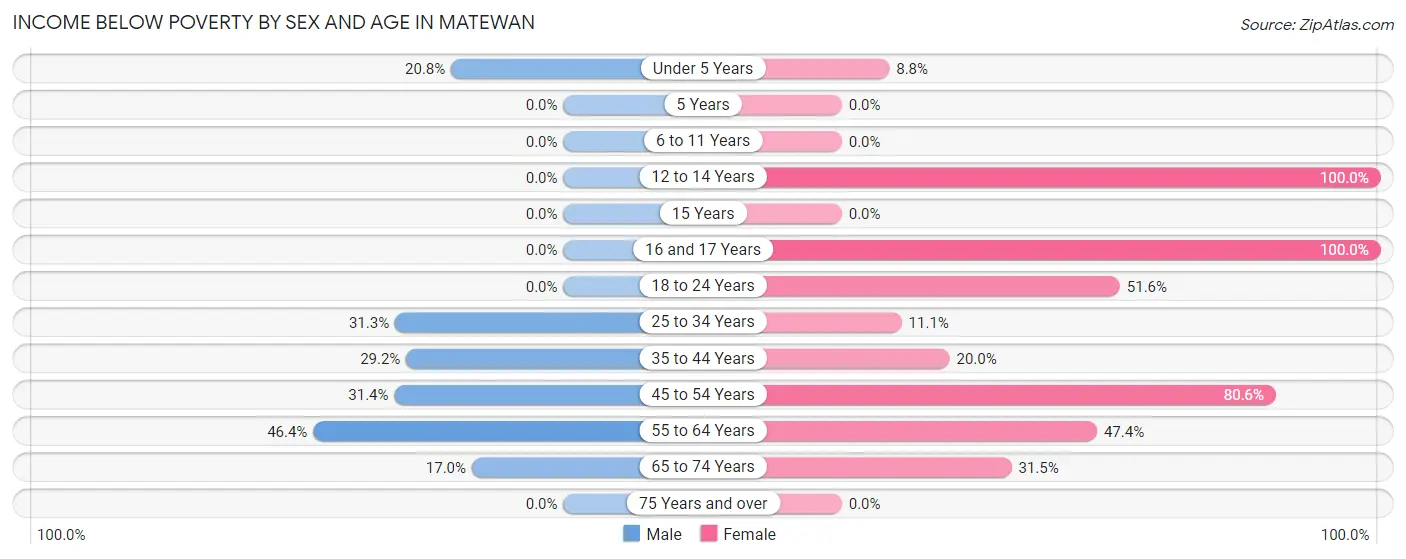
| Age Bracket | Male | Female |
| Under 5 Years | 5 (20.8%) | 3 (8.8%) |
| 5 Years | 0 (0.0%) | 0 (0.0%) |
| 6 to 11 Years | 0 (0.0%) | 0 (0.0%) |
| 12 to 14 Years | 0 (0.0%) | 5 (100.0%) |
| 15 Years | 0 (0.0%) | 0 (0.0%) |
| 16 and 17 Years | 0 (0.0%) | 5 (100.0%) |
| 18 to 24 Years | 0 (0.0%) | 16 (51.6%) |
| 25 to 34 Years | 5 (31.2%) | 6 (11.1%) |
| 35 to 44 Years | 7 (29.2%) | 3 (20.0%) |
| 45 to 54 Years | 16 (31.4%) | 29 (80.6%) |
| 55 to 64 Years | 13 (46.4%) | 27 (47.4%) |
| 65 to 74 Years | 9 (17.0%) | 23 (31.5%) |
| 75 Years and over | 0 (0.0%) | 0 (0.0%) |
| Total | 55 (23.7%) | 117 (35.9%) |
Income Above Poverty by Sex and Age in Matewan
According to the poverty statistics in Matewan, males aged 5 years and females aged 6 to 11 years are the age groups that are most secure financially, with 100.0% of males and 100.0% of females in these age groups living above the poverty line.
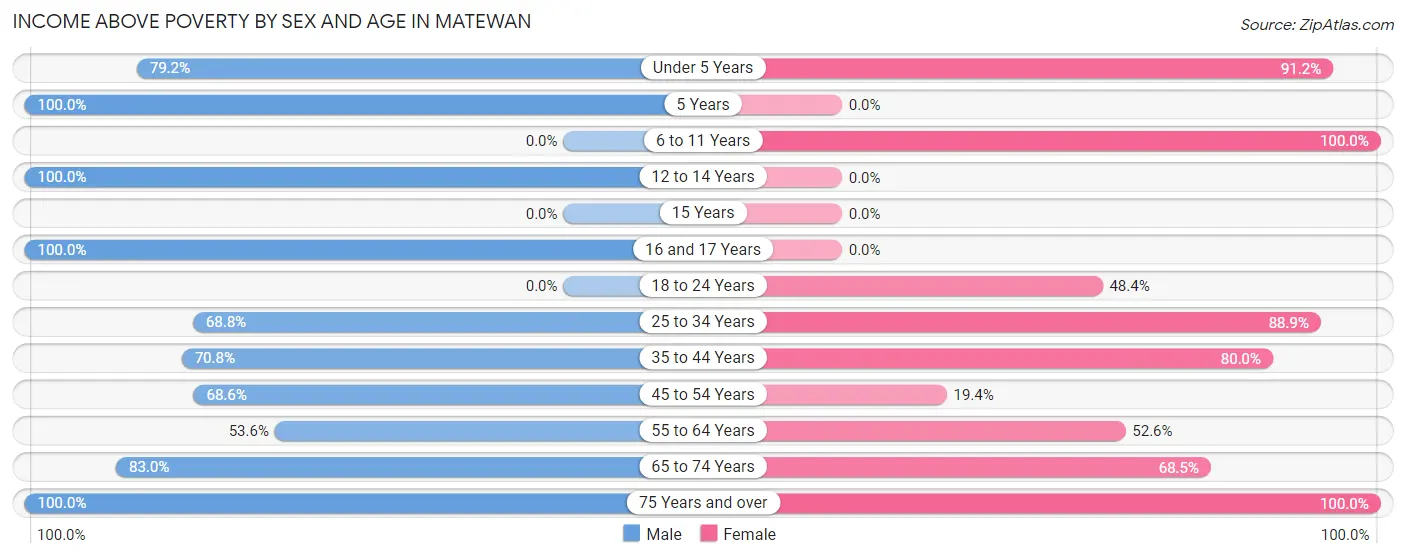
| Age Bracket | Male | Female |
| Under 5 Years | 19 (79.2%) | 31 (91.2%) |
| 5 Years | 11 (100.0%) | 0 (0.0%) |
| 6 to 11 Years | 0 (0.0%) | 11 (100.0%) |
| 12 to 14 Years | 11 (100.0%) | 0 (0.0%) |
| 15 Years | 0 (0.0%) | 0 (0.0%) |
| 16 and 17 Years | 9 (100.0%) | 0 (0.0%) |
| 18 to 24 Years | 0 (0.0%) | 15 (48.4%) |
| 25 to 34 Years | 11 (68.8%) | 48 (88.9%) |
| 35 to 44 Years | 17 (70.8%) | 12 (80.0%) |
| 45 to 54 Years | 35 (68.6%) | 7 (19.4%) |
| 55 to 64 Years | 15 (53.6%) | 30 (52.6%) |
| 65 to 74 Years | 44 (83.0%) | 50 (68.5%) |
| 75 Years and over | 5 (100.0%) | 5 (100.0%) |
| Total | 177 (76.3%) | 209 (64.1%) |
Income Below Poverty Among Married-Couple Families in Matewan
The poverty statistics for married-couple families in Matewan show that 15.7% or 14 of the total 89 families live below the poverty line. Families with no children have the highest poverty rate of 18.3%, comprising of 11 families. On the other hand, families with 1 or 2 children have the lowest poverty rate of 10.3%, which includes 3 families.
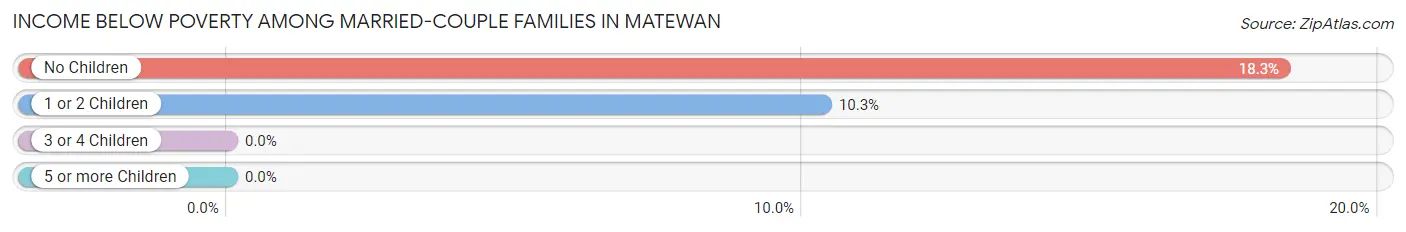
| Children | Above Poverty | Below Poverty |
| No Children | 49 (81.7%) | 11 (18.3%) |
| 1 or 2 Children | 26 (89.7%) | 3 (10.3%) |
| 3 or 4 Children | 0 (0.0%) | 0 (0.0%) |
| 5 or more Children | 0 (0.0%) | 0 (0.0%) |
| Total | 75 (84.3%) | 14 (15.7%) |
Income Below Poverty Among Single-Parent Households in Matewan
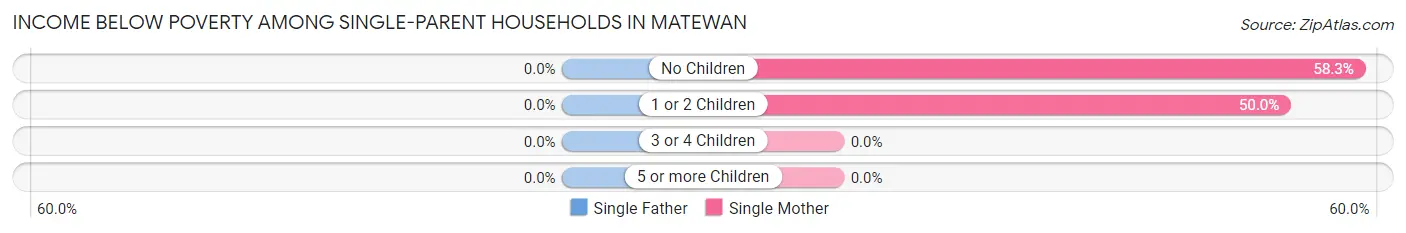
| Children | Single Father | Single Mother |
| No Children | 0 (0.0%) | 7 (58.3%) |
| 1 or 2 Children | 0 (0.0%) | 3 (50.0%) |
| 3 or 4 Children | 0 (0.0%) | 0 (0.0%) |
| 5 or more Children | 0 (0.0%) | 0 (0.0%) |
| Total | 0 (0.0%) | 10 (28.6%) |
Income Below Poverty Among Married-Couple vs Single-Parent Households in Matewan
The poverty data for Matewan shows that 14 of the married-couple family households (15.7%) and 10 of the single-parent households (27.0%) are living below the poverty level. Within the married-couple family households, those with no children have the highest poverty rate, with 11 households (18.3%) falling below the poverty line. Among the single-parent households, those with no children have the highest poverty rate, with 7 household (50.0%) living below poverty.
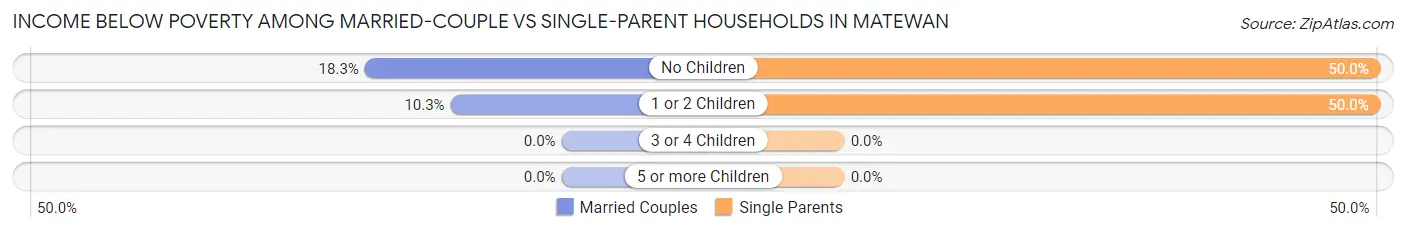
| Children | Married-Couple Families | Single-Parent Households |
| No Children | 11 (18.3%) | 7 (50.0%) |
| 1 or 2 Children | 3 (10.3%) | 3 (50.0%) |
| 3 or 4 Children | 0 (0.0%) | 0 (0.0%) |
| 5 or more Children | 0 (0.0%) | 0 (0.0%) |
| Total | 14 (15.7%) | 10 (27.0%) |
Race in Matewan
The most populous races in Matewan are White / Caucasian (510 | 91.4%), Hispanic or Latino (19 | 3.4%), and Some other Race (19 | 3.4%).
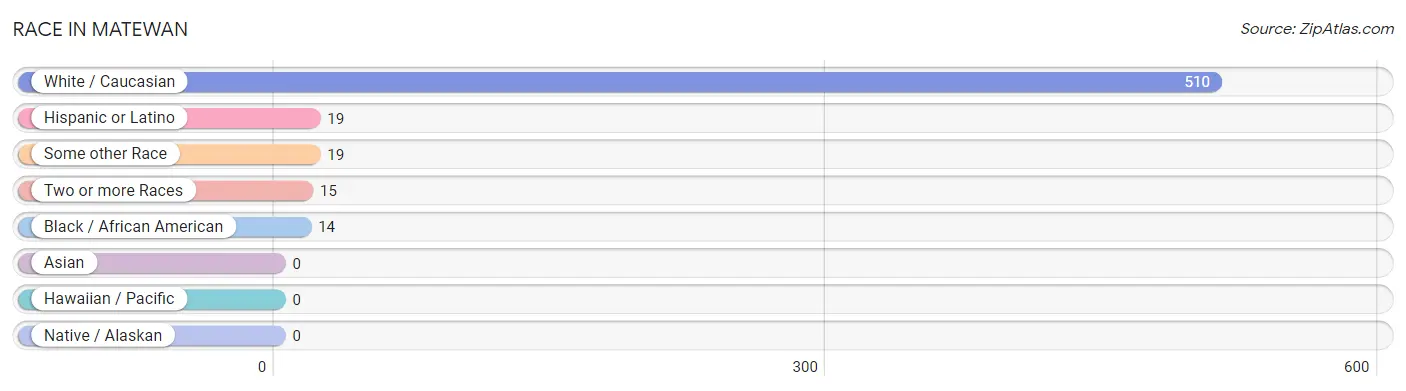
| Race | # Population | % Population |
| Asian | 0 | 0.0% |
| Black / African American | 14 | 2.5% |
| Hawaiian / Pacific | 0 | 0.0% |
| Hispanic or Latino | 19 | 3.4% |
| Native / Alaskan | 0 | 0.0% |
| White / Caucasian | 510 | 91.4% |
| Two or more Races | 15 | 2.7% |
| Some other Race | 19 | 3.4% |
| Total | 558 | 100.0% |
Ancestry in Matewan
The most populous ancestries reported in Matewan are Irish (93 | 16.7%), German (85 | 15.2%), English (67 | 12.0%), American (51 | 9.1%), and Italian (20 | 3.6%), together accounting for 56.6% of all Matewan residents.
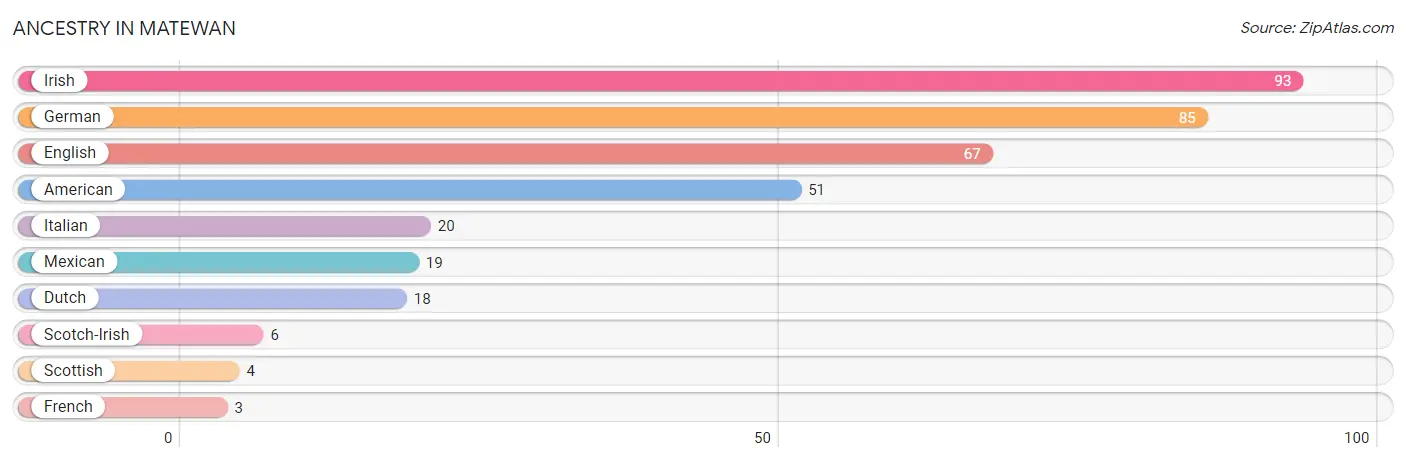
| Ancestry | # Population | % Population |
| American | 51 | 9.1% |
| Dutch | 18 | 3.2% |
| English | 67 | 12.0% |
| French | 3 | 0.5% |
| German | 85 | 15.2% |
| Irish | 93 | 16.7% |
| Italian | 20 | 3.6% |
| Mexican | 19 | 3.4% |
| Scotch-Irish | 6 | 1.1% |
| Scottish | 4 | 0.7% | View All 10 Rows |
Immigrants in Matewan
The most numerous immigrant groups reported in Matewan came from Central America (19 | 3.4%), Latin America (19 | 3.4%), and Mexico (19 | 3.4%), together accounting for 10.2% of all Matewan residents.
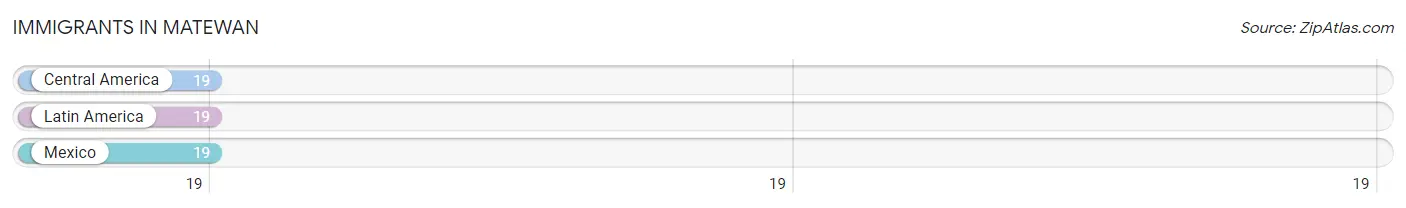
| Immigration Origin | # Population | % Population |
| Central America | 19 | 3.4% |
| Latin America | 19 | 3.4% |
| Mexico | 19 | 3.4% | View All 3 Rows |
Sex and Age in Matewan
Sex and Age in Matewan
The most populous age groups in Matewan are 70 to 74 Years (51 | 22.0%) for men and 65 to 69 Years (59 | 18.1%) for women.
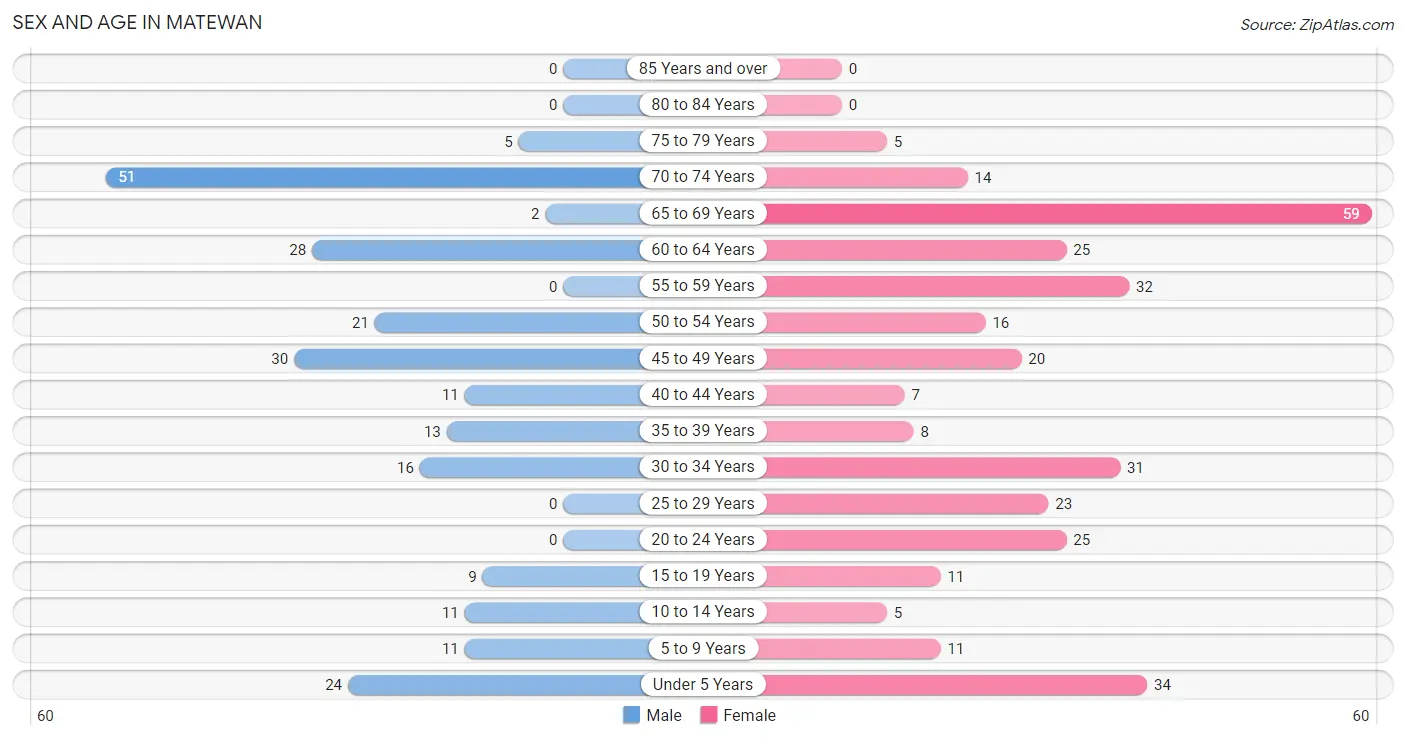
| Age Bracket | Male | Female |
| Under 5 Years | 24 (10.3%) | 34 (10.4%) |
| 5 to 9 Years | 11 (4.7%) | 11 (3.4%) |
| 10 to 14 Years | 11 (4.7%) | 5 (1.5%) |
| 15 to 19 Years | 9 (3.9%) | 11 (3.4%) |
| 20 to 24 Years | 0 (0.0%) | 25 (7.7%) |
| 25 to 29 Years | 0 (0.0%) | 23 (7.1%) |
| 30 to 34 Years | 16 (6.9%) | 31 (9.5%) |
| 35 to 39 Years | 13 (5.6%) | 8 (2.5%) |
| 40 to 44 Years | 11 (4.7%) | 7 (2.1%) |
| 45 to 49 Years | 30 (12.9%) | 20 (6.1%) |
| 50 to 54 Years | 21 (9.0%) | 16 (4.9%) |
| 55 to 59 Years | 0 (0.0%) | 32 (9.8%) |
| 60 to 64 Years | 28 (12.1%) | 25 (7.7%) |
| 65 to 69 Years | 2 (0.9%) | 59 (18.1%) |
| 70 to 74 Years | 51 (22.0%) | 14 (4.3%) |
| 75 to 79 Years | 5 (2.2%) | 5 (1.5%) |
| 80 to 84 Years | 0 (0.0%) | 0 (0.0%) |
| 85 Years and over | 0 (0.0%) | 0 (0.0%) |
| Total | 232 (100.0%) | 326 (100.0%) |
Families and Households in Matewan
Median Family Size in Matewan
The median family size in Matewan is 3.03 persons per family, with single female/mother families (35 | 27.8%) accounting for the largest median family size of 4.43 persons per family. On the other hand, single male/father families (2 | 1.6%) represent the smallest median family size with 2.00 persons per family.
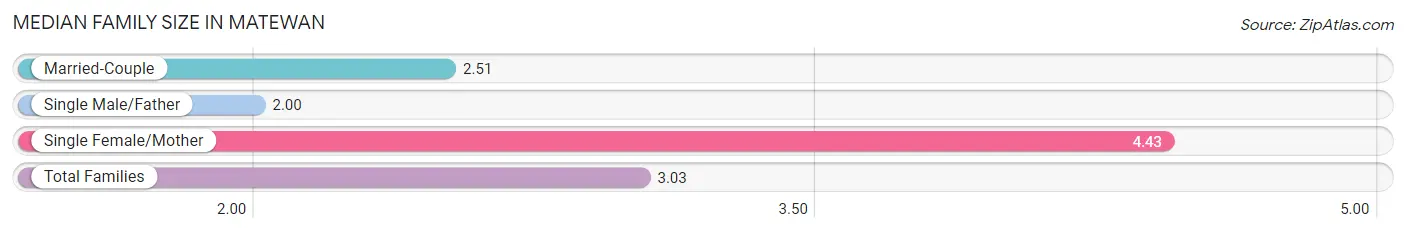
| Family Type | # Families | Family Size |
| Married-Couple | 89 (70.6%) | 2.51 |
| Single Male/Father | 2 (1.6%) | 2.00 |
| Single Female/Mother | 35 (27.8%) | 4.43 |
| Total Families | 126 (100.0%) | 3.03 |
Median Household Size in Matewan
The median household size in Matewan is 1.97 persons per household, with single female/mother households (35 | 12.4%) accounting for the largest median household size of 4.43 persons per household. non-family households (157 | 55.5%) represent the smallest median household size with 1.12 persons per household.
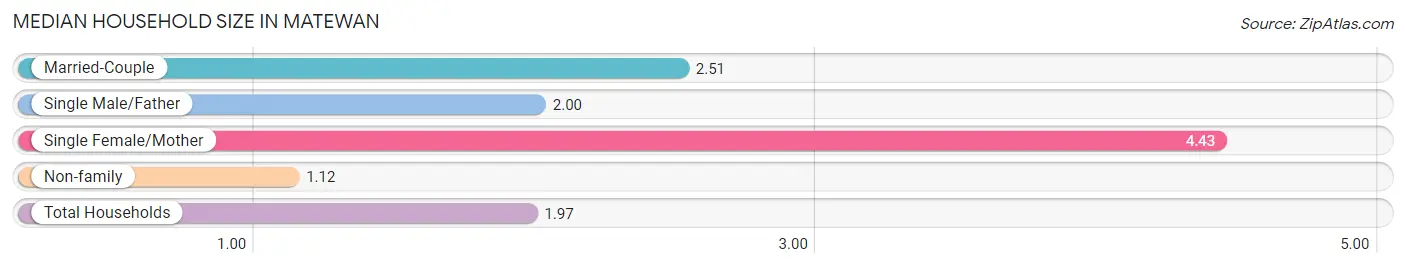
| Household Type | # Households | Household Size |
| Married-Couple | 89 (31.5%) | 2.51 |
| Single Male/Father | 2 (0.7%) | 2.00 |
| Single Female/Mother | 35 (12.4%) | 4.43 |
| Non-family | 157 (55.5%) | 1.12 |
| Total Households | 283 (100.0%) | 1.97 |
Household Size by Marriage Status in Matewan
Out of a total of 283 households in Matewan, 126 (44.5%) are family households, while 157 (55.5%) are nonfamily households. The most numerous type of family households are 2-person households, comprising 61, and the most common type of nonfamily households are 1-person households, comprising 153.
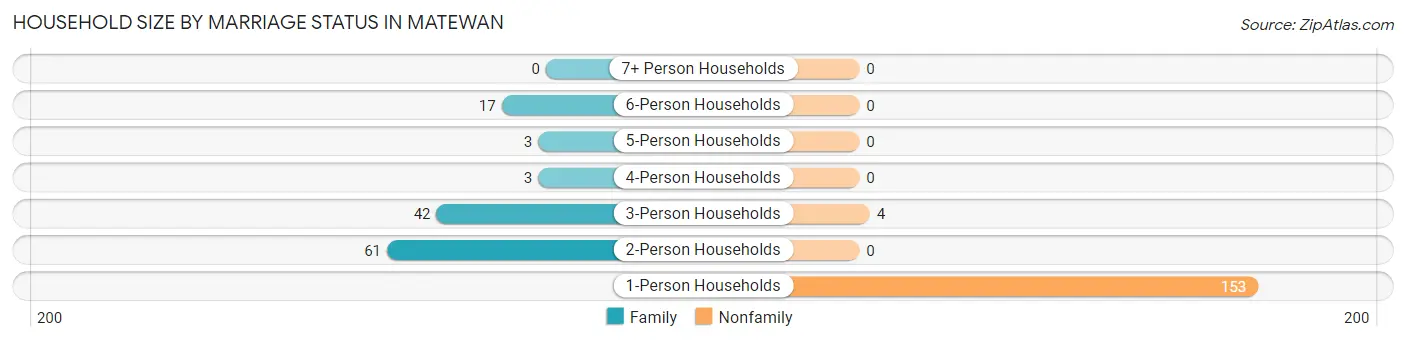
| Household Size | Family Households | Nonfamily Households |
| 1-Person Households | - | 153 (54.1%) |
| 2-Person Households | 61 (21.5%) | 0 (0.0%) |
| 3-Person Households | 42 (14.8%) | 4 (1.4%) |
| 4-Person Households | 3 (1.1%) | 0 (0.0%) |
| 5-Person Households | 3 (1.1%) | 0 (0.0%) |
| 6-Person Households | 17 (6.0%) | 0 (0.0%) |
| 7+ Person Households | 0 (0.0%) | 0 (0.0%) |
| Total | 126 (44.5%) | 157 (55.5%) |
Female Fertility in Matewan
Fertility by Age in Matewan
| Age Bracket | Women with Births | Births / 1,000 Women |
| 15 to 19 years | 0 (0.0%) | 0.0 |
| 20 to 34 years | 0 (0.0%) | 0.0 |
| 35 to 50 years | 0 (0.0%) | 0.0 |
| Total | 0 (0.0%) | 0.0 |
Fertility by Age by Marriage Status in Matewan
| Age Bracket | Married | Unmarried |
| 15 to 19 years | 0 (0.0%) | 0 (0.0%) |
| 20 to 34 years | 0 (0.0%) | 0 (0.0%) |
| 35 to 50 years | 0 (0.0%) | 0 (0.0%) |
| Total | 0 (0.0%) | 0 (0.0%) |
Fertility by Education in Matewan
| Educational Attainment | Women with Births | Births / 1,000 Women |
| Less than High School | 0 (0.0%) | 0.0 |
| High School Diploma | 0 (0.0%) | 0.0 |
| College or Associate's Degree | 0 (0.0%) | 0.0 |
| Bachelor's Degree | 0 (0.0%) | 0.0 |
| Graduate Degree | 0 (0.0%) | 0.0 |
| Total | 0 (0.0%) | 0.0 |
Fertility by Education by Marriage Status in Matewan
| Educational Attainment | Married | Unmarried |
| Less than High School | 0 (0.0%) | 0 (0.0%) |
| High School Diploma | 0 (0.0%) | 0 (0.0%) |
| College or Associate's Degree | 0 (0.0%) | 0 (0.0%) |
| Bachelor's Degree | 0 (0.0%) | 0 (0.0%) |
| Graduate Degree | 0 (0.0%) | 0 (0.0%) |
| Total | 0 (0.0%) | 0 (0.0%) |
Employment Characteristics in Matewan
Employment by Class of Employer in Matewan
Among the 120 employed individuals in Matewan, private company employees (77 | 64.2%), local government employees (19 | 15.8%), and state government employees (15 | 12.5%) make up the most common classes of employment.
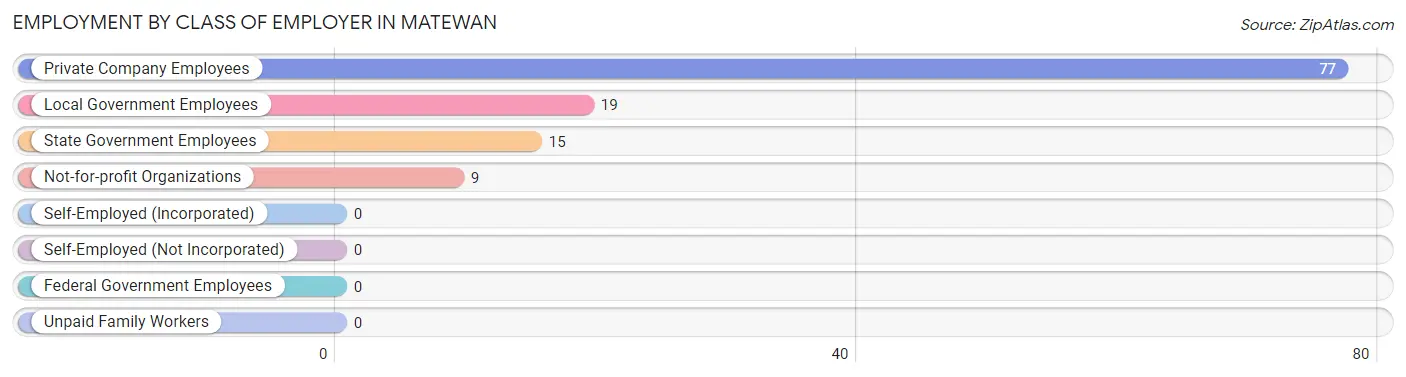
| Employer Class | # Employees | % Employees |
| Private Company Employees | 77 | 64.2% |
| Self-Employed (Incorporated) | 0 | 0.0% |
| Self-Employed (Not Incorporated) | 0 | 0.0% |
| Not-for-profit Organizations | 9 | 7.5% |
| Local Government Employees | 19 | 15.8% |
| State Government Employees | 15 | 12.5% |
| Federal Government Employees | 0 | 0.0% |
| Unpaid Family Workers | 0 | 0.0% |
| Total | 120 | 100.0% |
Employment Status by Age in Matewan
According to the labor force statistics for Matewan, out of the total population over 16 years of age (462), 32.9% or 152 individuals are in the labor force, with 21.1% or 32 of them unemployed. The age group with the highest labor force participation rate is 55 to 59 years, with 75.0% or 24 individuals in the labor force. Within the labor force, the 25 to 29 years age range has the highest percentage of unemployed individuals, with 100.0% or 6 of them being unemployed.
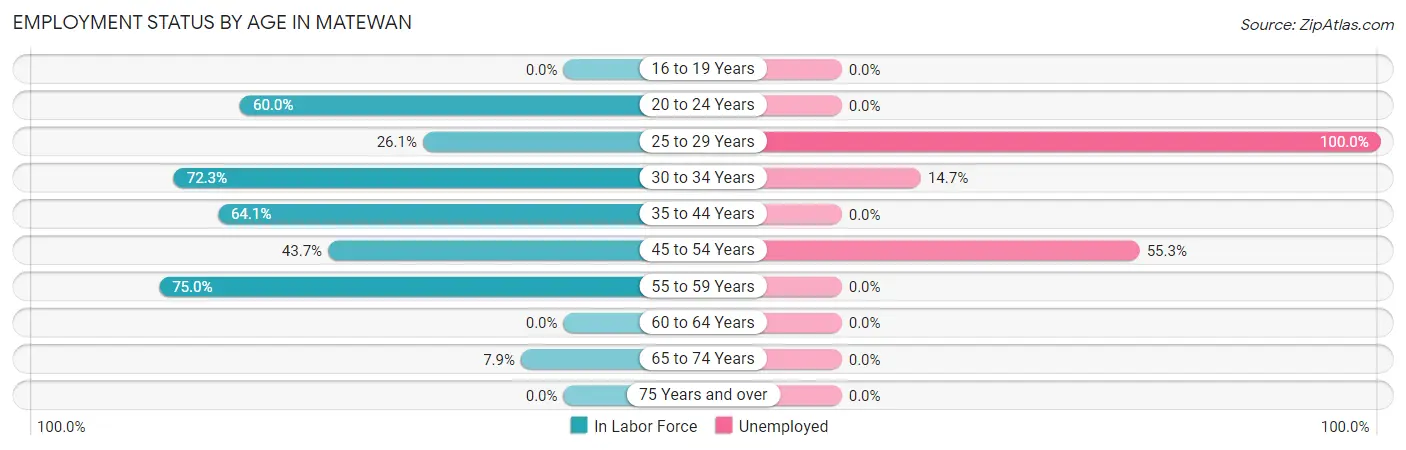
| Age Bracket | In Labor Force | Unemployed |
| 16 to 19 Years | 0 (0.0%) | 0 (0.0%) |
| 20 to 24 Years | 15 (60.0%) | 0 (0.0%) |
| 25 to 29 Years | 6 (26.1%) | 6 (100.0%) |
| 30 to 34 Years | 34 (72.3%) | 5 (14.7%) |
| 35 to 44 Years | 25 (64.1%) | 0 (0.0%) |
| 45 to 54 Years | 38 (43.7%) | 21 (55.3%) |
| 55 to 59 Years | 24 (75.0%) | 0 (0.0%) |
| 60 to 64 Years | 0 (0.0%) | 0 (0.0%) |
| 65 to 74 Years | 10 (7.9%) | 0 (0.0%) |
| 75 Years and over | 0 (0.0%) | 0 (0.0%) |
| Total | 152 (32.9%) | 32 (21.1%) |
Employment Status by Educational Attainment in Matewan
According to labor force statistics for Matewan, 45.2% of individuals (127) out of the total population between 25 and 64 years of age (281) are in the labor force, with 25.2% or 32 of them being unemployed. The group with the highest labor force participation rate are those with the educational attainment of high school diploma, with 52.9% or 72 individuals in the labor force. Within the labor force, individuals with less than high school education have the highest percentage of unemployment, with 43.8% or 14 of them being unemployed.
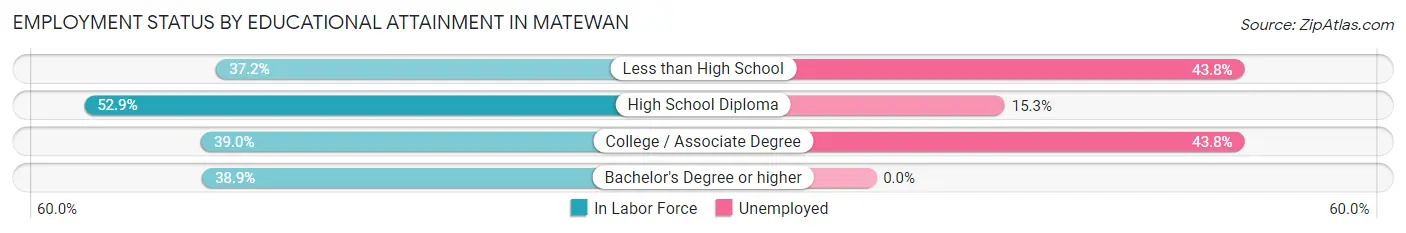
| Educational Attainment | In Labor Force | Unemployed |
| Less than High School | 32 (37.2%) | 38 (43.8%) |
| High School Diploma | 72 (52.9%) | 21 (15.3%) |
| College / Associate Degree | 16 (39.0%) | 18 (43.8%) |
| Bachelor's Degree or higher | 7 (38.9%) | 0 (0.0%) |
| Total | 127 (45.2%) | 71 (25.2%) |
Employment Occupations by Sex in Matewan
Management, Business, Science and Arts Occupations
The most common Management, Business, Science and Arts occupations in Matewan are Community & Social Service (14 | 11.7%), Education Instruction & Library (14 | 11.7%), and Management (10 | 8.3%).
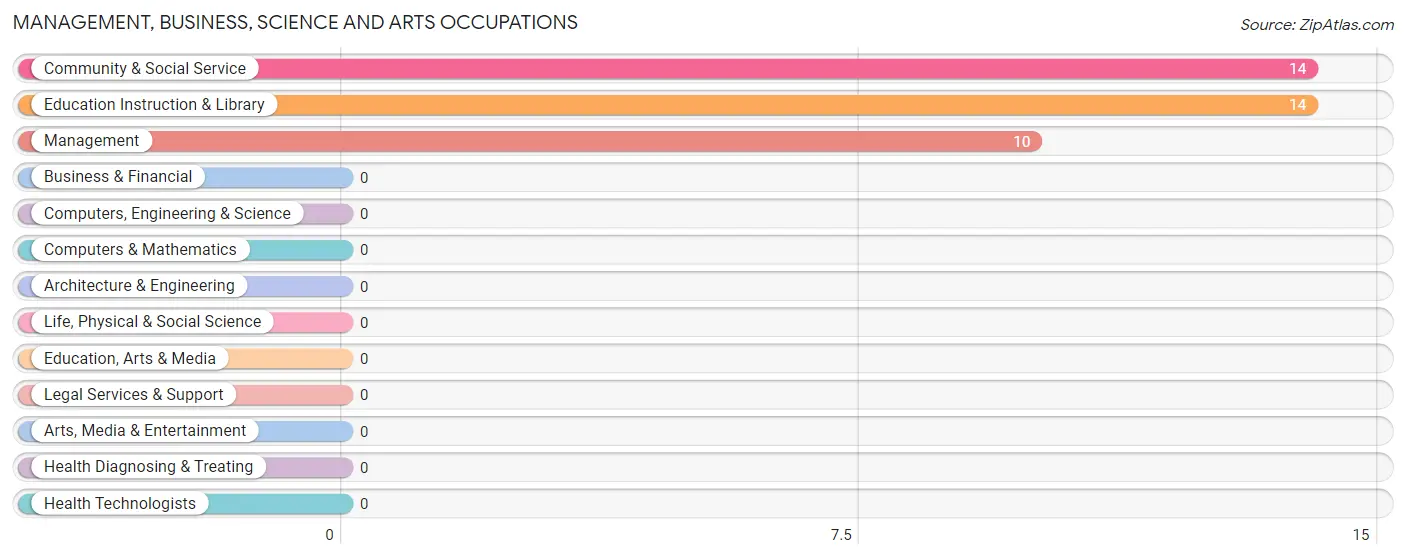
Management, Business, Science and Arts Occupations by Sex
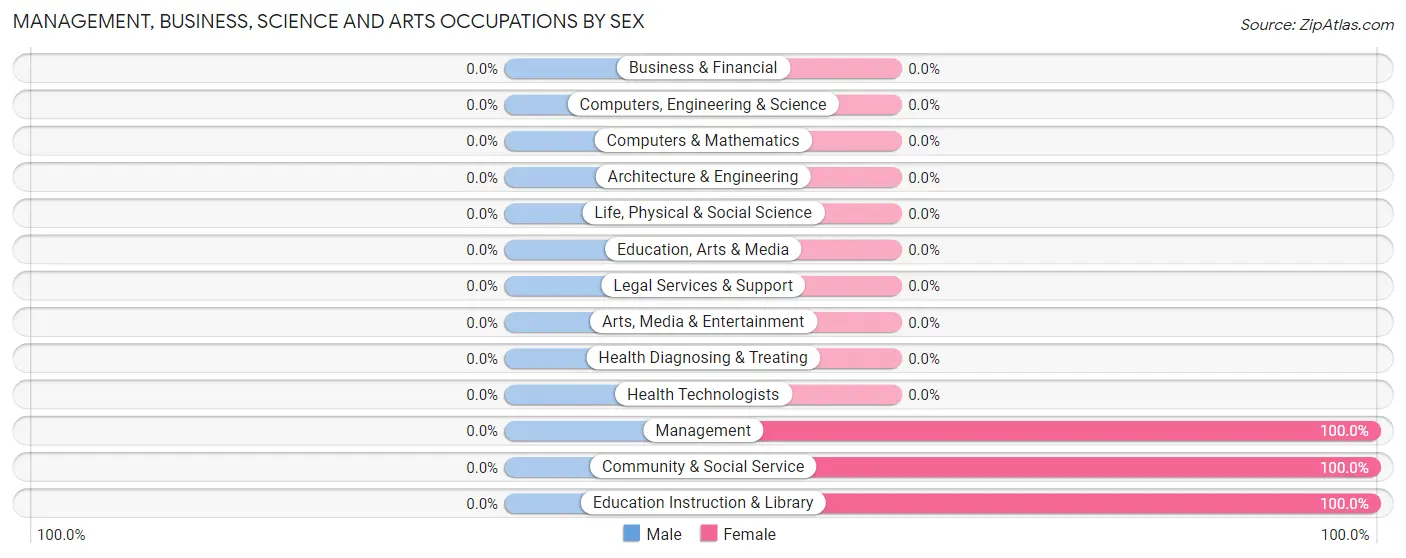
| Occupation | Male | Female |
| Management | 0 (0.0%) | 10 (100.0%) |
| Business & Financial | 0 (0.0%) | 0 (0.0%) |
| Computers, Engineering & Science | 0 (0.0%) | 0 (0.0%) |
| Computers & Mathematics | 0 (0.0%) | 0 (0.0%) |
| Architecture & Engineering | 0 (0.0%) | 0 (0.0%) |
| Life, Physical & Social Science | 0 (0.0%) | 0 (0.0%) |
| Community & Social Service | 0 (0.0%) | 14 (100.0%) |
| Education, Arts & Media | 0 (0.0%) | 0 (0.0%) |
| Legal Services & Support | 0 (0.0%) | 0 (0.0%) |
| Education Instruction & Library | 0 (0.0%) | 14 (100.0%) |
| Arts, Media & Entertainment | 0 (0.0%) | 0 (0.0%) |
| Health Diagnosing & Treating | 0 (0.0%) | 0 (0.0%) |
| Health Technologists | 0 (0.0%) | 0 (0.0%) |
| Total (Category) | 0 (0.0%) | 24 (100.0%) |
| Total (Overall) | 51 (42.5%) | 69 (57.5%) |
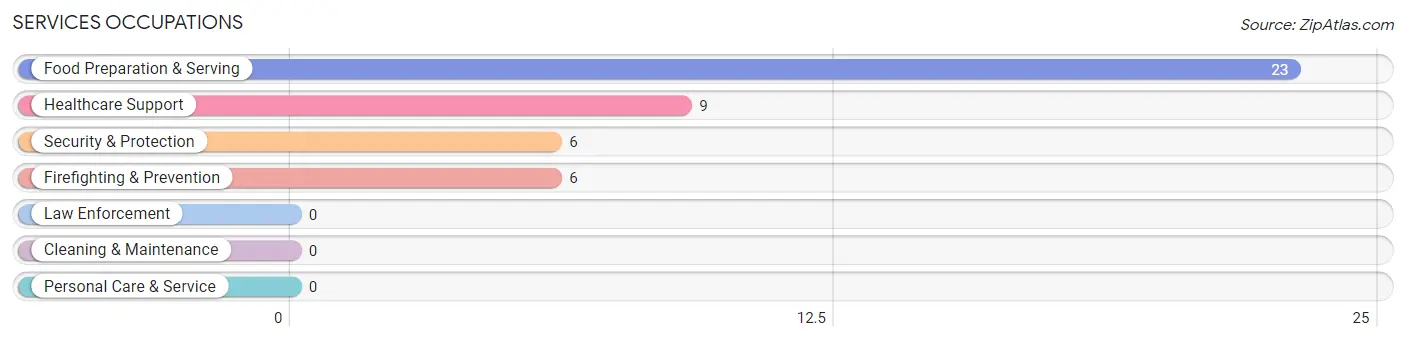
Services Occupations
The most common Services occupations in Matewan are Food Preparation & Serving (23 | 19.2%), Healthcare Support (9 | 7.5%), Security & Protection (6 | 5.0%), and Firefighting & Prevention (6 | 5.0%).
Services Occupations by Sex
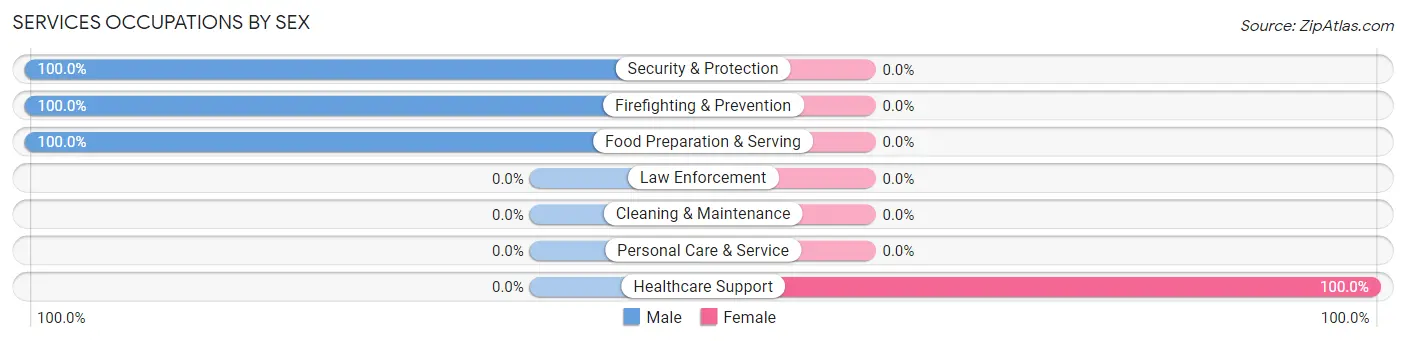
| Occupation | Male | Female |
| Healthcare Support | 0 (0.0%) | 9 (100.0%) |
| Security & Protection | 6 (100.0%) | 0 (0.0%) |
| Firefighting & Prevention | 6 (100.0%) | 0 (0.0%) |
| Law Enforcement | 0 (0.0%) | 0 (0.0%) |
| Food Preparation & Serving | 23 (100.0%) | 0 (0.0%) |
| Cleaning & Maintenance | 0 (0.0%) | 0 (0.0%) |
| Personal Care & Service | 0 (0.0%) | 0 (0.0%) |
| Total (Category) | 29 (76.3%) | 9 (23.7%) |
| Total (Overall) | 51 (42.5%) | 69 (57.5%) |
Sales and Office Occupations
The most common Sales and Office occupations in Matewan are Sales & Related (29 | 24.2%), and Office & Administration (18 | 15.0%).
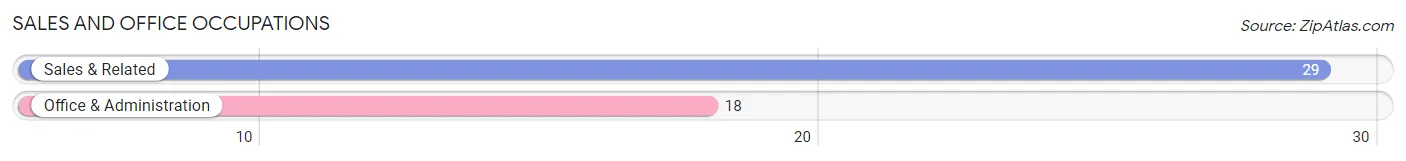
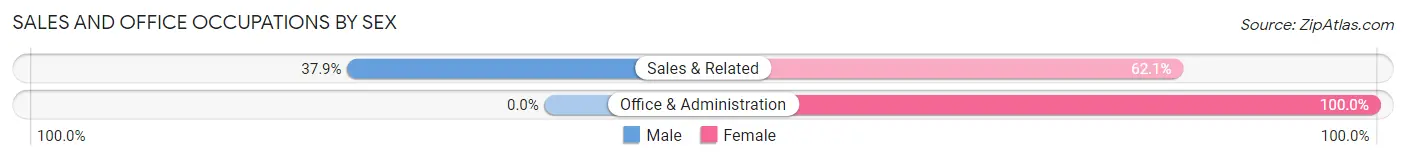
Sales and Office Occupations by Sex
| Occupation | Male | Female |
| Sales & Related | 11 (37.9%) | 18 (62.1%) |
| Office & Administration | 0 (0.0%) | 18 (100.0%) |
| Total (Category) | 11 (23.4%) | 36 (76.6%) |
| Total (Overall) | 51 (42.5%) | 69 (57.5%) |
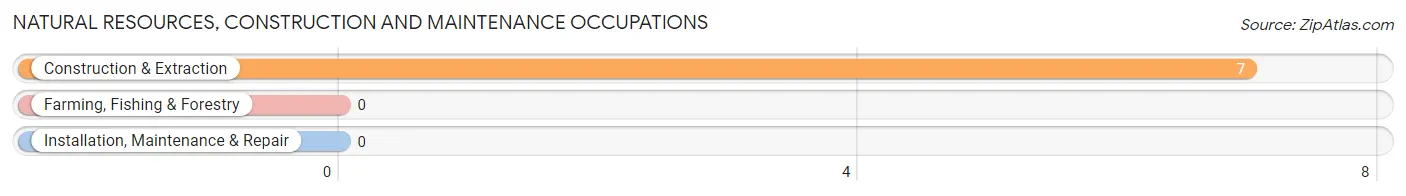
Natural Resources, Construction and Maintenance Occupations
The most common Natural Resources, Construction and Maintenance occupations in Matewan are , and Construction & Extraction (7 | 5.8%).
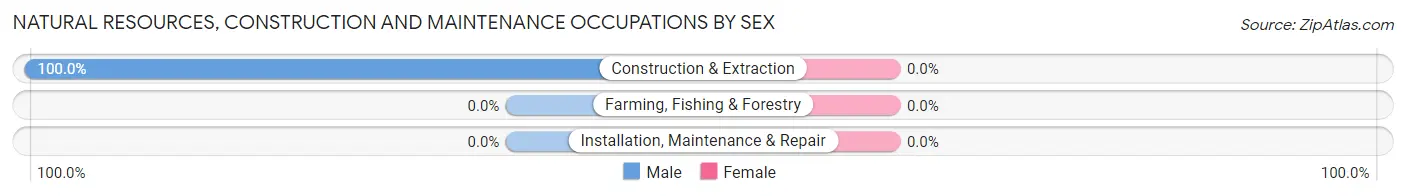
Natural Resources, Construction and Maintenance Occupations by Sex
| Occupation | Male | Female |
| Farming, Fishing & Forestry | 0 (0.0%) | 0 (0.0%) |
| Construction & Extraction | 7 (100.0%) | 0 (0.0%) |
| Installation, Maintenance & Repair | 0 (0.0%) | 0 (0.0%) |
| Total (Category) | 7 (100.0%) | 0 (0.0%) |
| Total (Overall) | 51 (42.5%) | 69 (57.5%) |
Production, Transportation and Moving Occupations
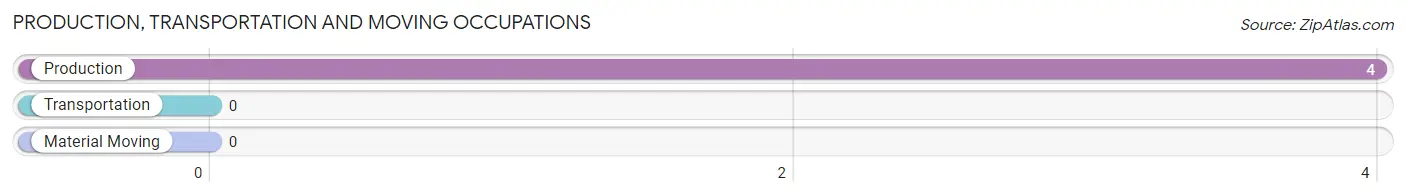
The most common Production, Transportation and Moving occupations in Matewan are , and Production (4 | 3.3%).
Production, Transportation and Moving Occupations by Sex
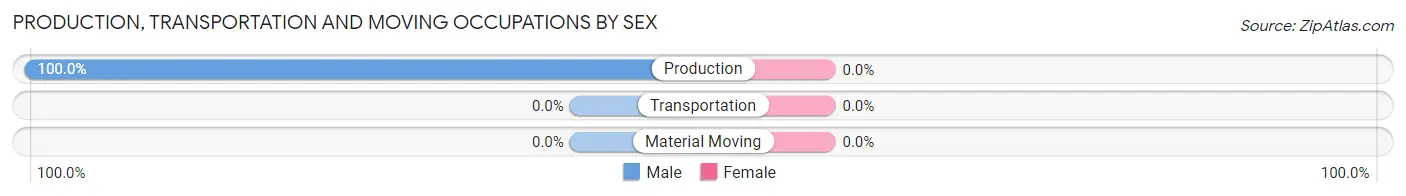
| Occupation | Male | Female |
| Production | 4 (100.0%) | 0 (0.0%) |
| Transportation | 0 (0.0%) | 0 (0.0%) |
| Material Moving | 0 (0.0%) | 0 (0.0%) |
| Total (Category) | 4 (100.0%) | 0 (0.0%) |
| Total (Overall) | 51 (42.5%) | 69 (57.5%) |
Employment Industries by Sex in Matewan
Employment Industries in Matewan
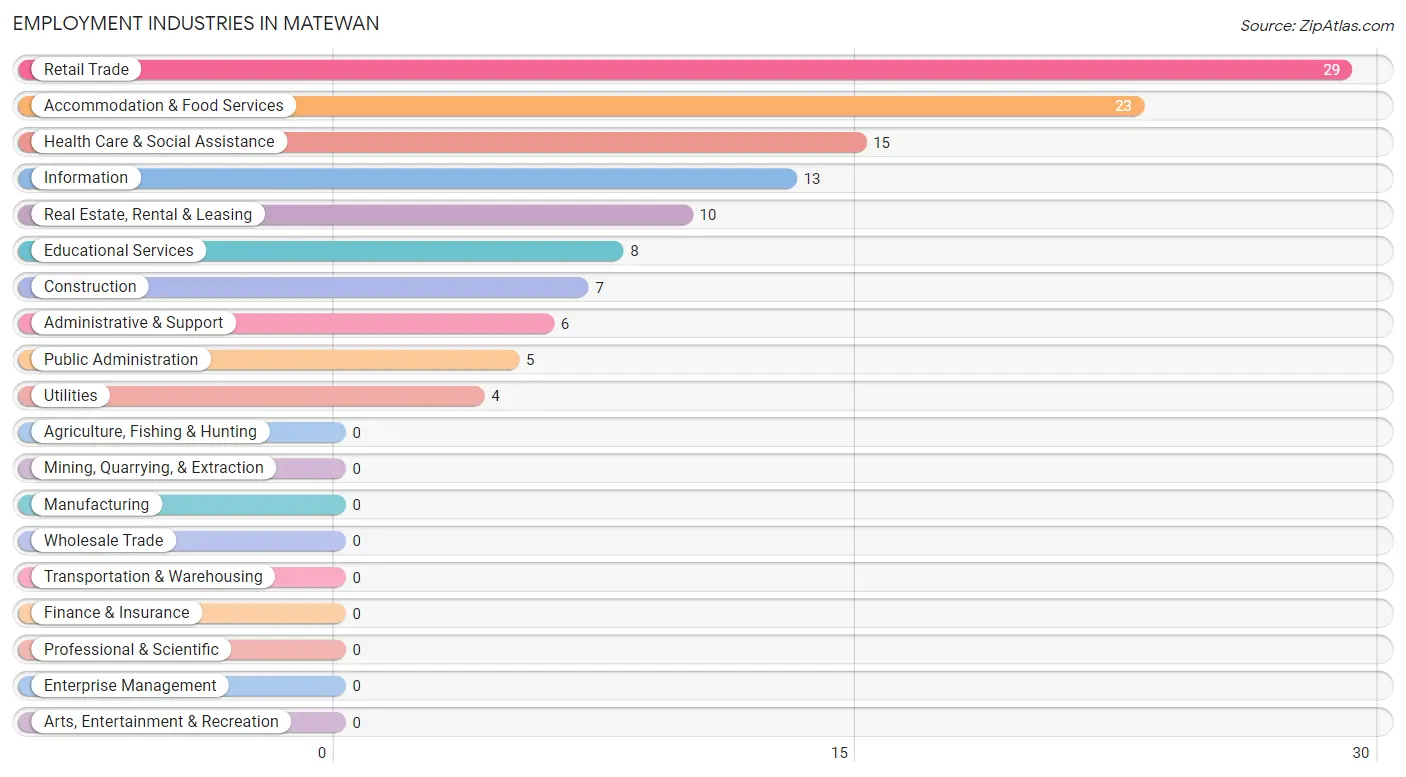
The major employment industries in Matewan include Retail Trade (29 | 24.2%), Accommodation & Food Services (23 | 19.2%), Health Care & Social Assistance (15 | 12.5%), Information (13 | 10.8%), and Real Estate, Rental & Leasing (10 | 8.3%).
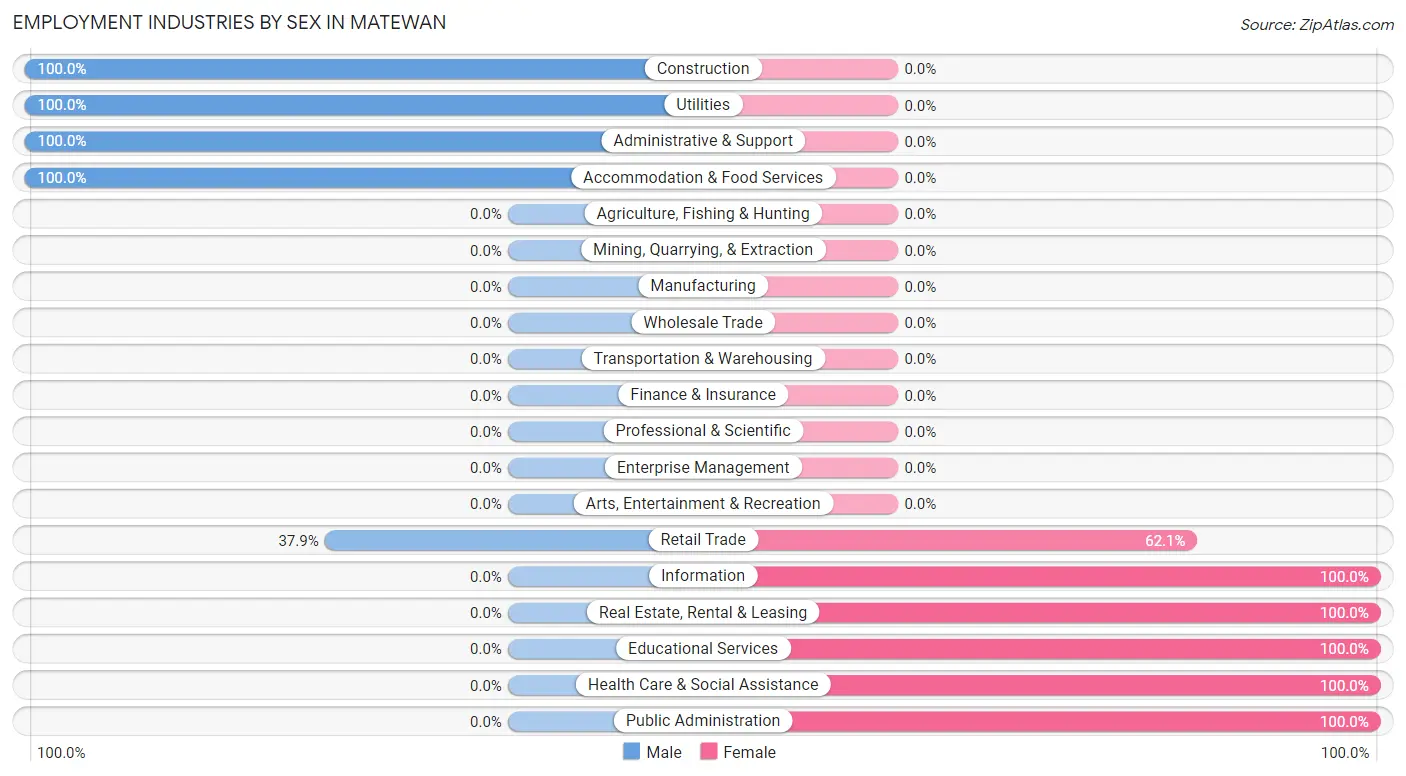
Employment Industries by Sex in Matewan
The Matewan industries that see more men than women are Construction (100.0%), Utilities (100.0%), and Administrative & Support (100.0%), whereas the industries that tend to have a higher number of women are Information (100.0%), Real Estate, Rental & Leasing (100.0%), and Educational Services (100.0%).
| Industry | Male | Female |
| Agriculture, Fishing & Hunting | 0 (0.0%) | 0 (0.0%) |
| Mining, Quarrying, & Extraction | 0 (0.0%) | 0 (0.0%) |
| Construction | 7 (100.0%) | 0 (0.0%) |
| Manufacturing | 0 (0.0%) | 0 (0.0%) |
| Wholesale Trade | 0 (0.0%) | 0 (0.0%) |
| Retail Trade | 11 (37.9%) | 18 (62.1%) |
| Transportation & Warehousing | 0 (0.0%) | 0 (0.0%) |
| Utilities | 4 (100.0%) | 0 (0.0%) |
| Information | 0 (0.0%) | 13 (100.0%) |
| Finance & Insurance | 0 (0.0%) | 0 (0.0%) |
| Real Estate, Rental & Leasing | 0 (0.0%) | 10 (100.0%) |
| Professional & Scientific | 0 (0.0%) | 0 (0.0%) |
| Enterprise Management | 0 (0.0%) | 0 (0.0%) |
| Administrative & Support | 6 (100.0%) | 0 (0.0%) |
| Educational Services | 0 (0.0%) | 8 (100.0%) |
| Health Care & Social Assistance | 0 (0.0%) | 15 (100.0%) |
| Arts, Entertainment & Recreation | 0 (0.0%) | 0 (0.0%) |
| Accommodation & Food Services | 23 (100.0%) | 0 (0.0%) |
| Public Administration | 0 (0.0%) | 5 (100.0%) |
| Total | 51 (42.5%) | 69 (57.5%) |
Education in Matewan
School Enrollment in Matewan
The most common levels of schooling among the 51 students in Matewan are middle school (16 | 31.4%), high school (14 | 27.5%), and elementary school (11 | 21.6%).
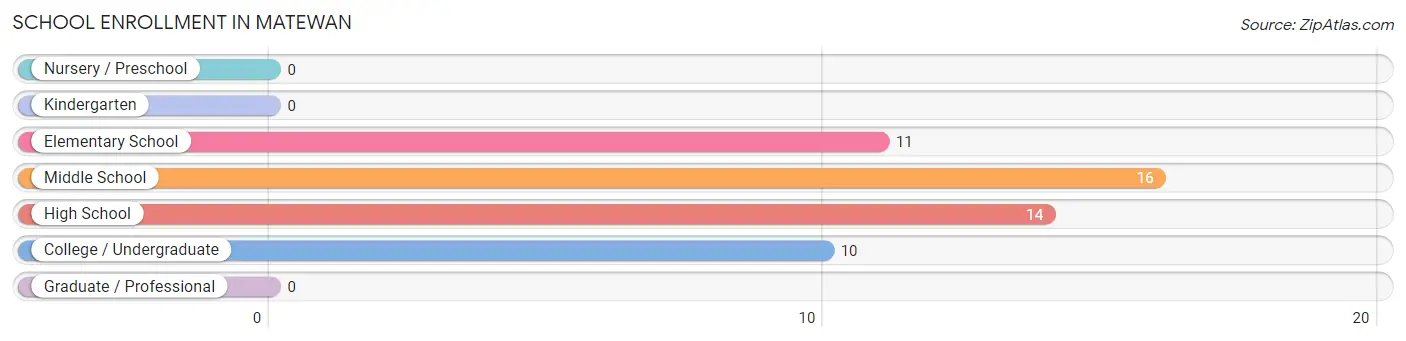
| School Level | # Students | % Students |
| Nursery / Preschool | 0 | 0.0% |
| Kindergarten | 0 | 0.0% |
| Elementary School | 11 | 21.6% |
| Middle School | 16 | 31.4% |
| High School | 14 | 27.5% |
| College / Undergraduate | 10 | 19.6% |
| Graduate / Professional | 0 | 0.0% |
| Total | 51 | 100.0% |
School Enrollment by Age by Funding Source in Matewan
Out of a total of 51 students who are enrolled in schools in Matewan, 3 (5.9%) attend a private institution, while the remaining 48 (94.1%) are enrolled in public schools. The age group of 20 to 24 year olds has the highest likelihood of being enrolled in private schools, with 3 (30.0% in the age bracket) enrolled. Conversely, the age group of 5 to 9 year old has the lowest likelihood of being enrolled in a private school, with 11 (100.0% in the age bracket) attending a public institution.
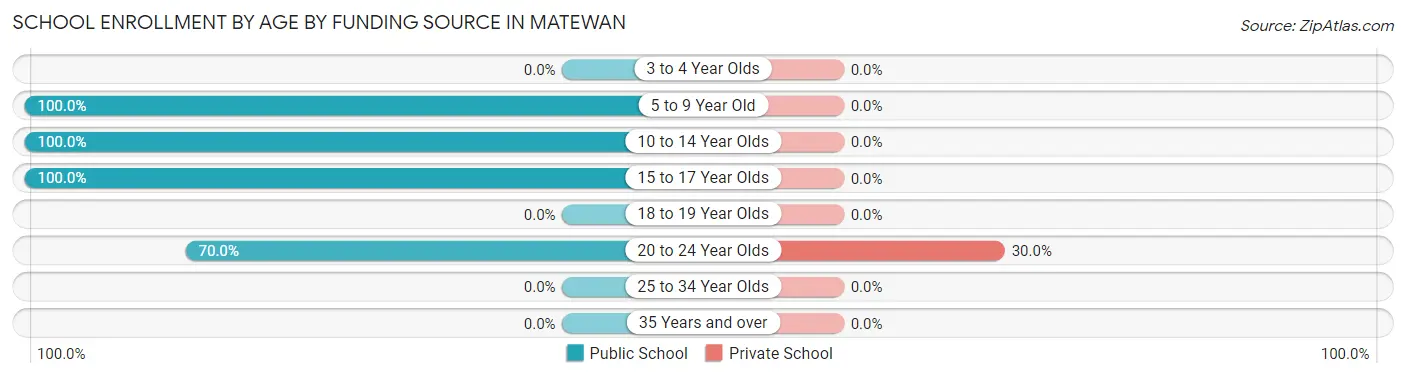
| Age Bracket | Public School | Private School |
| 3 to 4 Year Olds | 0 (0.0%) | 0 (0.0%) |
| 5 to 9 Year Old | 11 (100.0%) | 0 (0.0%) |
| 10 to 14 Year Olds | 16 (100.0%) | 0 (0.0%) |
| 15 to 17 Year Olds | 14 (100.0%) | 0 (0.0%) |
| 18 to 19 Year Olds | 0 (0.0%) | 0 (0.0%) |
| 20 to 24 Year Olds | 7 (70.0%) | 3 (30.0%) |
| 25 to 34 Year Olds | 0 (0.0%) | 0 (0.0%) |
| 35 Years and over | 0 (0.0%) | 0 (0.0%) |
| Total | 48 (94.1%) | 3 (5.9%) |
Educational Attainment by Field of Study in Matewan
Business (12 | 66.7%), and science & technology (6 | 33.3%) are the most common fields of study among 18 individuals in Matewan who have obtained a bachelor's degree or higher.
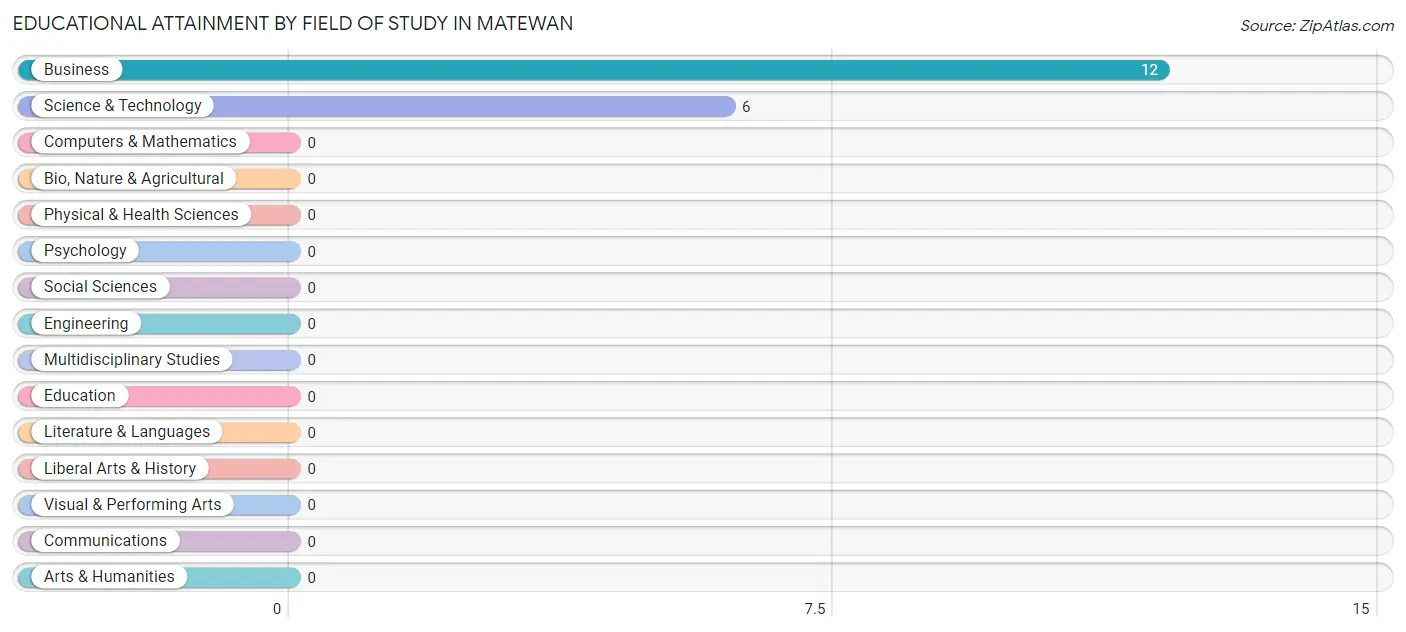
| Field of Study | # Graduates | % Graduates |
| Computers & Mathematics | 0 | 0.0% |
| Bio, Nature & Agricultural | 0 | 0.0% |
| Physical & Health Sciences | 0 | 0.0% |
| Psychology | 0 | 0.0% |
| Social Sciences | 0 | 0.0% |
| Engineering | 0 | 0.0% |
| Multidisciplinary Studies | 0 | 0.0% |
| Science & Technology | 6 | 33.3% |
| Business | 12 | 66.7% |
| Education | 0 | 0.0% |
| Literature & Languages | 0 | 0.0% |
| Liberal Arts & History | 0 | 0.0% |
| Visual & Performing Arts | 0 | 0.0% |
| Communications | 0 | 0.0% |
| Arts & Humanities | 0 | 0.0% |
| Total | 18 | 100.0% |
Transportation & Commute in Matewan
Vehicle Availability by Sex in Matewan
The most prevalent vehicle ownership categories in Matewan are males with 2 vehicles (51, accounting for 100.0%) and females with 2 vehicles (38, making up 73.9%).
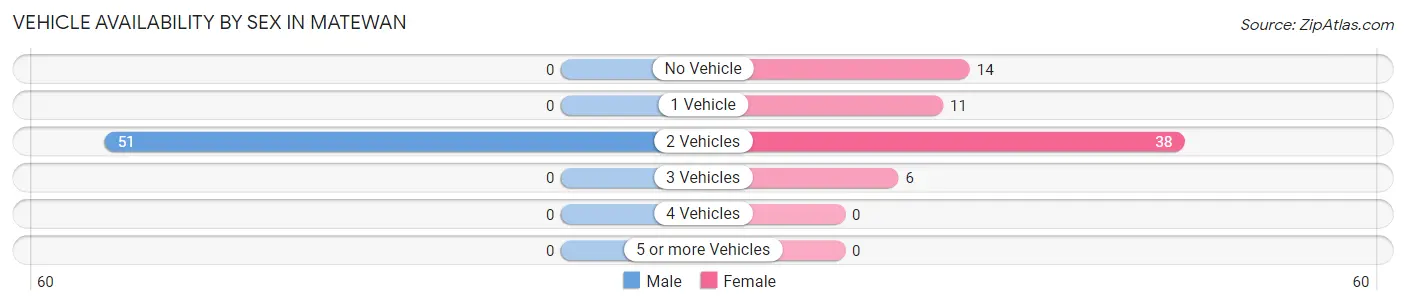
| Vehicles Available | Male | Female |
| No Vehicle | 0 (0.0%) | 14 (20.3%) |
| 1 Vehicle | 0 (0.0%) | 11 (15.9%) |
| 2 Vehicles | 51 (100.0%) | 38 (55.1%) |
| 3 Vehicles | 0 (0.0%) | 6 (8.7%) |
| 4 Vehicles | 0 (0.0%) | 0 (0.0%) |
| 5 or more Vehicles | 0 (0.0%) | 0 (0.0%) |
| Total | 51 (100.0%) | 69 (100.0%) |
Commute Time in Matewan
The most frequently occuring commute durations in Matewan are less than 5 minutes (62 commuters, 51.7%), 5 to 9 minutes (14 commuters, 11.7%), and 30 to 34 minutes (13 commuters, 10.8%).
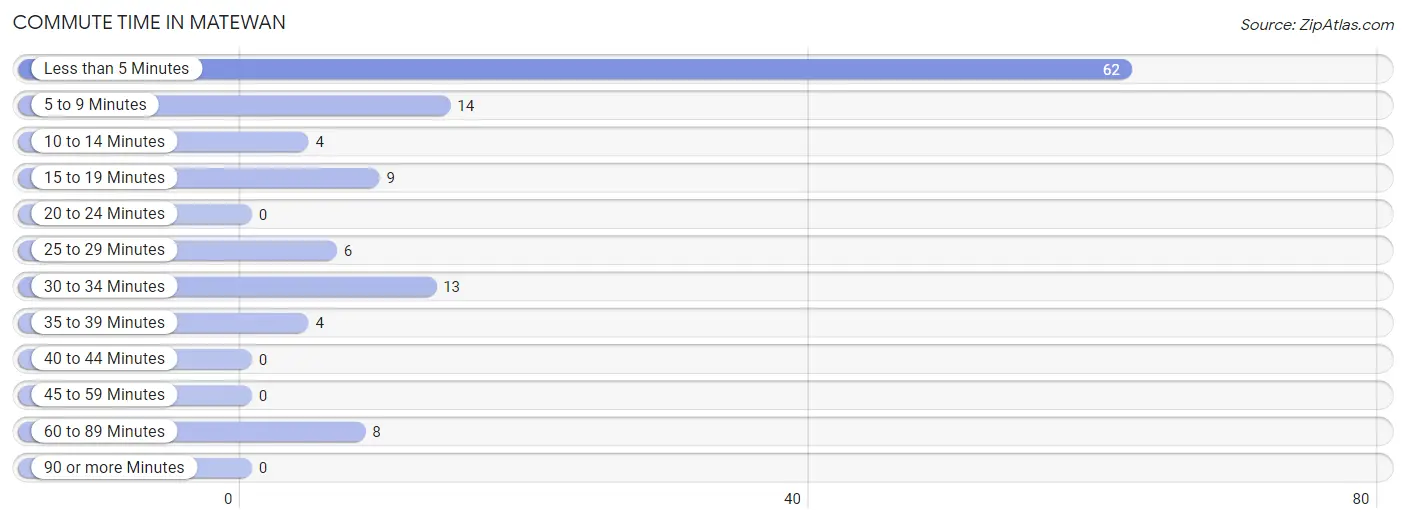
| Commute Time | # Commuters | % Commuters |
| Less than 5 Minutes | 62 | 51.7% |
| 5 to 9 Minutes | 14 | 11.7% |
| 10 to 14 Minutes | 4 | 3.3% |
| 15 to 19 Minutes | 9 | 7.5% |
| 20 to 24 Minutes | 0 | 0.0% |
| 25 to 29 Minutes | 6 | 5.0% |
| 30 to 34 Minutes | 13 | 10.8% |
| 35 to 39 Minutes | 4 | 3.3% |
| 40 to 44 Minutes | 0 | 0.0% |
| 45 to 59 Minutes | 0 | 0.0% |
| 60 to 89 Minutes | 8 | 6.7% |
| 90 or more Minutes | 0 | 0.0% |
Commute Time by Sex in Matewan
The most common commute times in Matewan are less than 5 minutes (23 commuters, 45.1%) for males and less than 5 minutes (39 commuters, 56.5%) for females.
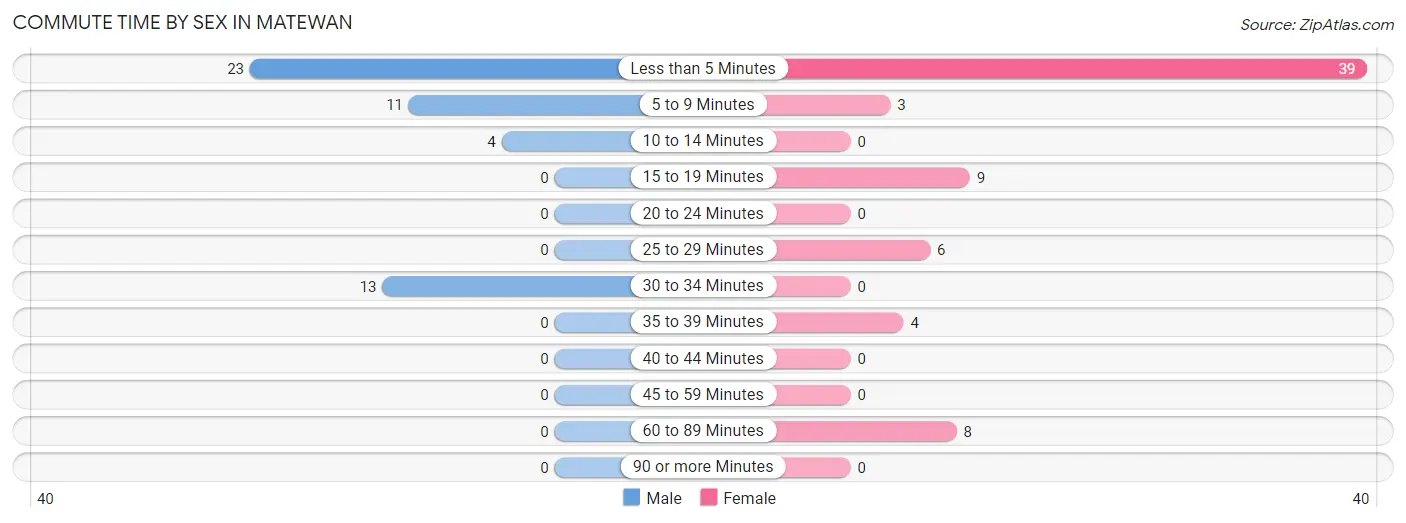
| Commute Time | Male | Female |
| Less than 5 Minutes | 23 (45.1%) | 39 (56.5%) |
| 5 to 9 Minutes | 11 (21.6%) | 3 (4.3%) |
| 10 to 14 Minutes | 4 (7.8%) | 0 (0.0%) |
| 15 to 19 Minutes | 0 (0.0%) | 9 (13.0%) |
| 20 to 24 Minutes | 0 (0.0%) | 0 (0.0%) |
| 25 to 29 Minutes | 0 (0.0%) | 6 (8.7%) |
| 30 to 34 Minutes | 13 (25.5%) | 0 (0.0%) |
| 35 to 39 Minutes | 0 (0.0%) | 4 (5.8%) |
| 40 to 44 Minutes | 0 (0.0%) | 0 (0.0%) |
| 45 to 59 Minutes | 0 (0.0%) | 0 (0.0%) |
| 60 to 89 Minutes | 0 (0.0%) | 8 (11.6%) |
| 90 or more Minutes | 0 (0.0%) | 0 (0.0%) |
Time of Departure to Work by Sex in Matewan
The most frequent times of departure to work in Matewan are 8:30 AM to 8:59 AM (23, 45.1%) for males and 6:30 AM to 6:59 AM (18, 26.1%) for females.
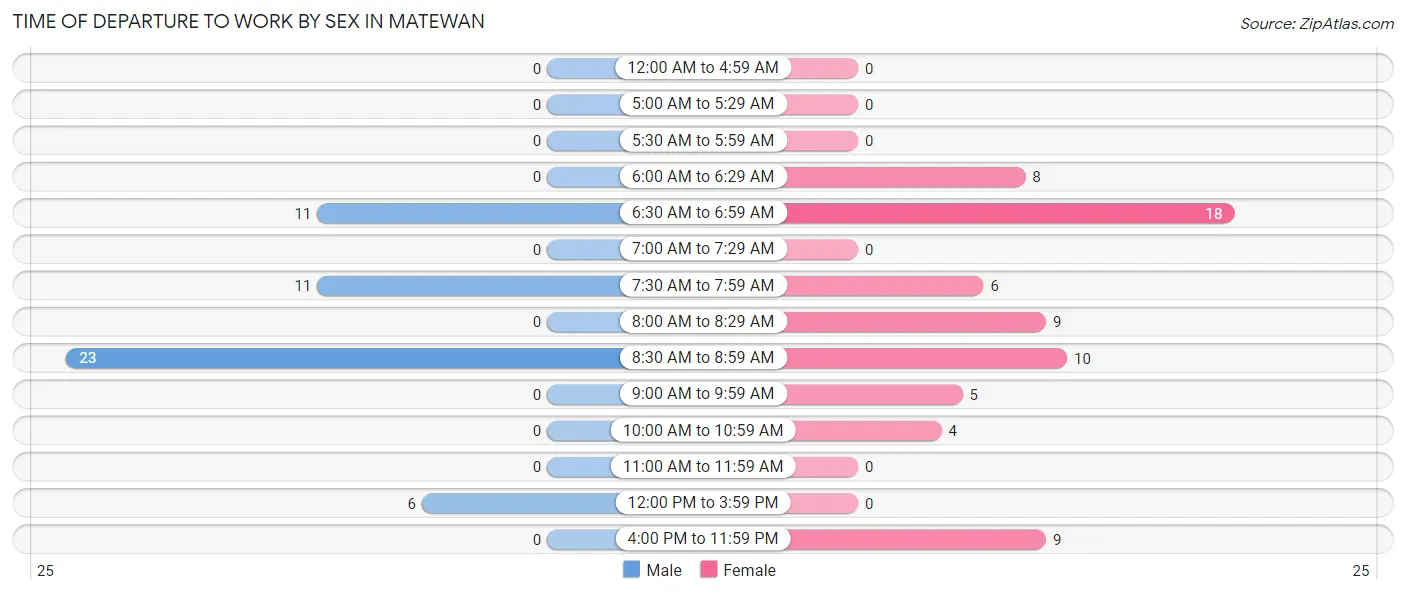
| Time of Departure | Male | Female |
| 12:00 AM to 4:59 AM | 0 (0.0%) | 0 (0.0%) |
| 5:00 AM to 5:29 AM | 0 (0.0%) | 0 (0.0%) |
| 5:30 AM to 5:59 AM | 0 (0.0%) | 0 (0.0%) |
| 6:00 AM to 6:29 AM | 0 (0.0%) | 8 (11.6%) |
| 6:30 AM to 6:59 AM | 11 (21.6%) | 18 (26.1%) |
| 7:00 AM to 7:29 AM | 0 (0.0%) | 0 (0.0%) |
| 7:30 AM to 7:59 AM | 11 (21.6%) | 6 (8.7%) |
| 8:00 AM to 8:29 AM | 0 (0.0%) | 9 (13.0%) |
| 8:30 AM to 8:59 AM | 23 (45.1%) | 10 (14.5%) |
| 9:00 AM to 9:59 AM | 0 (0.0%) | 5 (7.2%) |
| 10:00 AM to 10:59 AM | 0 (0.0%) | 4 (5.8%) |
| 11:00 AM to 11:59 AM | 0 (0.0%) | 0 (0.0%) |
| 12:00 PM to 3:59 PM | 6 (11.8%) | 0 (0.0%) |
| 4:00 PM to 11:59 PM | 0 (0.0%) | 9 (13.0%) |
| Total | 51 (100.0%) | 69 (100.0%) |
Housing Occupancy in Matewan
Occupancy by Ownership in Matewan
Of the total 283 dwellings in Matewan, owner-occupied units account for 112 (39.6%), while renter-occupied units make up 171 (60.4%).
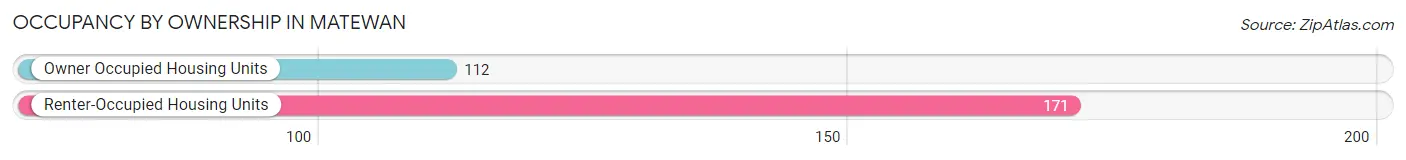
| Occupancy | # Housing Units | % Housing Units |
| Owner Occupied Housing Units | 112 | 39.6% |
| Renter-Occupied Housing Units | 171 | 60.4% |
| Total Occupied Housing Units | 283 | 100.0% |
Occupancy by Household Size in Matewan
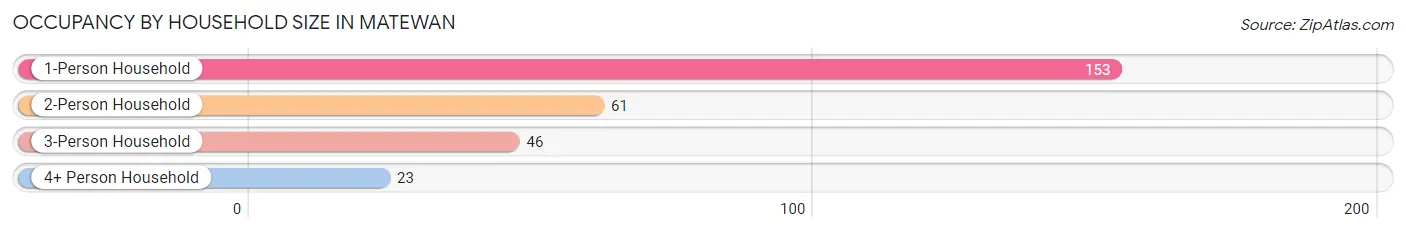
| Household Size | # Housing Units | % Housing Units |
| 1-Person Household | 153 | 54.1% |
| 2-Person Household | 61 | 21.5% |
| 3-Person Household | 46 | 16.3% |
| 4+ Person Household | 23 | 8.1% |
| Total Housing Units | 283 | 100.0% |
Occupancy by Ownership by Household Size in Matewan
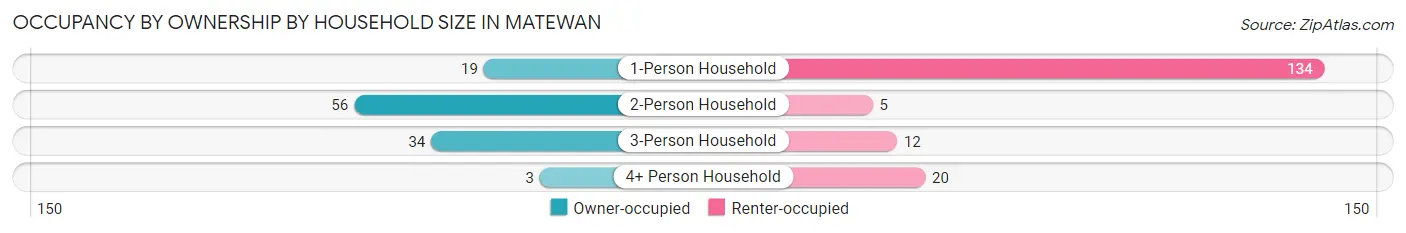
| Household Size | Owner-occupied | Renter-occupied |
| 1-Person Household | 19 (12.4%) | 134 (87.6%) |
| 2-Person Household | 56 (91.8%) | 5 (8.2%) |
| 3-Person Household | 34 (73.9%) | 12 (26.1%) |
| 4+ Person Household | 3 (13.0%) | 20 (87.0%) |
| Total Housing Units | 112 (39.6%) | 171 (60.4%) |
Occupancy by Educational Attainment in Matewan
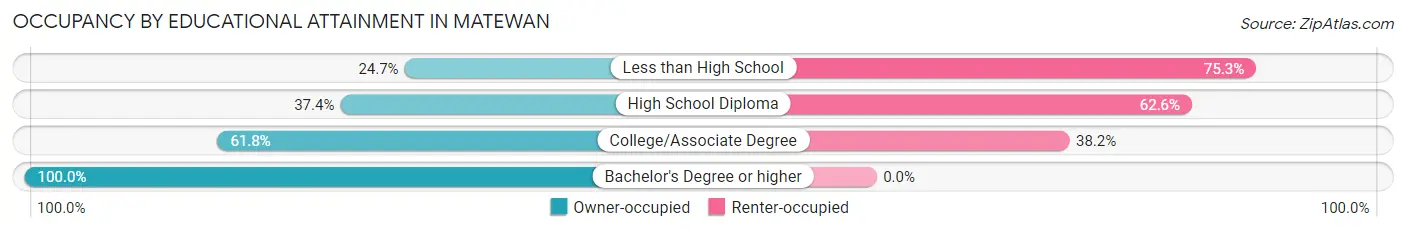
| Household Size | Owner-occupied | Renter-occupied |
| Less than High School | 20 (24.7%) | 61 (75.3%) |
| High School Diploma | 58 (37.4%) | 97 (62.6%) |
| College/Associate Degree | 21 (61.8%) | 13 (38.2%) |
| Bachelor's Degree or higher | 13 (100.0%) | 0 (0.0%) |
Occupancy by Age of Householder in Matewan
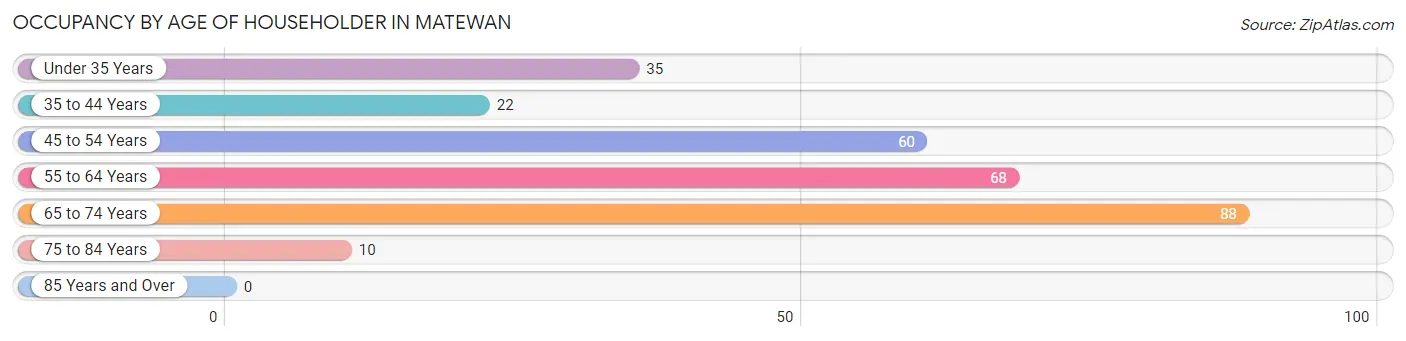
| Age Bracket | # Households | % Households |
| Under 35 Years | 35 | 12.4% |
| 35 to 44 Years | 22 | 7.8% |
| 45 to 54 Years | 60 | 21.2% |
| 55 to 64 Years | 68 | 24.0% |
| 65 to 74 Years | 88 | 31.1% |
| 75 to 84 Years | 10 | 3.5% |
| 85 Years and Over | 0 | 0.0% |
| Total | 283 | 100.0% |
Housing Finances in Matewan
Median Income by Occupancy in Matewan
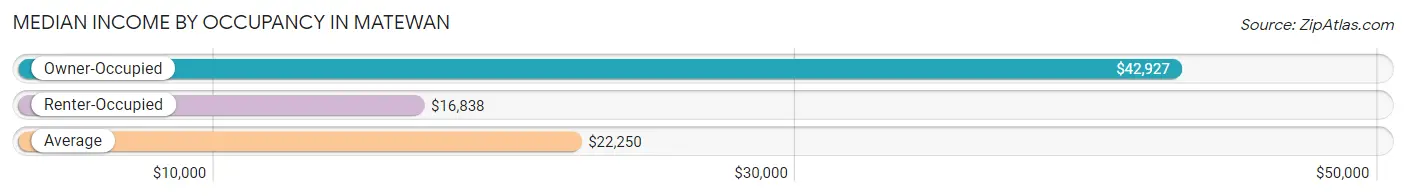
| Occupancy Type | # Households | Median Income |
| Owner-Occupied | 112 (39.6%) | $42,927 |
| Renter-Occupied | 171 (60.4%) | $16,838 |
| Average | 283 (100.0%) | $22,250 |
Occupancy by Householder Income Bracket in Matewan
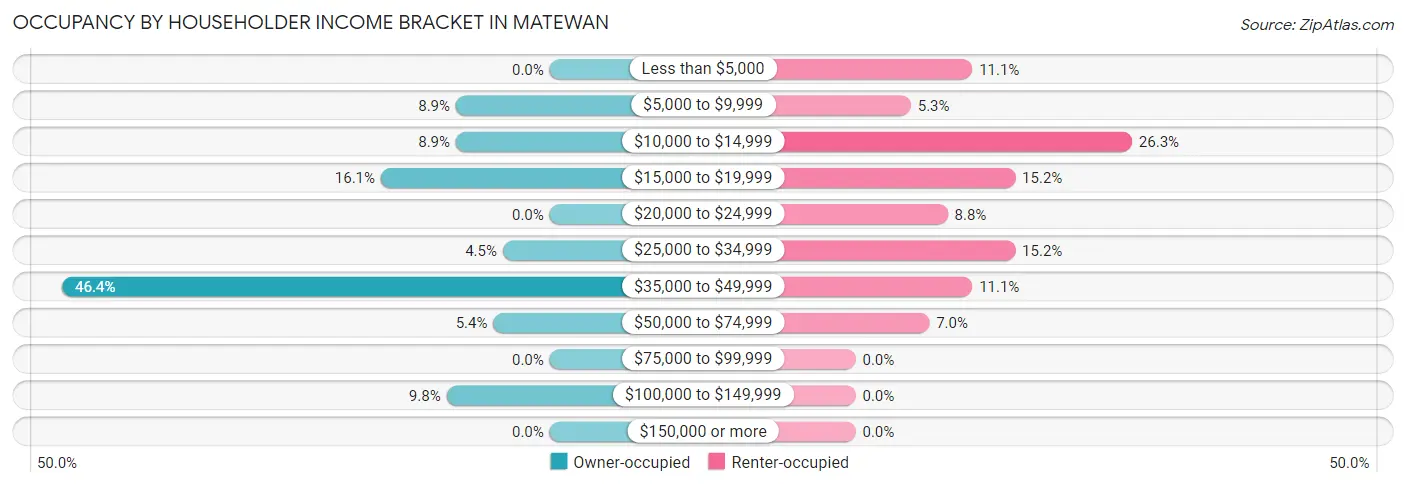
| Income Bracket | Owner-occupied | Renter-occupied |
| Less than $5,000 | 0 (0.0%) | 19 (11.1%) |
| $5,000 to $9,999 | 10 (8.9%) | 9 (5.3%) |
| $10,000 to $14,999 | 10 (8.9%) | 45 (26.3%) |
| $15,000 to $19,999 | 18 (16.1%) | 26 (15.2%) |
| $20,000 to $24,999 | 0 (0.0%) | 15 (8.8%) |
| $25,000 to $34,999 | 5 (4.5%) | 26 (15.2%) |
| $35,000 to $49,999 | 52 (46.4%) | 19 (11.1%) |
| $50,000 to $74,999 | 6 (5.4%) | 12 (7.0%) |
| $75,000 to $99,999 | 0 (0.0%) | 0 (0.0%) |
| $100,000 to $149,999 | 11 (9.8%) | 0 (0.0%) |
| $150,000 or more | 0 (0.0%) | 0 (0.0%) |
| Total | 112 (100.0%) | 171 (100.0%) |
Monthly Housing Cost Tiers in Matewan
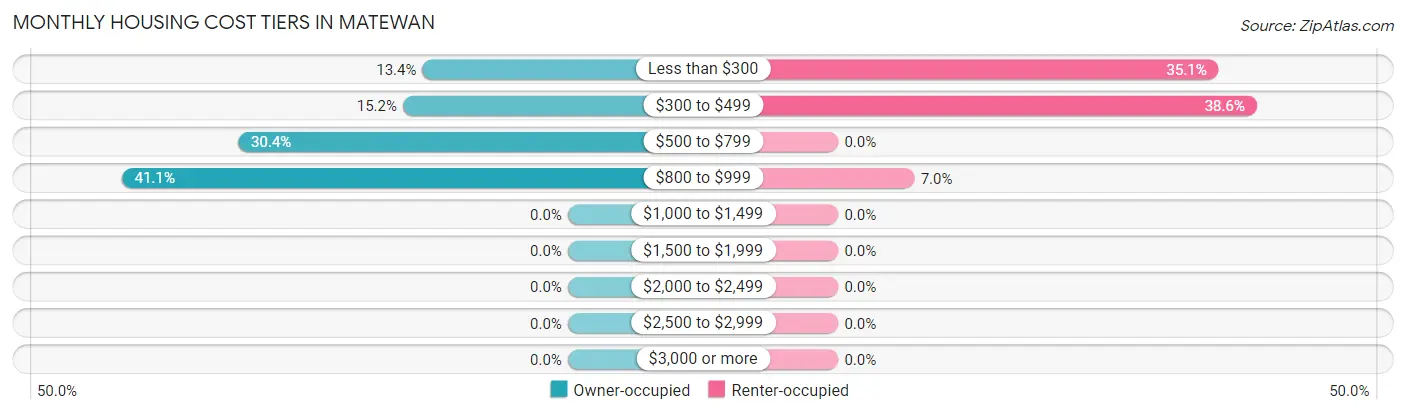
| Monthly Cost | Owner-occupied | Renter-occupied |
| Less than $300 | 15 (13.4%) | 60 (35.1%) |
| $300 to $499 | 17 (15.2%) | 66 (38.6%) |
| $500 to $799 | 34 (30.4%) | 0 (0.0%) |
| $800 to $999 | 46 (41.1%) | 12 (7.0%) |
| $1,000 to $1,499 | 0 (0.0%) | 0 (0.0%) |
| $1,500 to $1,999 | 0 (0.0%) | 0 (0.0%) |
| $2,000 to $2,499 | 0 (0.0%) | 0 (0.0%) |
| $2,500 to $2,999 | 0 (0.0%) | 0 (0.0%) |
| $3,000 or more | 0 (0.0%) | 0 (0.0%) |
| Total | 112 (100.0%) | 171 (100.0%) |
Physical Housing Characteristics in Matewan
Housing Structures in Matewan
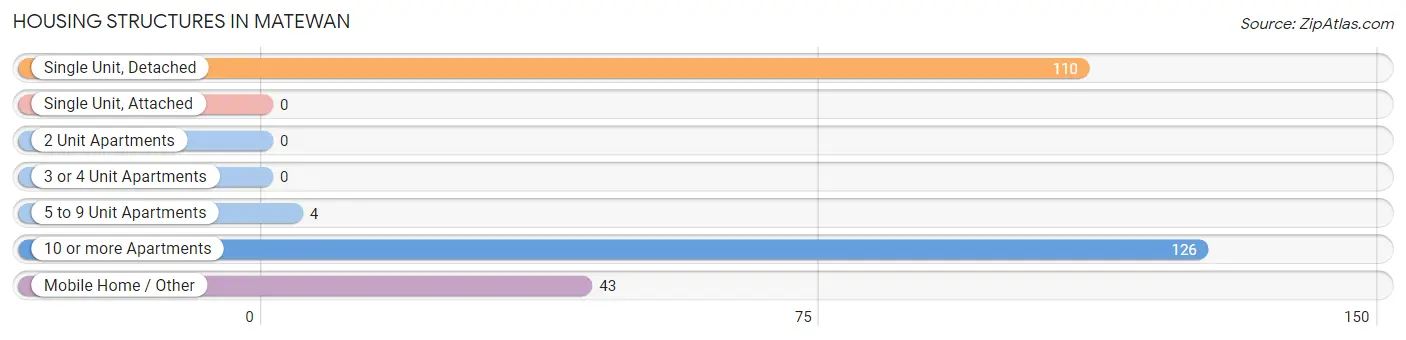
| Structure Type | # Housing Units | % Housing Units |
| Single Unit, Detached | 110 | 38.9% |
| Single Unit, Attached | 0 | 0.0% |
| 2 Unit Apartments | 0 | 0.0% |
| 3 or 4 Unit Apartments | 0 | 0.0% |
| 5 to 9 Unit Apartments | 4 | 1.4% |
| 10 or more Apartments | 126 | 44.5% |
| Mobile Home / Other | 43 | 15.2% |
| Total | 283 | 100.0% |
Housing Structures by Occupancy in Matewan
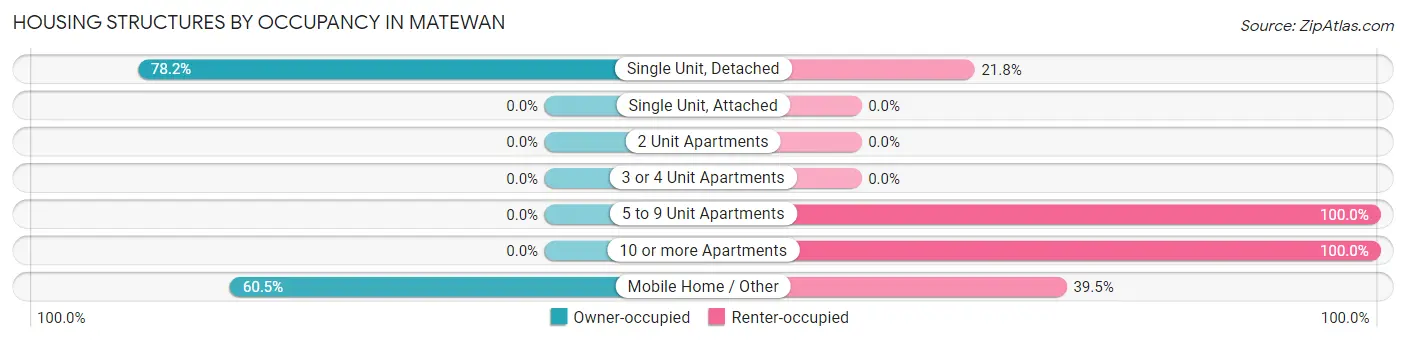
| Structure Type | Owner-occupied | Renter-occupied |
| Single Unit, Detached | 86 (78.2%) | 24 (21.8%) |
| Single Unit, Attached | 0 (0.0%) | 0 (0.0%) |
| 2 Unit Apartments | 0 (0.0%) | 0 (0.0%) |
| 3 or 4 Unit Apartments | 0 (0.0%) | 0 (0.0%) |
| 5 to 9 Unit Apartments | 0 (0.0%) | 4 (100.0%) |
| 10 or more Apartments | 0 (0.0%) | 126 (100.0%) |
| Mobile Home / Other | 26 (60.5%) | 17 (39.5%) |
| Total | 112 (39.6%) | 171 (60.4%) |
Housing Structures by Number of Rooms in Matewan
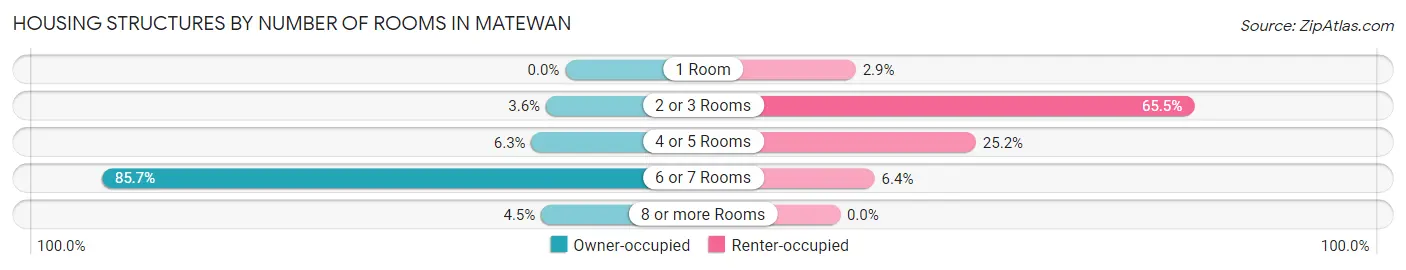
| Number of Rooms | Owner-occupied | Renter-occupied |
| 1 Room | 0 (0.0%) | 5 (2.9%) |
| 2 or 3 Rooms | 4 (3.6%) | 112 (65.5%) |
| 4 or 5 Rooms | 7 (6.2%) | 43 (25.2%) |
| 6 or 7 Rooms | 96 (85.7%) | 11 (6.4%) |
| 8 or more Rooms | 5 (4.5%) | 0 (0.0%) |
| Total | 112 (100.0%) | 171 (100.0%) |
Housing Structure by Heating Type in Matewan
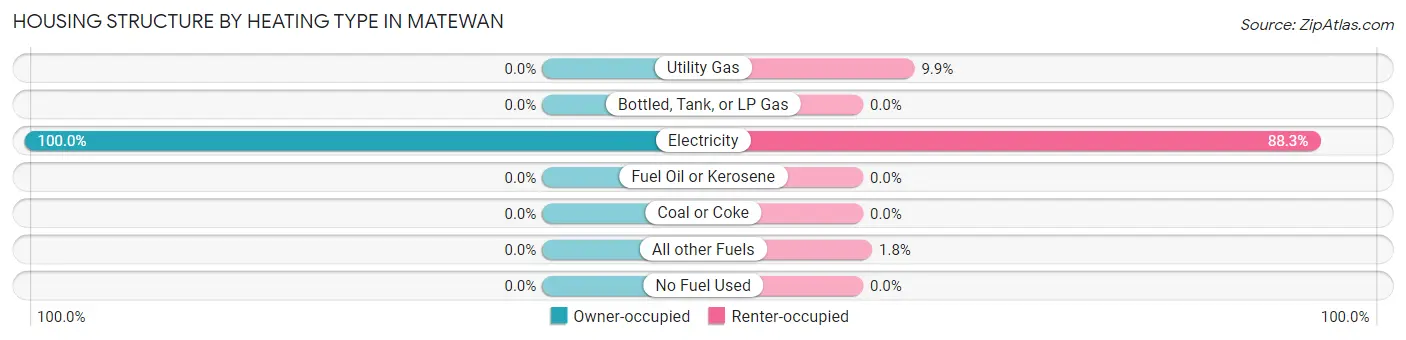
| Heating Type | Owner-occupied | Renter-occupied |
| Utility Gas | 0 (0.0%) | 17 (9.9%) |
| Bottled, Tank, or LP Gas | 0 (0.0%) | 0 (0.0%) |
| Electricity | 112 (100.0%) | 151 (88.3%) |
| Fuel Oil or Kerosene | 0 (0.0%) | 0 (0.0%) |
| Coal or Coke | 0 (0.0%) | 0 (0.0%) |
| All other Fuels | 0 (0.0%) | 3 (1.8%) |
| No Fuel Used | 0 (0.0%) | 0 (0.0%) |
| Total | 112 (100.0%) | 171 (100.0%) |
Household Vehicle Usage in Matewan
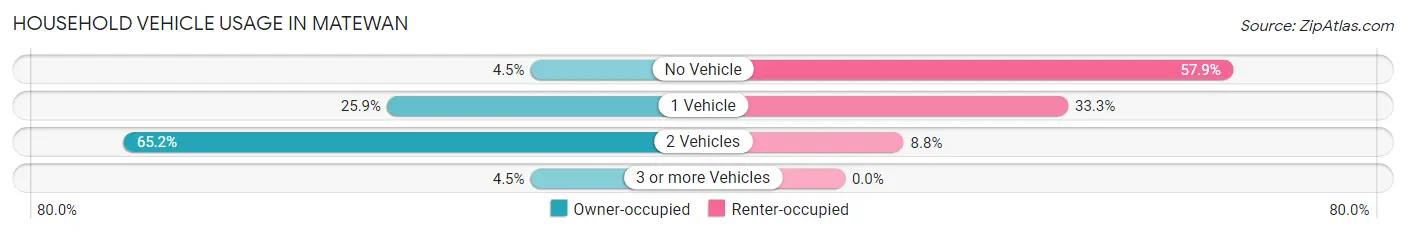
| Vehicles per Household | Owner-occupied | Renter-occupied |
| No Vehicle | 5 (4.5%) | 99 (57.9%) |
| 1 Vehicle | 29 (25.9%) | 57 (33.3%) |
| 2 Vehicles | 73 (65.2%) | 15 (8.8%) |
| 3 or more Vehicles | 5 (4.5%) | 0 (0.0%) |
| Total | 112 (100.0%) | 171 (100.0%) |
Real Estate & Mortgages in Matewan
Real Estate and Mortgage Overview in Matewan
| Characteristic | Without Mortgage | With Mortgage |
| Housing Units | 66 | 46 |
| Median Property Value | $90,000 | $113,500 |
| Median Household Income | $43,167 | $0 |
| Monthly Housing Costs | $505 | $0 |
| Real Estate Taxes | $557 | $0 |
Property Value by Mortgage Status in Matewan
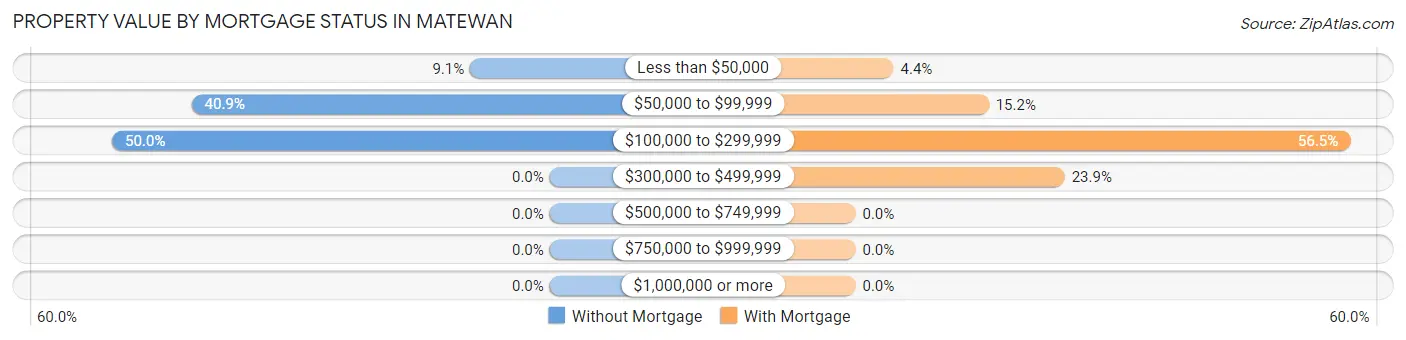
| Property Value | Without Mortgage | With Mortgage |
| Less than $50,000 | 6 (9.1%) | 2 (4.3%) |
| $50,000 to $99,999 | 27 (40.9%) | 7 (15.2%) |
| $100,000 to $299,999 | 33 (50.0%) | 26 (56.5%) |
| $300,000 to $499,999 | 0 (0.0%) | 11 (23.9%) |
| $500,000 to $749,999 | 0 (0.0%) | 0 (0.0%) |
| $750,000 to $999,999 | 0 (0.0%) | 0 (0.0%) |
| $1,000,000 or more | 0 (0.0%) | 0 (0.0%) |
| Total | 66 (100.0%) | 46 (100.0%) |
Household Income by Mortgage Status in Matewan
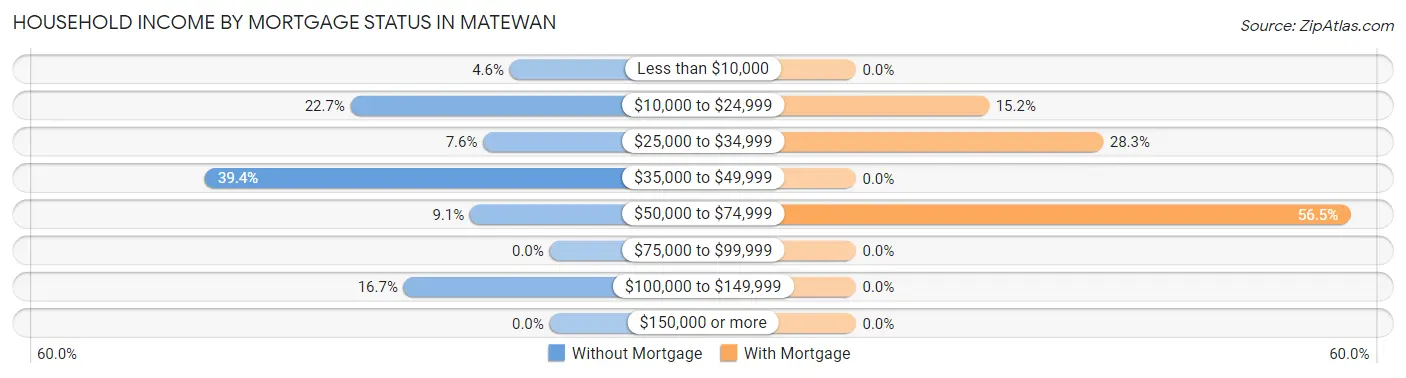
| Household Income | Without Mortgage | With Mortgage |
| Less than $10,000 | 3 (4.5%) | 0 (0.0%) |
| $10,000 to $24,999 | 15 (22.7%) | 7 (15.2%) |
| $25,000 to $34,999 | 5 (7.6%) | 13 (28.3%) |
| $35,000 to $49,999 | 26 (39.4%) | 0 (0.0%) |
| $50,000 to $74,999 | 6 (9.1%) | 26 (56.5%) |
| $75,000 to $99,999 | 0 (0.0%) | 0 (0.0%) |
| $100,000 to $149,999 | 11 (16.7%) | 0 (0.0%) |
| $150,000 or more | 0 (0.0%) | 0 (0.0%) |
| Total | 66 (100.0%) | 46 (100.0%) |
Property Value to Household Income Ratio in Matewan
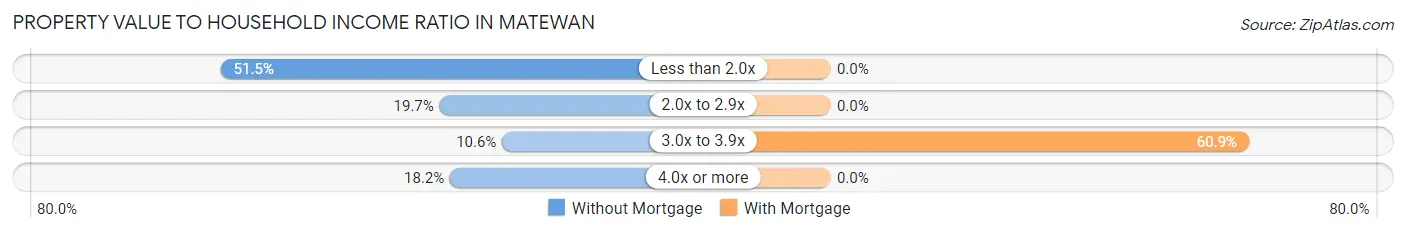
| Value-to-Income Ratio | Without Mortgage | With Mortgage |
| Less than 2.0x | 34 (51.5%) | 0 (0.0%) |
| 2.0x to 2.9x | 13 (19.7%) | 0 (0.0%) |
| 3.0x to 3.9x | 7 (10.6%) | 28 (60.9%) |
| 4.0x or more | 12 (18.2%) | 0 (0.0%) |
| Total | 66 (100.0%) | 46 (100.0%) |
Real Estate Taxes by Mortgage Status in Matewan
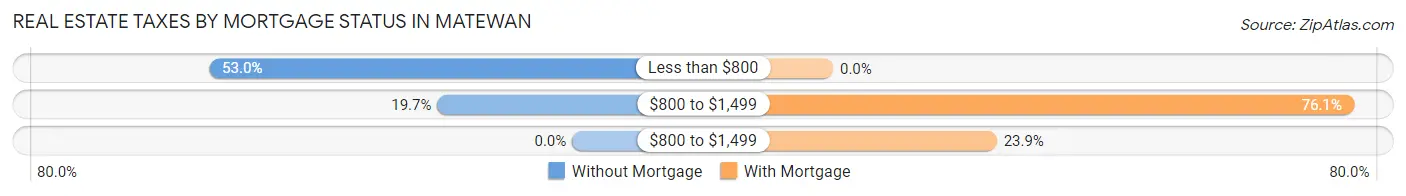
| Property Taxes | Without Mortgage | With Mortgage |
| Less than $800 | 35 (53.0%) | 0 (0.0%) |
| $800 to $1,499 | 13 (19.7%) | 35 (76.1%) |
| $800 to $1,499 | 0 (0.0%) | 11 (23.9%) |
| Total | 66 (100.0%) | 46 (100.0%) |
Health & Disability in Matewan
Health Insurance Coverage by Age in Matewan
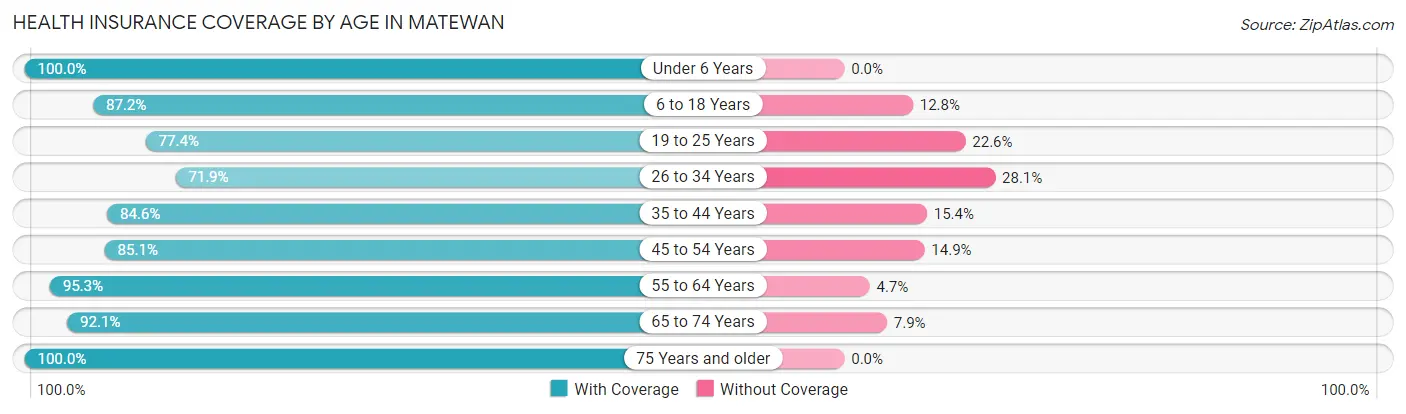
| Age Bracket | With Coverage | Without Coverage |
| Under 6 Years | 69 (100.0%) | 0 (0.0%) |
| 6 to 18 Years | 41 (87.2%) | 6 (12.8%) |
| 19 to 25 Years | 24 (77.4%) | 7 (22.6%) |
| 26 to 34 Years | 46 (71.9%) | 18 (28.1%) |
| 35 to 44 Years | 33 (84.6%) | 6 (15.4%) |
| 45 to 54 Years | 74 (85.1%) | 13 (14.9%) |
| 55 to 64 Years | 81 (95.3%) | 4 (4.7%) |
| 65 to 74 Years | 116 (92.1%) | 10 (7.9%) |
| 75 Years and older | 10 (100.0%) | 0 (0.0%) |
| Total | 494 (88.5%) | 64 (11.5%) |
Health Insurance Coverage by Citizenship Status in Matewan
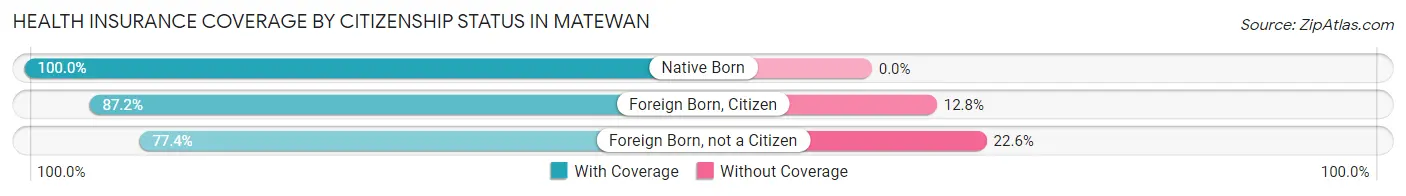
| Citizenship Status | With Coverage | Without Coverage |
| Native Born | 69 (100.0%) | 0 (0.0%) |
| Foreign Born, Citizen | 41 (87.2%) | 6 (12.8%) |
| Foreign Born, not a Citizen | 24 (77.4%) | 7 (22.6%) |
Health Insurance Coverage by Household Income in Matewan
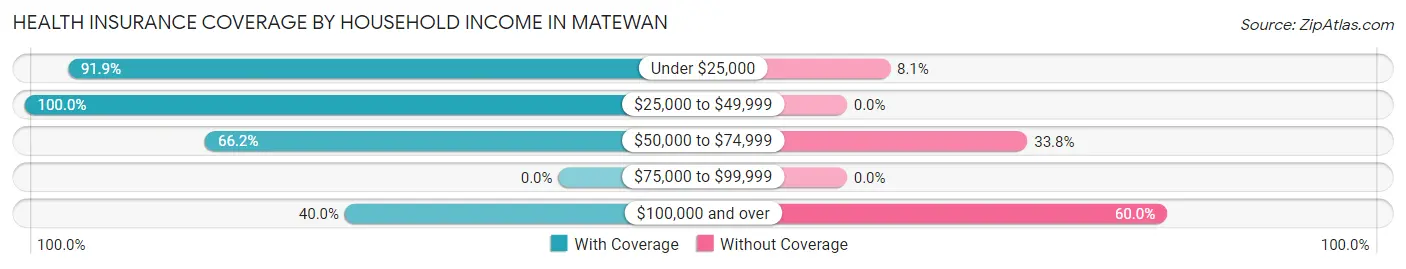
| Household Income | With Coverage | Without Coverage |
| Under $25,000 | 193 (91.9%) | 17 (8.1%) |
| $25,000 to $49,999 | 240 (100.0%) | 0 (0.0%) |
| $50,000 to $74,999 | 45 (66.2%) | 23 (33.8%) |
| $75,000 to $99,999 | 0 (0.0%) | 0 (0.0%) |
| $100,000 and over | 16 (40.0%) | 24 (60.0%) |
Public vs Private Health Insurance Coverage by Age in Matewan
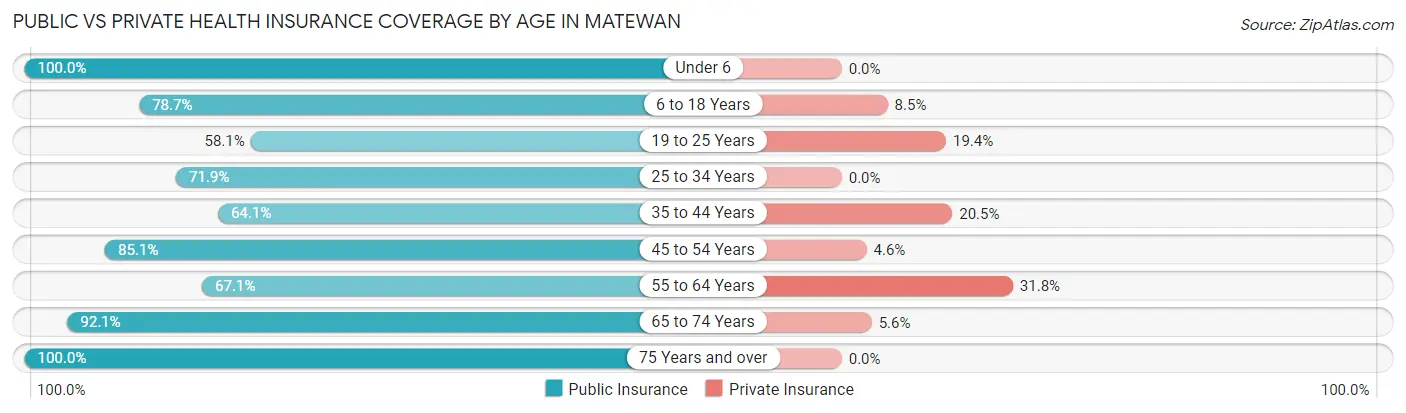
| Age Bracket | Public Insurance | Private Insurance |
| Under 6 | 69 (100.0%) | 0 (0.0%) |
| 6 to 18 Years | 37 (78.7%) | 4 (8.5%) |
| 19 to 25 Years | 18 (58.1%) | 6 (19.4%) |
| 25 to 34 Years | 46 (71.9%) | 0 (0.0%) |
| 35 to 44 Years | 25 (64.1%) | 8 (20.5%) |
| 45 to 54 Years | 74 (85.1%) | 4 (4.6%) |
| 55 to 64 Years | 57 (67.1%) | 27 (31.8%) |
| 65 to 74 Years | 116 (92.1%) | 7 (5.6%) |
| 75 Years and over | 10 (100.0%) | 0 (0.0%) |
| Total | 452 (81.0%) | 56 (10.0%) |
Disability Status by Sex by Age in Matewan
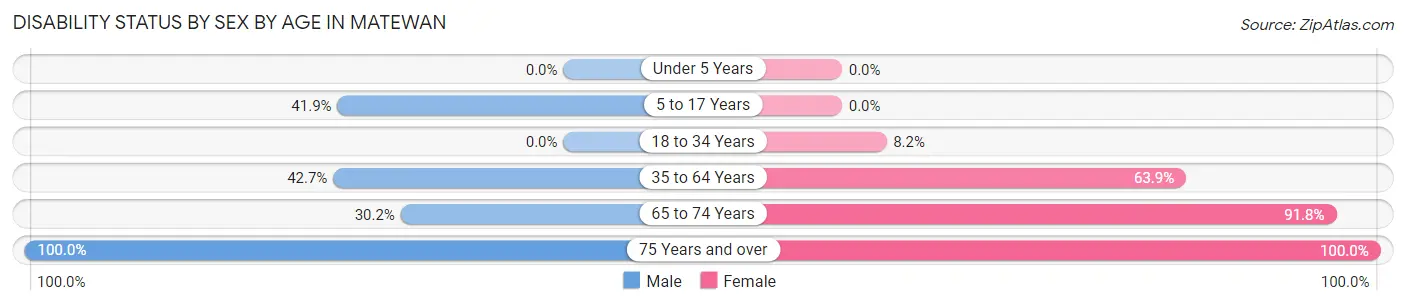
| Age Bracket | Male | Female |
| Under 5 Years | 0 (0.0%) | 0 (0.0%) |
| 5 to 17 Years | 13 (41.9%) | 0 (0.0%) |
| 18 to 34 Years | 0 (0.0%) | 7 (8.2%) |
| 35 to 64 Years | 44 (42.7%) | 69 (63.9%) |
| 65 to 74 Years | 16 (30.2%) | 67 (91.8%) |
| 75 Years and over | 5 (100.0%) | 5 (100.0%) |
Disability Class by Sex by Age in Matewan
Disability Class: Hearing Difficulty
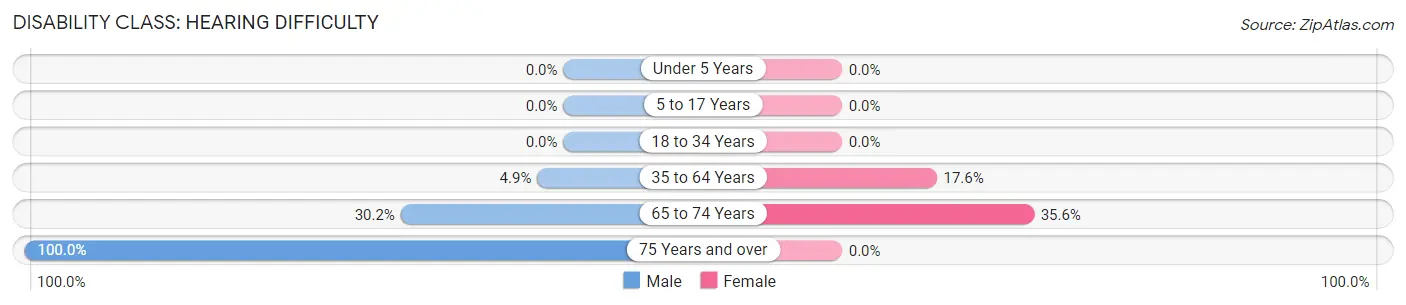
| Age Bracket | Male | Female |
| Under 5 Years | 0 (0.0%) | 0 (0.0%) |
| 5 to 17 Years | 0 (0.0%) | 0 (0.0%) |
| 18 to 34 Years | 0 (0.0%) | 0 (0.0%) |
| 35 to 64 Years | 5 (4.9%) | 19 (17.6%) |
| 65 to 74 Years | 16 (30.2%) | 26 (35.6%) |
| 75 Years and over | 5 (100.0%) | 0 (0.0%) |
Disability Class: Vision Difficulty
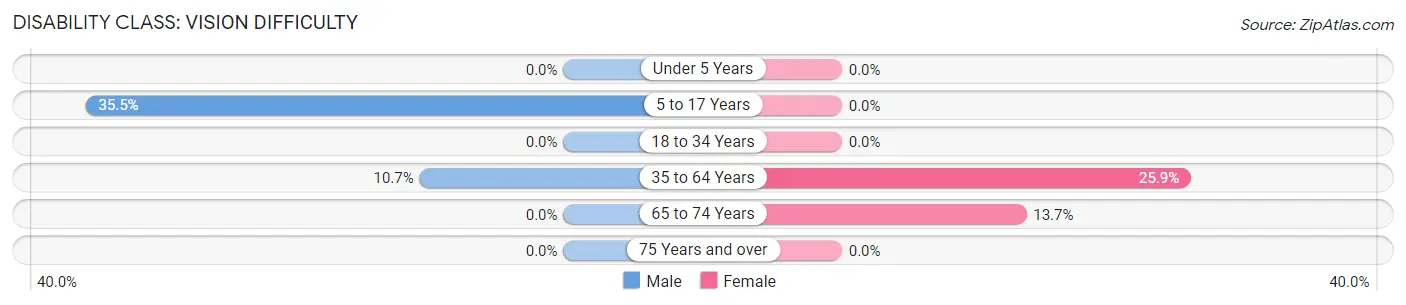
| Age Bracket | Male | Female |
| Under 5 Years | 0 (0.0%) | 0 (0.0%) |
| 5 to 17 Years | 11 (35.5%) | 0 (0.0%) |
| 18 to 34 Years | 0 (0.0%) | 0 (0.0%) |
| 35 to 64 Years | 11 (10.7%) | 28 (25.9%) |
| 65 to 74 Years | 0 (0.0%) | 10 (13.7%) |
| 75 Years and over | 0 (0.0%) | 0 (0.0%) |
Disability Class: Cognitive Difficulty
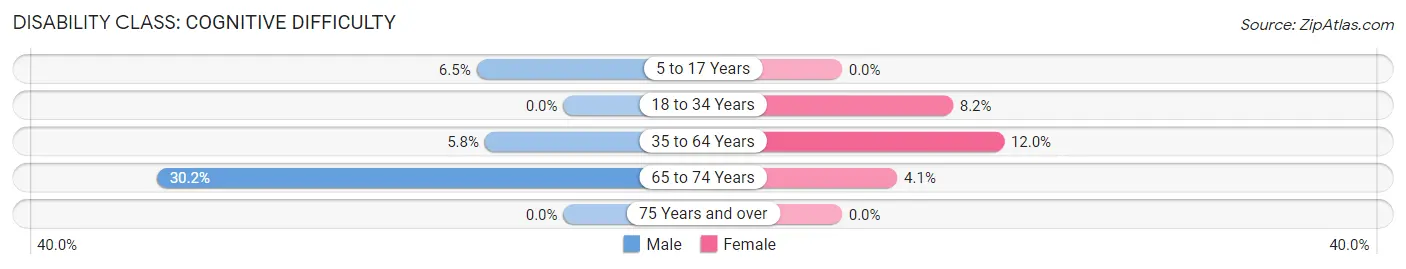
| Age Bracket | Male | Female |
| 5 to 17 Years | 2 (6.5%) | 0 (0.0%) |
| 18 to 34 Years | 0 (0.0%) | 7 (8.2%) |
| 35 to 64 Years | 6 (5.8%) | 13 (12.0%) |
| 65 to 74 Years | 16 (30.2%) | 3 (4.1%) |
| 75 Years and over | 0 (0.0%) | 0 (0.0%) |
Disability Class: Ambulatory Difficulty
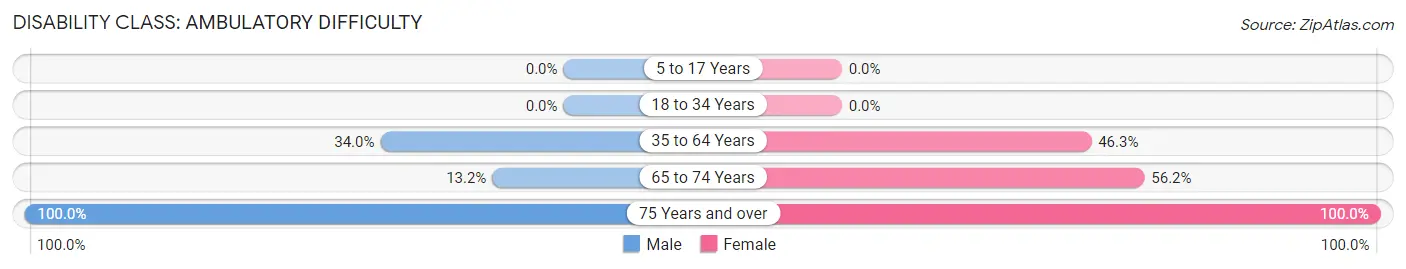
| Age Bracket | Male | Female |
| 5 to 17 Years | 0 (0.0%) | 0 (0.0%) |
| 18 to 34 Years | 0 (0.0%) | 0 (0.0%) |
| 35 to 64 Years | 35 (34.0%) | 50 (46.3%) |
| 65 to 74 Years | 7 (13.2%) | 41 (56.2%) |
| 75 Years and over | 5 (100.0%) | 5 (100.0%) |
Disability Class: Self-Care Difficulty
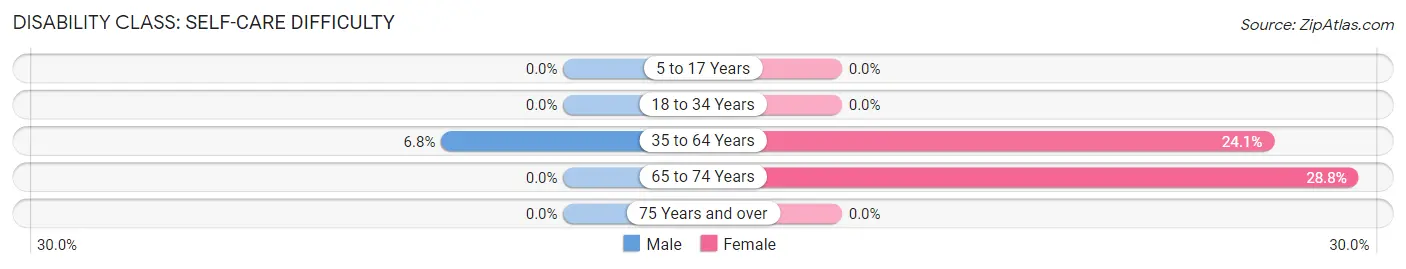
| Age Bracket | Male | Female |
| 5 to 17 Years | 0 (0.0%) | 0 (0.0%) |
| 18 to 34 Years | 0 (0.0%) | 0 (0.0%) |
| 35 to 64 Years | 7 (6.8%) | 26 (24.1%) |
| 65 to 74 Years | 0 (0.0%) | 21 (28.8%) |
| 75 Years and over | 0 (0.0%) | 0 (0.0%) |
Technology Access in Matewan
Computing Device Access in Matewan
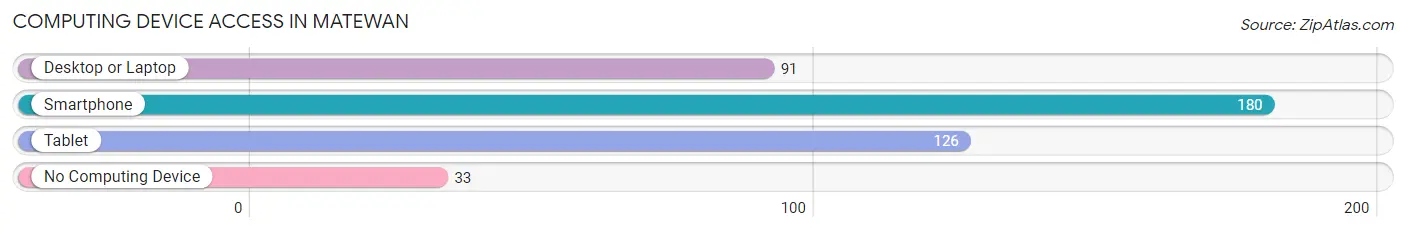
| Device Type | # Households | % Households |
| Desktop or Laptop | 91 | 32.2% |
| Smartphone | 180 | 63.6% |
| Tablet | 126 | 44.5% |
| No Computing Device | 33 | 11.7% |
| Total | 283 | 100.0% |
Internet Access in Matewan
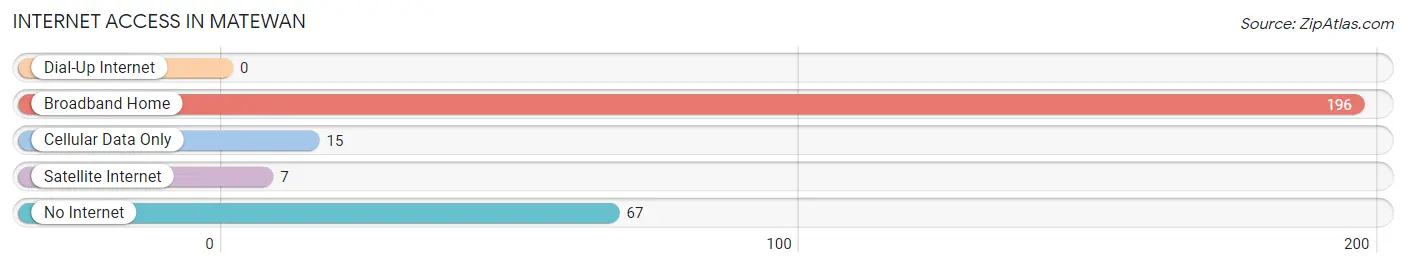
| Internet Type | # Households | % Households |
| Dial-Up Internet | 0 | 0.0% |
| Broadband Home | 196 | 69.3% |
| Cellular Data Only | 15 | 5.3% |
| Satellite Internet | 7 | 2.5% |
| No Internet | 67 | 23.7% |
| Total | 283 | 100.0% |
Matewan Summary
Matewan is a small town located in Mingo County, West Virginia. It is situated on the banks of the Tug Fork River, which forms the border between West Virginia and Kentucky. The town was founded in 1883 and was named after Chief Matewan, a Native American leader of the Shawnee tribe. The town has a population of approximately 500 people and is located in the Appalachian Mountains.
Geography
Matewan is located in the Appalachian Mountains of West Virginia. The town is situated on the banks of the Tug Fork River, which forms the border between West Virginia and Kentucky. The town is surrounded by mountains and hills, and is located in a valley. The climate in Matewan is humid and subtropical, with hot summers and mild winters.
Economy
Matewan’s economy is largely based on coal mining and timber production. The town is home to several coal mines, and the coal industry is the main source of employment for the town’s residents. The timber industry is also important to the local economy, and the town is home to several sawmills. In addition, Matewan is home to several small businesses, including restaurants, stores, and other services.
Demographics
As of the 2010 census, Matewan had a population of 500 people. The racial makeup of the town was 97.2% White, 0.6% African American, 0.2% Native American, 0.2% Asian, 0.2% from other races, and 1.8% from two or more races. The median household income in Matewan was $25,000, and the median family income was $30,000.
History
Matewan was founded in 1883 and was named after Chief Matewan, a Native American leader of the Shawnee tribe. The town was originally a coal mining town, and the coal industry was the main source of employment for the town’s residents. In 1920, Matewan was the site of the Battle of Matewan, a shootout between coal miners and the Baldwin-Felts Detective Agency. The battle was part of the West Virginia Mine Wars, a series of labor disputes between coal miners and coal companies. The battle resulted in the deaths of seven people, including Matewan’s mayor, Sid Hatfield.
In the late 20th century, Matewan experienced a period of economic decline due to the decline of the coal industry. However, the town has since experienced a resurgence in recent years, with the opening of several new businesses and the revitalization of the downtown area.
Conclusion
Matewan is a small town located in Mingo County, West Virginia. It is situated on the banks of the Tug Fork River, which forms the border between West Virginia and Kentucky. The town was founded in 1883 and was named after Chief Matewan, a Native American leader of the Shawnee tribe. The town has a population of approximately 500 people and is located in the Appalachian Mountains. The economy of Matewan is largely based on coal mining and timber production, and the town is home to several small businesses. The racial makeup of the town is 97.2% White, 0.6% African American, 0.2% Native American, 0.2% Asian, 0.2% from other races, and 1.8% from two or more races. The median household income in Matewan was $25,000, and the median family income was $30,000. Matewan is best known for the Battle of Matewan, a shootout between coal miners and the Baldwin-Felts Detective Agency that took place in 1920. In recent years, the town has experienced a resurgence, with the opening of several new businesses and the revitalization of the downtown area.
Common Questions
What is Per Capita Income in Matewan?
Per Capita income in Matewan is $14,868.
What is the Median Family Income in Matewan?
Median Family Income in Matewan is $42,988.
What is the Median Household income in Matewan?
Median Household Income in Matewan is $22,250.
What is Income or Wage Gap in Matewan?
Income or Wage Gap in Matewan is 22.2%.
Women in Matewan earn 77.8 cents for every dollar earned by a man.
What is Inequality or Gini Index in Matewan?
Inequality or Gini Index in Matewan is 0.42.
What is the Total Population of Matewan?
Total Population of Matewan is 558.
What is the Total Male Population of Matewan?
Total Male Population of Matewan is 232.
What is the Total Female Population of Matewan?
Total Female Population of Matewan is 326.
What is the Ratio of Males per 100 Females in Matewan?
There are 71.17 Males per 100 Females in Matewan.
What is the Ratio of Females per 100 Males in Matewan?
There are 140.52 Females per 100 Males in Matewan.
What is the Median Population Age in Matewan?
Median Population Age in Matewan is 46.9 Years.
What is the Average Family Size in Matewan
Average Family Size in Matewan is 3.0 People.
What is the Average Household Size in Matewan
Average Household Size in Matewan is 2.0 People.
How Large is the Labor Force in Matewan?
There are 152 People in the Labor Forcein in Matewan.
What is the Percentage of People in the Labor Force in Matewan?
32.9% of People are in the Labor Force in Matewan.
What is the Unemployment Rate in Matewan?
Unemployment Rate in Matewan is 21.1%.