Williamson, WV
Williamson Map
Williamson Overview
3,035
TOTAL POPULATION
1,393
MALE POPULATION
1,642
FEMALE POPULATION
84.84
MALES / 100 FEMALES
117.88
FEMALES / 100 MALES
40.6
MEDIAN AGE
3.4
AVG FAMILY SIZE
2.2
AVG HOUSEHOLD SIZE
$25,475
PER CAPITA INCOME
$58,750
AVG FAMILY INCOME
$23,173
AVG HOUSEHOLD INCOME
1.6%
WAGE / INCOME GAP [ % ]
98.4¢/ $1
WAGE / INCOME GAP [ $ ]
$8,333
FAMILY INCOME DEFICIT
0.65
INEQUALITY / GINI INDEX
935
LABOR FORCE [ PEOPLE ]
37.6%
PERCENT IN LABOR FORCE
11.6%
UNEMPLOYMENT RATE
Williamson Zip Codes
Williamson Area Codes
Race in Williamson
The most populous races in Williamson are White / Caucasian (2,561 | 84.4%), Black / African American (311 | 10.2%), and Two or more Races (163 | 5.4%).
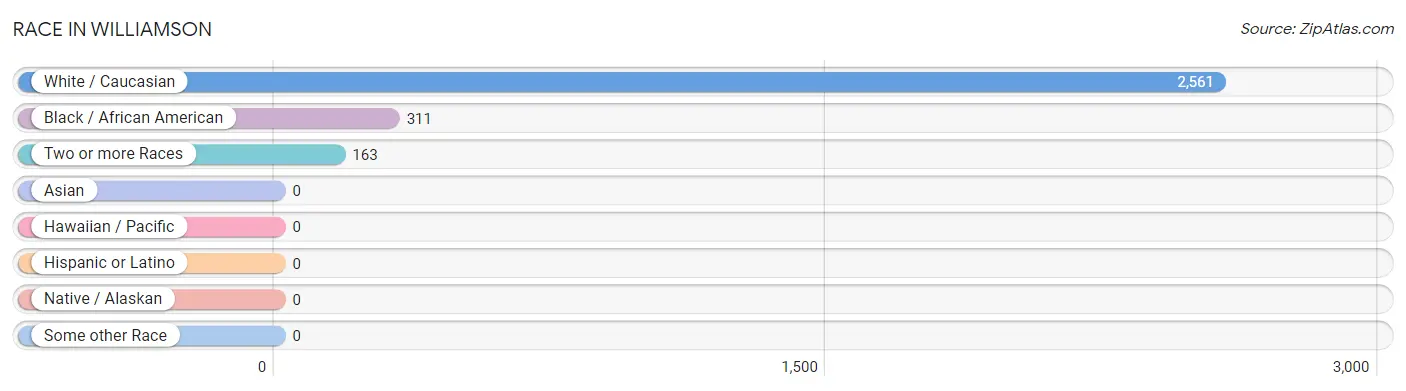
| Race | # Population | % Population |
| Asian | 0 | 0.0% |
| Black / African American | 311 | 10.2% |
| Hawaiian / Pacific | 0 | 0.0% |
| Hispanic or Latino | 0 | 0.0% |
| Native / Alaskan | 0 | 0.0% |
| White / Caucasian | 2,561 | 84.4% |
| Two or more Races | 163 | 5.4% |
| Some other Race | 0 | 0.0% |
| Total | 3,035 | 100.0% |
Ancestry in Williamson
The most populous ancestries reported in Williamson are English (427 | 14.1%), American (235 | 7.7%), Irish (216 | 7.1%), German (88 | 2.9%), and Scottish (48 | 1.6%), together accounting for 33.4% of all Williamson residents.
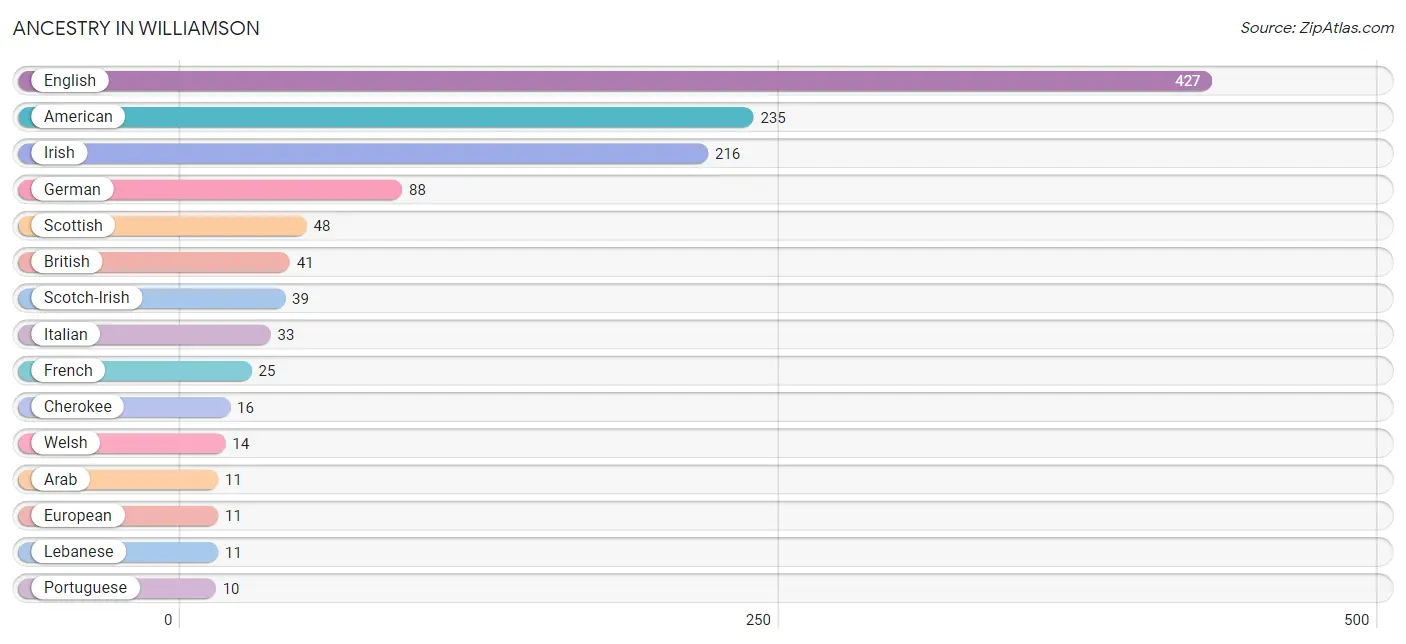
| Ancestry | # Population | % Population |
| American | 235 | 7.7% |
| Arab | 11 | 0.4% |
| British | 41 | 1.3% |
| Cherokee | 16 | 0.5% |
| English | 427 | 14.1% |
| European | 11 | 0.4% |
| French | 25 | 0.8% |
| German | 88 | 2.9% |
| Hungarian | 7 | 0.2% |
| Irish | 216 | 7.1% |
| Italian | 33 | 1.1% |
| Lebanese | 11 | 0.4% |
| Portuguese | 10 | 0.3% |
| Scotch-Irish | 39 | 1.3% |
| Scottish | 48 | 1.6% |
| Welsh | 14 | 0.5% | View All 16 Rows |
Immigrants in Williamson
The most numerous immigrant groups reported in Williamson came from Europe (31 | 1.0%), Germany (19 | 0.6%), Western Europe (19 | 0.6%), and Northern Europe (12 | 0.4%), together accounting for 2.7% of all Williamson residents.
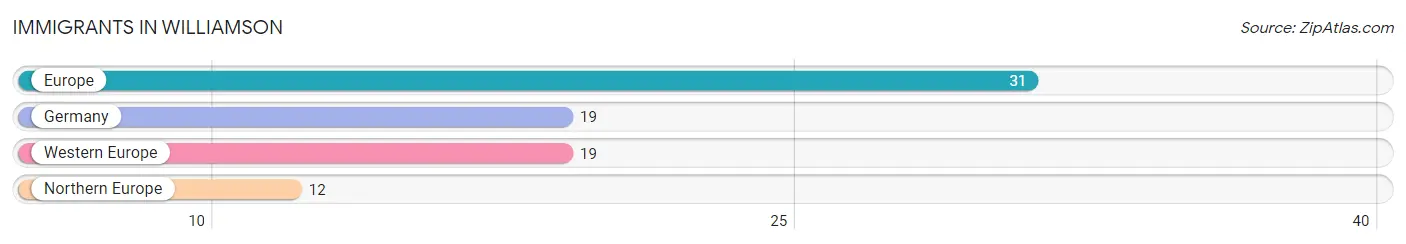
| Immigration Origin | # Population | % Population |
| Europe | 31 | 1.0% |
| Germany | 19 | 0.6% |
| Northern Europe | 12 | 0.4% |
| Western Europe | 19 | 0.6% | View All 4 Rows |
Sex and Age in Williamson
Sex and Age in Williamson
The most populous age groups in Williamson are 15 to 19 Years (192 | 13.8%) for men and 60 to 64 Years (217 | 13.2%) for women.
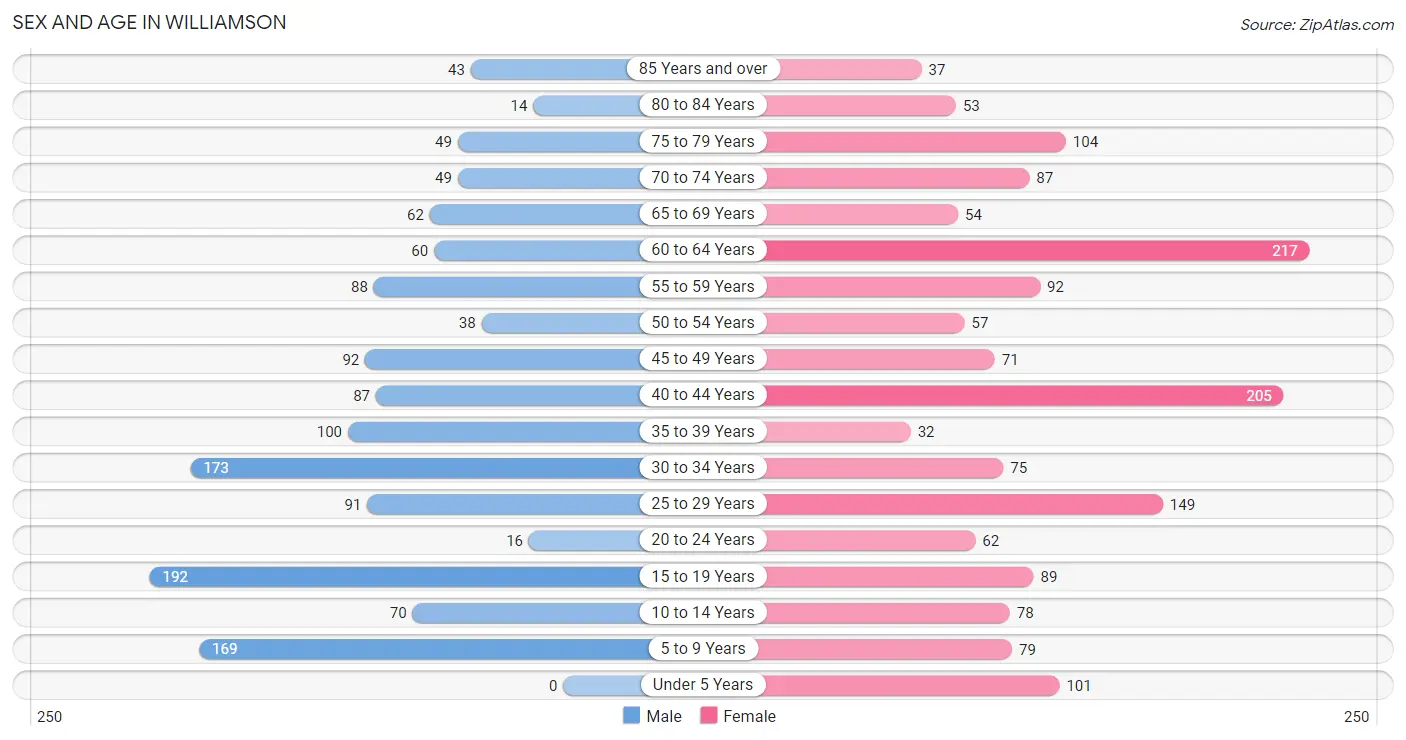
| Age Bracket | Male | Female |
| Under 5 Years | 0 (0.0%) | 101 (6.1%) |
| 5 to 9 Years | 169 (12.1%) | 79 (4.8%) |
| 10 to 14 Years | 70 (5.0%) | 78 (4.8%) |
| 15 to 19 Years | 192 (13.8%) | 89 (5.4%) |
| 20 to 24 Years | 16 (1.1%) | 62 (3.8%) |
| 25 to 29 Years | 91 (6.5%) | 149 (9.1%) |
| 30 to 34 Years | 173 (12.4%) | 75 (4.6%) |
| 35 to 39 Years | 100 (7.2%) | 32 (1.9%) |
| 40 to 44 Years | 87 (6.2%) | 205 (12.5%) |
| 45 to 49 Years | 92 (6.6%) | 71 (4.3%) |
| 50 to 54 Years | 38 (2.7%) | 57 (3.5%) |
| 55 to 59 Years | 88 (6.3%) | 92 (5.6%) |
| 60 to 64 Years | 60 (4.3%) | 217 (13.2%) |
| 65 to 69 Years | 62 (4.4%) | 54 (3.3%) |
| 70 to 74 Years | 49 (3.5%) | 87 (5.3%) |
| 75 to 79 Years | 49 (3.5%) | 104 (6.3%) |
| 80 to 84 Years | 14 (1.0%) | 53 (3.2%) |
| 85 Years and over | 43 (3.1%) | 37 (2.2%) |
| Total | 1,393 (100.0%) | 1,642 (100.0%) |
Families and Households in Williamson
Median Family Size in Williamson
The median family size in Williamson is 3.37 persons per family, with single male/father families (31 | 5.2%) accounting for the largest median family size of 5.71 persons per family. On the other hand, married-couple families (391 | 65.2%) represent the smallest median family size with 3.20 persons per family.
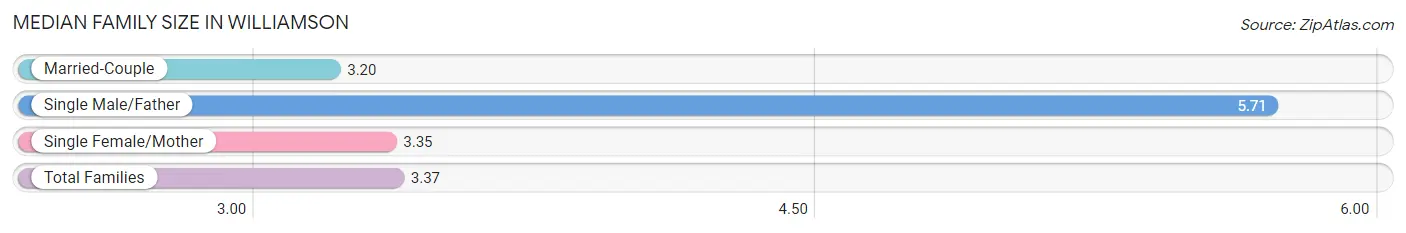
| Family Type | # Families | Family Size |
| Married-Couple | 391 (65.2%) | 3.20 |
| Single Male/Father | 31 (5.2%) | 5.71 |
| Single Female/Mother | 178 (29.7%) | 3.35 |
| Total Families | 600 (100.0%) | 3.37 |
Median Household Size in Williamson
The median household size in Williamson is 2.18 persons per household, with single male/father households (31 | 2.3%) accounting for the largest median household size of 6.1 persons per household. non-family households (750 | 55.6%) represent the smallest median household size with 1.13 persons per household.
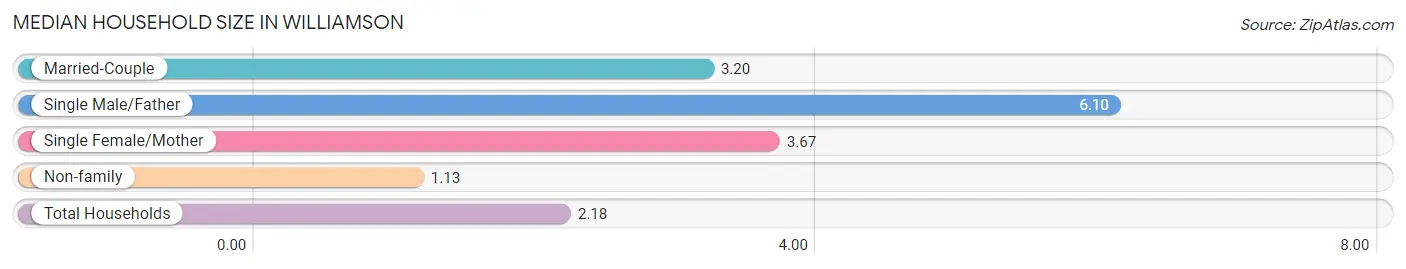
| Household Type | # Households | Household Size |
| Married-Couple | 391 (29.0%) | 3.20 |
| Single Male/Father | 31 (2.3%) | 6.10 |
| Single Female/Mother | 178 (13.2%) | 3.67 |
| Non-family | 750 (55.6%) | 1.13 |
| Total Households | 1,350 (100.0%) | 2.18 |
Household Size by Marriage Status in Williamson
Out of a total of 1,350 households in Williamson, 600 (44.4%) are family households, while 750 (55.6%) are nonfamily households. The most numerous type of family households are 2-person households, comprising 223, and the most common type of nonfamily households are 1-person households, comprising 671.
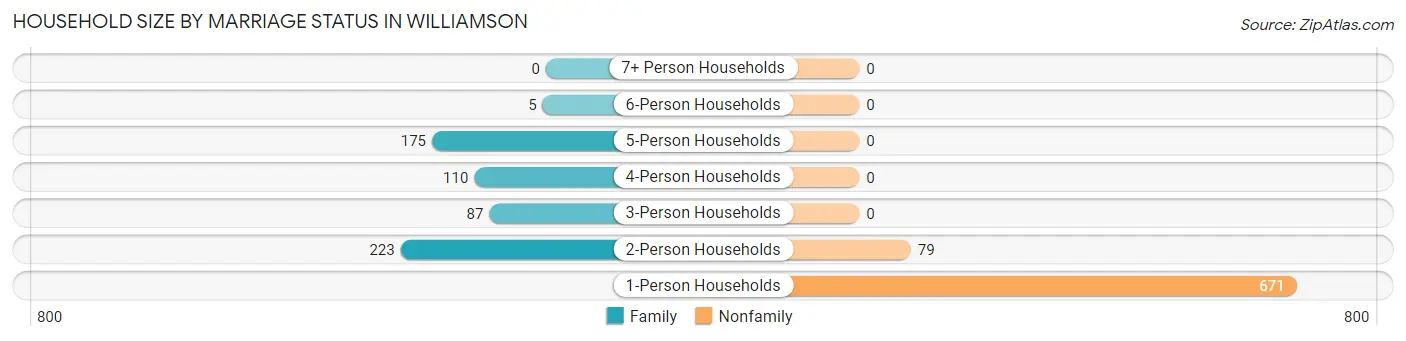
| Household Size | Family Households | Nonfamily Households |
| 1-Person Households | - | 671 (49.7%) |
| 2-Person Households | 223 (16.5%) | 79 (5.9%) |
| 3-Person Households | 87 (6.4%) | 0 (0.0%) |
| 4-Person Households | 110 (8.2%) | 0 (0.0%) |
| 5-Person Households | 175 (13.0%) | 0 (0.0%) |
| 6-Person Households | 5 (0.4%) | 0 (0.0%) |
| 7+ Person Households | 0 (0.0%) | 0 (0.0%) |
| Total | 600 (44.4%) | 750 (55.6%) |
Female Fertility in Williamson
Fertility by Age in Williamson
Average fertility rate in Williamson is 69.0 births per 1,000 women. Women in the age bracket of 20 to 34 years have the highest fertility rate with 150.0 births per 1,000 women. Women in the age bracket of 20 to 34 years acount for 91.5% of all women with births.
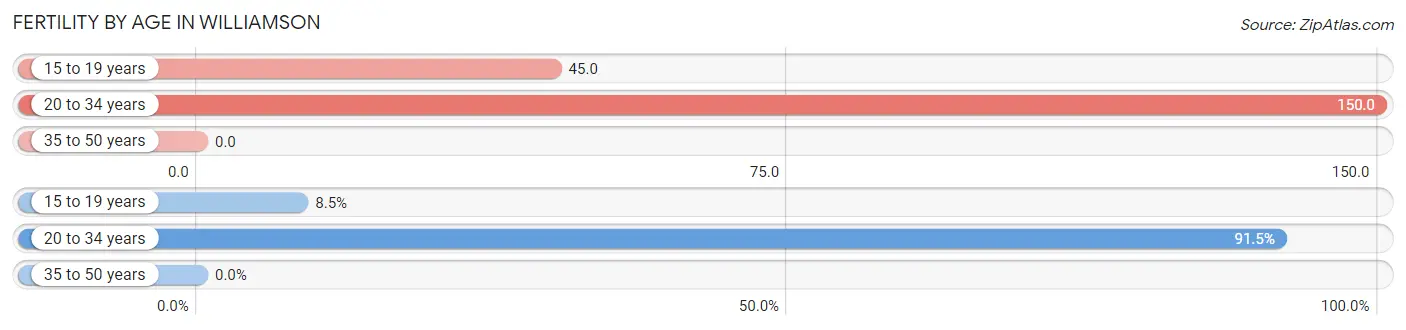
| Age Bracket | Women with Births | Births / 1,000 Women |
| 15 to 19 years | 4 (8.5%) | 45.0 |
| 20 to 34 years | 43 (91.5%) | 150.0 |
| 35 to 50 years | 0 (0.0%) | 0.0 |
| Total | 47 (100.0%) | 69.0 |
Fertility by Age by Marriage Status in Williamson
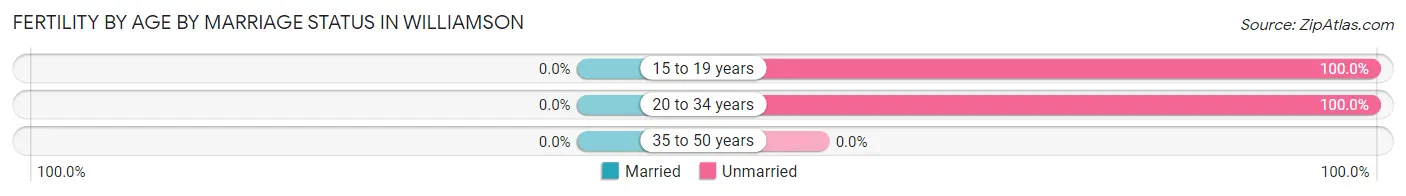
| Age Bracket | Married | Unmarried |
| 15 to 19 years | 0 (0.0%) | 4 (100.0%) |
| 20 to 34 years | 0 (0.0%) | 43 (100.0%) |
| 35 to 50 years | 0 (0.0%) | 0 (0.0%) |
| Total | 0 (0.0%) | 47 (100.0%) |
Fertility by Education in Williamson
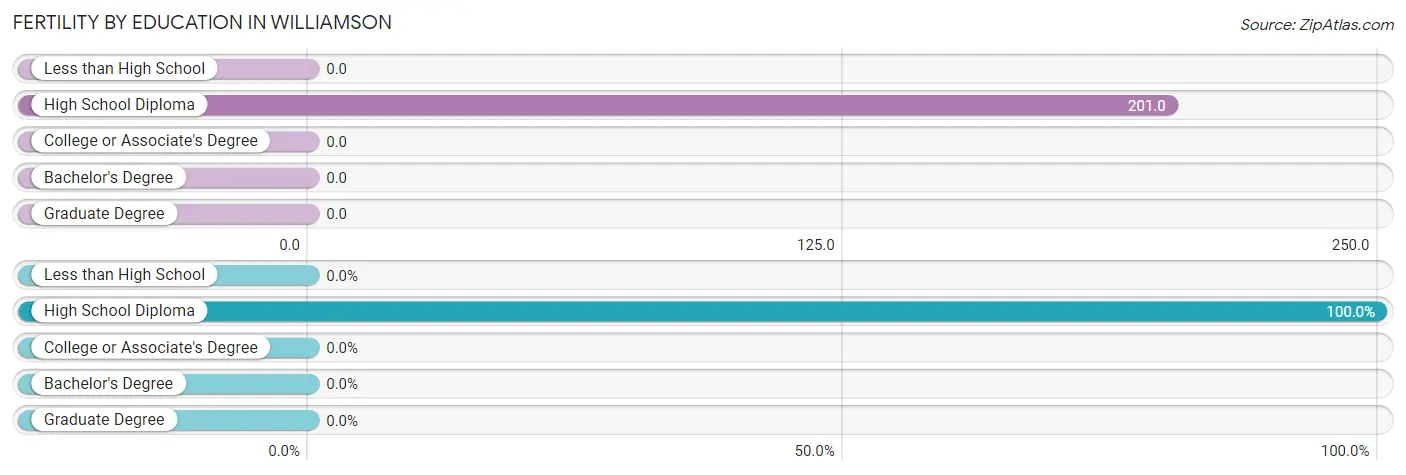
| Educational Attainment | Women with Births | Births / 1,000 Women |
| Less than High School | 0 (0.0%) | 0.0 |
| High School Diploma | 47 (100.0%) | 201.0 |
| College or Associate's Degree | 0 (0.0%) | 0.0 |
| Bachelor's Degree | 0 (0.0%) | 0.0 |
| Graduate Degree | 0 (0.0%) | 0.0 |
| Total | 47 (100.0%) | 69.0 |
Fertility by Education by Marriage Status in Williamson
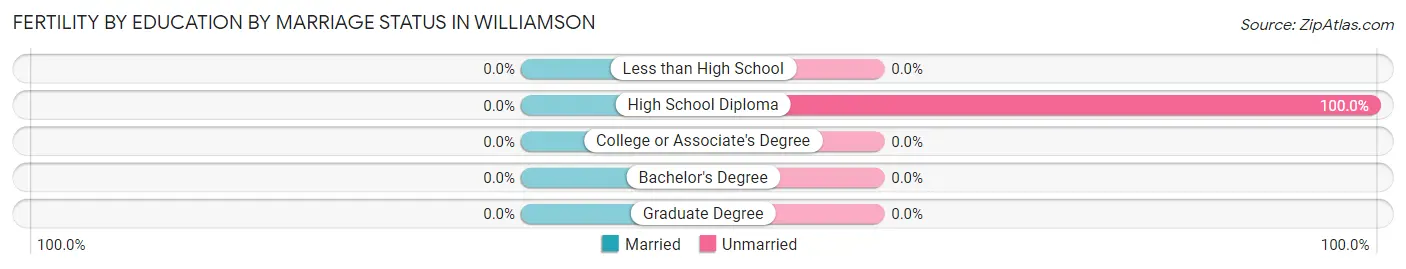
| Educational Attainment | Married | Unmarried |
| Less than High School | 0 (0.0%) | 0 (0.0%) |
| High School Diploma | 0 (0.0%) | 47 (100.0%) |
| College or Associate's Degree | 0 (0.0%) | 0 (0.0%) |
| Bachelor's Degree | 0 (0.0%) | 0 (0.0%) |
| Graduate Degree | 0 (0.0%) | 0 (0.0%) |
| Total | 0 (0.0%) | 47 (100.0%) |
Income in Williamson
Income Overview in Williamson
Per Capita Income in Williamson is $25,475, while median incomes of families and households are $58,750 and $23,173 respectively.
| Characteristic | Number | Measure |
| Per Capita Income | 3,035 | $25,475 |
| Median Family Income | 600 | $58,750 |
| Mean Family Income | 600 | $97,257 |
| Median Household Income | 1,350 | $23,173 |
| Mean Household Income | 1,350 | $55,497 |
| Income Deficit | 600 | $8,333 |
| Wage / Income Gap (%) | 3,035 | 1.61% |
| Wage / Income Gap ($) | 3,035 | 98.39¢ per $1 |
| Gini / Inequality Index | 3,035 | 0.65 |
Earnings by Sex in Williamson
Average Earnings in Williamson are $32,901, $32,396 for men and $32,925 for women, a difference of 1.6%.
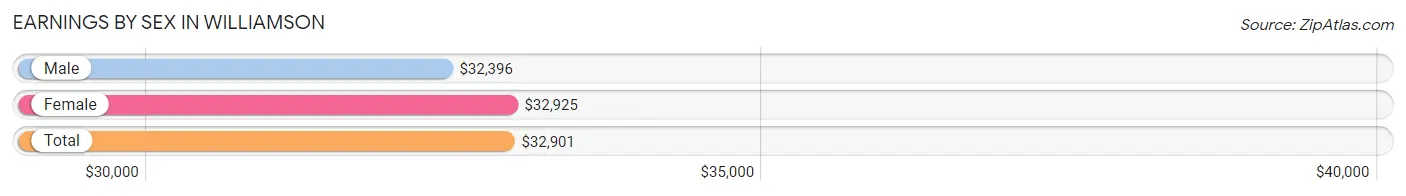
| Sex | Number | Average Earnings |
| Male | 427 (46.7%) | $32,396 |
| Female | 488 (53.3%) | $32,925 |
| Total | 915 (100.0%) | $32,901 |
Earnings by Sex by Income Bracket in Williamson
The most common earnings brackets in Williamson are $25,000 to $29,999 for men (84 | 19.7%) and $55,000 to $64,999 for women (81 | 16.6%).
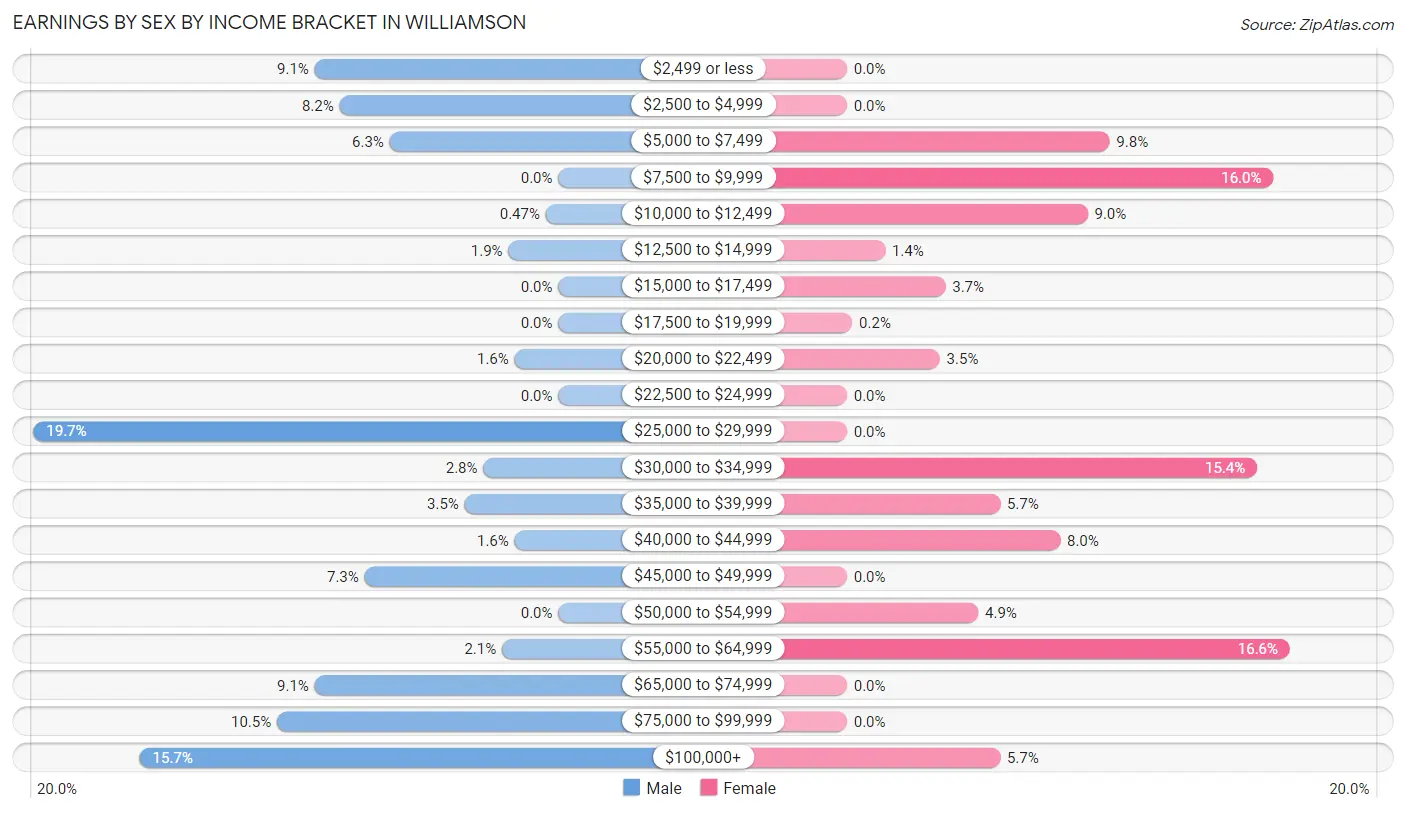
| Income | Male | Female |
| $2,499 or less | 39 (9.1%) | 0 (0.0%) |
| $2,500 to $4,999 | 35 (8.2%) | 0 (0.0%) |
| $5,000 to $7,499 | 27 (6.3%) | 48 (9.8%) |
| $7,500 to $9,999 | 0 (0.0%) | 78 (16.0%) |
| $10,000 to $12,499 | 2 (0.5%) | 44 (9.0%) |
| $12,500 to $14,999 | 8 (1.9%) | 7 (1.4%) |
| $15,000 to $17,499 | 0 (0.0%) | 18 (3.7%) |
| $17,500 to $19,999 | 0 (0.0%) | 1 (0.2%) |
| $20,000 to $22,499 | 7 (1.6%) | 17 (3.5%) |
| $22,500 to $24,999 | 0 (0.0%) | 0 (0.0%) |
| $25,000 to $29,999 | 84 (19.7%) | 0 (0.0%) |
| $30,000 to $34,999 | 12 (2.8%) | 75 (15.4%) |
| $35,000 to $39,999 | 15 (3.5%) | 28 (5.7%) |
| $40,000 to $44,999 | 7 (1.6%) | 39 (8.0%) |
| $45,000 to $49,999 | 31 (7.3%) | 0 (0.0%) |
| $50,000 to $54,999 | 0 (0.0%) | 24 (4.9%) |
| $55,000 to $64,999 | 9 (2.1%) | 81 (16.6%) |
| $65,000 to $74,999 | 39 (9.1%) | 0 (0.0%) |
| $75,000 to $99,999 | 45 (10.5%) | 0 (0.0%) |
| $100,000+ | 67 (15.7%) | 28 (5.7%) |
| Total | 427 (100.0%) | 488 (100.0%) |
Earnings by Sex by Educational Attainment in Williamson
Average earnings in Williamson are $32,188 for men and $33,396 for women, a difference of 3.6%. Men with an educational attainment of high school diploma enjoy the highest average annual earnings of $47,944, while those with high school diploma education earn the least with $47,944. Women with an educational attainment of graduate degree earn the most with the average annual earnings of $59,830, while those with less than high school education have the smallest earnings of $11,029.
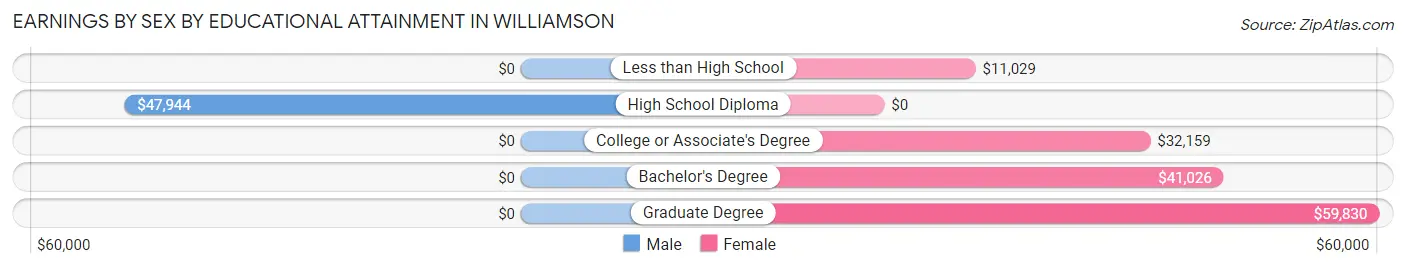
| Educational Attainment | Male Income | Female Income |
| Less than High School | - | - |
| High School Diploma | $47,944 | $0 |
| College or Associate's Degree | - | - |
| Bachelor's Degree | - | - |
| Graduate Degree | - | - |
| Total | $32,188 | $33,396 |
Family Income in Williamson
Family Income Brackets in Williamson
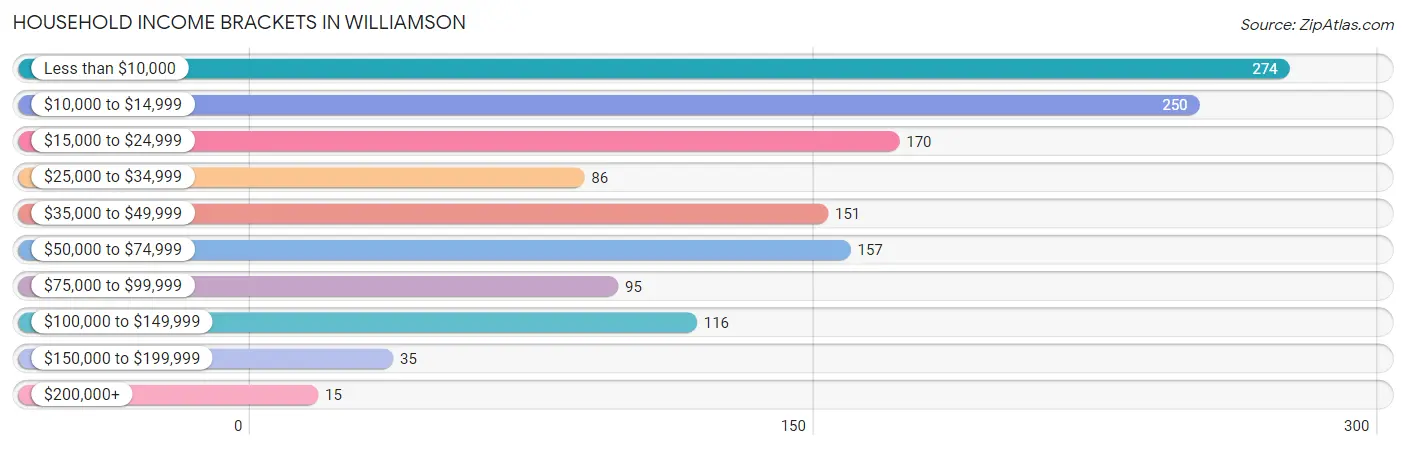
According to the Williamson family income data, there are 107 families falling into the $100,000 to $149,999 income range, which is the most common income bracket and makes up 17.8% of all families. Conversely, the less than $10,000 income bracket is the least frequent group with only 4 families (0.7%) belonging to this category.
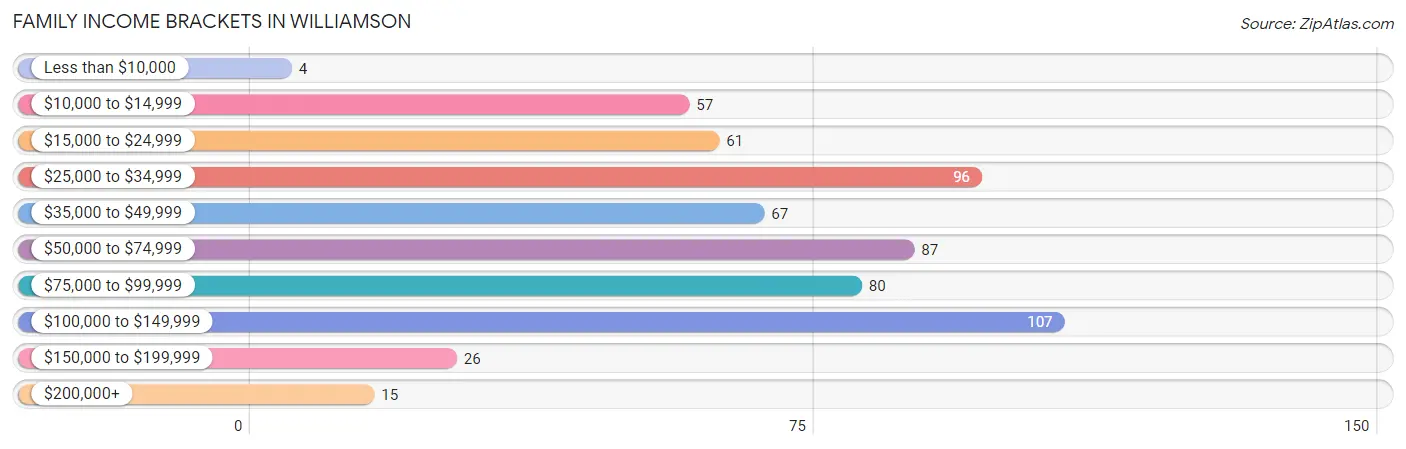
| Income Bracket | # Families | % Families |
| Less than $10,000 | 4 | 0.7% |
| $10,000 to $14,999 | 57 | 9.5% |
| $15,000 to $24,999 | 61 | 10.2% |
| $25,000 to $34,999 | 96 | 16.0% |
| $35,000 to $49,999 | 67 | 11.2% |
| $50,000 to $74,999 | 87 | 14.5% |
| $75,000 to $99,999 | 80 | 13.3% |
| $100,000 to $149,999 | 107 | 17.8% |
| $150,000 to $199,999 | 26 | 4.3% |
| $200,000+ | 15 | 2.5% |
Family Income by Famaliy Size in Williamson
3-person families (103 | 17.2%) account for the highest median family income in Williamson with $66,648 per family, while 2-person families (223 | 37.2%) have the highest median income of $30,764 per family member.
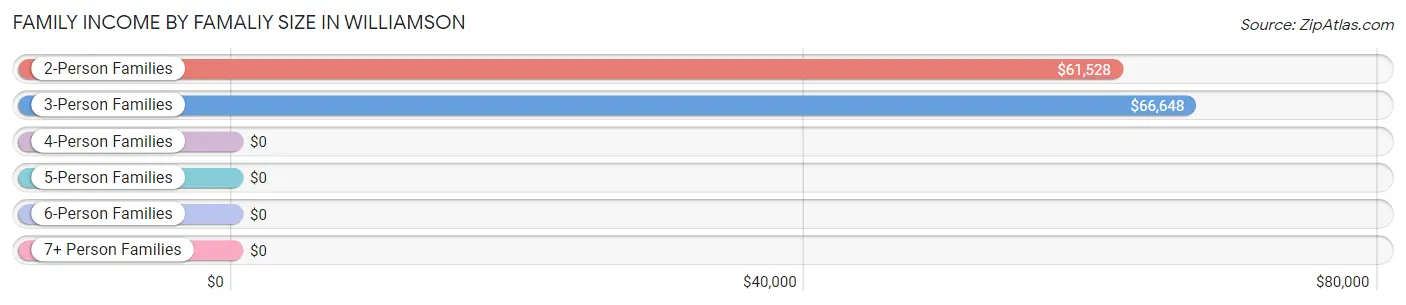
| Income Bracket | # Families | Median Income |
| 2-Person Families | 223 (37.2%) | $61,528 |
| 3-Person Families | 103 (17.2%) | $66,648 |
| 4-Person Families | 185 (30.8%) | $0 |
| 5-Person Families | 89 (14.8%) | $0 |
| 6-Person Families | 0 (0.0%) | $0 |
| 7+ Person Families | 0 (0.0%) | $0 |
| Total | 600 (100.0%) | $58,750 |
Family Income by Number of Earners in Williamson
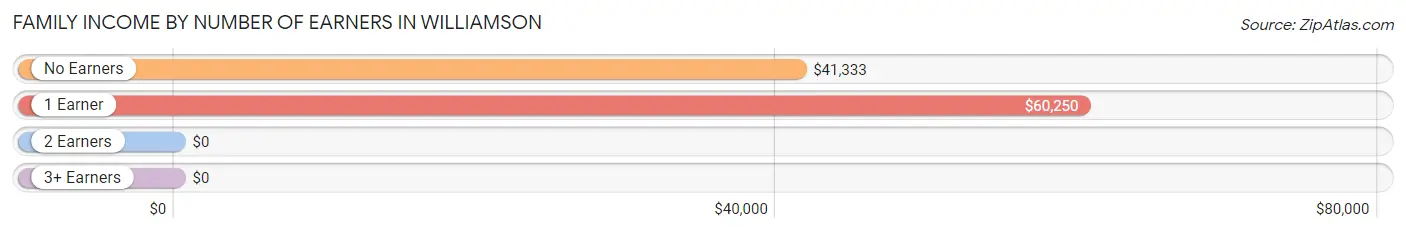
| Number of Earners | # Families | Median Income |
| No Earners | 150 (25.0%) | $41,333 |
| 1 Earner | 289 (48.2%) | $60,250 |
| 2 Earners | 161 (26.8%) | $0 |
| 3+ Earners | 0 (0.0%) | $0 |
| Total | 600 (100.0%) | $58,750 |
Household Income in Williamson
Household Income Brackets in Williamson
With 274 households falling in the category, the less than $10,000 income range is the most frequent in Williamson, accounting for 20.3% of all households. In contrast, only 15 households (1.1%) fall into the $200,000+ income bracket, making it the least populous group.
| Income Bracket | # Households | % Households |
| Less than $10,000 | 274 | 20.3% |
| $10,000 to $14,999 | 250 | 18.5% |
| $15,000 to $24,999 | 170 | 12.6% |
| $25,000 to $34,999 | 86 | 6.4% |
| $35,000 to $49,999 | 151 | 11.2% |
| $50,000 to $74,999 | 157 | 11.6% |
| $75,000 to $99,999 | 95 | 7.0% |
| $100,000 to $149,999 | 116 | 8.6% |
| $150,000 to $199,999 | 35 | 2.6% |
| $200,000+ | 15 | 1.1% |
Household Income by Householder Age in Williamson
The median household income in Williamson is $23,173, with the highest median household income of $31,964 found in the 65+ years age bracket for the primary householder. A total of 323 households (23.9%) fall into this category. Meanwhile, the 15 to 24 years age bracket for the primary householder has the lowest median household income of $0, with 13 households (1.0%) in this group.
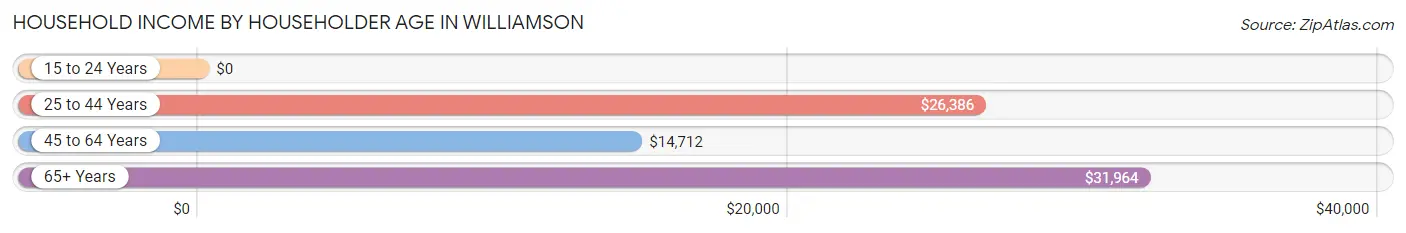
| Income Bracket | # Households | Median Income |
| 15 to 24 Years | 13 (1.0%) | $0 |
| 25 to 44 Years | 559 (41.4%) | $26,386 |
| 45 to 64 Years | 455 (33.7%) | $14,712 |
| 65+ Years | 323 (23.9%) | $31,964 |
| Total | 1,350 (100.0%) | $23,173 |
Poverty in Williamson
Income Below Poverty by Sex and Age in Williamson
With 33.3% poverty level for males and 30.8% for females among the residents of Williamson, 55 to 64 year old males and 18 to 24 year old females are the most vulnerable to poverty, with 78 males (55.3%) and 35 females (47.9%) in their respective age groups living below the poverty level.
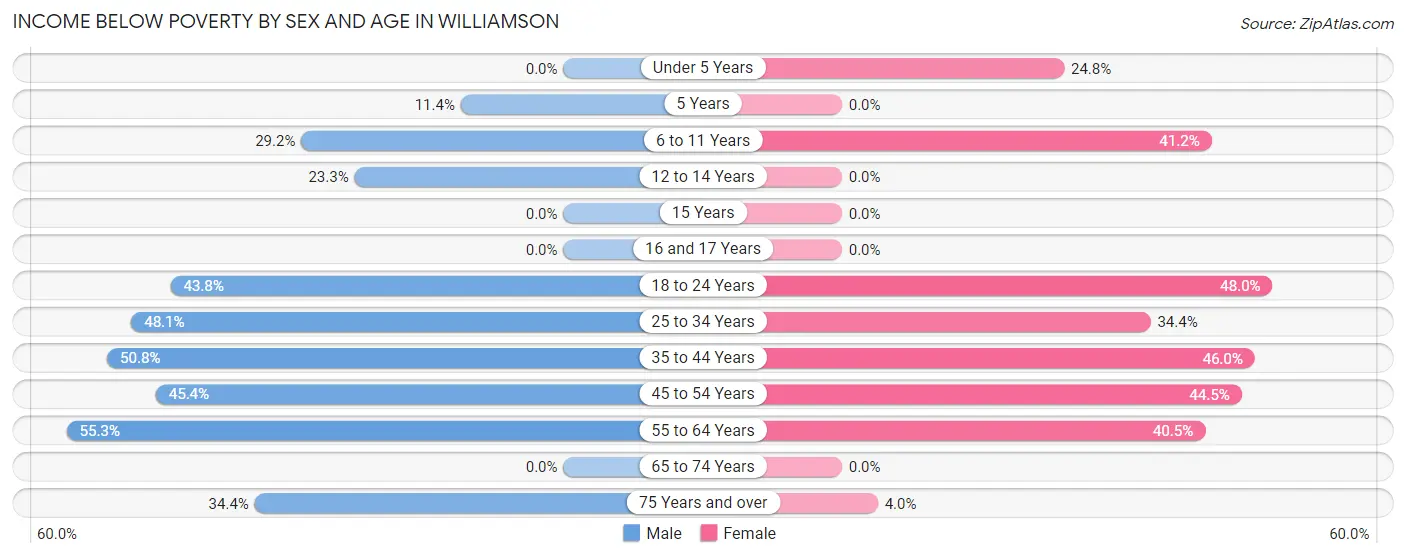
| Age Bracket | Male | Female |
| Under 5 Years | 0 (0.0%) | 25 (24.7%) |
| 5 Years | 4 (11.4%) | 0 (0.0%) |
| 6 to 11 Years | 47 (29.2%) | 56 (41.2%) |
| 12 to 14 Years | 10 (23.3%) | 0 (0.0%) |
| 15 Years | 0 (0.0%) | 0 (0.0%) |
| 16 and 17 Years | 0 (0.0%) | 0 (0.0%) |
| 18 to 24 Years | 7 (43.8%) | 35 (47.9%) |
| 25 to 34 Years | 127 (48.1%) | 77 (34.4%) |
| 35 to 44 Years | 95 (50.8%) | 109 (46.0%) |
| 45 to 54 Years | 54 (45.4%) | 57 (44.5%) |
| 55 to 64 Years | 78 (55.3%) | 125 (40.5%) |
| 65 to 74 Years | 0 (0.0%) | 0 (0.0%) |
| 75 Years and over | 33 (34.4%) | 6 (4.0%) |
| Total | 455 (33.3%) | 490 (30.8%) |
Income Above Poverty by Sex and Age in Williamson
According to the poverty statistics in Williamson, males aged 15 years and females aged 12 to 14 years are the age groups that are most secure financially, with 100.0% of males and 100.0% of females in these age groups living above the poverty line.
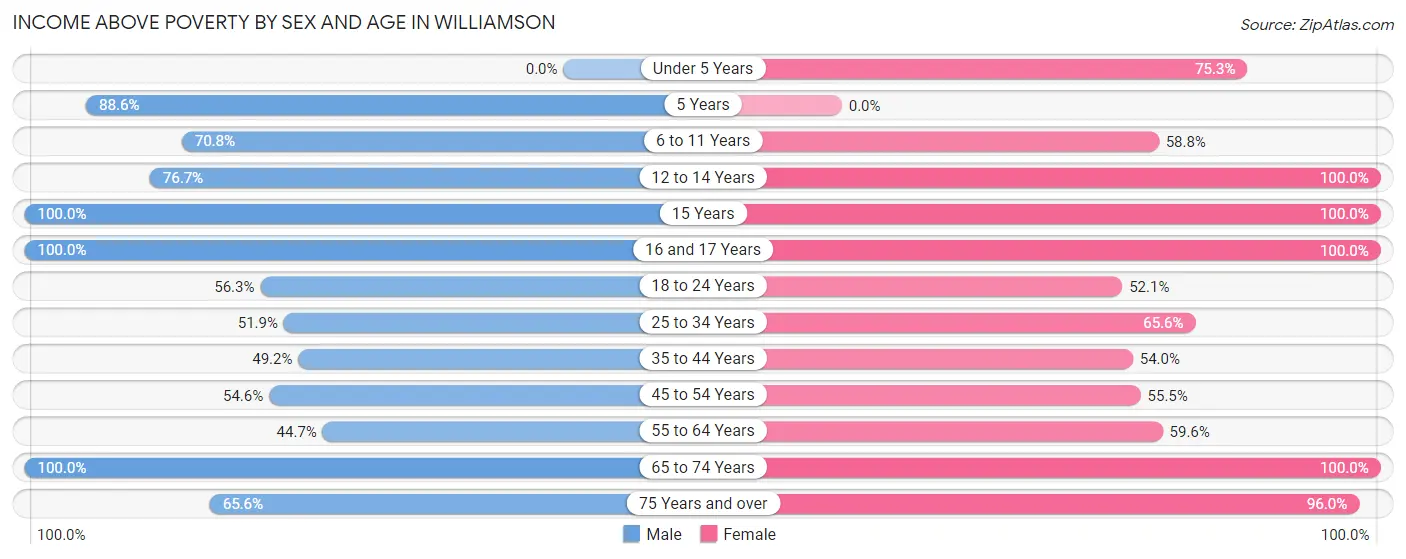
| Age Bracket | Male | Female |
| Under 5 Years | 0 (0.0%) | 76 (75.2%) |
| 5 Years | 31 (88.6%) | 0 (0.0%) |
| 6 to 11 Years | 114 (70.8%) | 80 (58.8%) |
| 12 to 14 Years | 33 (76.7%) | 21 (100.0%) |
| 15 Years | 33 (100.0%) | 19 (100.0%) |
| 16 and 17 Years | 159 (100.0%) | 59 (100.0%) |
| 18 to 24 Years | 9 (56.2%) | 38 (52.0%) |
| 25 to 34 Years | 137 (51.9%) | 147 (65.6%) |
| 35 to 44 Years | 92 (49.2%) | 128 (54.0%) |
| 45 to 54 Years | 65 (54.6%) | 71 (55.5%) |
| 55 to 64 Years | 63 (44.7%) | 184 (59.6%) |
| 65 to 74 Years | 111 (100.0%) | 132 (100.0%) |
| 75 Years and over | 63 (65.6%) | 144 (96.0%) |
| Total | 910 (66.7%) | 1,099 (69.2%) |
Income Below Poverty Among Married-Couple Families in Williamson
The poverty statistics for married-couple families in Williamson show that 17.6% or 69 of the total 391 families live below the poverty line. Families with no children have the highest poverty rate of 26.0%, comprising of 52 families. On the other hand, families with 3 or 4 children have the lowest poverty rate of 0.0%, which includes 0 families.
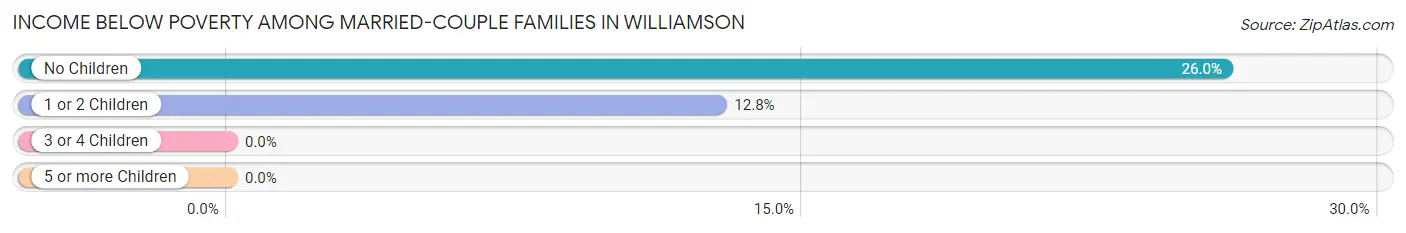
| Children | Above Poverty | Below Poverty |
| No Children | 148 (74.0%) | 52 (26.0%) |
| 1 or 2 Children | 116 (87.2%) | 17 (12.8%) |
| 3 or 4 Children | 58 (100.0%) | 0 (0.0%) |
| 5 or more Children | 0 (0.0%) | 0 (0.0%) |
| Total | 322 (82.4%) | 69 (17.6%) |
Income Below Poverty Among Single-Parent Households in Williamson
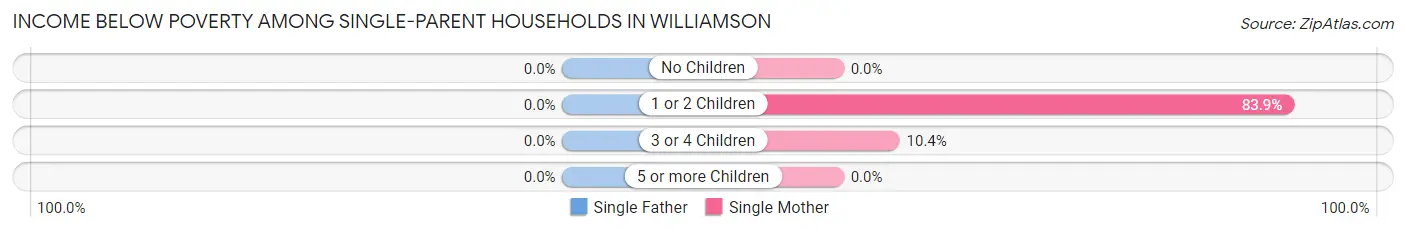
| Children | Single Father | Single Mother |
| No Children | 0 (0.0%) | 0 (0.0%) |
| 1 or 2 Children | 0 (0.0%) | 52 (83.9%) |
| 3 or 4 Children | 0 (0.0%) | 5 (10.4%) |
| 5 or more Children | 0 (0.0%) | 0 (0.0%) |
| Total | 0 (0.0%) | 57 (32.0%) |
Income Below Poverty Among Married-Couple vs Single-Parent Households in Williamson
The poverty data for Williamson shows that 69 of the married-couple family households (17.6%) and 57 of the single-parent households (27.3%) are living below the poverty level. Within the married-couple family households, those with no children have the highest poverty rate, with 52 households (26.0%) falling below the poverty line. Among the single-parent households, those with 1 or 2 children have the highest poverty rate, with 52 household (55.9%) living below poverty.
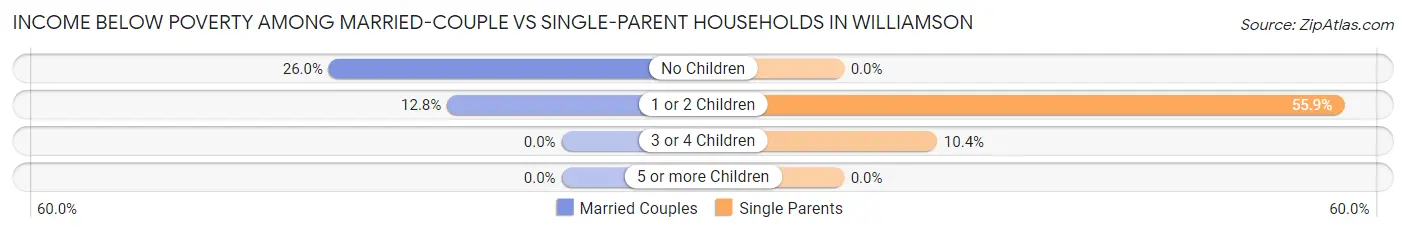
| Children | Married-Couple Families | Single-Parent Households |
| No Children | 52 (26.0%) | 0 (0.0%) |
| 1 or 2 Children | 17 (12.8%) | 52 (55.9%) |
| 3 or 4 Children | 0 (0.0%) | 5 (10.4%) |
| 5 or more Children | 0 (0.0%) | 0 (0.0%) |
| Total | 69 (17.6%) | 57 (27.3%) |
Employment Characteristics in Williamson
Employment by Class of Employer in Williamson
Among the 808 employed individuals in Williamson, private company employees (468 | 57.9%), local government employees (135 | 16.7%), and state government employees (76 | 9.4%) make up the most common classes of employment.
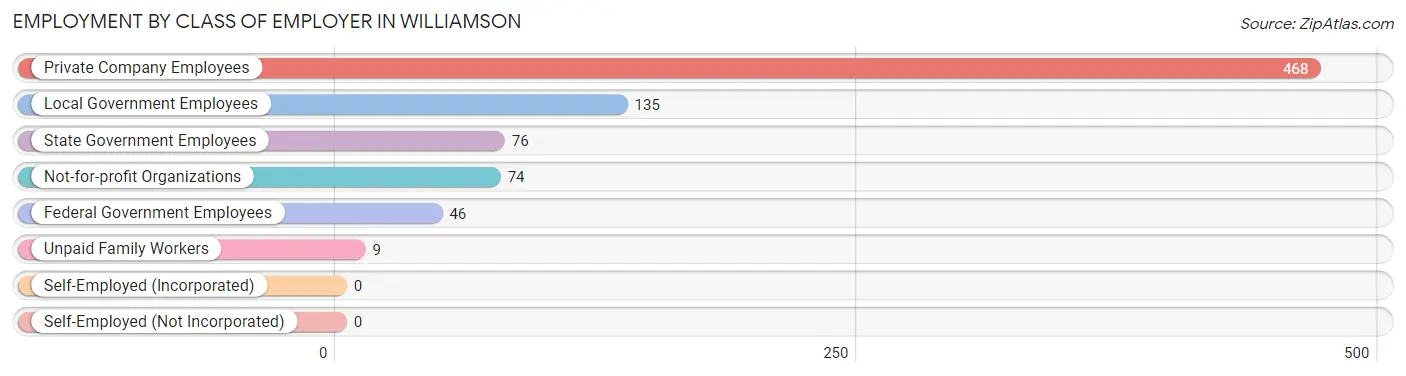
| Employer Class | # Employees | % Employees |
| Private Company Employees | 468 | 57.9% |
| Self-Employed (Incorporated) | 0 | 0.0% |
| Self-Employed (Not Incorporated) | 0 | 0.0% |
| Not-for-profit Organizations | 74 | 9.2% |
| Local Government Employees | 135 | 16.7% |
| State Government Employees | 76 | 9.4% |
| Federal Government Employees | 46 | 5.7% |
| Unpaid Family Workers | 9 | 1.1% |
| Total | 808 | 100.0% |
Employment Status by Age in Williamson
According to the labor force statistics for Williamson, out of the total population over 16 years of age (2,486), 37.6% or 935 individuals are in the labor force, with 11.6% or 108 of them unemployed. The age group with the highest labor force participation rate is 25 to 29 years, with 94.2% or 226 individuals in the labor force. Within the labor force, the 16 to 19 years age range has the highest percentage of unemployed individuals, with 100.0% or 34 of them being unemployed.
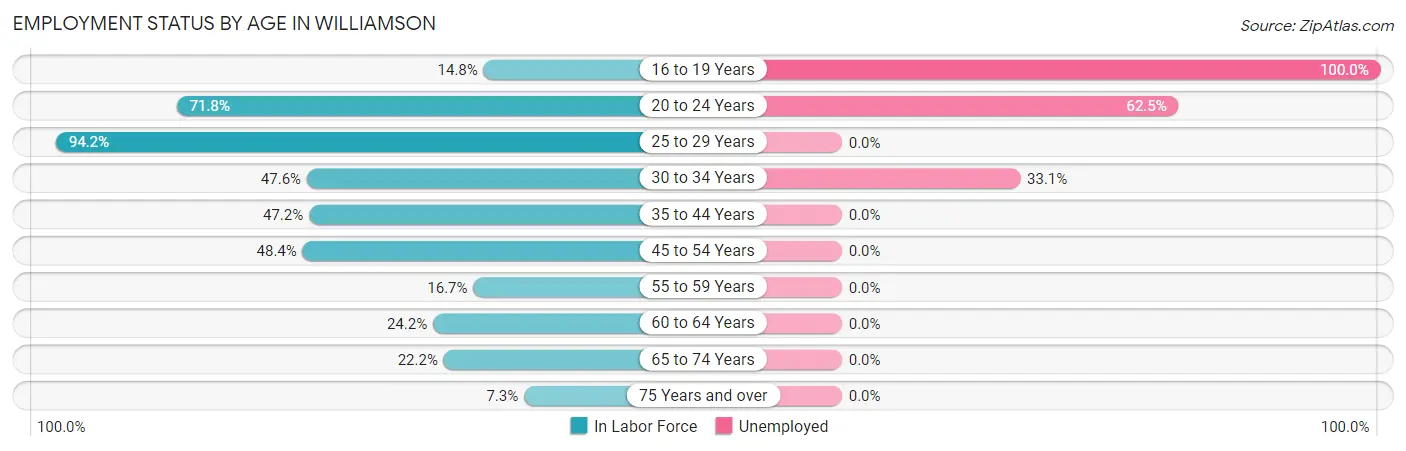
| Age Bracket | In Labor Force | Unemployed |
| 16 to 19 Years | 34 (14.8%) | 34 (100.0%) |
| 20 to 24 Years | 56 (71.8%) | 35 (62.5%) |
| 25 to 29 Years | 226 (94.2%) | 0 (0.0%) |
| 30 to 34 Years | 118 (47.6%) | 39 (33.1%) |
| 35 to 44 Years | 200 (47.2%) | 0 (0.0%) |
| 45 to 54 Years | 125 (48.4%) | 0 (0.0%) |
| 55 to 59 Years | 30 (16.7%) | 0 (0.0%) |
| 60 to 64 Years | 67 (24.2%) | 0 (0.0%) |
| 65 to 74 Years | 56 (22.2%) | 0 (0.0%) |
| 75 Years and over | 22 (7.3%) | 0 (0.0%) |
| Total | 935 (37.6%) | 108 (11.6%) |
Employment Status by Educational Attainment in Williamson
According to labor force statistics for Williamson, 47.1% of individuals (766) out of the total population between 25 and 64 years of age (1,627) are in the labor force, with 5.1% or 39 of them being unemployed. The group with the highest labor force participation rate are those with the educational attainment of bachelor's degree or higher, with 96.3% or 184 individuals in the labor force. Within the labor force, individuals with college / associate degree education have the highest percentage of unemployment, with 15.9% or 39 of them being unemployed.
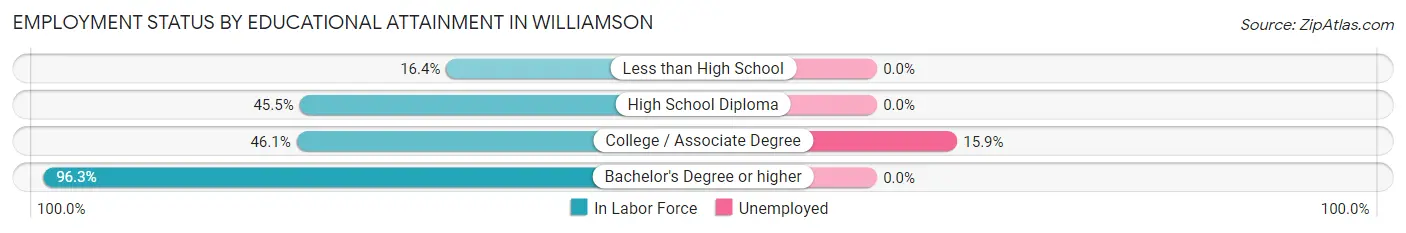
| Educational Attainment | In Labor Force | Unemployed |
| Less than High School | 42 (16.4%) | 0 (0.0%) |
| High School Diploma | 295 (45.5%) | 0 (0.0%) |
| College / Associate Degree | 245 (46.1%) | 84 (15.9%) |
| Bachelor's Degree or higher | 184 (96.3%) | 0 (0.0%) |
| Total | 766 (47.1%) | 83 (5.1%) |
Employment Occupations by Sex in Williamson
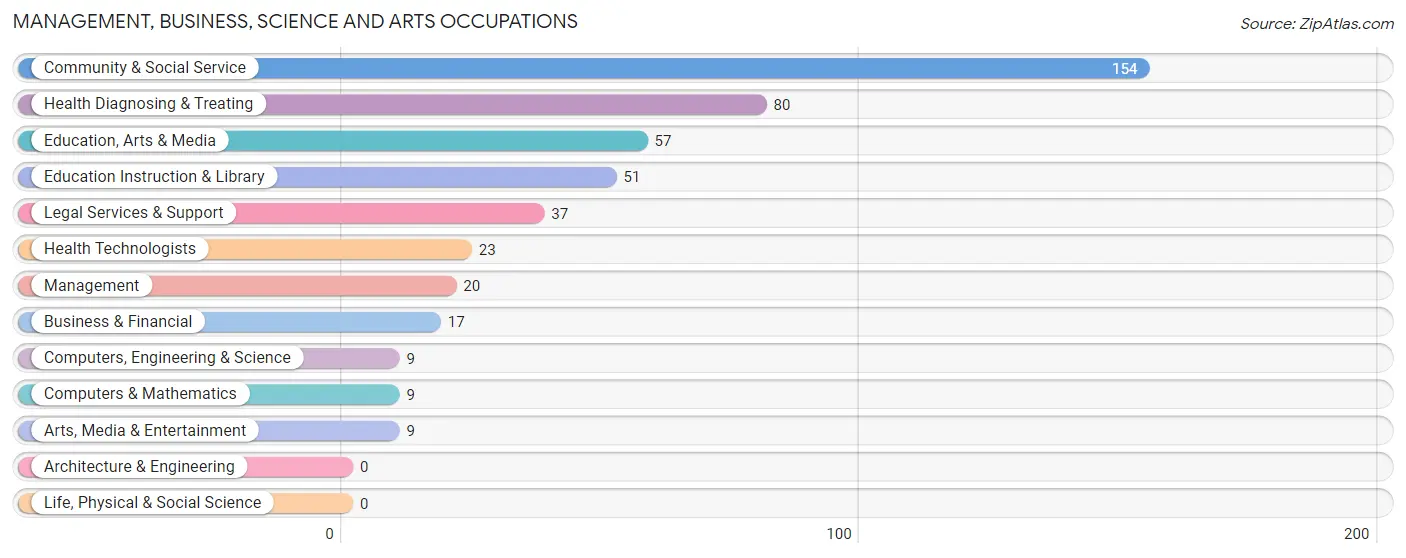
Management, Business, Science and Arts Occupations
The most common Management, Business, Science and Arts occupations in Williamson are Community & Social Service (154 | 18.6%), Health Diagnosing & Treating (80 | 9.7%), Education, Arts & Media (57 | 6.9%), Education Instruction & Library (51 | 6.2%), and Legal Services & Support (37 | 4.5%).
Management, Business, Science and Arts Occupations by Sex
Within the Management, Business, Science and Arts occupations in Williamson, the most male-oriented occupations are Computers, Engineering & Science (100.0%), Computers & Mathematics (100.0%), and Management (45.0%), while the most female-oriented occupations are Community & Social Service (100.0%), Education, Arts & Media (100.0%), and Legal Services & Support (100.0%).
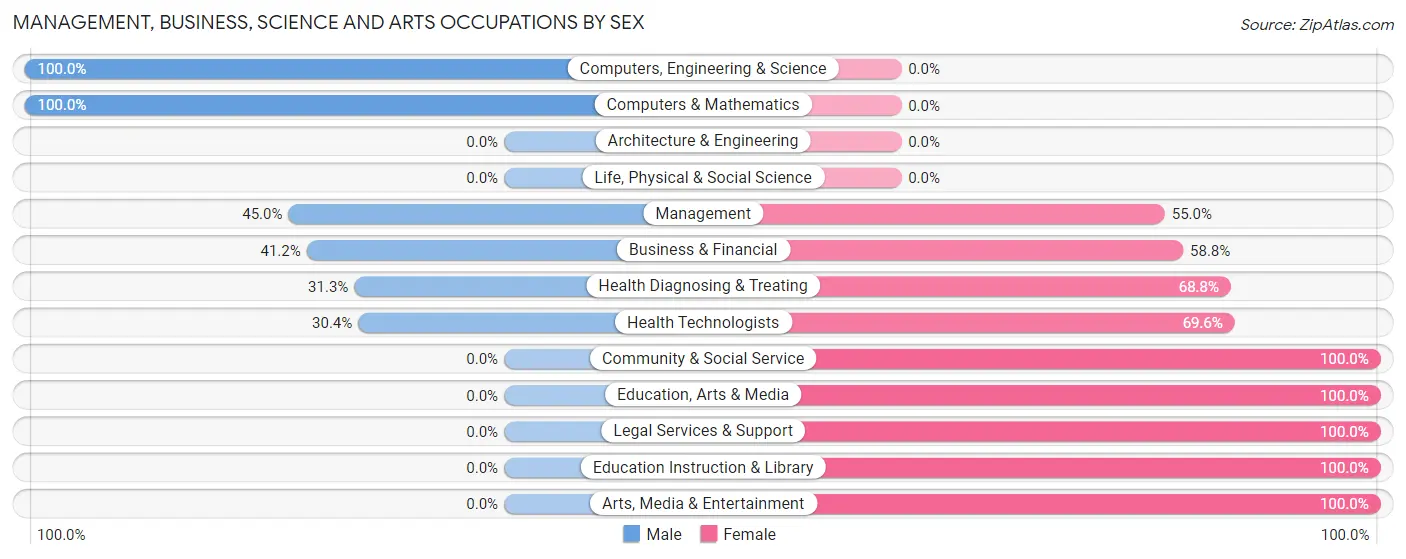
| Occupation | Male | Female |
| Management | 9 (45.0%) | 11 (55.0%) |
| Business & Financial | 7 (41.2%) | 10 (58.8%) |
| Computers, Engineering & Science | 9 (100.0%) | 0 (0.0%) |
| Computers & Mathematics | 9 (100.0%) | 0 (0.0%) |
| Architecture & Engineering | 0 (0.0%) | 0 (0.0%) |
| Life, Physical & Social Science | 0 (0.0%) | 0 (0.0%) |
| Community & Social Service | 0 (0.0%) | 154 (100.0%) |
| Education, Arts & Media | 0 (0.0%) | 57 (100.0%) |
| Legal Services & Support | 0 (0.0%) | 37 (100.0%) |
| Education Instruction & Library | 0 (0.0%) | 51 (100.0%) |
| Arts, Media & Entertainment | 0 (0.0%) | 9 (100.0%) |
| Health Diagnosing & Treating | 25 (31.2%) | 55 (68.8%) |
| Health Technologists | 7 (30.4%) | 16 (69.6%) |
| Total (Category) | 50 (17.9%) | 230 (82.1%) |
| Total (Overall) | 387 (46.9%) | 439 (53.1%) |
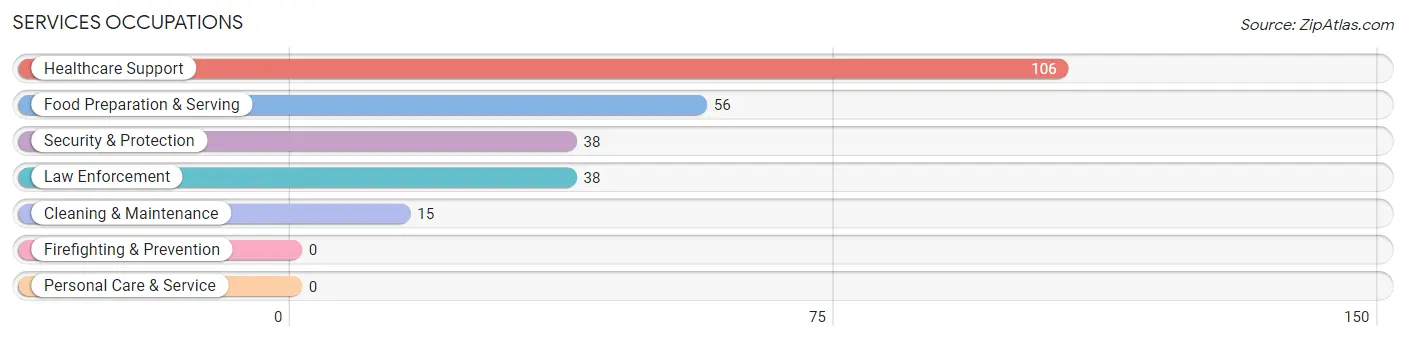
Services Occupations
The most common Services occupations in Williamson are Healthcare Support (106 | 12.8%), Food Preparation & Serving (56 | 6.8%), Security & Protection (38 | 4.6%), Law Enforcement (38 | 4.6%), and Cleaning & Maintenance (15 | 1.8%).
Services Occupations by Sex
Within the Services occupations in Williamson, the most male-oriented occupations are Security & Protection (100.0%), Law Enforcement (100.0%), and Cleaning & Maintenance (100.0%), while the most female-oriented occupations are Healthcare Support (93.4%), and Food Preparation & Serving (82.1%).
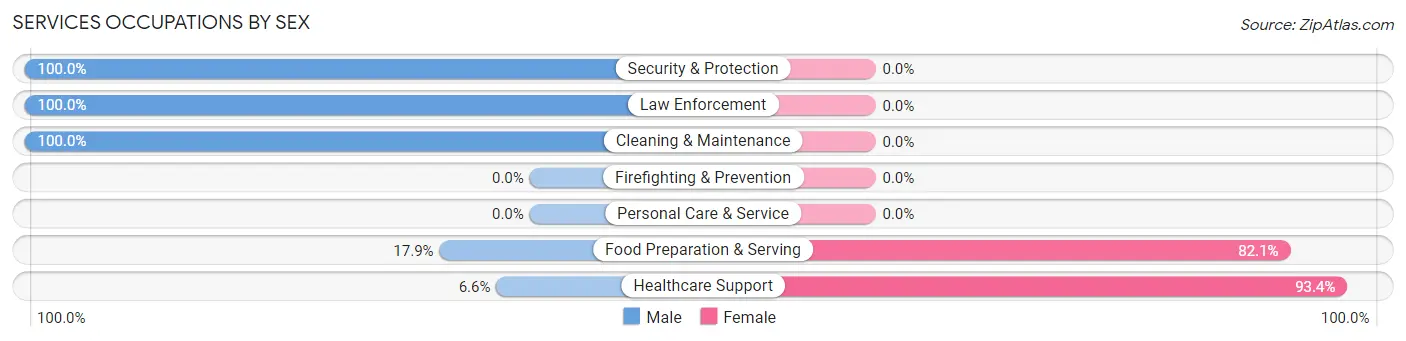
| Occupation | Male | Female |
| Healthcare Support | 7 (6.6%) | 99 (93.4%) |
| Security & Protection | 38 (100.0%) | 0 (0.0%) |
| Firefighting & Prevention | 0 (0.0%) | 0 (0.0%) |
| Law Enforcement | 38 (100.0%) | 0 (0.0%) |
| Food Preparation & Serving | 10 (17.9%) | 46 (82.1%) |
| Cleaning & Maintenance | 15 (100.0%) | 0 (0.0%) |
| Personal Care & Service | 0 (0.0%) | 0 (0.0%) |
| Total (Category) | 70 (32.6%) | 145 (67.4%) |
| Total (Overall) | 387 (46.9%) | 439 (53.1%) |
Sales and Office Occupations
The most common Sales and Office occupations in Williamson are Sales & Related (88 | 10.6%), and Office & Administration (70 | 8.5%).
Sales and Office Occupations by Sex
| Occupation | Male | Female |
| Sales & Related | 40 (45.5%) | 48 (54.5%) |
| Office & Administration | 55 (78.6%) | 15 (21.4%) |
| Total (Category) | 95 (60.1%) | 63 (39.9%) |
| Total (Overall) | 387 (46.9%) | 439 (53.1%) |
Natural Resources, Construction and Maintenance Occupations
The most common Natural Resources, Construction and Maintenance occupations in Williamson are Construction & Extraction (121 | 14.6%), and Installation, Maintenance & Repair (14 | 1.7%).
Natural Resources, Construction and Maintenance Occupations by Sex
| Occupation | Male | Female |
| Farming, Fishing & Forestry | 0 (0.0%) | 0 (0.0%) |
| Construction & Extraction | 121 (100.0%) | 0 (0.0%) |
| Installation, Maintenance & Repair | 14 (100.0%) | 0 (0.0%) |
| Total (Category) | 135 (100.0%) | 0 (0.0%) |
| Total (Overall) | 387 (46.9%) | 439 (53.1%) |
Production, Transportation and Moving Occupations
The most common Production, Transportation and Moving occupations in Williamson are Transportation (27 | 3.3%), and Production (11 | 1.3%).
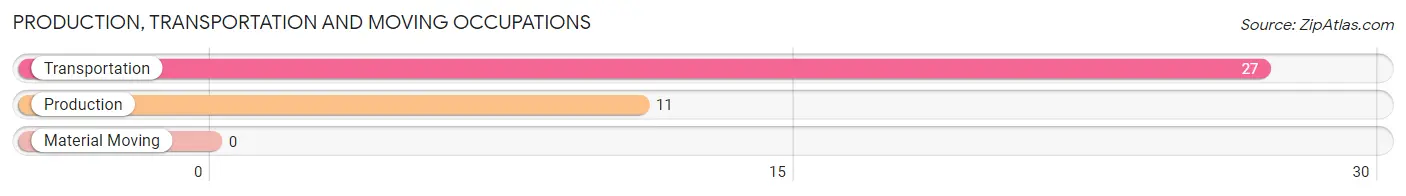
Production, Transportation and Moving Occupations by Sex
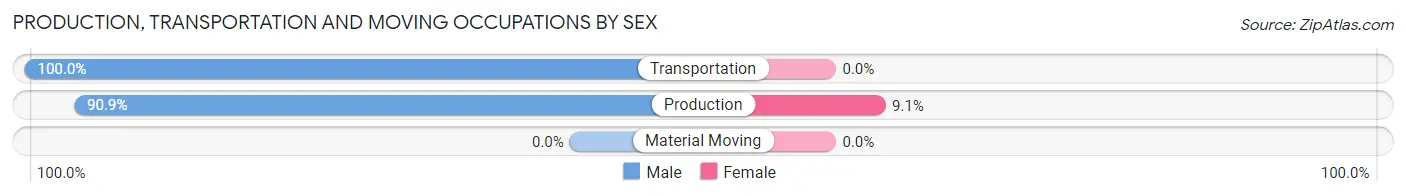
| Occupation | Male | Female |
| Production | 10 (90.9%) | 1 (9.1%) |
| Transportation | 27 (100.0%) | 0 (0.0%) |
| Material Moving | 0 (0.0%) | 0 (0.0%) |
| Total (Category) | 37 (97.4%) | 1 (2.6%) |
| Total (Overall) | 387 (46.9%) | 439 (53.1%) |
Employment Industries by Sex in Williamson
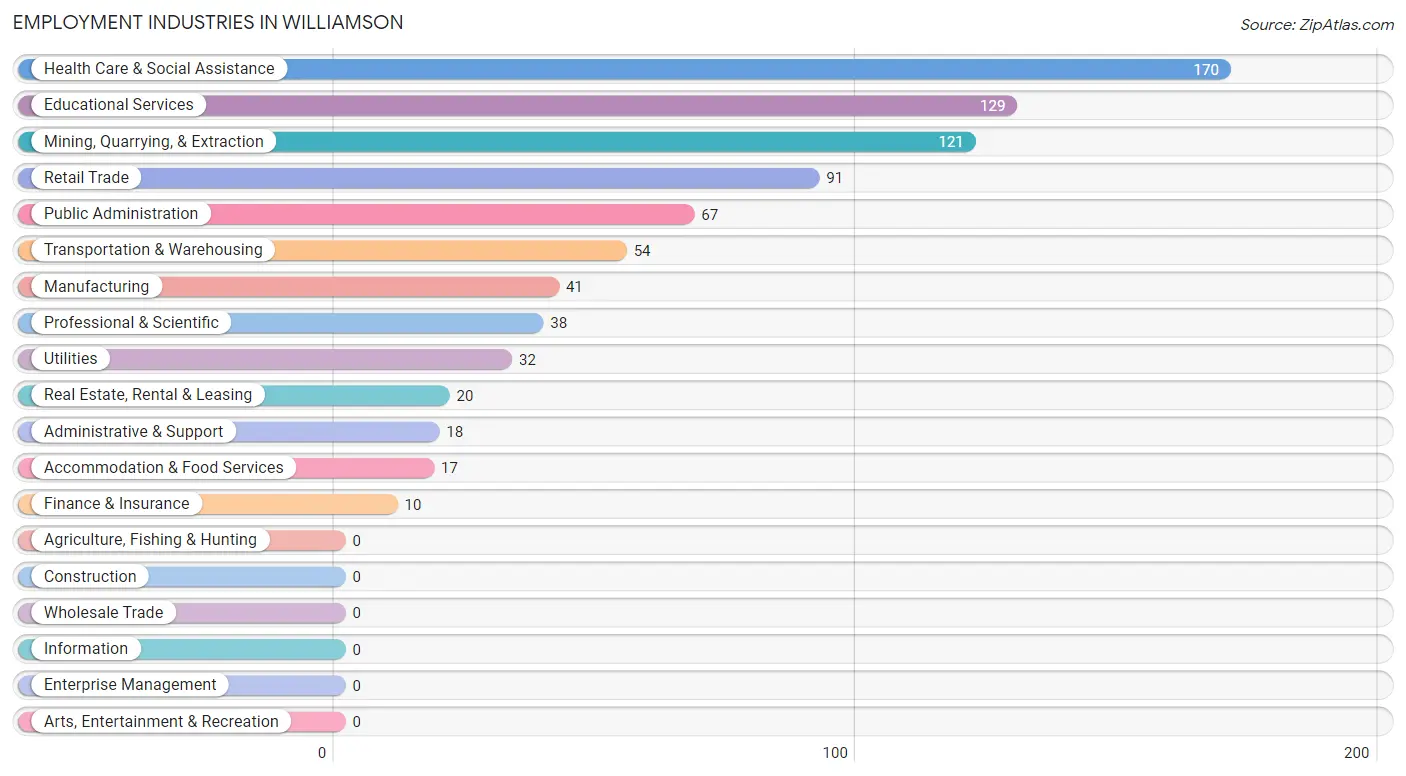
Employment Industries in Williamson
The major employment industries in Williamson include Health Care & Social Assistance (170 | 20.6%), Educational Services (129 | 15.6%), Mining, Quarrying, & Extraction (121 | 14.6%), Retail Trade (91 | 11.0%), and Public Administration (67 | 8.1%).
Employment Industries by Sex in Williamson
The Williamson industries that see more men than women are Mining, Quarrying, & Extraction (100.0%), Transportation & Warehousing (100.0%), and Utilities (100.0%), whereas the industries that tend to have a higher number of women are Finance & Insurance (100.0%), Real Estate, Rental & Leasing (100.0%), and Professional & Scientific (100.0%).
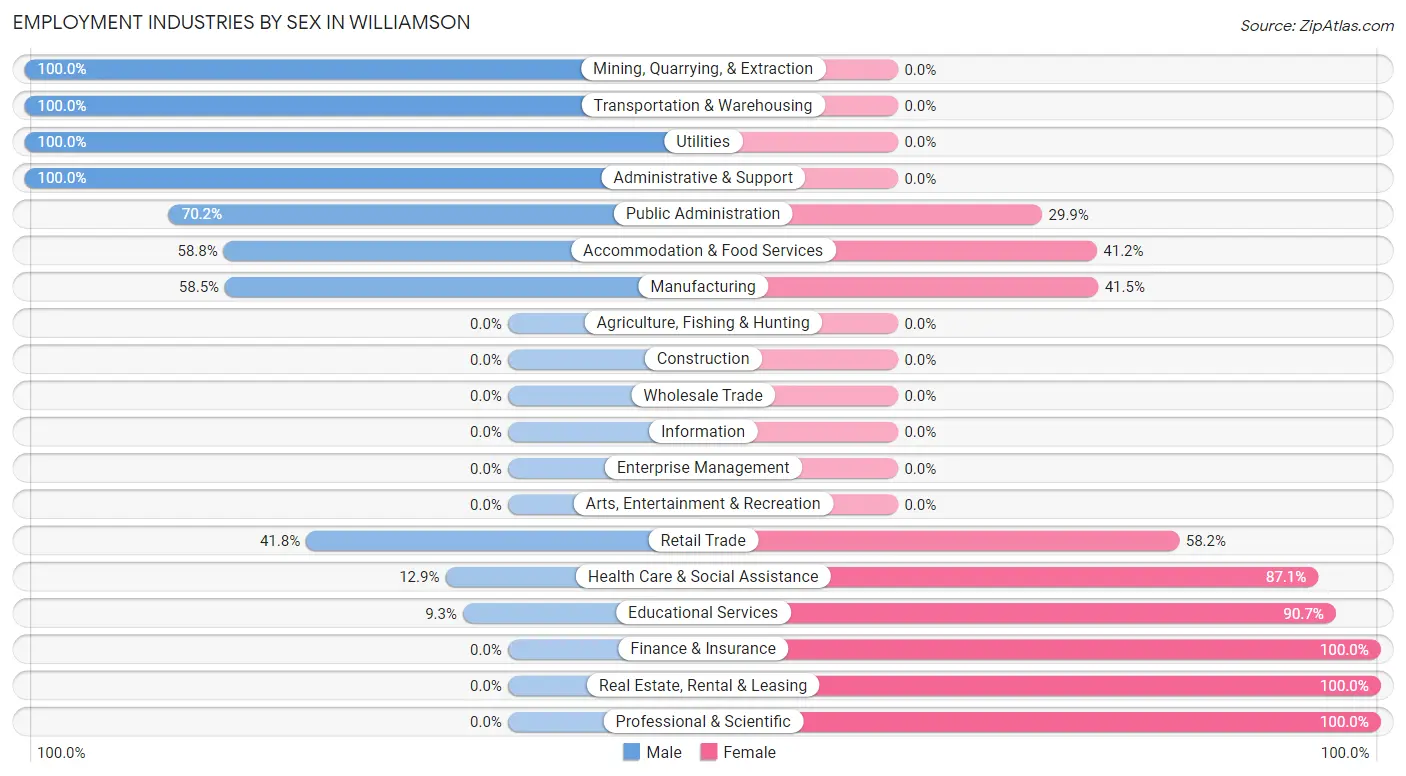
| Industry | Male | Female |
| Agriculture, Fishing & Hunting | 0 (0.0%) | 0 (0.0%) |
| Mining, Quarrying, & Extraction | 121 (100.0%) | 0 (0.0%) |
| Construction | 0 (0.0%) | 0 (0.0%) |
| Manufacturing | 24 (58.5%) | 17 (41.5%) |
| Wholesale Trade | 0 (0.0%) | 0 (0.0%) |
| Retail Trade | 38 (41.8%) | 53 (58.2%) |
| Transportation & Warehousing | 54 (100.0%) | 0 (0.0%) |
| Utilities | 32 (100.0%) | 0 (0.0%) |
| Information | 0 (0.0%) | 0 (0.0%) |
| Finance & Insurance | 0 (0.0%) | 10 (100.0%) |
| Real Estate, Rental & Leasing | 0 (0.0%) | 20 (100.0%) |
| Professional & Scientific | 0 (0.0%) | 38 (100.0%) |
| Enterprise Management | 0 (0.0%) | 0 (0.0%) |
| Administrative & Support | 18 (100.0%) | 0 (0.0%) |
| Educational Services | 12 (9.3%) | 117 (90.7%) |
| Health Care & Social Assistance | 22 (12.9%) | 148 (87.1%) |
| Arts, Entertainment & Recreation | 0 (0.0%) | 0 (0.0%) |
| Accommodation & Food Services | 10 (58.8%) | 7 (41.2%) |
| Public Administration | 47 (70.2%) | 20 (29.8%) |
| Total | 387 (46.9%) | 439 (53.1%) |
Education in Williamson
School Enrollment in Williamson
The most common levels of schooling among the 754 students in Williamson are high school (304 | 40.3%), elementary school (243 | 32.2%), and middle school (81 | 10.7%).
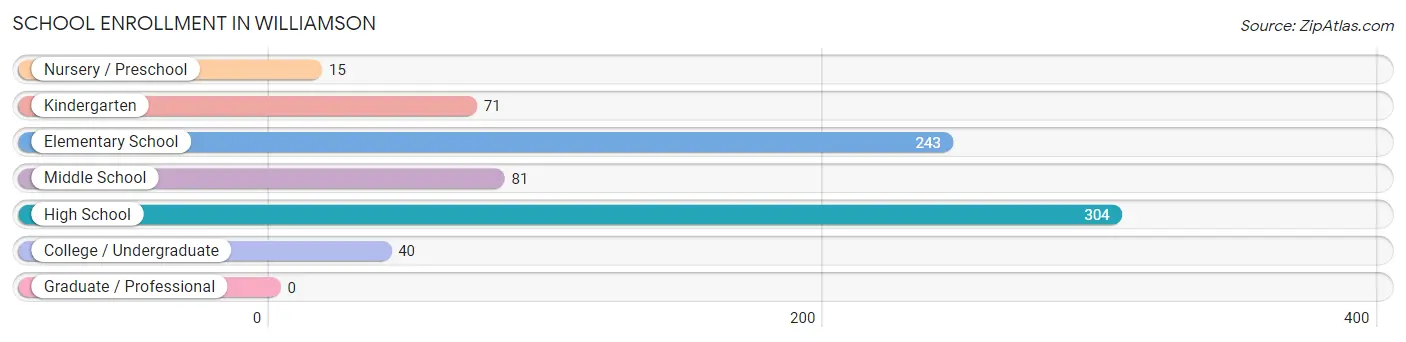
| School Level | # Students | % Students |
| Nursery / Preschool | 15 | 2.0% |
| Kindergarten | 71 | 9.4% |
| Elementary School | 243 | 32.2% |
| Middle School | 81 | 10.7% |
| High School | 304 | 40.3% |
| College / Undergraduate | 40 | 5.3% |
| Graduate / Professional | 0 | 0.0% |
| Total | 754 | 100.0% |
School Enrollment by Age by Funding Source in Williamson
Out of a total of 754 students who are enrolled in schools in Williamson, 19 (2.5%) attend a private institution, while the remaining 735 (97.5%) are enrolled in public schools. The age group of 10 to 14 year olds has the highest likelihood of being enrolled in private schools, with 9 (6.1% in the age bracket) enrolled. Conversely, the age group of 3 to 4 year olds has the lowest likelihood of being enrolled in a private school, with 47 (100.0% in the age bracket) attending a public institution.
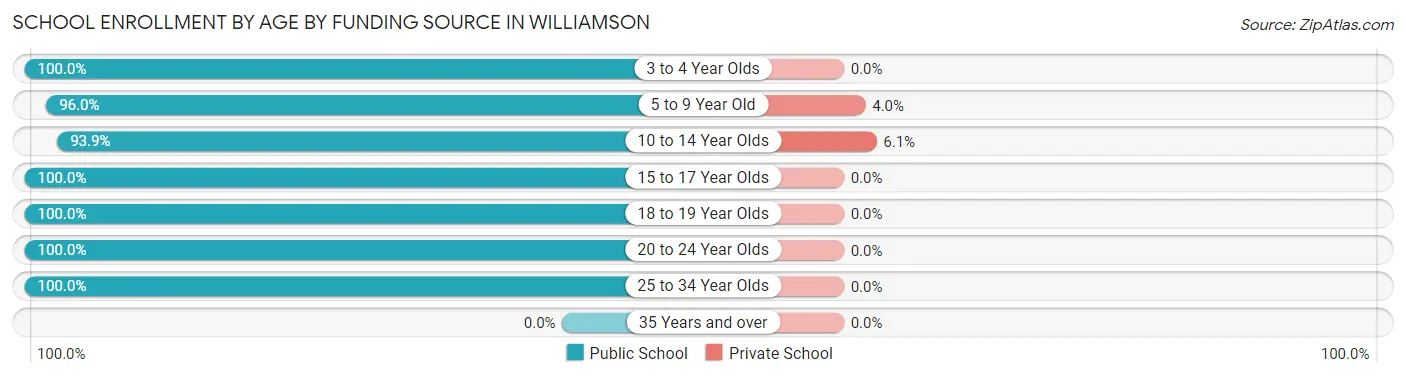
| Age Bracket | Public School | Private School |
| 3 to 4 Year Olds | 47 (100.0%) | 0 (0.0%) |
| 5 to 9 Year Old | 238 (96.0%) | 10 (4.0%) |
| 10 to 14 Year Olds | 139 (93.9%) | 9 (6.1%) |
| 15 to 17 Year Olds | 270 (100.0%) | 0 (0.0%) |
| 18 to 19 Year Olds | 7 (100.0%) | 0 (0.0%) |
| 20 to 24 Year Olds | 9 (100.0%) | 0 (0.0%) |
| 25 to 34 Year Olds | 25 (100.0%) | 0 (0.0%) |
| 35 Years and over | 0 (0.0%) | 0 (0.0%) |
| Total | 735 (97.5%) | 19 (2.5%) |
Educational Attainment by Field of Study in Williamson
Education (96 | 34.0%), business (52 | 18.4%), science & technology (35 | 12.4%), psychology (32 | 11.4%), and computers & mathematics (19 | 6.7%) are the most common fields of study among 282 individuals in Williamson who have obtained a bachelor's degree or higher.
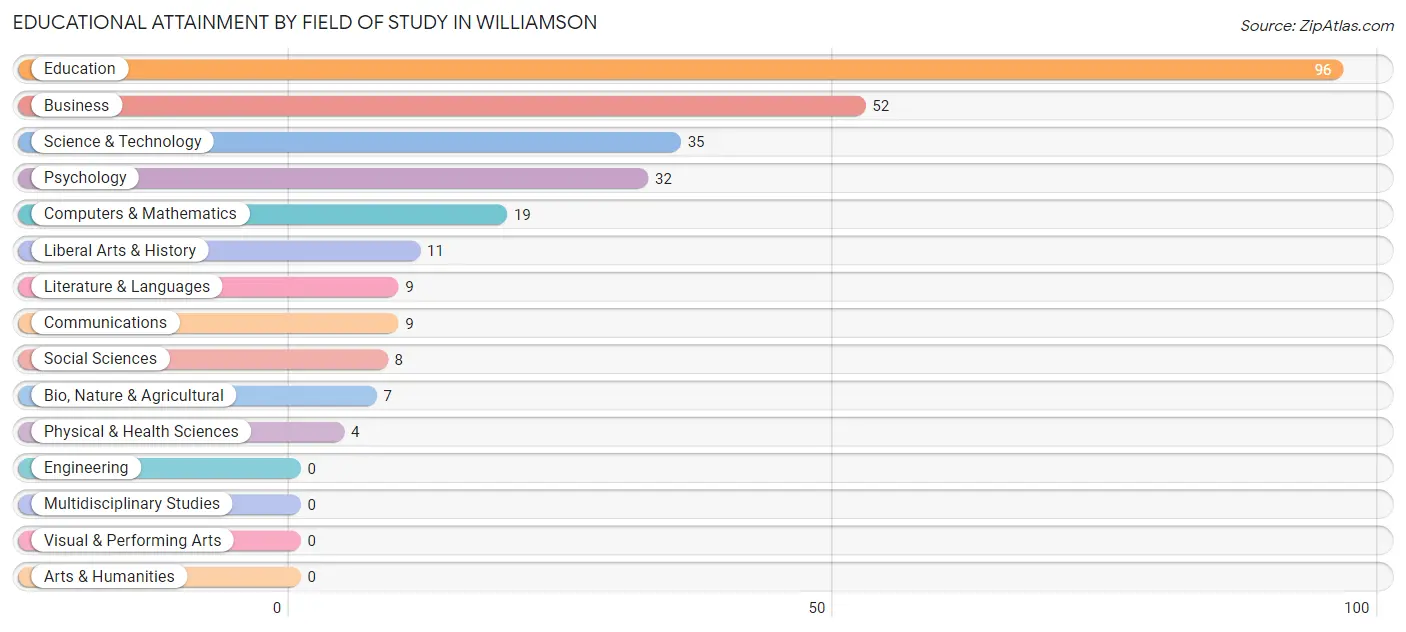
| Field of Study | # Graduates | % Graduates |
| Computers & Mathematics | 19 | 6.7% |
| Bio, Nature & Agricultural | 7 | 2.5% |
| Physical & Health Sciences | 4 | 1.4% |
| Psychology | 32 | 11.4% |
| Social Sciences | 8 | 2.8% |
| Engineering | 0 | 0.0% |
| Multidisciplinary Studies | 0 | 0.0% |
| Science & Technology | 35 | 12.4% |
| Business | 52 | 18.4% |
| Education | 96 | 34.0% |
| Literature & Languages | 9 | 3.2% |
| Liberal Arts & History | 11 | 3.9% |
| Visual & Performing Arts | 0 | 0.0% |
| Communications | 9 | 3.2% |
| Arts & Humanities | 0 | 0.0% |
| Total | 282 | 100.0% |
Transportation & Commute in Williamson
Vehicle Availability by Sex in Williamson
The most prevalent vehicle ownership categories in Williamson are males with 2 vehicles (122, accounting for 32.1%) and females with 2 vehicles (171, making up 28.6%).
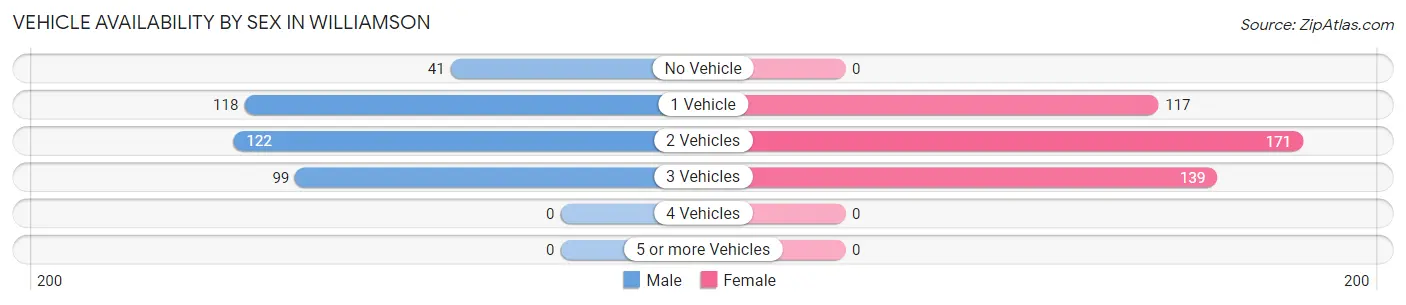
| Vehicles Available | Male | Female |
| No Vehicle | 41 (10.8%) | 0 (0.0%) |
| 1 Vehicle | 118 (31.0%) | 117 (27.4%) |
| 2 Vehicles | 122 (32.1%) | 171 (40.1%) |
| 3 Vehicles | 99 (26.1%) | 139 (32.6%) |
| 4 Vehicles | 0 (0.0%) | 0 (0.0%) |
| 5 or more Vehicles | 0 (0.0%) | 0 (0.0%) |
| Total | 380 (100.0%) | 427 (100.0%) |
Commute Time in Williamson
The most frequently occuring commute durations in Williamson are less than 5 minutes (143 commuters, 19.3%), 30 to 34 minutes (114 commuters, 15.4%), and 45 to 59 minutes (104 commuters, 14.0%).
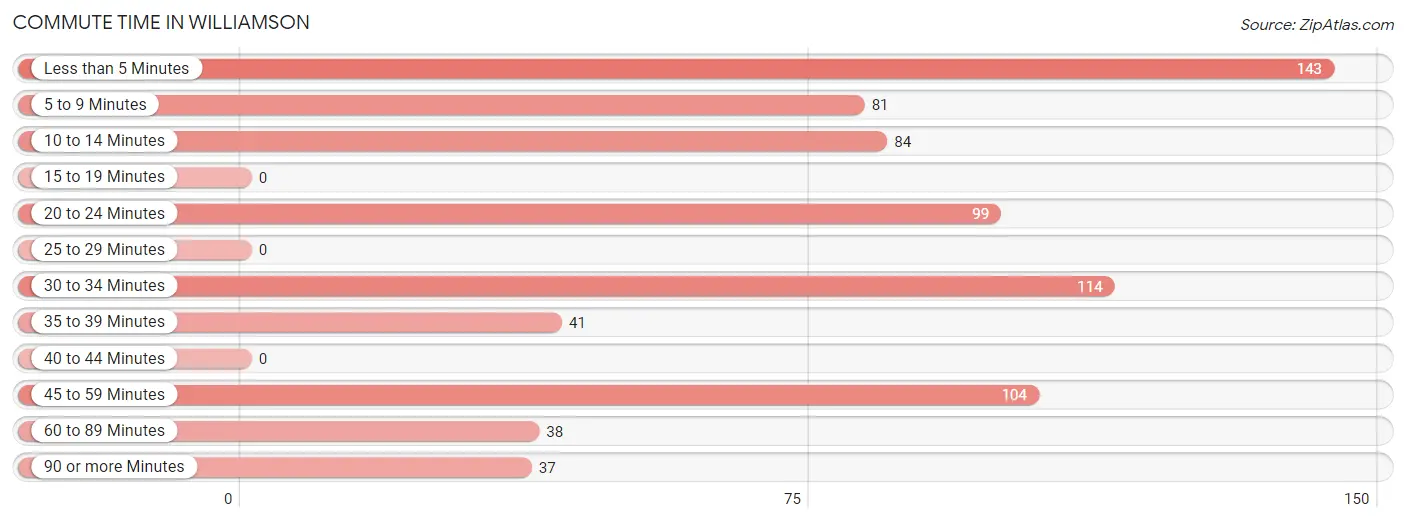
| Commute Time | # Commuters | % Commuters |
| Less than 5 Minutes | 143 | 19.3% |
| 5 to 9 Minutes | 81 | 10.9% |
| 10 to 14 Minutes | 84 | 11.3% |
| 15 to 19 Minutes | 0 | 0.0% |
| 20 to 24 Minutes | 99 | 13.4% |
| 25 to 29 Minutes | 0 | 0.0% |
| 30 to 34 Minutes | 114 | 15.4% |
| 35 to 39 Minutes | 41 | 5.5% |
| 40 to 44 Minutes | 0 | 0.0% |
| 45 to 59 Minutes | 104 | 14.0% |
| 60 to 89 Minutes | 38 | 5.1% |
| 90 or more Minutes | 37 | 5.0% |
Commute Time by Sex in Williamson
The most common commute times in Williamson are 30 to 34 minutes (80 commuters, 22.1%) for males and less than 5 minutes (96 commuters, 25.3%) for females.
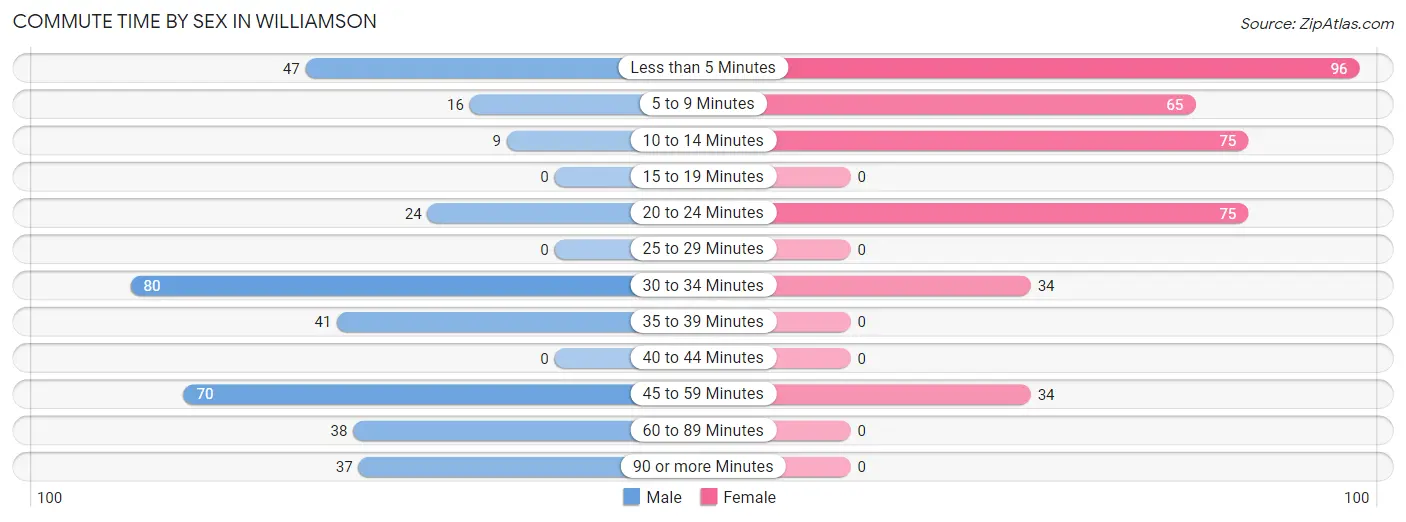
| Commute Time | Male | Female |
| Less than 5 Minutes | 47 (13.0%) | 96 (25.3%) |
| 5 to 9 Minutes | 16 (4.4%) | 65 (17.2%) |
| 10 to 14 Minutes | 9 (2.5%) | 75 (19.8%) |
| 15 to 19 Minutes | 0 (0.0%) | 0 (0.0%) |
| 20 to 24 Minutes | 24 (6.6%) | 75 (19.8%) |
| 25 to 29 Minutes | 0 (0.0%) | 0 (0.0%) |
| 30 to 34 Minutes | 80 (22.1%) | 34 (9.0%) |
| 35 to 39 Minutes | 41 (11.3%) | 0 (0.0%) |
| 40 to 44 Minutes | 0 (0.0%) | 0 (0.0%) |
| 45 to 59 Minutes | 70 (19.3%) | 34 (9.0%) |
| 60 to 89 Minutes | 38 (10.5%) | 0 (0.0%) |
| 90 or more Minutes | 37 (10.2%) | 0 (0.0%) |
Time of Departure to Work by Sex in Williamson
The most frequent times of departure to work in Williamson are 6:00 AM to 6:29 AM (93, 25.7%) for males and 6:30 AM to 6:59 AM (88, 23.2%) for females.
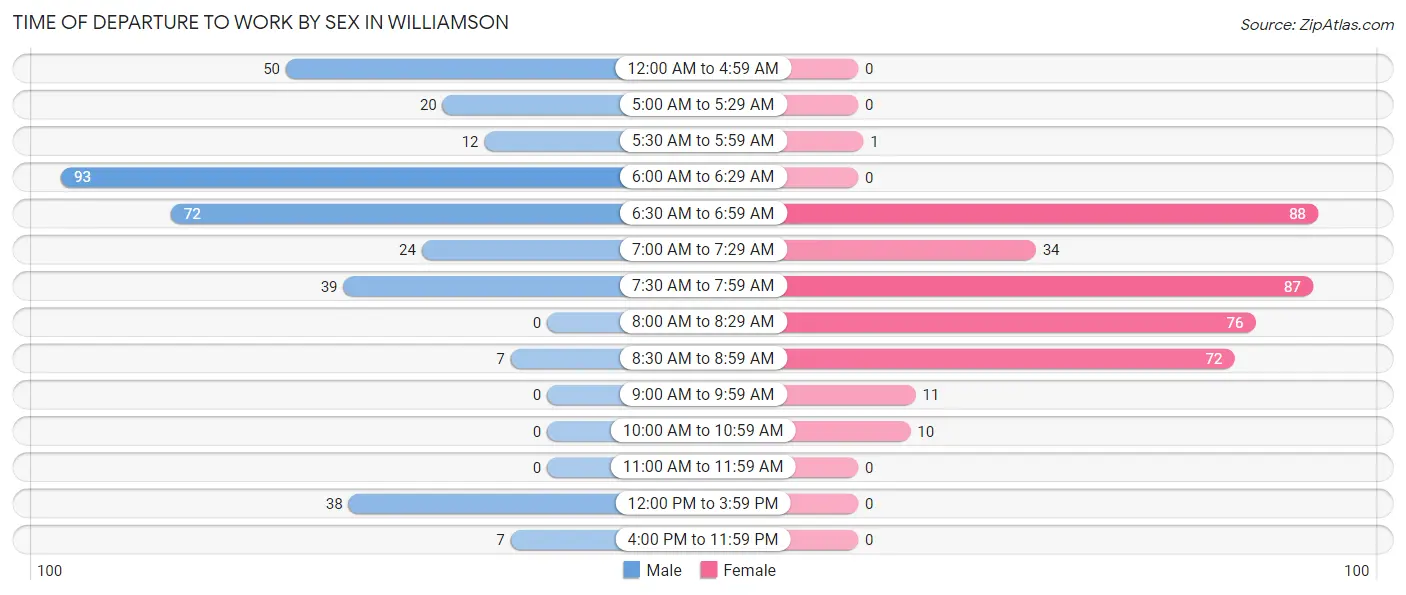
| Time of Departure | Male | Female |
| 12:00 AM to 4:59 AM | 50 (13.8%) | 0 (0.0%) |
| 5:00 AM to 5:29 AM | 20 (5.5%) | 0 (0.0%) |
| 5:30 AM to 5:59 AM | 12 (3.3%) | 1 (0.3%) |
| 6:00 AM to 6:29 AM | 93 (25.7%) | 0 (0.0%) |
| 6:30 AM to 6:59 AM | 72 (19.9%) | 88 (23.2%) |
| 7:00 AM to 7:29 AM | 24 (6.6%) | 34 (9.0%) |
| 7:30 AM to 7:59 AM | 39 (10.8%) | 87 (23.0%) |
| 8:00 AM to 8:29 AM | 0 (0.0%) | 76 (20.1%) |
| 8:30 AM to 8:59 AM | 7 (1.9%) | 72 (19.0%) |
| 9:00 AM to 9:59 AM | 0 (0.0%) | 11 (2.9%) |
| 10:00 AM to 10:59 AM | 0 (0.0%) | 10 (2.6%) |
| 11:00 AM to 11:59 AM | 0 (0.0%) | 0 (0.0%) |
| 12:00 PM to 3:59 PM | 38 (10.5%) | 0 (0.0%) |
| 4:00 PM to 11:59 PM | 7 (1.9%) | 0 (0.0%) |
| Total | 362 (100.0%) | 379 (100.0%) |
Housing Occupancy in Williamson
Occupancy by Ownership in Williamson
Of the total 1,350 dwellings in Williamson, owner-occupied units account for 524 (38.8%), while renter-occupied units make up 826 (61.2%).
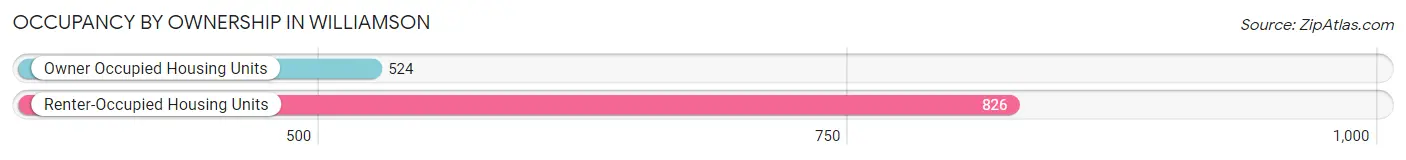
| Occupancy | # Housing Units | % Housing Units |
| Owner Occupied Housing Units | 524 | 38.8% |
| Renter-Occupied Housing Units | 826 | 61.2% |
| Total Occupied Housing Units | 1,350 | 100.0% |
Occupancy by Household Size in Williamson
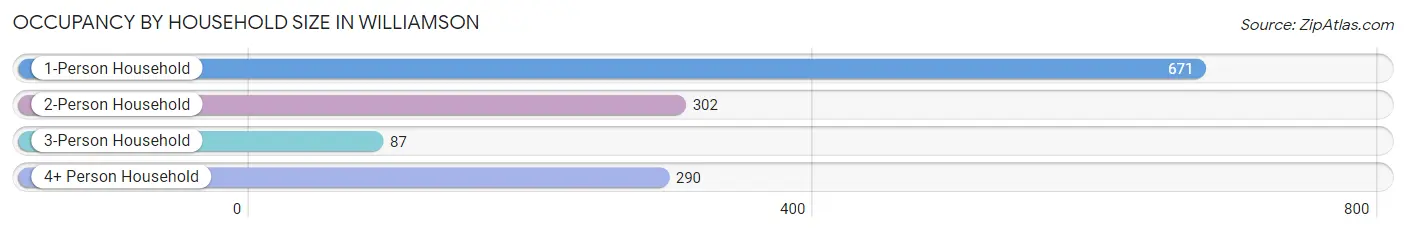
| Household Size | # Housing Units | % Housing Units |
| 1-Person Household | 671 | 49.7% |
| 2-Person Household | 302 | 22.4% |
| 3-Person Household | 87 | 6.4% |
| 4+ Person Household | 290 | 21.5% |
| Total Housing Units | 1,350 | 100.0% |
Occupancy by Ownership by Household Size in Williamson
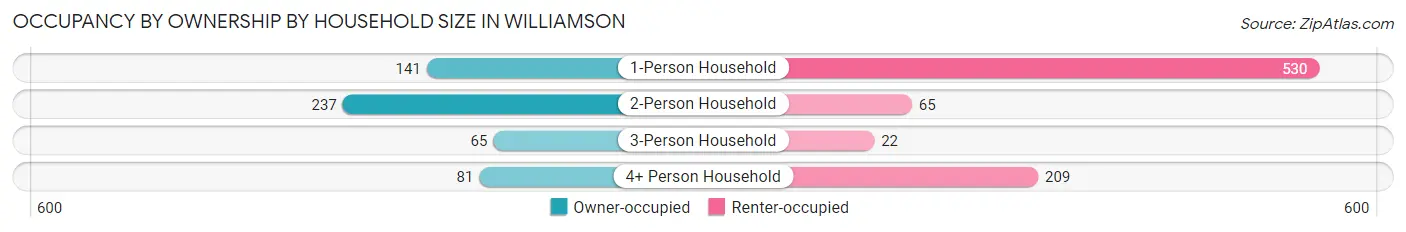
| Household Size | Owner-occupied | Renter-occupied |
| 1-Person Household | 141 (21.0%) | 530 (79.0%) |
| 2-Person Household | 237 (78.5%) | 65 (21.5%) |
| 3-Person Household | 65 (74.7%) | 22 (25.3%) |
| 4+ Person Household | 81 (27.9%) | 209 (72.1%) |
| Total Housing Units | 524 (38.8%) | 826 (61.2%) |
Occupancy by Educational Attainment in Williamson
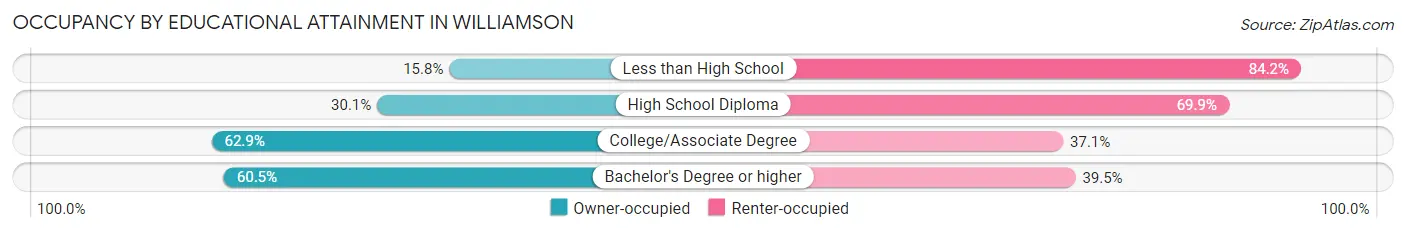
| Household Size | Owner-occupied | Renter-occupied |
| Less than High School | 46 (15.8%) | 245 (84.2%) |
| High School Diploma | 171 (30.1%) | 397 (69.9%) |
| College/Associate Degree | 258 (62.9%) | 152 (37.1%) |
| Bachelor's Degree or higher | 49 (60.5%) | 32 (39.5%) |
Occupancy by Age of Householder in Williamson
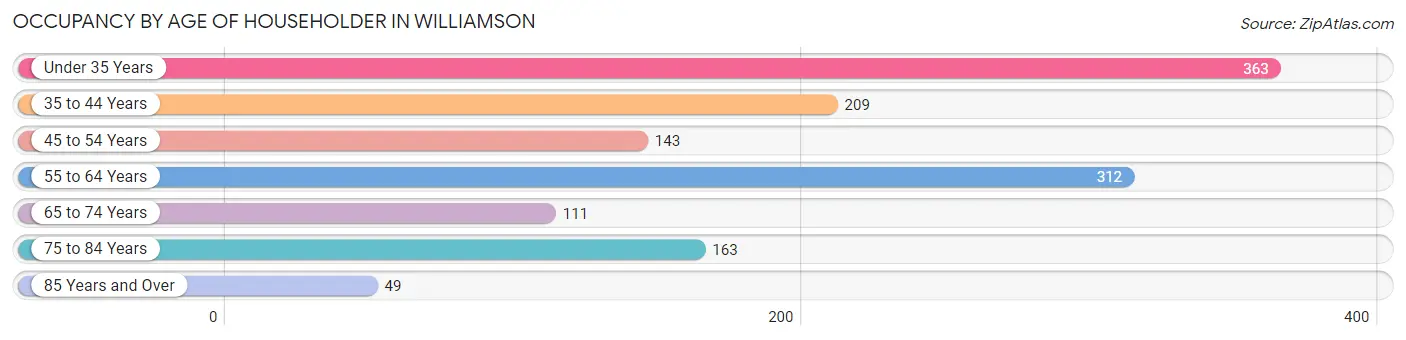
| Age Bracket | # Households | % Households |
| Under 35 Years | 363 | 26.9% |
| 35 to 44 Years | 209 | 15.5% |
| 45 to 54 Years | 143 | 10.6% |
| 55 to 64 Years | 312 | 23.1% |
| 65 to 74 Years | 111 | 8.2% |
| 75 to 84 Years | 163 | 12.1% |
| 85 Years and Over | 49 | 3.6% |
| Total | 1,350 | 100.0% |
Housing Finances in Williamson
Median Income by Occupancy in Williamson
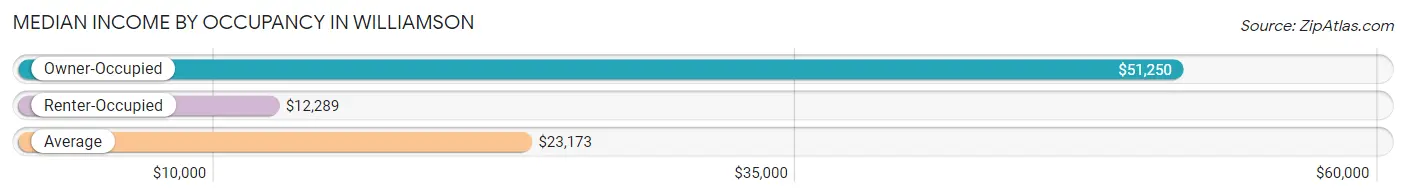
| Occupancy Type | # Households | Median Income |
| Owner-Occupied | 524 (38.8%) | $51,250 |
| Renter-Occupied | 826 (61.2%) | $12,289 |
| Average | 1,350 (100.0%) | $23,173 |
Occupancy by Householder Income Bracket in Williamson
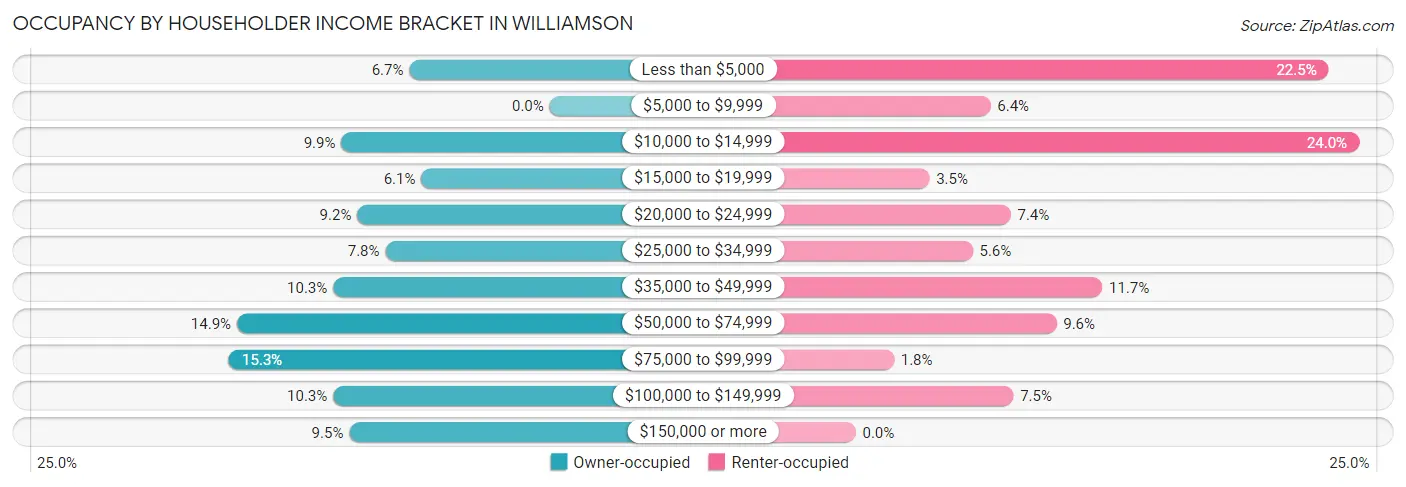
| Income Bracket | Owner-occupied | Renter-occupied |
| Less than $5,000 | 35 (6.7%) | 186 (22.5%) |
| $5,000 to $9,999 | 0 (0.0%) | 53 (6.4%) |
| $10,000 to $14,999 | 52 (9.9%) | 198 (24.0%) |
| $15,000 to $19,999 | 32 (6.1%) | 29 (3.5%) |
| $20,000 to $24,999 | 48 (9.2%) | 61 (7.4%) |
| $25,000 to $34,999 | 41 (7.8%) | 46 (5.6%) |
| $35,000 to $49,999 | 54 (10.3%) | 97 (11.7%) |
| $50,000 to $74,999 | 78 (14.9%) | 79 (9.6%) |
| $75,000 to $99,999 | 80 (15.3%) | 15 (1.8%) |
| $100,000 to $149,999 | 54 (10.3%) | 62 (7.5%) |
| $150,000 or more | 50 (9.5%) | 0 (0.0%) |
| Total | 524 (100.0%) | 826 (100.0%) |
Monthly Housing Cost Tiers in Williamson
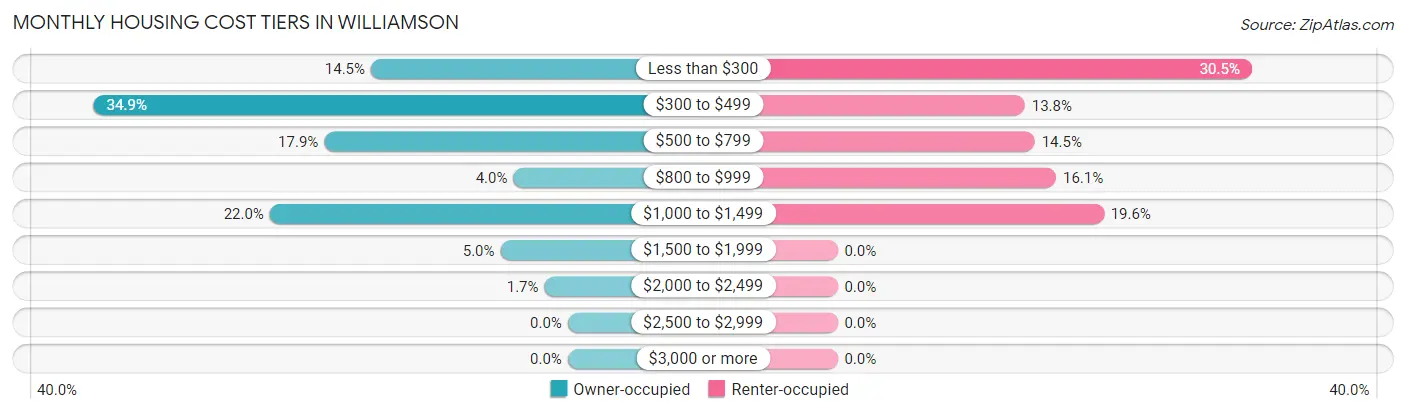
| Monthly Cost | Owner-occupied | Renter-occupied |
| Less than $300 | 76 (14.5%) | 252 (30.5%) |
| $300 to $499 | 183 (34.9%) | 114 (13.8%) |
| $500 to $799 | 94 (17.9%) | 120 (14.5%) |
| $800 to $999 | 21 (4.0%) | 133 (16.1%) |
| $1,000 to $1,499 | 115 (22.0%) | 162 (19.6%) |
| $1,500 to $1,999 | 26 (5.0%) | 0 (0.0%) |
| $2,000 to $2,499 | 9 (1.7%) | 0 (0.0%) |
| $2,500 to $2,999 | 0 (0.0%) | 0 (0.0%) |
| $3,000 or more | 0 (0.0%) | 0 (0.0%) |
| Total | 524 (100.0%) | 826 (100.0%) |
Physical Housing Characteristics in Williamson
Housing Structures in Williamson
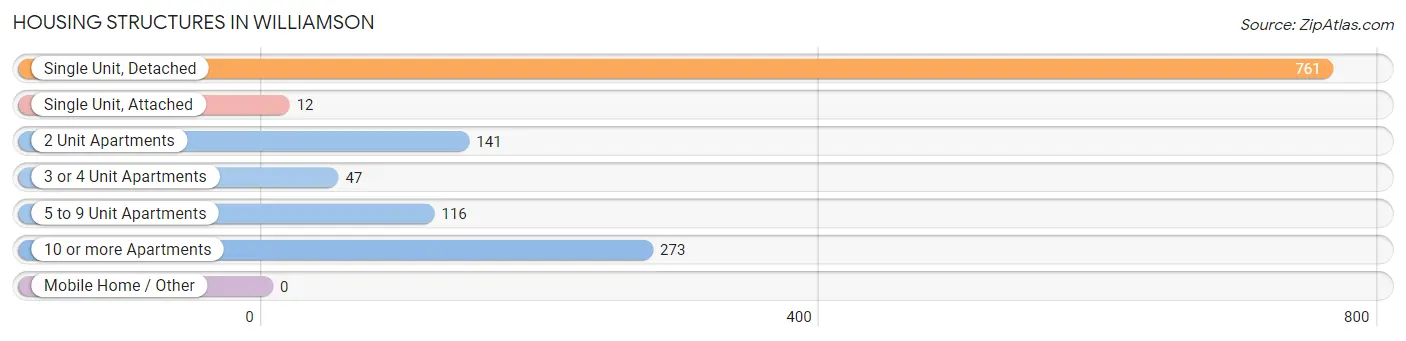
| Structure Type | # Housing Units | % Housing Units |
| Single Unit, Detached | 761 | 56.4% |
| Single Unit, Attached | 12 | 0.9% |
| 2 Unit Apartments | 141 | 10.4% |
| 3 or 4 Unit Apartments | 47 | 3.5% |
| 5 to 9 Unit Apartments | 116 | 8.6% |
| 10 or more Apartments | 273 | 20.2% |
| Mobile Home / Other | 0 | 0.0% |
| Total | 1,350 | 100.0% |
Housing Structures by Occupancy in Williamson
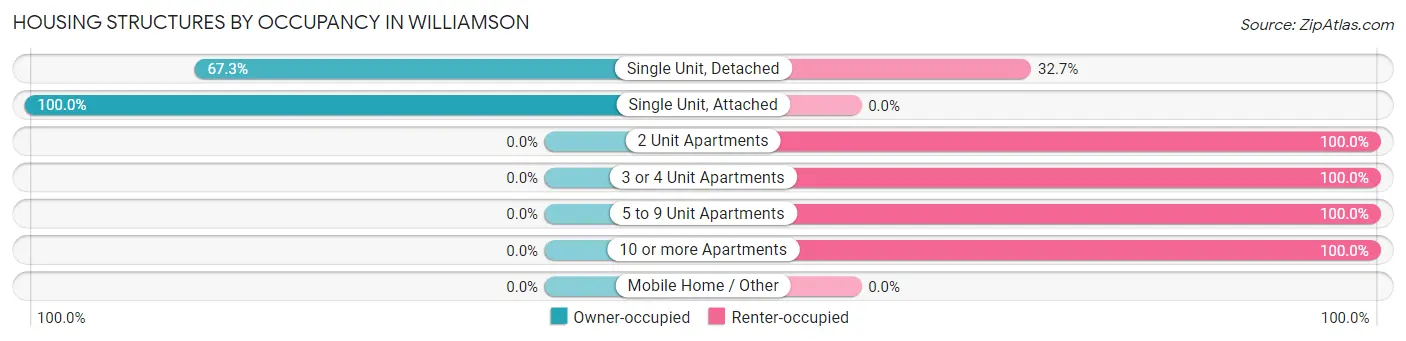
| Structure Type | Owner-occupied | Renter-occupied |
| Single Unit, Detached | 512 (67.3%) | 249 (32.7%) |
| Single Unit, Attached | 12 (100.0%) | 0 (0.0%) |
| 2 Unit Apartments | 0 (0.0%) | 141 (100.0%) |
| 3 or 4 Unit Apartments | 0 (0.0%) | 47 (100.0%) |
| 5 to 9 Unit Apartments | 0 (0.0%) | 116 (100.0%) |
| 10 or more Apartments | 0 (0.0%) | 273 (100.0%) |
| Mobile Home / Other | 0 (0.0%) | 0 (0.0%) |
| Total | 524 (38.8%) | 826 (61.2%) |
Housing Structures by Number of Rooms in Williamson
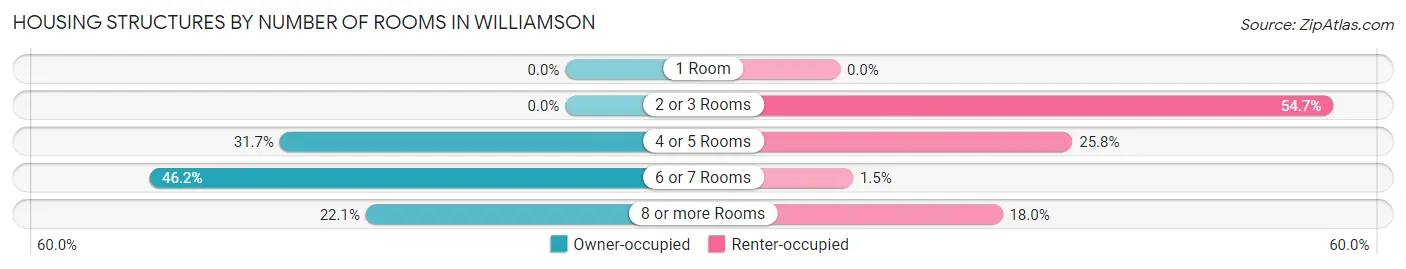
| Number of Rooms | Owner-occupied | Renter-occupied |
| 1 Room | 0 (0.0%) | 0 (0.0%) |
| 2 or 3 Rooms | 0 (0.0%) | 452 (54.7%) |
| 4 or 5 Rooms | 166 (31.7%) | 213 (25.8%) |
| 6 or 7 Rooms | 242 (46.2%) | 12 (1.5%) |
| 8 or more Rooms | 116 (22.1%) | 149 (18.0%) |
| Total | 524 (100.0%) | 826 (100.0%) |
Housing Structure by Heating Type in Williamson
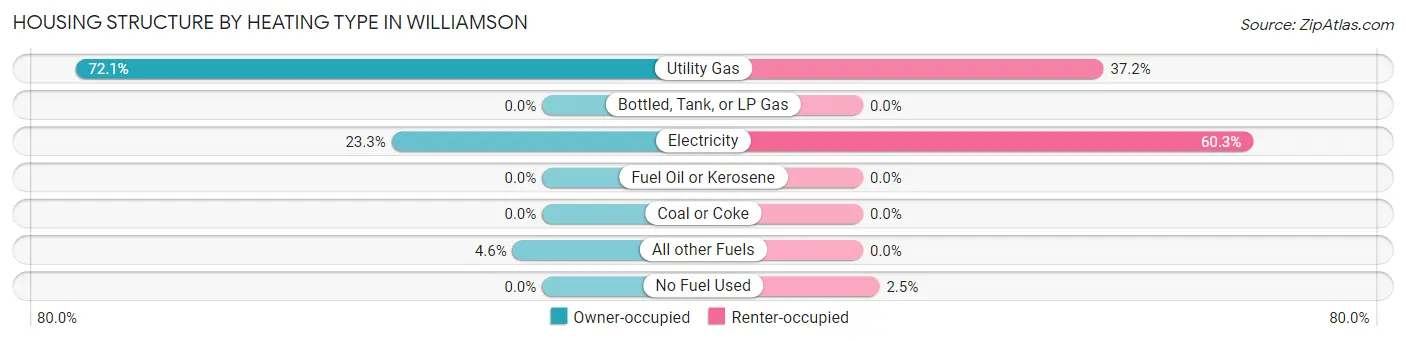
| Heating Type | Owner-occupied | Renter-occupied |
| Utility Gas | 378 (72.1%) | 307 (37.2%) |
| Bottled, Tank, or LP Gas | 0 (0.0%) | 0 (0.0%) |
| Electricity | 122 (23.3%) | 498 (60.3%) |
| Fuel Oil or Kerosene | 0 (0.0%) | 0 (0.0%) |
| Coal or Coke | 0 (0.0%) | 0 (0.0%) |
| All other Fuels | 24 (4.6%) | 0 (0.0%) |
| No Fuel Used | 0 (0.0%) | 21 (2.5%) |
| Total | 524 (100.0%) | 826 (100.0%) |
Household Vehicle Usage in Williamson
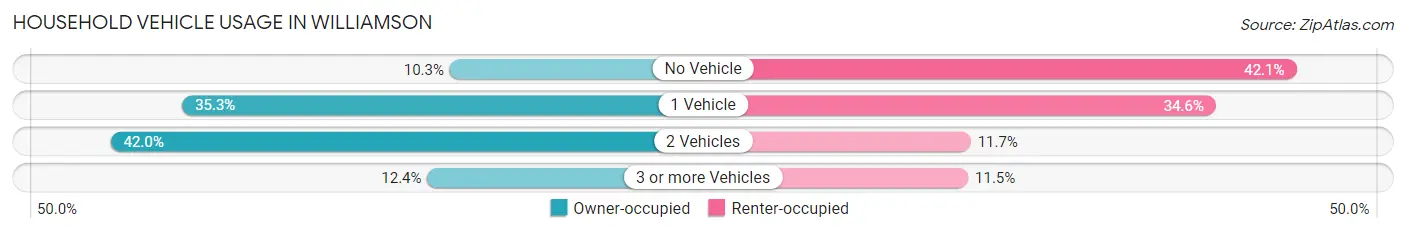
| Vehicles per Household | Owner-occupied | Renter-occupied |
| No Vehicle | 54 (10.3%) | 348 (42.1%) |
| 1 Vehicle | 185 (35.3%) | 286 (34.6%) |
| 2 Vehicles | 220 (42.0%) | 97 (11.7%) |
| 3 or more Vehicles | 65 (12.4%) | 95 (11.5%) |
| Total | 524 (100.0%) | 826 (100.0%) |
Real Estate & Mortgages in Williamson
Real Estate and Mortgage Overview in Williamson
| Characteristic | Without Mortgage | With Mortgage |
| Housing Units | 347 | 177 |
| Median Property Value | $91,000 | $118,500 |
| Median Household Income | $32,946 | $36 |
| Monthly Housing Costs | $387 | $0 |
| Real Estate Taxes | $536 | $13 |
Property Value by Mortgage Status in Williamson
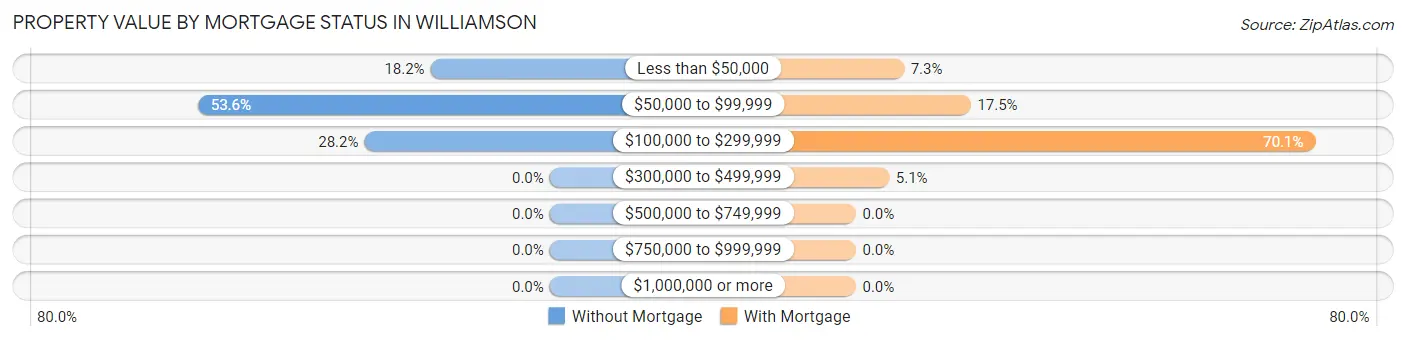
| Property Value | Without Mortgage | With Mortgage |
| Less than $50,000 | 63 (18.2%) | 13 (7.3%) |
| $50,000 to $99,999 | 186 (53.6%) | 31 (17.5%) |
| $100,000 to $299,999 | 98 (28.2%) | 124 (70.1%) |
| $300,000 to $499,999 | 0 (0.0%) | 9 (5.1%) |
| $500,000 to $749,999 | 0 (0.0%) | 0 (0.0%) |
| $750,000 to $999,999 | 0 (0.0%) | 0 (0.0%) |
| $1,000,000 or more | 0 (0.0%) | 0 (0.0%) |
| Total | 347 (100.0%) | 177 (100.0%) |
Household Income by Mortgage Status in Williamson
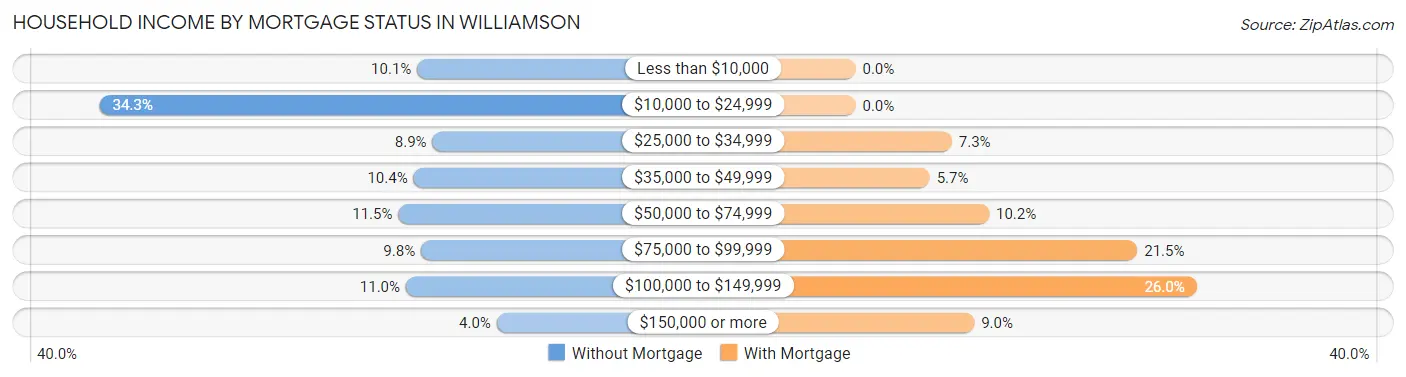
| Household Income | Without Mortgage | With Mortgage |
| Less than $10,000 | 35 (10.1%) | 0 (0.0%) |
| $10,000 to $24,999 | 119 (34.3%) | 0 (0.0%) |
| $25,000 to $34,999 | 31 (8.9%) | 13 (7.3%) |
| $35,000 to $49,999 | 36 (10.4%) | 10 (5.7%) |
| $50,000 to $74,999 | 40 (11.5%) | 18 (10.2%) |
| $75,000 to $99,999 | 34 (9.8%) | 38 (21.5%) |
| $100,000 to $149,999 | 38 (11.0%) | 46 (26.0%) |
| $150,000 or more | 14 (4.0%) | 16 (9.0%) |
| Total | 347 (100.0%) | 177 (100.0%) |
Property Value to Household Income Ratio in Williamson
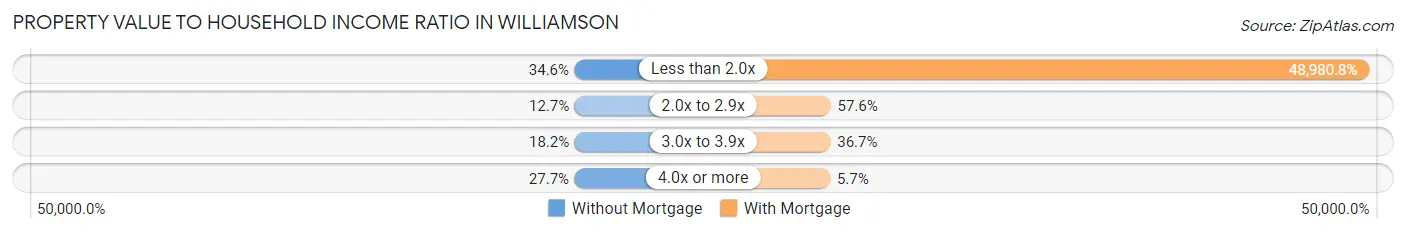
| Value-to-Income Ratio | Without Mortgage | With Mortgage |
| Less than 2.0x | 120 (34.6%) | 86,696 (48,980.8%) |
| 2.0x to 2.9x | 44 (12.7%) | 102 (57.6%) |
| 3.0x to 3.9x | 63 (18.2%) | 65 (36.7%) |
| 4.0x or more | 96 (27.7%) | 10 (5.7%) |
| Total | 347 (100.0%) | 177 (100.0%) |
Real Estate Taxes by Mortgage Status in Williamson
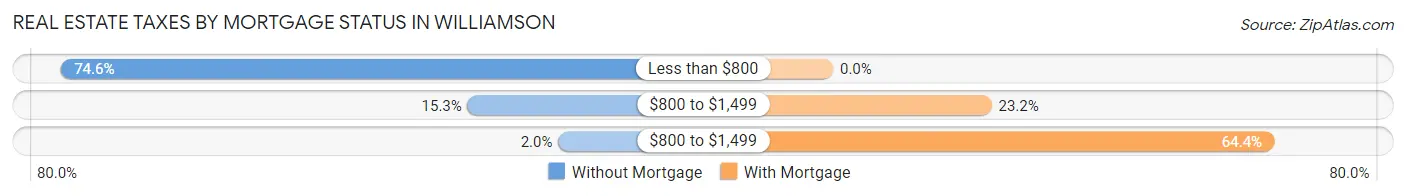
| Property Taxes | Without Mortgage | With Mortgage |
| Less than $800 | 259 (74.6%) | 0 (0.0%) |
| $800 to $1,499 | 53 (15.3%) | 41 (23.2%) |
| $800 to $1,499 | 7 (2.0%) | 114 (64.4%) |
| Total | 347 (100.0%) | 177 (100.0%) |
Health & Disability in Williamson
Health Insurance Coverage by Age in Williamson
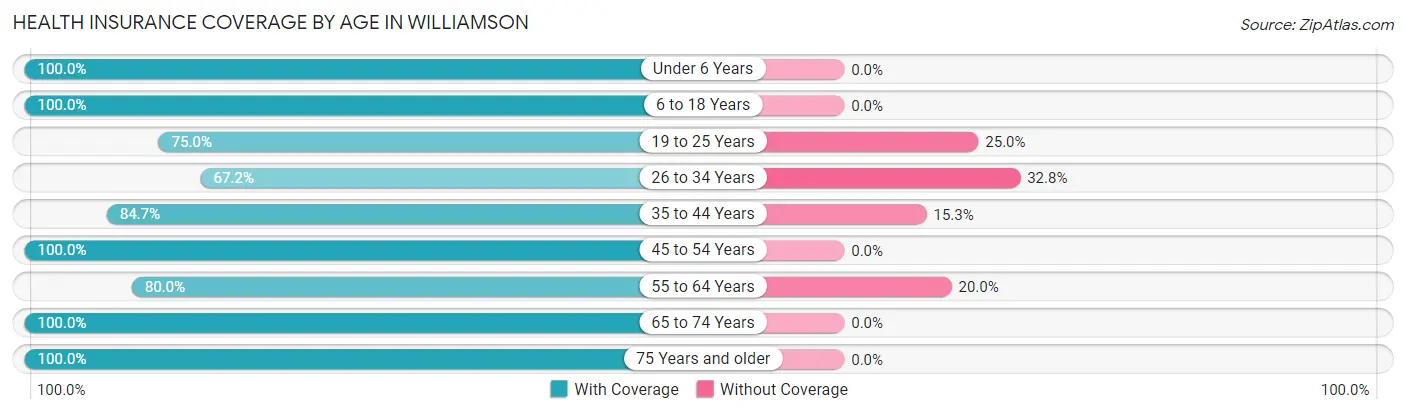
| Age Bracket | With Coverage | Without Coverage |
| Under 6 Years | 136 (100.0%) | 0 (0.0%) |
| 6 to 18 Years | 638 (100.0%) | 0 (0.0%) |
| 19 to 25 Years | 96 (75.0%) | 32 (25.0%) |
| 26 to 34 Years | 297 (67.2%) | 145 (32.8%) |
| 35 to 44 Years | 359 (84.7%) | 65 (15.3%) |
| 45 to 54 Years | 247 (100.0%) | 0 (0.0%) |
| 55 to 64 Years | 360 (80.0%) | 90 (20.0%) |
| 65 to 74 Years | 243 (100.0%) | 0 (0.0%) |
| 75 Years and older | 246 (100.0%) | 0 (0.0%) |
| Total | 2,622 (88.8%) | 332 (11.2%) |
Health Insurance Coverage by Citizenship Status in Williamson
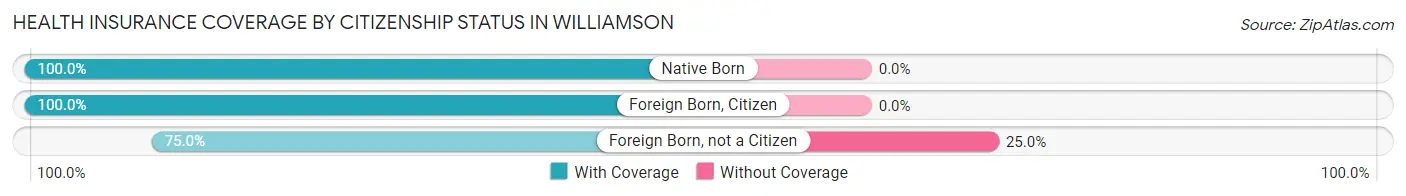
| Citizenship Status | With Coverage | Without Coverage |
| Native Born | 136 (100.0%) | 0 (0.0%) |
| Foreign Born, Citizen | 638 (100.0%) | 0 (0.0%) |
| Foreign Born, not a Citizen | 96 (75.0%) | 32 (25.0%) |
Health Insurance Coverage by Household Income in Williamson
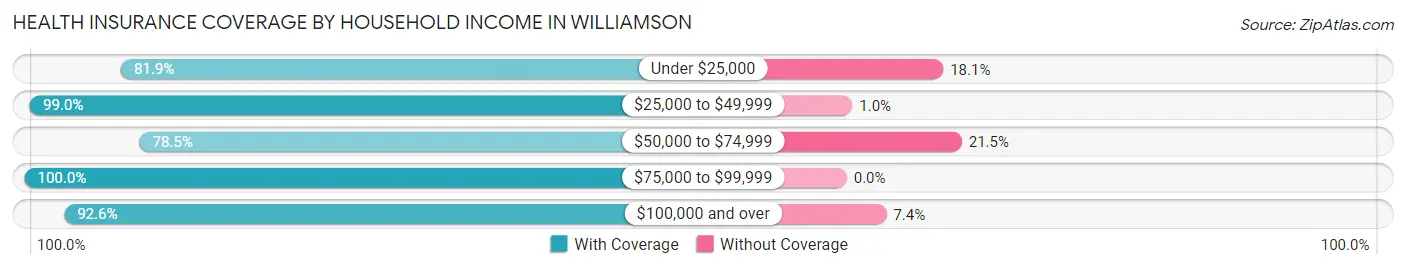
| Household Income | With Coverage | Without Coverage |
| Under $25,000 | 730 (81.9%) | 161 (18.1%) |
| $25,000 to $49,999 | 668 (99.0%) | 7 (1.0%) |
| $50,000 to $74,999 | 448 (78.5%) | 123 (21.5%) |
| $75,000 to $99,999 | 255 (100.0%) | 0 (0.0%) |
| $100,000 and over | 511 (92.6%) | 41 (7.4%) |
Public vs Private Health Insurance Coverage by Age in Williamson
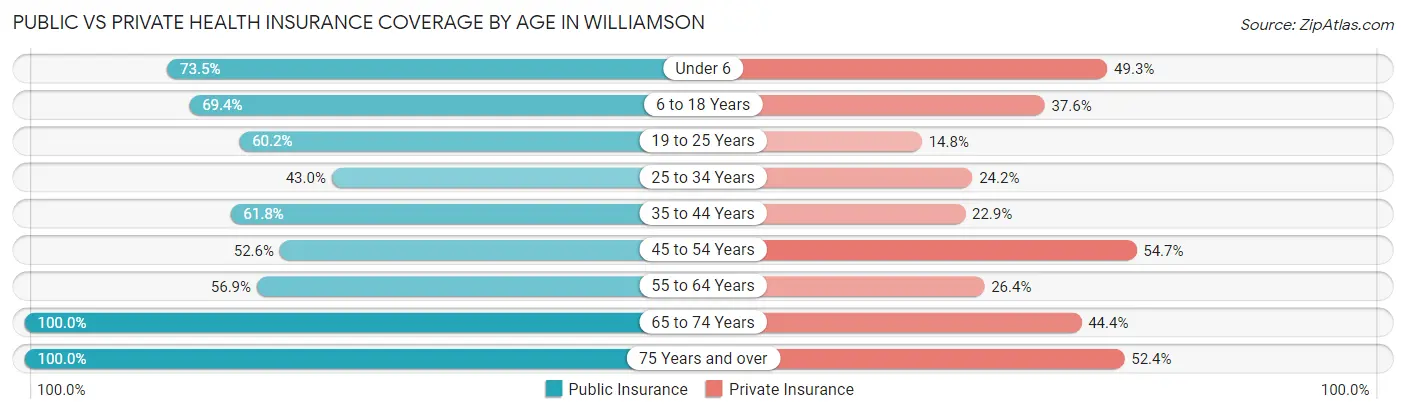
| Age Bracket | Public Insurance | Private Insurance |
| Under 6 | 100 (73.5%) | 67 (49.3%) |
| 6 to 18 Years | 443 (69.4%) | 240 (37.6%) |
| 19 to 25 Years | 77 (60.2%) | 19 (14.8%) |
| 25 to 34 Years | 190 (43.0%) | 107 (24.2%) |
| 35 to 44 Years | 262 (61.8%) | 97 (22.9%) |
| 45 to 54 Years | 130 (52.6%) | 135 (54.7%) |
| 55 to 64 Years | 256 (56.9%) | 119 (26.4%) |
| 65 to 74 Years | 243 (100.0%) | 108 (44.4%) |
| 75 Years and over | 246 (100.0%) | 129 (52.4%) |
| Total | 1,947 (65.9%) | 1,021 (34.6%) |
Disability Status by Sex by Age in Williamson
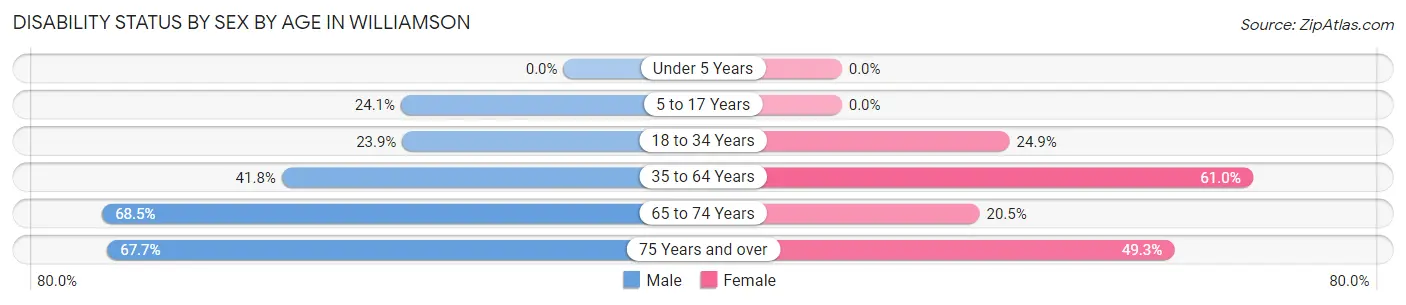
| Age Bracket | Male | Female |
| Under 5 Years | 0 (0.0%) | 0 (0.0%) |
| 5 to 17 Years | 104 (24.1%) | 0 (0.0%) |
| 18 to 34 Years | 67 (23.9%) | 74 (24.9%) |
| 35 to 64 Years | 187 (41.8%) | 411 (61.0%) |
| 65 to 74 Years | 76 (68.5%) | 27 (20.4%) |
| 75 Years and over | 65 (67.7%) | 74 (49.3%) |
Disability Class by Sex by Age in Williamson
Disability Class: Hearing Difficulty
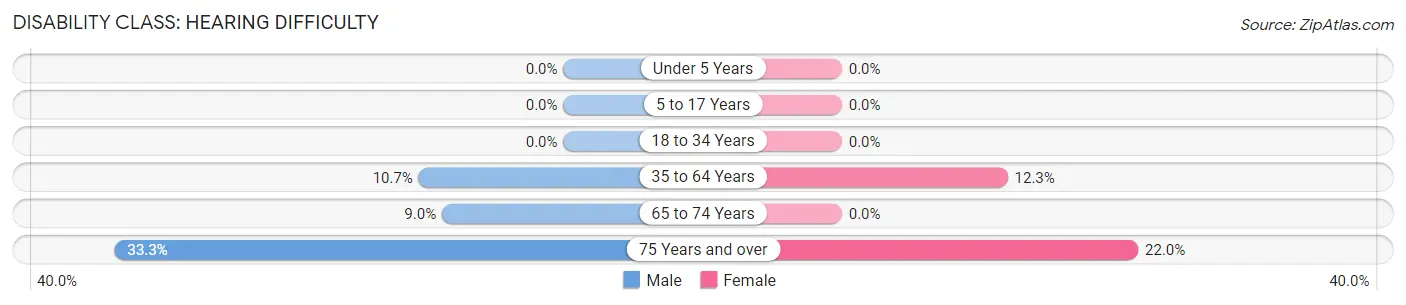
| Age Bracket | Male | Female |
| Under 5 Years | 0 (0.0%) | 0 (0.0%) |
| 5 to 17 Years | 0 (0.0%) | 0 (0.0%) |
| 18 to 34 Years | 0 (0.0%) | 0 (0.0%) |
| 35 to 64 Years | 48 (10.7%) | 83 (12.3%) |
| 65 to 74 Years | 10 (9.0%) | 0 (0.0%) |
| 75 Years and over | 32 (33.3%) | 33 (22.0%) |
Disability Class: Vision Difficulty
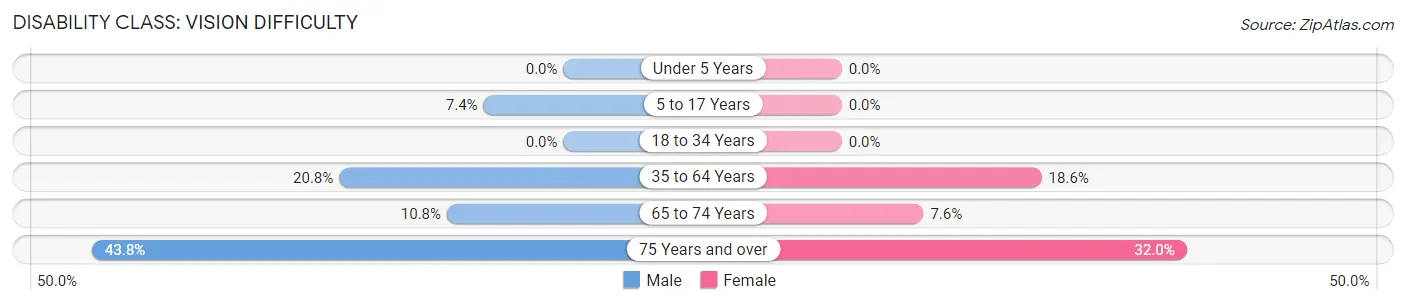
| Age Bracket | Male | Female |
| Under 5 Years | 0 (0.0%) | 0 (0.0%) |
| 5 to 17 Years | 32 (7.4%) | 0 (0.0%) |
| 18 to 34 Years | 0 (0.0%) | 0 (0.0%) |
| 35 to 64 Years | 93 (20.8%) | 125 (18.5%) |
| 65 to 74 Years | 12 (10.8%) | 10 (7.6%) |
| 75 Years and over | 42 (43.8%) | 48 (32.0%) |
Disability Class: Cognitive Difficulty
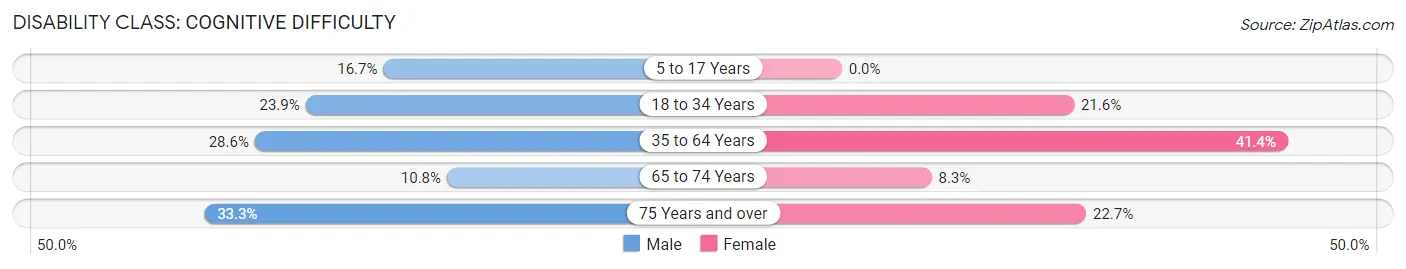
| Age Bracket | Male | Female |
| 5 to 17 Years | 72 (16.7%) | 0 (0.0%) |
| 18 to 34 Years | 67 (23.9%) | 64 (21.5%) |
| 35 to 64 Years | 128 (28.6%) | 279 (41.4%) |
| 65 to 74 Years | 12 (10.8%) | 11 (8.3%) |
| 75 Years and over | 32 (33.3%) | 34 (22.7%) |
Disability Class: Ambulatory Difficulty
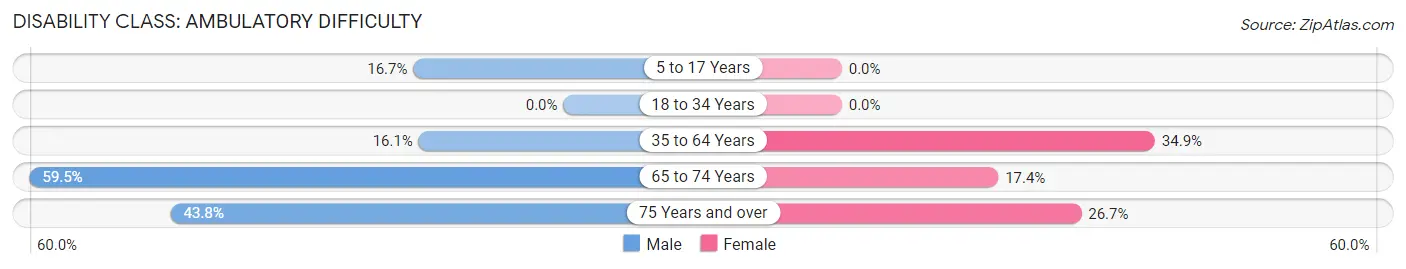
| Age Bracket | Male | Female |
| 5 to 17 Years | 72 (16.7%) | 0 (0.0%) |
| 18 to 34 Years | 0 (0.0%) | 0 (0.0%) |
| 35 to 64 Years | 72 (16.1%) | 235 (34.9%) |
| 65 to 74 Years | 66 (59.5%) | 23 (17.4%) |
| 75 Years and over | 42 (43.8%) | 40 (26.7%) |
Disability Class: Self-Care Difficulty
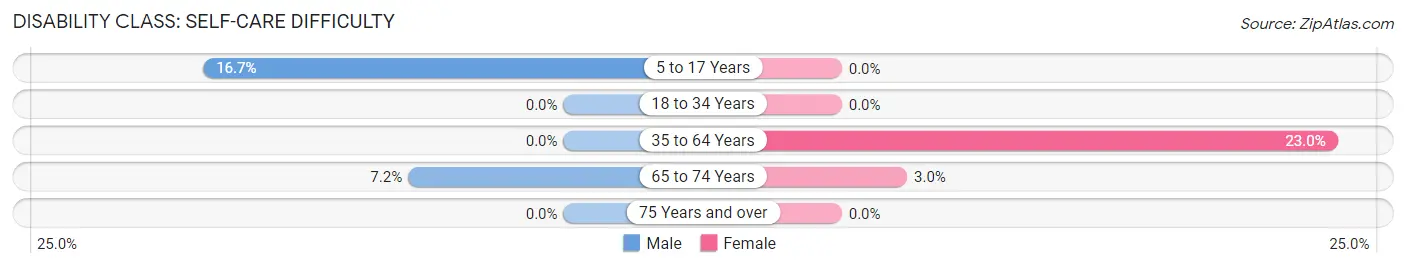
| Age Bracket | Male | Female |
| 5 to 17 Years | 72 (16.7%) | 0 (0.0%) |
| 18 to 34 Years | 0 (0.0%) | 0 (0.0%) |
| 35 to 64 Years | 0 (0.0%) | 155 (23.0%) |
| 65 to 74 Years | 8 (7.2%) | 4 (3.0%) |
| 75 Years and over | 0 (0.0%) | 0 (0.0%) |
Technology Access in Williamson
Computing Device Access in Williamson
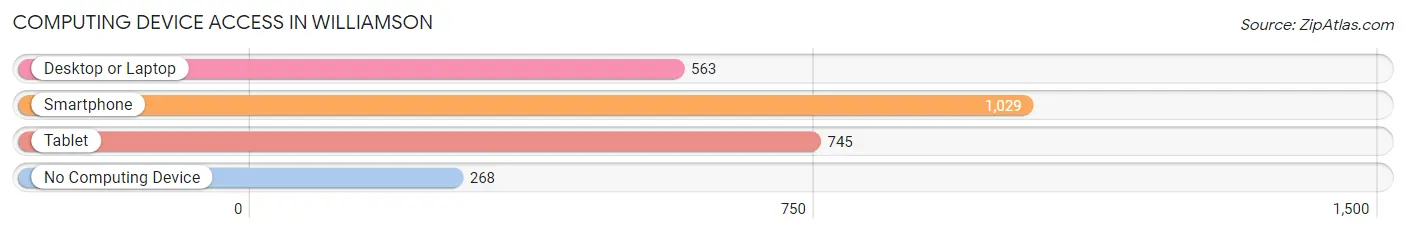
| Device Type | # Households | % Households |
| Desktop or Laptop | 563 | 41.7% |
| Smartphone | 1,029 | 76.2% |
| Tablet | 745 | 55.2% |
| No Computing Device | 268 | 19.9% |
| Total | 1,350 | 100.0% |
Internet Access in Williamson
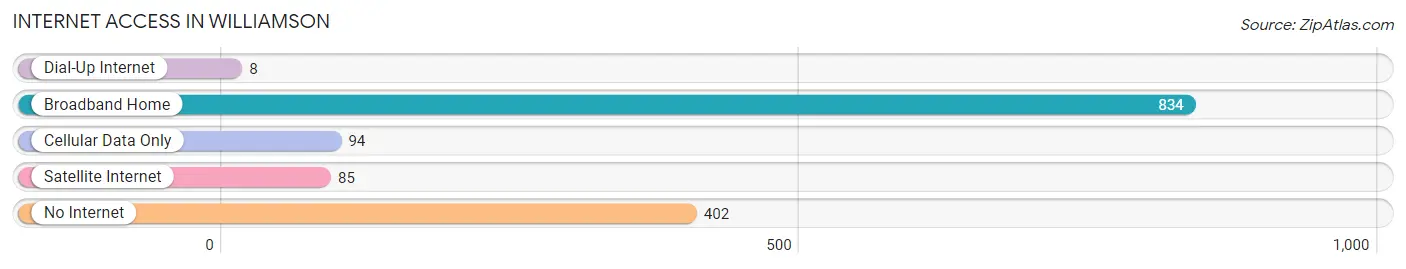
| Internet Type | # Households | % Households |
| Dial-Up Internet | 8 | 0.6% |
| Broadband Home | 834 | 61.8% |
| Cellular Data Only | 94 | 7.0% |
| Satellite Internet | 85 | 6.3% |
| No Internet | 402 | 29.8% |
| Total | 1,350 | 100.0% |
Williamson Summary
Williamson is a city located in Mingo County, West Virginia, United States. It is the county seat of Mingo County and the largest city in the county. The population was 2,959 at the 2010 census. Williamson is located at the junction of the Tug Fork and Big Sandy Rivers, which form the border between West Virginia and Kentucky.
History
Williamson was founded in 1892 by the Norfolk and Western Railway. The city was named after Wallace J. Williamson, a railroad official. The city was incorporated in 1902.
Williamson was the site of the Battle of Tug Fork, a skirmish between the Hatfield and McCoy families in 1888. The Hatfield-McCoy feud was a long-running dispute between two families in the Tug Fork region of West Virginia and Kentucky.
Williamson was the site of the Battle of Matewan in 1920, a shootout between coal miners and the Baldwin-Felts Detective Agency. The battle was part of the West Virginia Mine Wars, a series of labor disputes between coal miners and coal companies in the early 20th century.
Geography
Williamson is located at 37°41'17" North, 82°7'17" West (37.688056, -82.121389). The city is situated at the junction of the Tug Fork and Big Sandy Rivers, which form the border between West Virginia and Kentucky.
According to the United States Census Bureau, the city has a total area of 4.2 square miles (10.8 km2), of which 4.1 square miles (10.6 km2) is land and 0.1 square miles (0.2 km2) is water.
Economy
Williamson is the economic center of Mingo County. The city is home to several large employers, including the Mingo County Board of Education, Williamson Health and Wellness Center, and Williamson Memorial Hospital.
The city is also home to several retail stores including Walmart Kmart and Dollar General
Demographics
As of the census of 2010, there were 2,959 people, 1,220 households, and 745 families residing in the city. The population density was 722.2 people per square mile (279.2/km2). There were 1,420 housing units at an average density of 347.6 per square mile (134.2/km2). The racial makeup of the city was 95.2% White, 2.2% African American, 0.2% Native American, 0.3% Asian, 0.1% Pacific Islander, 0.7% from other races, and 1.3% from two or more races. Hispanic or Latino of any race were 1.7% of the population.
There were 1,220 households, out of which 28.2% had children under the age of 18 living with them, 41.2% were married couples living together, 16.2% had a female householder with no husband present, and 37.2% were non-families. 32.2% of all households were made up of individuals, and 14.2% had someone living alone who was 65 years of age or older. The average household size was 2.35 and the average family size was 2.94.
In the city, the population was spread out, with 24.2% under the age of 18, 8.7% from 18 to 24, 25.7% from 25 to 44, 24.2% from 45 to 64, and 17.2% who were 65 years of age or older. The median age was 38 years. For every 100 females, there were 87.2 males. For every 100 females age 18 and over, there were 81.2 males.
The median income for a household in the city was $20,972, and the median income for a family was $26,944. Males had a median income of $30,000 versus $19,375 for females. The per capita income for the city was $13,845. About 22.2% of families and 25.7% of the population were below the poverty line, including 36.2% of those under age 18 and 16.2% of those age 65 or over.
Common Questions
What is the Total Population of Williamson?
Total Population of Williamson is 3,035.
What is the Total Male Population of Williamson?
Total Male Population of Williamson is 1,393.
What is the Total Female Population of Williamson?
Total Female Population of Williamson is 1,642.
What is the Ratio of Males per 100 Females in Williamson?
There are 84.84 Males per 100 Females in Williamson.
What is the Ratio of Females per 100 Males in Williamson?
There are 117.88 Females per 100 Males in Williamson.
What is the Median Population Age in Williamson?
Median Population Age in Williamson is 40.6 Years.
What is the Average Family Size in Williamson
Average Family Size in Williamson is 3.4 People.
What is the Average Household Size in Williamson
Average Household Size in Williamson is 2.2 People.
What is Per Capita Income in Williamson?
Per Capita income in Williamson is $25,475.
What is the Median Family Income in Williamson?
Median Family Income in Williamson is $58,750.
What is the Median Household income in Williamson?
Median Household Income in Williamson is $23,173.
What is Income or Wage Gap in Williamson?
Income or Wage Gap in Williamson is 1.6%.
Women in Williamson earn 98.4 cents for every dollar earned by a man.
What is Family Income Deficit in Williamson?
Family Income Deficit in Williamson is $8,333.
Families that are below poverty line in Williamson earn $8,333 less on average than the poverty threshold level.
What is Inequality or Gini Index in Williamson?
Inequality or Gini Index in Williamson is 0.65.
How Large is the Labor Force in Williamson?
There are 935 People in the Labor Forcein in Williamson.
What is the Percentage of People in the Labor Force in Williamson?
37.6% of People are in the Labor Force in Williamson.
What is the Unemployment Rate in Williamson?
Unemployment Rate in Williamson is 11.6%.