Ripley, WV Map & Demographics
Ripley Map
Ripley Overview
$26,670
PER CAPITA INCOME
$64,643
AVG FAMILY INCOME
$35,489
AVG HOUSEHOLD INCOME
0.0%
WAGE / INCOME GAP [ % ]
100.0¢/ $1
WAGE / INCOME GAP [ $ ]
0.53
INEQUALITY / GINI INDEX
3,084
TOTAL POPULATION
1,676
MALE POPULATION
1,408
FEMALE POPULATION
119.03
MALES / 100 FEMALES
84.01
FEMALES / 100 MALES
43.8
MEDIAN AGE
3.1
AVG FAMILY SIZE
2.0
AVG HOUSEHOLD SIZE
1,326
LABOR FORCE [ PEOPLE ]
51.8%
PERCENT IN LABOR FORCE
4.3%
UNEMPLOYMENT RATE
Ripley Zip Codes
Income in Ripley
Income Overview in Ripley
Per Capita Income in Ripley is $26,670, while median incomes of families and households are $64,643 and $35,489 respectively.
| Characteristic | Number | Measure |
| Per Capita Income | 3,084 | $26,670 |
| Median Family Income | 646 | $64,643 |
| Mean Family Income | 646 | $80,467 |
| Median Household Income | 1,445 | $35,489 |
| Mean Household Income | 1,445 | $52,035 |
| Income Deficit | 646 | $0 |
| Wage / Income Gap (%) | 3,084 | 0.04% |
| Wage / Income Gap ($) | 3,084 | 99.96¢ per $1 |
| Gini / Inequality Index | 3,084 | 0.53 |
Earnings by Sex in Ripley
Average Earnings in Ripley are $37,185, $37,191 for men and $37,176 for women, a difference of 0.0%.
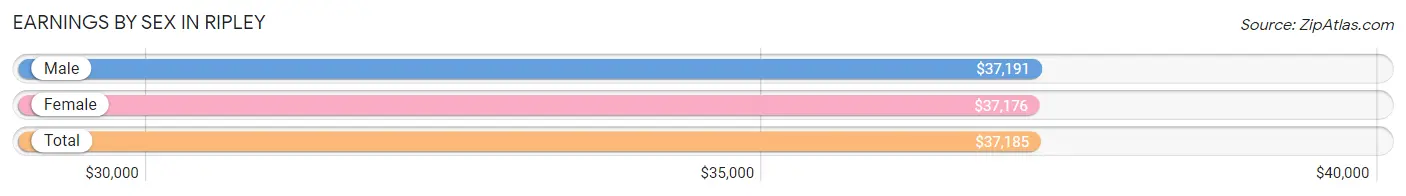
| Sex | Number | Average Earnings |
| Male | 706 (53.2%) | $37,191 |
| Female | 622 (46.8%) | $37,176 |
| Total | 1,328 (100.0%) | $37,185 |
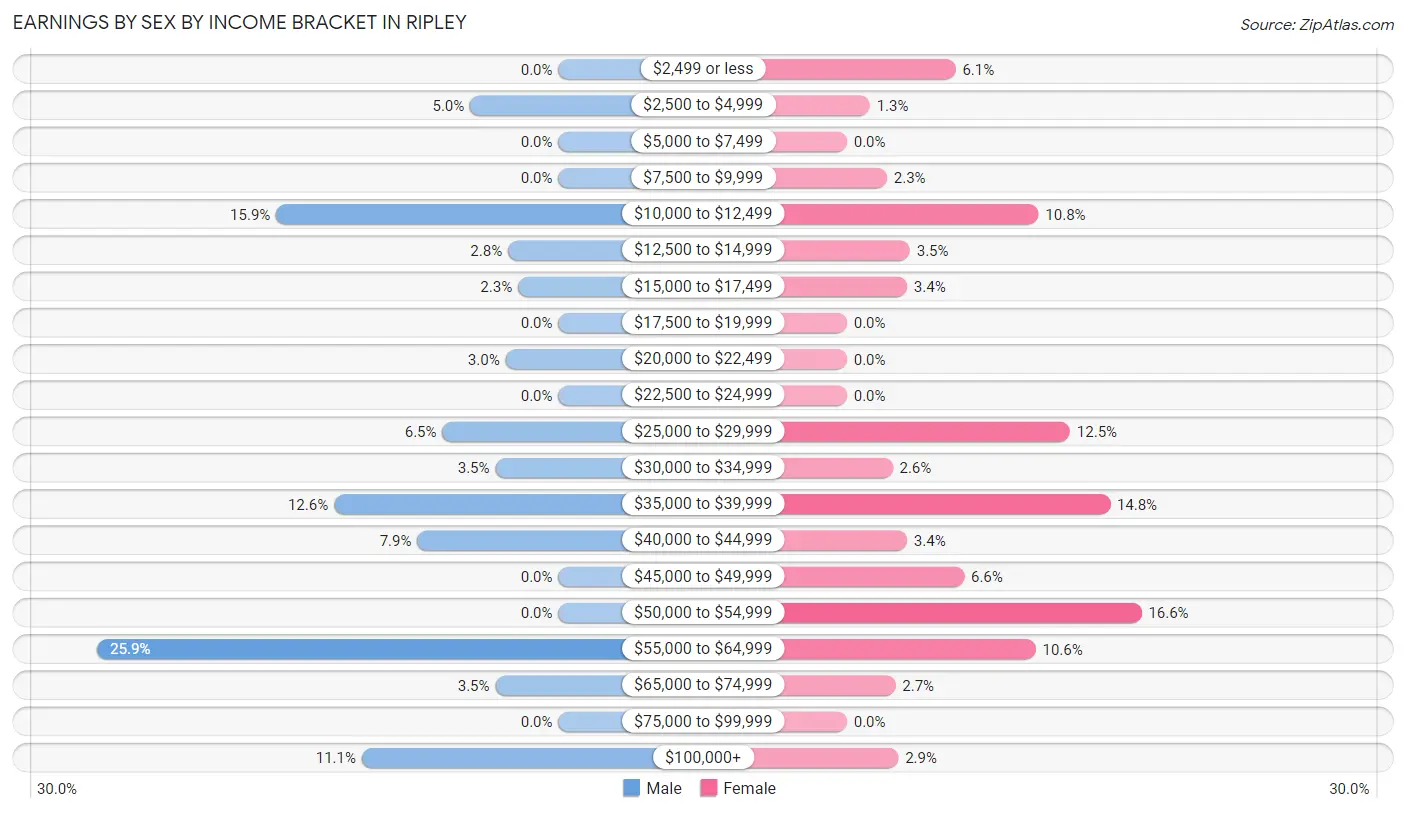
Earnings by Sex by Income Bracket in Ripley
The most common earnings brackets in Ripley are $55,000 to $64,999 for men (183 | 25.9%) and $50,000 to $54,999 for women (103 | 16.6%).
| Income | Male | Female |
| $2,499 or less | 0 (0.0%) | 38 (6.1%) |
| $2,500 to $4,999 | 35 (5.0%) | 8 (1.3%) |
| $5,000 to $7,499 | 0 (0.0%) | 0 (0.0%) |
| $7,500 to $9,999 | 0 (0.0%) | 14 (2.2%) |
| $10,000 to $12,499 | 112 (15.9%) | 67 (10.8%) |
| $12,500 to $14,999 | 20 (2.8%) | 22 (3.5%) |
| $15,000 to $17,499 | 16 (2.3%) | 21 (3.4%) |
| $17,500 to $19,999 | 0 (0.0%) | 0 (0.0%) |
| $20,000 to $22,499 | 21 (3.0%) | 0 (0.0%) |
| $22,500 to $24,999 | 0 (0.0%) | 0 (0.0%) |
| $25,000 to $29,999 | 46 (6.5%) | 78 (12.5%) |
| $30,000 to $34,999 | 25 (3.5%) | 16 (2.6%) |
| $35,000 to $39,999 | 89 (12.6%) | 92 (14.8%) |
| $40,000 to $44,999 | 56 (7.9%) | 21 (3.4%) |
| $45,000 to $49,999 | 0 (0.0%) | 41 (6.6%) |
| $50,000 to $54,999 | 0 (0.0%) | 103 (16.6%) |
| $55,000 to $64,999 | 183 (25.9%) | 66 (10.6%) |
| $65,000 to $74,999 | 25 (3.5%) | 17 (2.7%) |
| $75,000 to $99,999 | 0 (0.0%) | 0 (0.0%) |
| $100,000+ | 78 (11.1%) | 18 (2.9%) |
| Total | 706 (100.0%) | 622 (100.0%) |
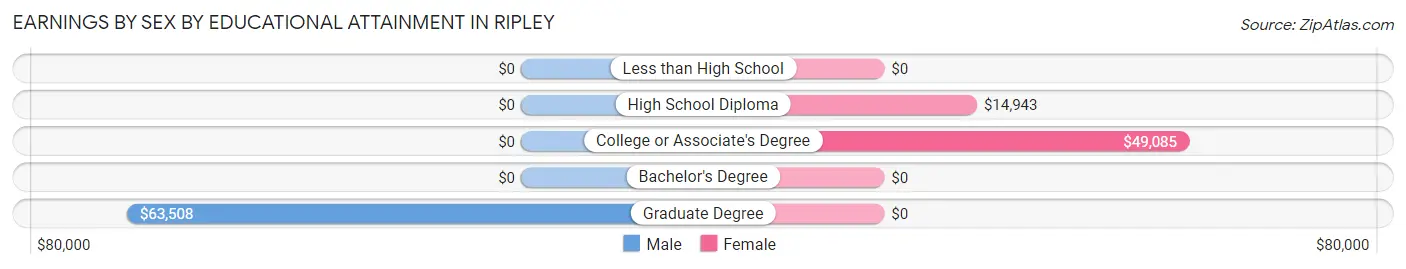
Earnings by Sex by Educational Attainment in Ripley
Average earnings in Ripley are $40,424 for men and $38,816 for women, a difference of 4.0%. Men with an educational attainment of graduate degree enjoy the highest average annual earnings of $63,508, while those with graduate degree education earn the least with $63,508. Women with an educational attainment of college or associate's degree earn the most with the average annual earnings of $49,085, while those with high school diploma education have the smallest earnings of $14,943.
| Educational Attainment | Male Income | Female Income |
| Less than High School | - | - |
| High School Diploma | - | - |
| College or Associate's Degree | - | - |
| Bachelor's Degree | - | - |
| Graduate Degree | $63,508 | $0 |
| Total | $40,424 | $38,816 |
Family Income in Ripley
Family Income Brackets in Ripley
According to the Ripley family income data, there are 123 families falling into the $35,000 to $49,999 income range, which is the most common income bracket and makes up 19.0% of all families. Conversely, the $200,000+ income bracket is the least frequent group with only 17 families (2.6%) belonging to this category.
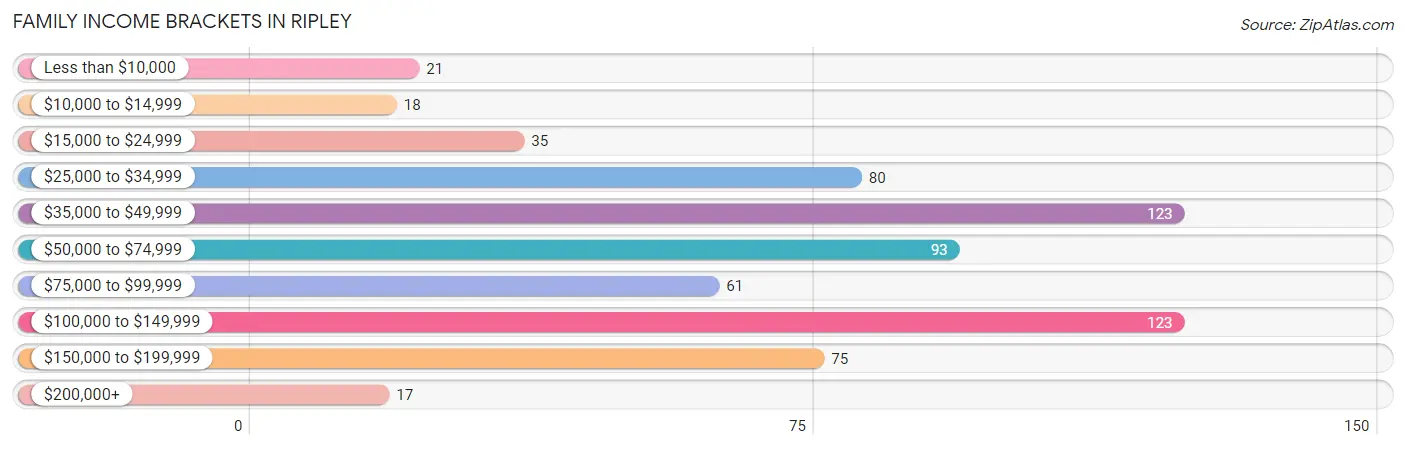
| Income Bracket | # Families | % Families |
| Less than $10,000 | 21 | 3.3% |
| $10,000 to $14,999 | 18 | 2.8% |
| $15,000 to $24,999 | 35 | 5.4% |
| $25,000 to $34,999 | 80 | 12.4% |
| $35,000 to $49,999 | 123 | 19.0% |
| $50,000 to $74,999 | 93 | 14.4% |
| $75,000 to $99,999 | 61 | 9.4% |
| $100,000 to $149,999 | 123 | 19.0% |
| $150,000 to $199,999 | 75 | 11.6% |
| $200,000+ | 17 | 2.6% |
Family Income by Famaliy Size in Ripley
3-person families (51 | 7.9%) account for the highest median family income in Ripley with $167,802 per family, while 3-person families (51 | 7.9%) have the highest median income of $55,934 per family member.
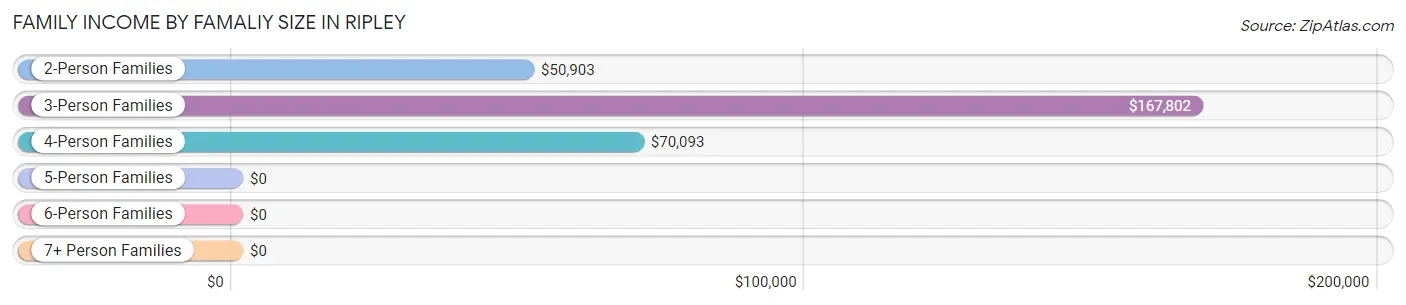
| Income Bracket | # Families | Median Income |
| 2-Person Families | 427 (66.1%) | $50,903 |
| 3-Person Families | 51 (7.9%) | $167,802 |
| 4-Person Families | 98 (15.2%) | $70,093 |
| 5-Person Families | 62 (9.6%) | $0 |
| 6-Person Families | 8 (1.2%) | $0 |
| 7+ Person Families | 0 (0.0%) | $0 |
| Total | 646 (100.0%) | $64,643 |
Family Income by Number of Earners in Ripley
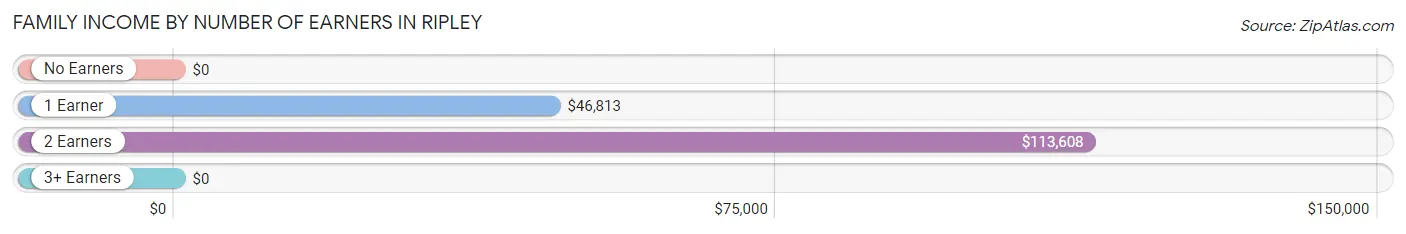
| Number of Earners | # Families | Median Income |
| No Earners | 145 (22.5%) | $0 |
| 1 Earner | 245 (37.9%) | $46,813 |
| 2 Earners | 256 (39.6%) | $113,608 |
| 3+ Earners | 0 (0.0%) | $0 |
| Total | 646 (100.0%) | $64,643 |
Household Income in Ripley
Household Income Brackets in Ripley
With 290 households falling in the category, the $35,000 to $49,999 income range is the most frequent in Ripley, accounting for 20.1% of all households. In contrast, only 17 households (1.2%) fall into the $200,000+ income bracket, making it the least populous group.
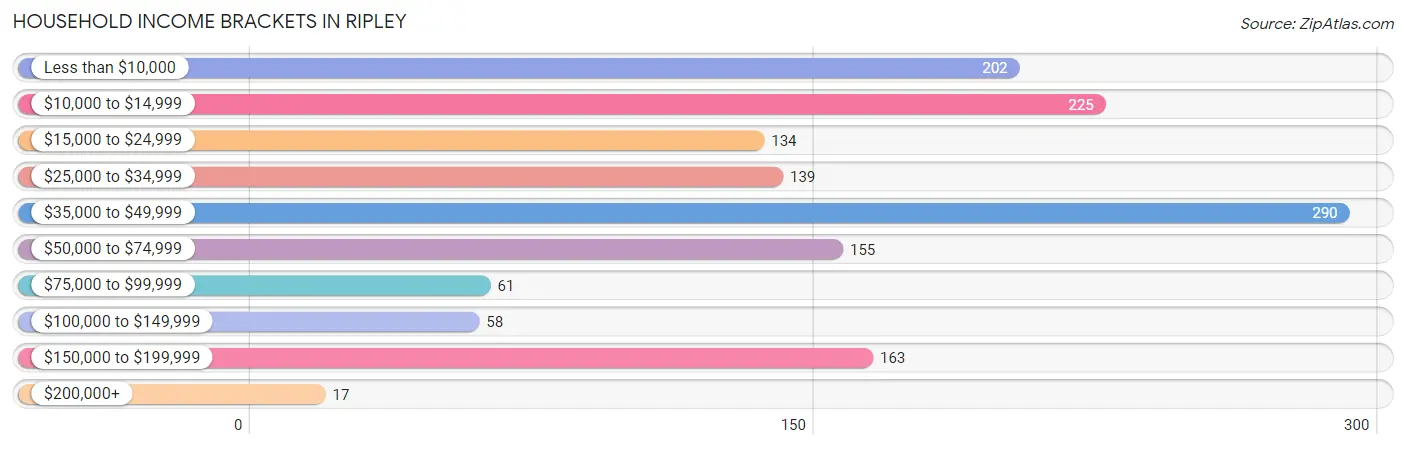
| Income Bracket | # Households | % Households |
| Less than $10,000 | 202 | 14.0% |
| $10,000 to $14,999 | 225 | 15.6% |
| $15,000 to $24,999 | 134 | 9.3% |
| $25,000 to $34,999 | 139 | 9.6% |
| $35,000 to $49,999 | 290 | 20.1% |
| $50,000 to $74,999 | 155 | 10.7% |
| $75,000 to $99,999 | 61 | 4.2% |
| $100,000 to $149,999 | 58 | 4.0% |
| $150,000 to $199,999 | 163 | 11.3% |
| $200,000+ | 17 | 1.2% |
Household Income by Householder Age in Ripley
The median household income in Ripley is $35,489, with the highest median household income of $62,907 found in the 25 to 44 years age bracket for the primary householder. A total of 497 households (34.4%) fall into this category. Meanwhile, the 15 to 24 years age bracket for the primary householder has the lowest median household income of $0, with 59 households (4.1%) in this group.
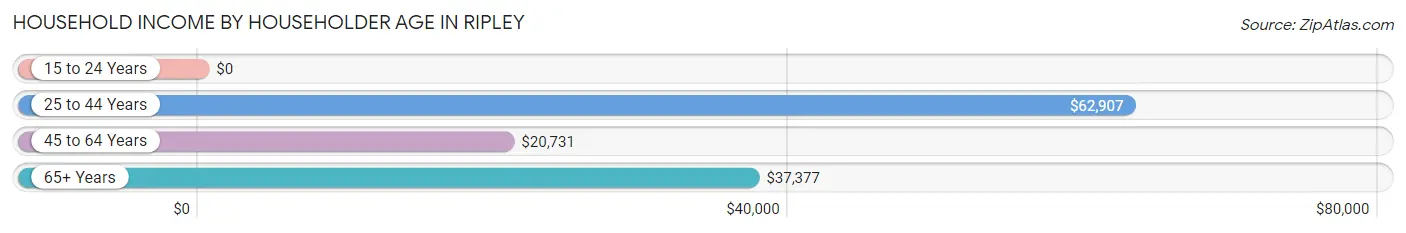
| Income Bracket | # Households | Median Income |
| 15 to 24 Years | 59 (4.1%) | $0 |
| 25 to 44 Years | 497 (34.4%) | $62,907 |
| 45 to 64 Years | 485 (33.6%) | $20,731 |
| 65+ Years | 404 (28.0%) | $37,377 |
| Total | 1,445 (100.0%) | $35,489 |
Poverty in Ripley
Income Below Poverty by Sex and Age in Ripley
With 32.2% poverty level for males and 17.0% for females among the residents of Ripley, 5 year old males and 18 to 24 year old females are the most vulnerable to poverty, with 20 males (100.0%) and 54 females (100.0%) in their respective age groups living below the poverty level.
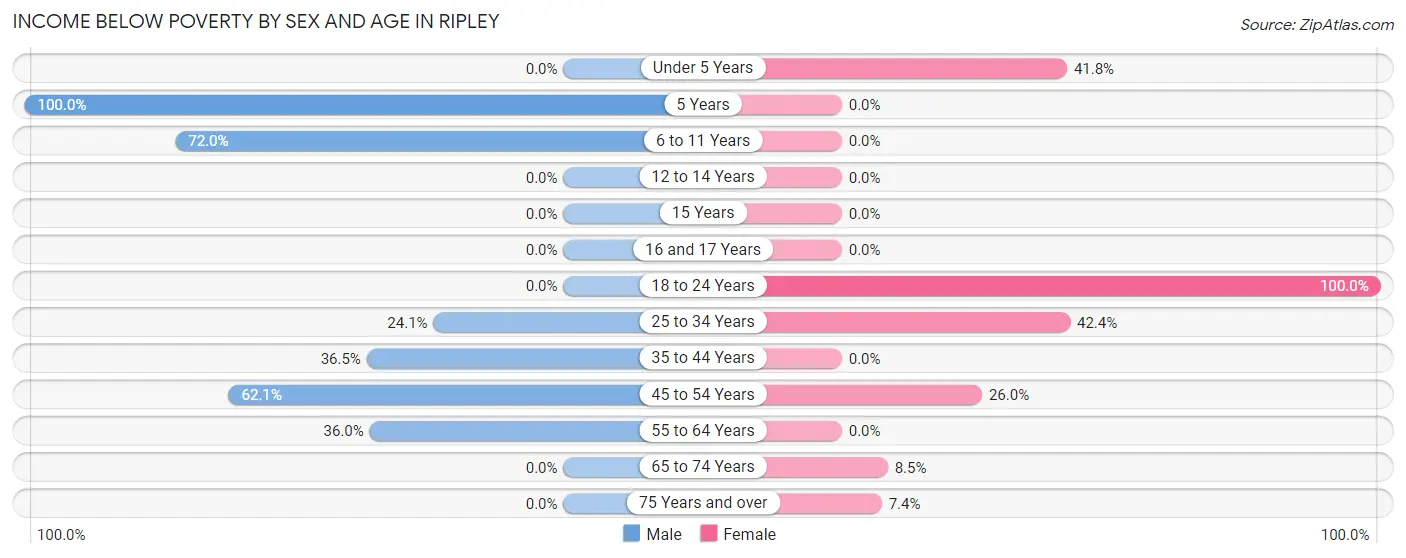
| Age Bracket | Male | Female |
| Under 5 Years | 0 (0.0%) | 28 (41.8%) |
| 5 Years | 20 (100.0%) | 0 (0.0%) |
| 6 to 11 Years | 157 (72.0%) | 0 (0.0%) |
| 12 to 14 Years | 0 (0.0%) | 0 (0.0%) |
| 15 Years | 0 (0.0%) | 0 (0.0%) |
| 16 and 17 Years | 0 (0.0%) | 0 (0.0%) |
| 18 to 24 Years | 0 (0.0%) | 54 (100.0%) |
| 25 to 34 Years | 55 (24.1%) | 61 (42.4%) |
| 35 to 44 Years | 119 (36.5%) | 0 (0.0%) |
| 45 to 54 Years | 105 (62.1%) | 51 (26.0%) |
| 55 to 64 Years | 73 (36.0%) | 0 (0.0%) |
| 65 to 74 Years | 0 (0.0%) | 19 (8.5%) |
| 75 Years and over | 0 (0.0%) | 12 (7.4%) |
| Total | 529 (32.2%) | 225 (17.0%) |
Income Above Poverty by Sex and Age in Ripley
According to the poverty statistics in Ripley, males aged under 5 years and females aged 5 years are the age groups that are most secure financially, with 100.0% of males and 100.0% of females in these age groups living above the poverty line.
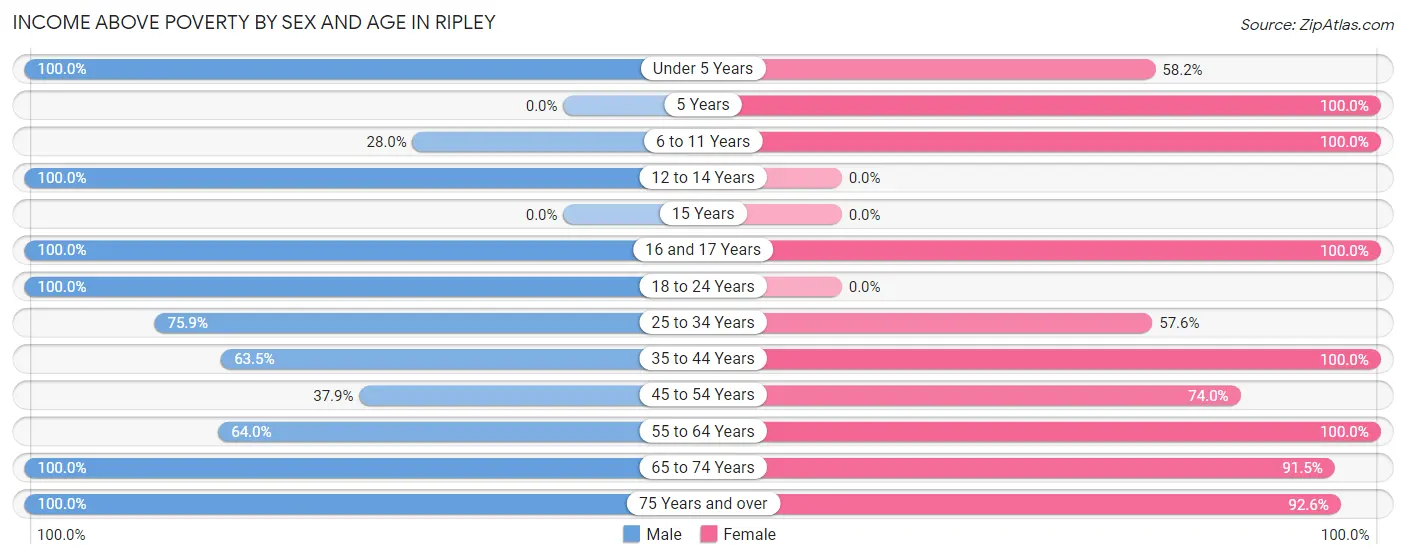
| Age Bracket | Male | Female |
| Under 5 Years | 96 (100.0%) | 39 (58.2%) |
| 5 Years | 0 (0.0%) | 17 (100.0%) |
| 6 to 11 Years | 61 (28.0%) | 53 (100.0%) |
| 12 to 14 Years | 53 (100.0%) | 0 (0.0%) |
| 15 Years | 0 (0.0%) | 0 (0.0%) |
| 16 and 17 Years | 30 (100.0%) | 10 (100.0%) |
| 18 to 24 Years | 41 (100.0%) | 0 (0.0%) |
| 25 to 34 Years | 173 (75.9%) | 83 (57.6%) |
| 35 to 44 Years | 207 (63.5%) | 215 (100.0%) |
| 45 to 54 Years | 64 (37.9%) | 145 (74.0%) |
| 55 to 64 Years | 130 (64.0%) | 184 (100.0%) |
| 65 to 74 Years | 100 (100.0%) | 204 (91.5%) |
| 75 Years and over | 158 (100.0%) | 150 (92.6%) |
| Total | 1,113 (67.8%) | 1,100 (83.0%) |
Income Below Poverty Among Married-Couple Families in Ripley
The poverty statistics for married-couple families in Ripley show that 9.5% or 40 of the total 420 families live below the poverty line. Families with 3 or 4 children have the highest poverty rate of 73.3%, comprising of 22 families. On the other hand, families with no children have the lowest poverty rate of 0.0%, which includes 0 families.
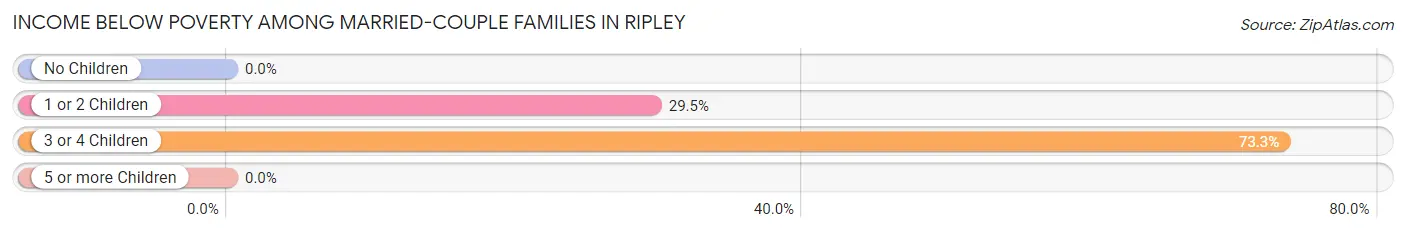
| Children | Above Poverty | Below Poverty |
| No Children | 329 (100.0%) | 0 (0.0%) |
| 1 or 2 Children | 43 (70.5%) | 18 (29.5%) |
| 3 or 4 Children | 8 (26.7%) | 22 (73.3%) |
| 5 or more Children | 0 (0.0%) | 0 (0.0%) |
| Total | 380 (90.5%) | 40 (9.5%) |
Income Below Poverty Among Single-Parent Households in Ripley
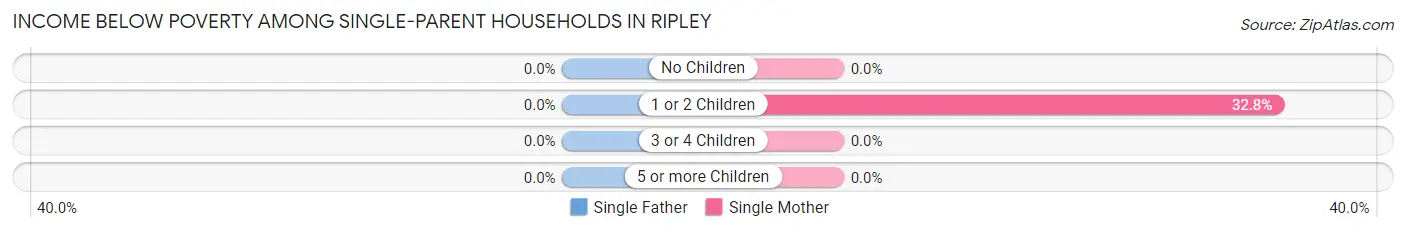
| Children | Single Father | Single Mother |
| No Children | 0 (0.0%) | 0 (0.0%) |
| 1 or 2 Children | 0 (0.0%) | 21 (32.8%) |
| 3 or 4 Children | 0 (0.0%) | 0 (0.0%) |
| 5 or more Children | 0 (0.0%) | 0 (0.0%) |
| Total | 0 (0.0%) | 21 (11.2%) |
Income Below Poverty Among Married-Couple vs Single-Parent Households in Ripley
The poverty data for Ripley shows that 40 of the married-couple family households (9.5%) and 21 of the single-parent households (9.3%) are living below the poverty level. Within the married-couple family households, those with 3 or 4 children have the highest poverty rate, with 22 households (73.3%) falling below the poverty line. Among the single-parent households, those with 1 or 2 children have the highest poverty rate, with 21 household (28.8%) living below poverty.
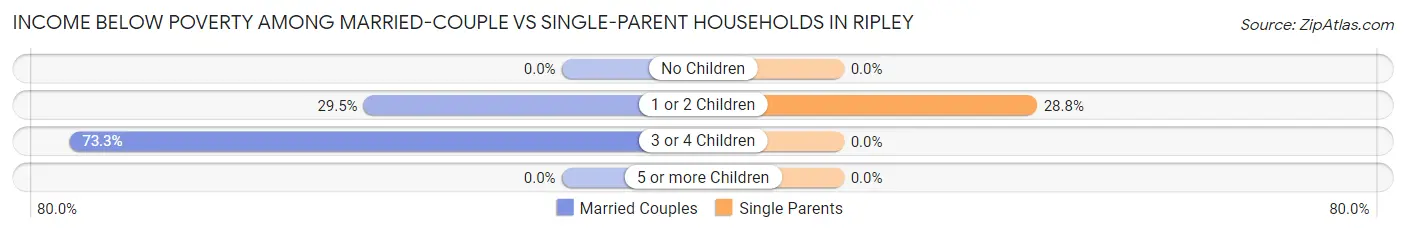
| Children | Married-Couple Families | Single-Parent Households |
| No Children | 0 (0.0%) | 0 (0.0%) |
| 1 or 2 Children | 18 (29.5%) | 21 (28.8%) |
| 3 or 4 Children | 22 (73.3%) | 0 (0.0%) |
| 5 or more Children | 0 (0.0%) | 0 (0.0%) |
| Total | 40 (9.5%) | 21 (9.3%) |
Race in Ripley
The most populous races in Ripley are White / Caucasian (2,949 | 95.6%), Two or more Races (77 | 2.5%), and Hispanic or Latino (72 | 2.3%).
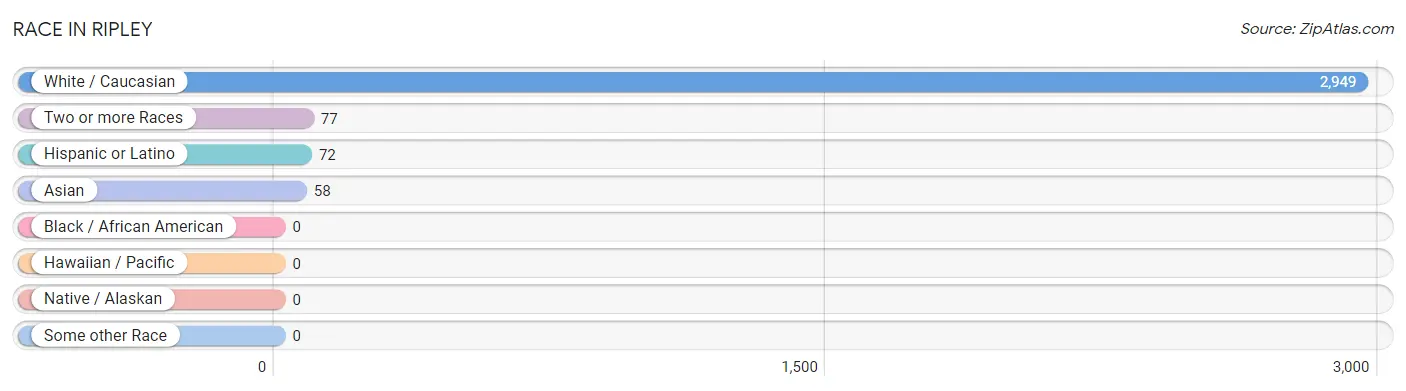
| Race | # Population | % Population |
| Asian | 58 | 1.9% |
| Black / African American | 0 | 0.0% |
| Hawaiian / Pacific | 0 | 0.0% |
| Hispanic or Latino | 72 | 2.3% |
| Native / Alaskan | 0 | 0.0% |
| White / Caucasian | 2,949 | 95.6% |
| Two or more Races | 77 | 2.5% |
| Some other Race | 0 | 0.0% |
| Total | 3,084 | 100.0% |
Ancestry in Ripley
The most populous ancestries reported in Ripley are English (488 | 15.8%), German (349 | 11.3%), Irish (246 | 8.0%), Dutch (208 | 6.7%), and American (207 | 6.7%), together accounting for 48.6% of all Ripley residents.
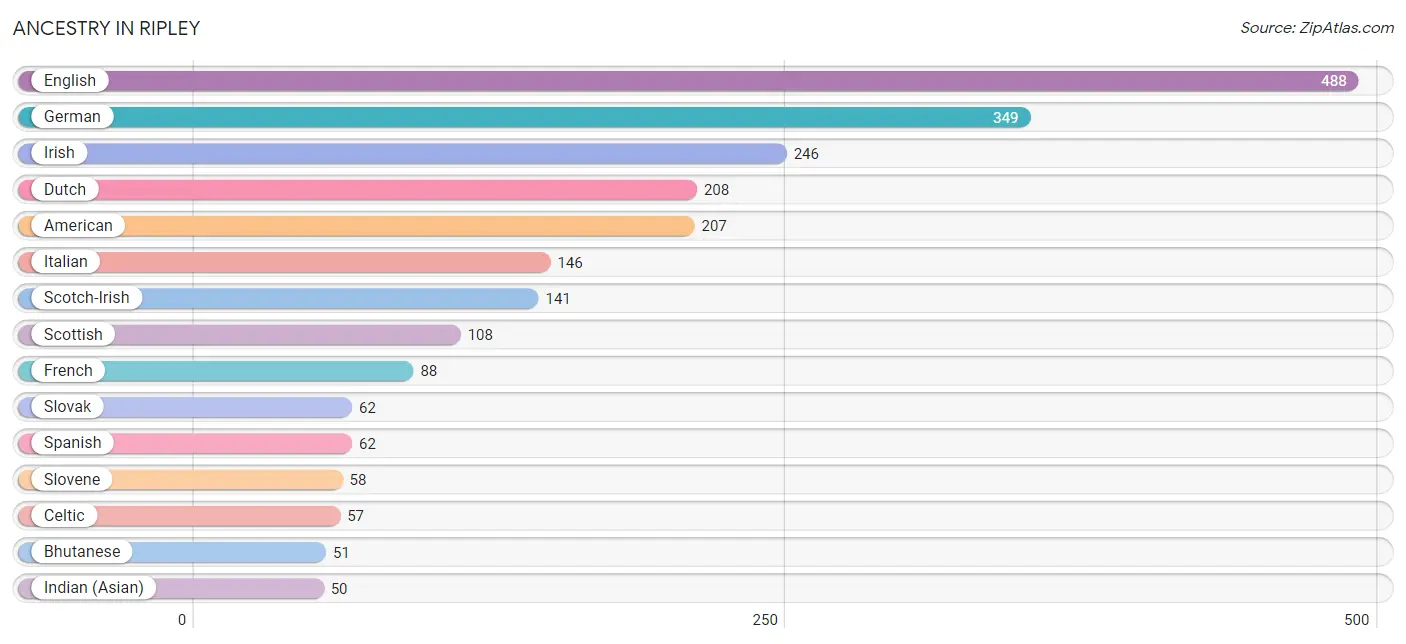
| Ancestry | # Population | % Population |
| American | 207 | 6.7% |
| Austrian | 29 | 0.9% |
| Bhutanese | 51 | 1.7% |
| Celtic | 57 | 1.8% |
| Dutch | 208 | 6.7% |
| English | 488 | 15.8% |
| French | 88 | 2.9% |
| German | 349 | 11.3% |
| Indian (Asian) | 50 | 1.6% |
| Irish | 246 | 8.0% |
| Italian | 146 | 4.7% |
| Mexican | 10 | 0.3% |
| Scotch-Irish | 141 | 4.6% |
| Scottish | 108 | 3.5% |
| Slovak | 62 | 2.0% |
| Slovene | 58 | 1.9% |
| Spanish | 62 | 2.0% |
| Welsh | 40 | 1.3% | View All 18 Rows |
Immigrants in Ripley
The most numerous immigrant groups reported in Ripley came from Asia (15 | 0.5%), Eastern Asia (15 | 0.5%), Japan (8 | 0.3%), China (7 | 0.2%), and Hong Kong (7 | 0.2%), together accounting for 1.7% of all Ripley residents.
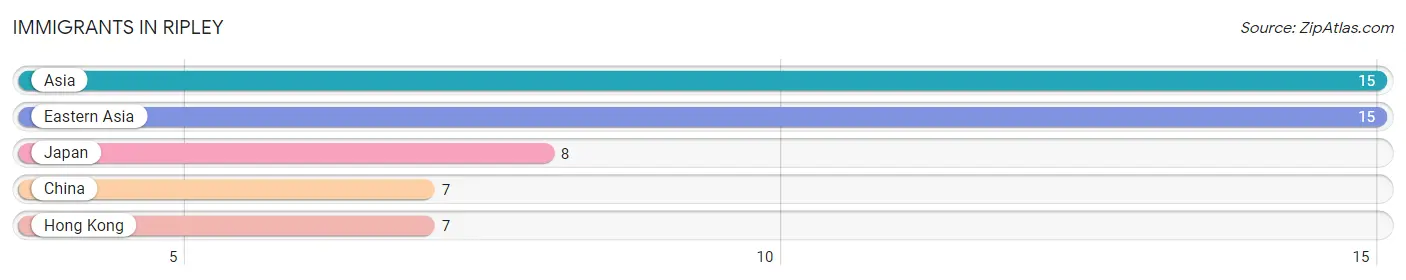
| Immigration Origin | # Population | % Population |
| Asia | 15 | 0.5% |
| China | 7 | 0.2% |
| Eastern Asia | 15 | 0.5% |
| Hong Kong | 7 | 0.2% |
| Japan | 8 | 0.3% | View All 5 Rows |
Sex and Age in Ripley
Sex and Age in Ripley
The most populous age groups in Ripley are 35 to 39 Years (275 | 16.4%) for men and 50 to 54 Years (171 | 12.1%) for women.
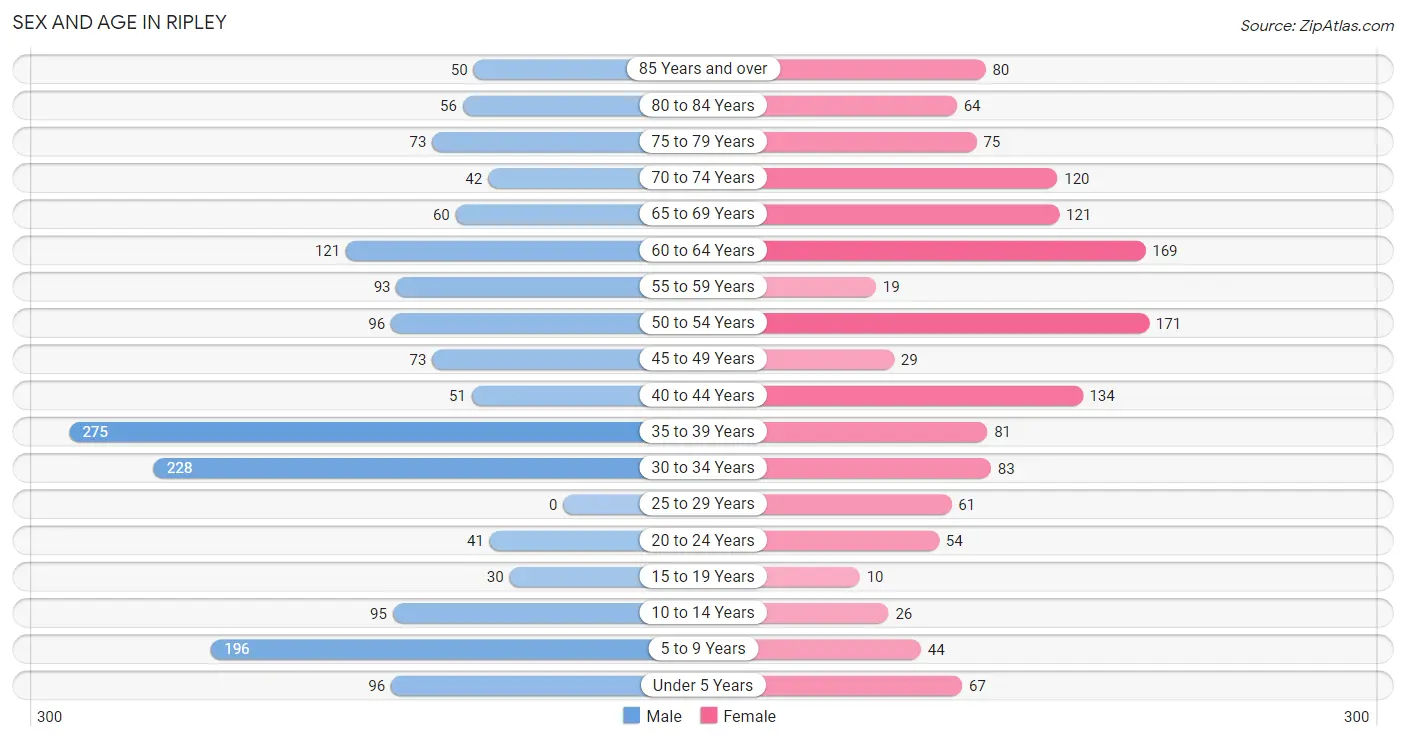
| Age Bracket | Male | Female |
| Under 5 Years | 96 (5.7%) | 67 (4.8%) |
| 5 to 9 Years | 196 (11.7%) | 44 (3.1%) |
| 10 to 14 Years | 95 (5.7%) | 26 (1.8%) |
| 15 to 19 Years | 30 (1.8%) | 10 (0.7%) |
| 20 to 24 Years | 41 (2.5%) | 54 (3.8%) |
| 25 to 29 Years | 0 (0.0%) | 61 (4.3%) |
| 30 to 34 Years | 228 (13.6%) | 83 (5.9%) |
| 35 to 39 Years | 275 (16.4%) | 81 (5.8%) |
| 40 to 44 Years | 51 (3.0%) | 134 (9.5%) |
| 45 to 49 Years | 73 (4.4%) | 29 (2.1%) |
| 50 to 54 Years | 96 (5.7%) | 171 (12.1%) |
| 55 to 59 Years | 93 (5.6%) | 19 (1.3%) |
| 60 to 64 Years | 121 (7.2%) | 169 (12.0%) |
| 65 to 69 Years | 60 (3.6%) | 121 (8.6%) |
| 70 to 74 Years | 42 (2.5%) | 120 (8.5%) |
| 75 to 79 Years | 73 (4.4%) | 75 (5.3%) |
| 80 to 84 Years | 56 (3.3%) | 64 (4.5%) |
| 85 Years and over | 50 (3.0%) | 80 (5.7%) |
| Total | 1,676 (100.0%) | 1,408 (100.0%) |
Families and Households in Ripley
Median Family Size in Ripley
The median family size in Ripley is 3.13 persons per family, with single female/mother families (187 | 28.9%) accounting for the largest median family size of 3.41 persons per family. On the other hand, married-couple families (420 | 65.0%) represent the smallest median family size with 3.00 persons per family.
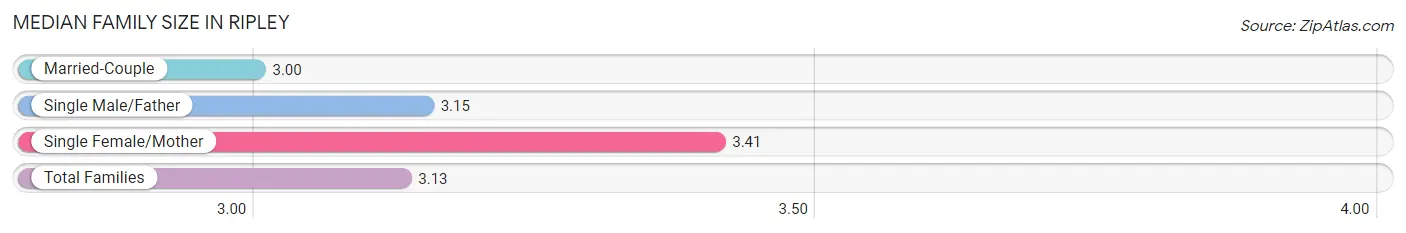
| Family Type | # Families | Family Size |
| Married-Couple | 420 (65.0%) | 3.00 |
| Single Male/Father | 39 (6.0%) | 3.15 |
| Single Female/Mother | 187 (28.9%) | 3.41 |
| Total Families | 646 (100.0%) | 3.13 |
Median Household Size in Ripley
The median household size in Ripley is 2.05 persons per household, with single female/mother households (187 | 12.9%) accounting for the largest median household size of 3.41 persons per household. non-family households (799 | 55.3%) represent the smallest median household size with 1.08 persons per household.
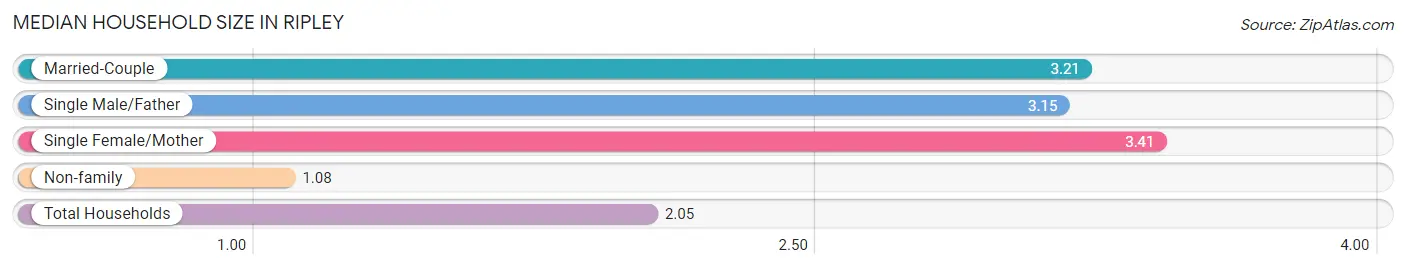
| Household Type | # Households | Household Size |
| Married-Couple | 420 (29.1%) | 3.21 |
| Single Male/Father | 39 (2.7%) | 3.15 |
| Single Female/Mother | 187 (12.9%) | 3.41 |
| Non-family | 799 (55.3%) | 1.08 |
| Total Households | 1,445 (100.0%) | 2.05 |
Household Size by Marriage Status in Ripley
Out of a total of 1,445 households in Ripley, 646 (44.7%) are family households, while 799 (55.3%) are nonfamily households. The most numerous type of family households are 2-person households, comprising 339, and the most common type of nonfamily households are 1-person households, comprising 725.
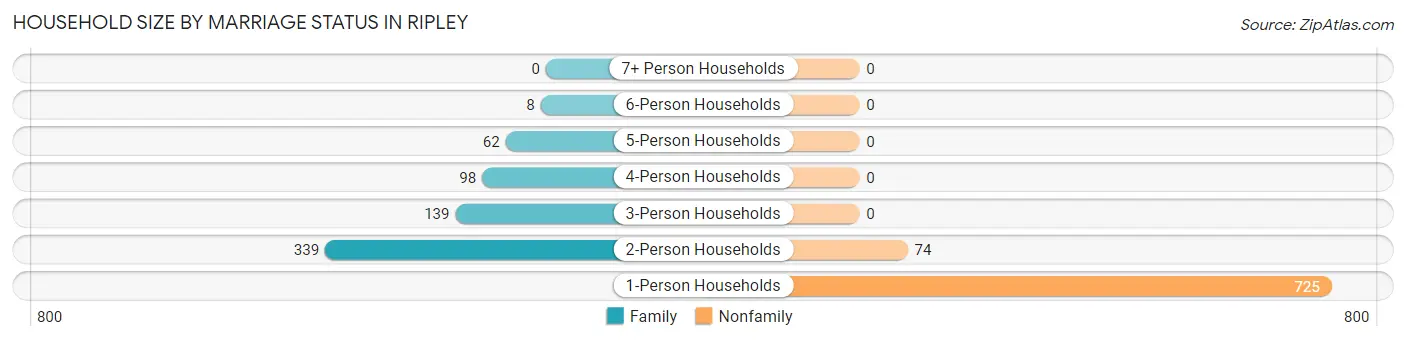
| Household Size | Family Households | Nonfamily Households |
| 1-Person Households | - | 725 (50.2%) |
| 2-Person Households | 339 (23.5%) | 74 (5.1%) |
| 3-Person Households | 139 (9.6%) | 0 (0.0%) |
| 4-Person Households | 98 (6.8%) | 0 (0.0%) |
| 5-Person Households | 62 (4.3%) | 0 (0.0%) |
| 6-Person Households | 8 (0.5%) | 0 (0.0%) |
| 7+ Person Households | 0 (0.0%) | 0 (0.0%) |
| Total | 646 (44.7%) | 799 (55.3%) |
Female Fertility in Ripley
Fertility by Age in Ripley
Average fertility rate in Ripley is 31.0 births per 1,000 women. Women in the age bracket of 20 to 34 years have the highest fertility rate with 81.0 births per 1,000 women. Women in the age bracket of 20 to 34 years acount for 100.0% of all women with births.
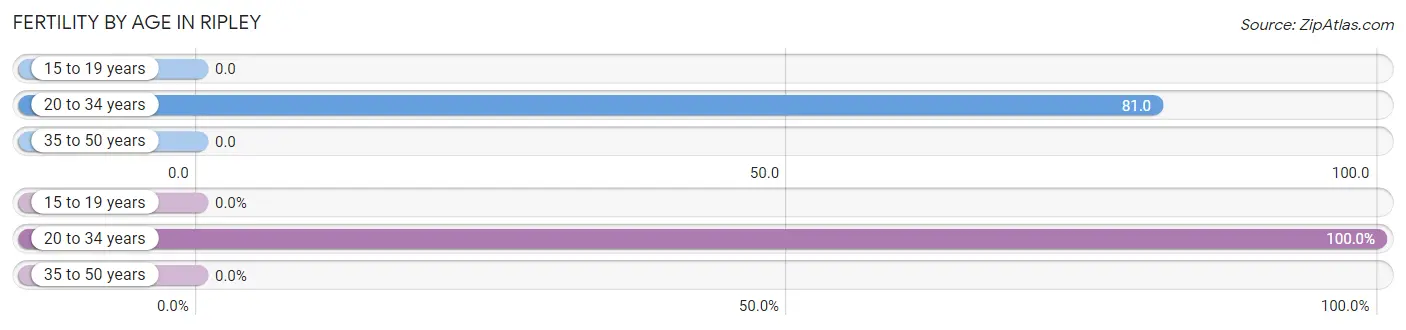
| Age Bracket | Women with Births | Births / 1,000 Women |
| 15 to 19 years | 0 (0.0%) | 0.0 |
| 20 to 34 years | 16 (100.0%) | 81.0 |
| 35 to 50 years | 0 (0.0%) | 0.0 |
| Total | 16 (100.0%) | 31.0 |
Fertility by Age by Marriage Status in Ripley
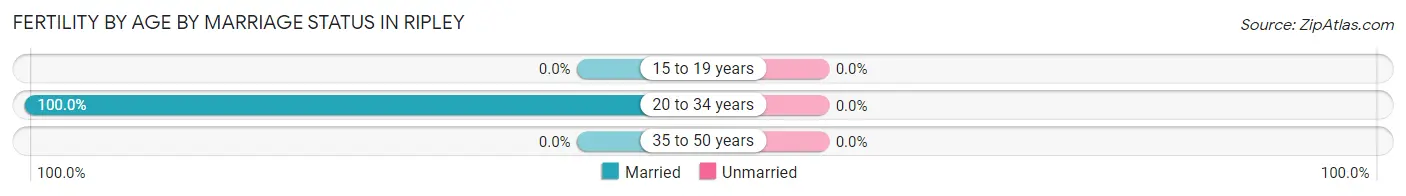
| Age Bracket | Married | Unmarried |
| 15 to 19 years | 0 (0.0%) | 0 (0.0%) |
| 20 to 34 years | 16 (100.0%) | 0 (0.0%) |
| 35 to 50 years | 0 (0.0%) | 0 (0.0%) |
| Total | 16 (100.0%) | 0 (0.0%) |
Fertility by Education in Ripley
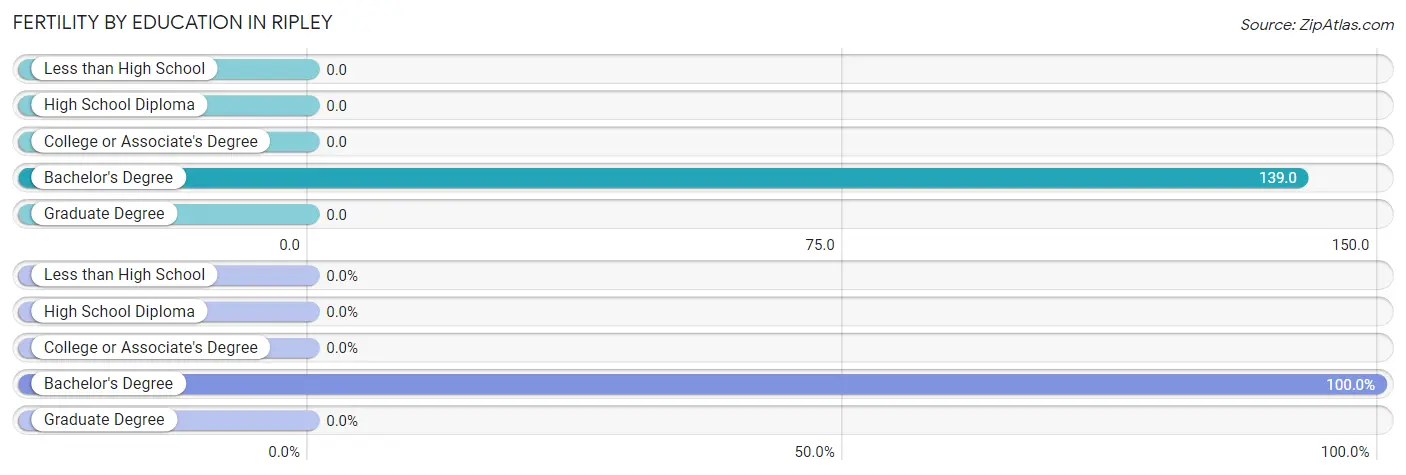
| Educational Attainment | Women with Births | Births / 1,000 Women |
| Less than High School | 0 (0.0%) | 0.0 |
| High School Diploma | 0 (0.0%) | 0.0 |
| College or Associate's Degree | 0 (0.0%) | 0.0 |
| Bachelor's Degree | 16 (100.0%) | 139.0 |
| Graduate Degree | 0 (0.0%) | 0.0 |
| Total | 16 (100.0%) | 31.0 |
Fertility by Education by Marriage Status in Ripley
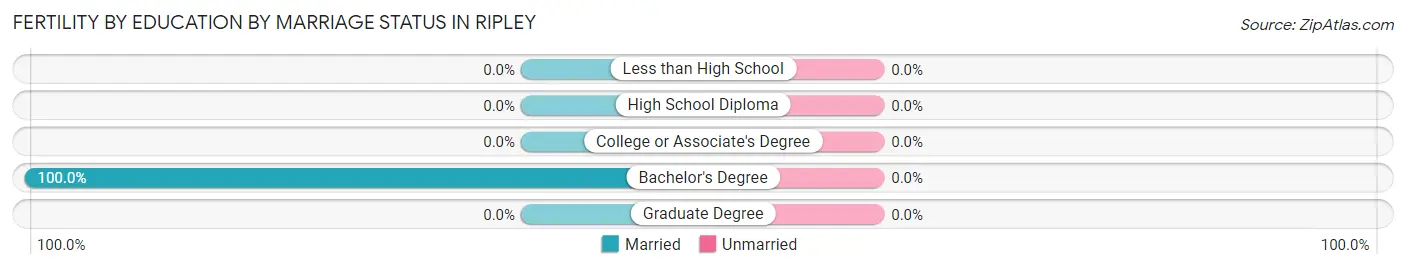
| Educational Attainment | Married | Unmarried |
| Less than High School | 0 (0.0%) | 0 (0.0%) |
| High School Diploma | 0 (0.0%) | 0 (0.0%) |
| College or Associate's Degree | 0 (0.0%) | 0 (0.0%) |
| Bachelor's Degree | 16 (100.0%) | 0 (0.0%) |
| Graduate Degree | 0 (0.0%) | 0 (0.0%) |
| Total | 16 (100.0%) | 0 (0.0%) |
Employment Characteristics in Ripley
Employment by Class of Employer in Ripley
Among the 1,270 employed individuals in Ripley, private company employees (957 | 75.3%), state government employees (77 | 6.1%), and not-for-profit organizations (69 | 5.4%) make up the most common classes of employment.
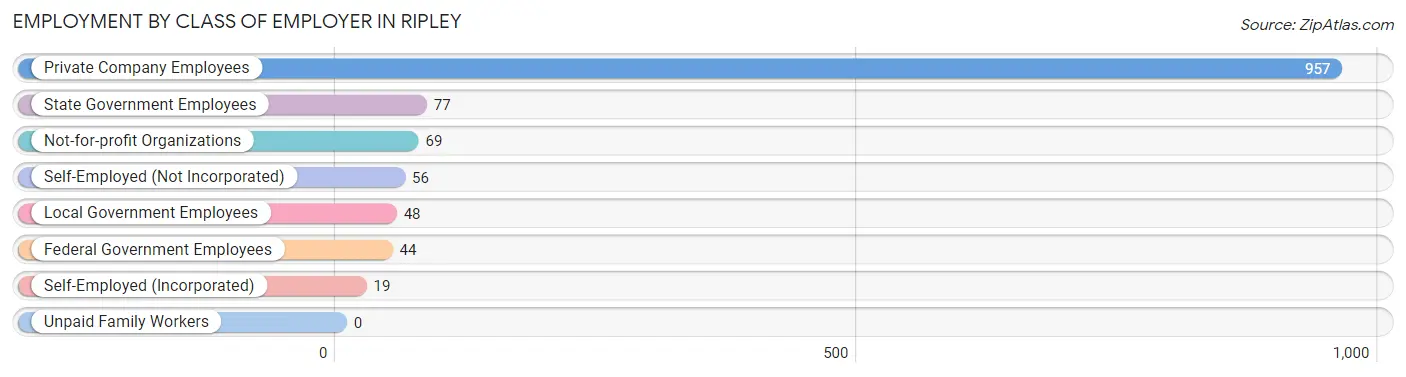
| Employer Class | # Employees | % Employees |
| Private Company Employees | 957 | 75.3% |
| Self-Employed (Incorporated) | 19 | 1.5% |
| Self-Employed (Not Incorporated) | 56 | 4.4% |
| Not-for-profit Organizations | 69 | 5.4% |
| Local Government Employees | 48 | 3.8% |
| State Government Employees | 77 | 6.1% |
| Federal Government Employees | 44 | 3.5% |
| Unpaid Family Workers | 0 | 0.0% |
| Total | 1,270 | 100.0% |
Employment Status by Age in Ripley
According to the labor force statistics for Ripley, out of the total population over 16 years of age (2,560), 51.8% or 1,326 individuals are in the labor force, with 4.3% or 57 of them unemployed. The age group with the highest labor force participation rate is 30 to 34 years, with 93.6% or 291 individuals in the labor force. Within the labor force, the 20 to 24 years age range has the highest percentage of unemployed individuals, with 55.6% or 32 of them being unemployed.
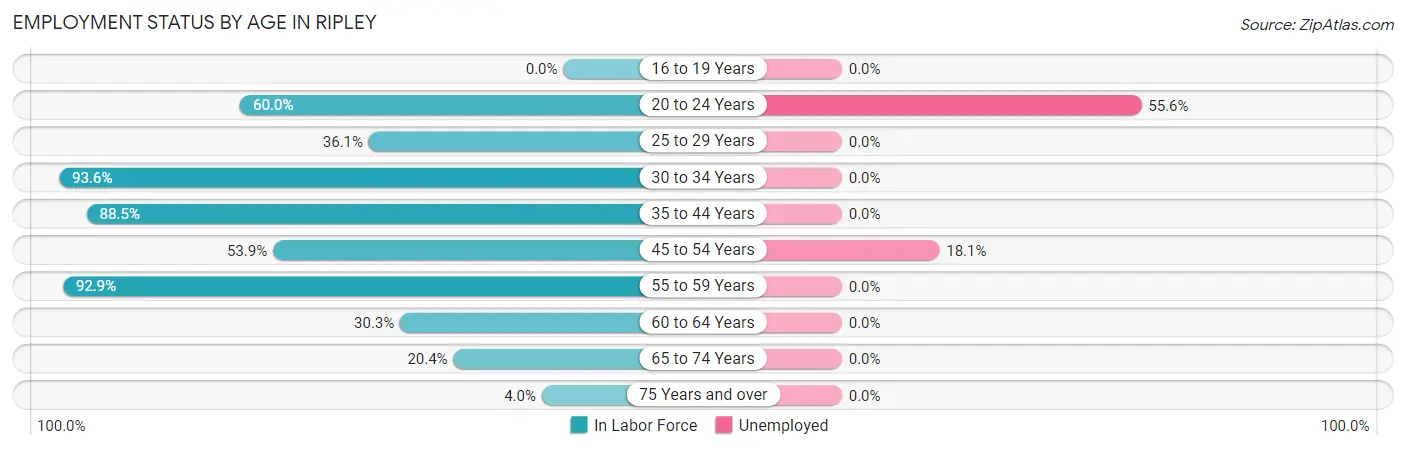
| Age Bracket | In Labor Force | Unemployed |
| 16 to 19 Years | 0 (0.0%) | 0 (0.0%) |
| 20 to 24 Years | 57 (60.0%) | 32 (55.6%) |
| 25 to 29 Years | 22 (36.1%) | 0 (0.0%) |
| 30 to 34 Years | 291 (93.6%) | 0 (0.0%) |
| 35 to 44 Years | 479 (88.5%) | 0 (0.0%) |
| 45 to 54 Years | 199 (53.9%) | 36 (18.1%) |
| 55 to 59 Years | 104 (92.9%) | 0 (0.0%) |
| 60 to 64 Years | 88 (30.3%) | 0 (0.0%) |
| 65 to 74 Years | 70 (20.4%) | 0 (0.0%) |
| 75 Years and over | 16 (4.0%) | 0 (0.0%) |
| Total | 1,326 (51.8%) | 57 (4.3%) |
Employment Status by Educational Attainment in Ripley
According to labor force statistics for Ripley, 70.2% of individuals (1,182) out of the total population between 25 and 64 years of age (1,684) are in the labor force, with 3.0% or 35 of them being unemployed. The group with the highest labor force participation rate are those with the educational attainment of bachelor's degree or higher, with 100.0% or 462 individuals in the labor force. Within the labor force, individuals with college / associate degree education have the highest percentage of unemployment, with 7.6% or 36 of them being unemployed.
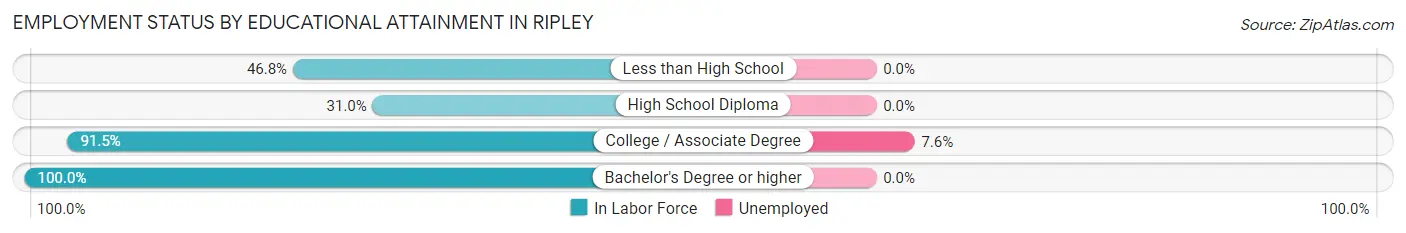
| Educational Attainment | In Labor Force | Unemployed |
| Less than High School | 89 (46.8%) | 0 (0.0%) |
| High School Diploma | 160 (31.0%) | 0 (0.0%) |
| College / Associate Degree | 472 (91.5%) | 39 (7.6%) |
| Bachelor's Degree or higher | 462 (100.0%) | 0 (0.0%) |
| Total | 1,182 (70.2%) | 51 (3.0%) |
Employment Occupations by Sex in Ripley
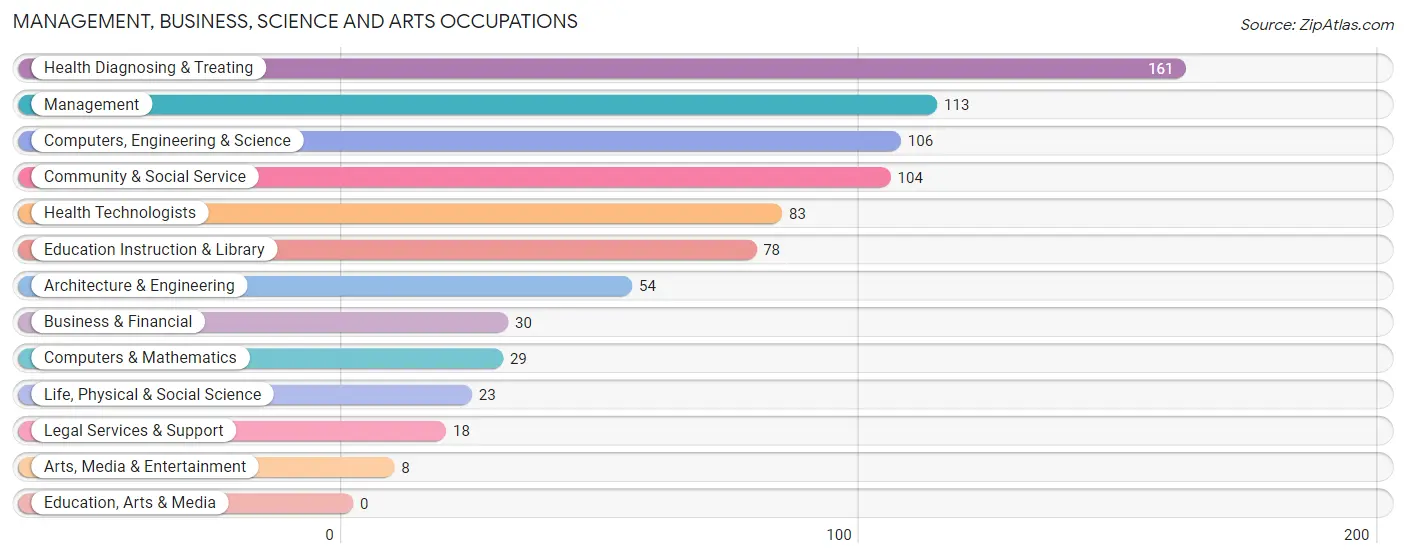
Management, Business, Science and Arts Occupations
The most common Management, Business, Science and Arts occupations in Ripley are Health Diagnosing & Treating (161 | 12.9%), Management (113 | 9.0%), Computers, Engineering & Science (106 | 8.5%), Community & Social Service (104 | 8.3%), and Health Technologists (83 | 6.7%).
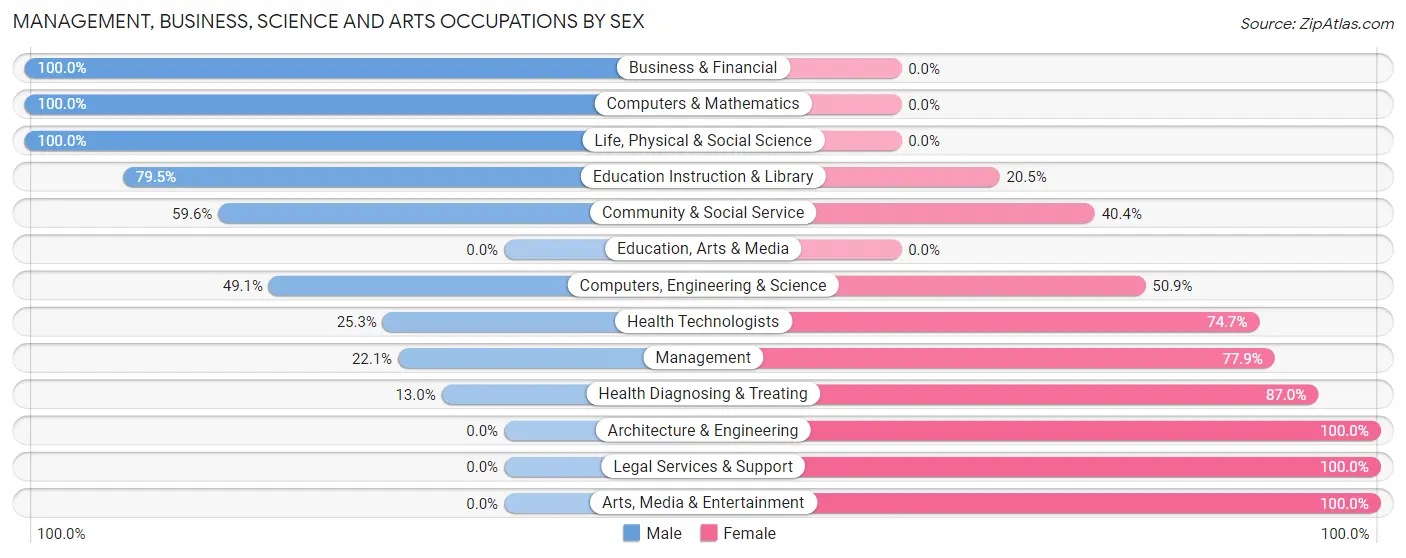
Management, Business, Science and Arts Occupations by Sex
Within the Management, Business, Science and Arts occupations in Ripley, the most male-oriented occupations are Business & Financial (100.0%), Computers & Mathematics (100.0%), and Life, Physical & Social Science (100.0%), while the most female-oriented occupations are Architecture & Engineering (100.0%), Legal Services & Support (100.0%), and Arts, Media & Entertainment (100.0%).
| Occupation | Male | Female |
| Management | 25 (22.1%) | 88 (77.9%) |
| Business & Financial | 30 (100.0%) | 0 (0.0%) |
| Computers, Engineering & Science | 52 (49.1%) | 54 (50.9%) |
| Computers & Mathematics | 29 (100.0%) | 0 (0.0%) |
| Architecture & Engineering | 0 (0.0%) | 54 (100.0%) |
| Life, Physical & Social Science | 23 (100.0%) | 0 (0.0%) |
| Community & Social Service | 62 (59.6%) | 42 (40.4%) |
| Education, Arts & Media | 0 (0.0%) | 0 (0.0%) |
| Legal Services & Support | 0 (0.0%) | 18 (100.0%) |
| Education Instruction & Library | 62 (79.5%) | 16 (20.5%) |
| Arts, Media & Entertainment | 0 (0.0%) | 8 (100.0%) |
| Health Diagnosing & Treating | 21 (13.0%) | 140 (87.0%) |
| Health Technologists | 21 (25.3%) | 62 (74.7%) |
| Total (Category) | 190 (37.0%) | 324 (63.0%) |
| Total (Overall) | 665 (53.2%) | 584 (46.8%) |
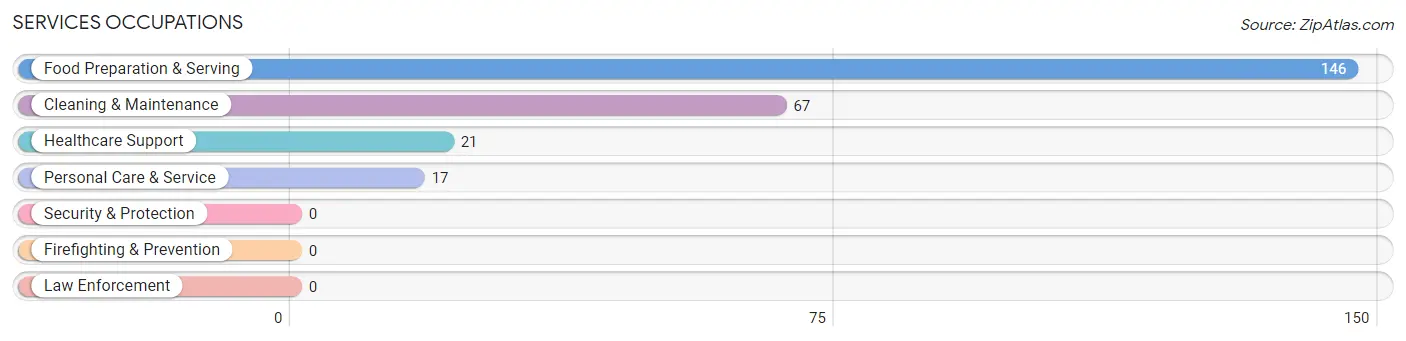
Services Occupations
The most common Services occupations in Ripley are Food Preparation & Serving (146 | 11.7%), Cleaning & Maintenance (67 | 5.4%), Healthcare Support (21 | 1.7%), and Personal Care & Service (17 | 1.4%).
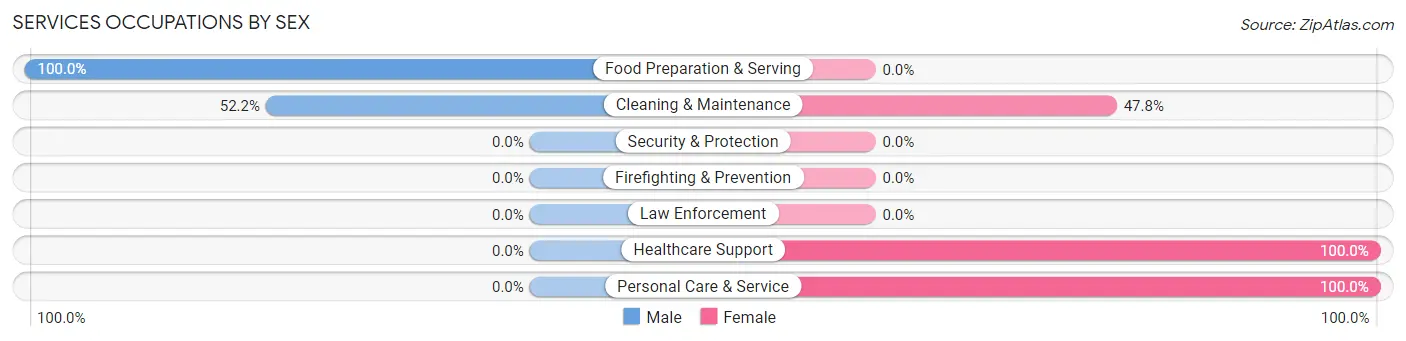
Services Occupations by Sex
Within the Services occupations in Ripley, the most male-oriented occupations are Food Preparation & Serving (100.0%), and Cleaning & Maintenance (52.2%), while the most female-oriented occupations are Healthcare Support (100.0%), Personal Care & Service (100.0%), and Cleaning & Maintenance (47.8%).
| Occupation | Male | Female |
| Healthcare Support | 0 (0.0%) | 21 (100.0%) |
| Security & Protection | 0 (0.0%) | 0 (0.0%) |
| Firefighting & Prevention | 0 (0.0%) | 0 (0.0%) |
| Law Enforcement | 0 (0.0%) | 0 (0.0%) |
| Food Preparation & Serving | 146 (100.0%) | 0 (0.0%) |
| Cleaning & Maintenance | 35 (52.2%) | 32 (47.8%) |
| Personal Care & Service | 0 (0.0%) | 17 (100.0%) |
| Total (Category) | 181 (72.1%) | 70 (27.9%) |
| Total (Overall) | 665 (53.2%) | 584 (46.8%) |
Sales and Office Occupations
The most common Sales and Office occupations in Ripley are Sales & Related (289 | 23.1%), and Office & Administration (138 | 11.1%).
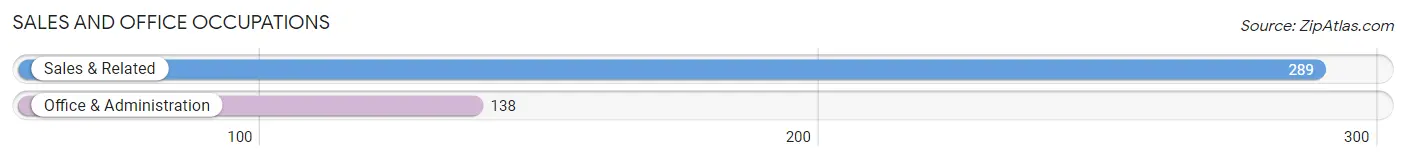
Sales and Office Occupations by Sex
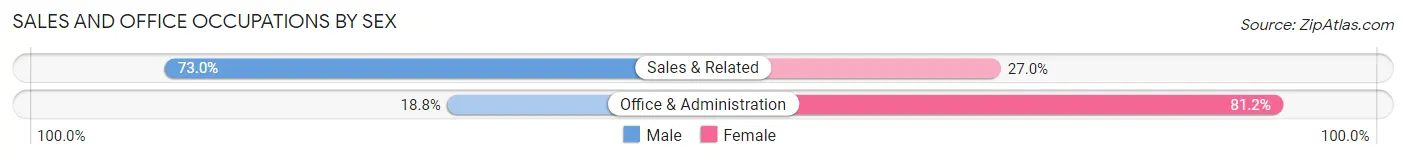
| Occupation | Male | Female |
| Sales & Related | 211 (73.0%) | 78 (27.0%) |
| Office & Administration | 26 (18.8%) | 112 (81.2%) |
| Total (Category) | 237 (55.5%) | 190 (44.5%) |
| Total (Overall) | 665 (53.2%) | 584 (46.8%) |
Natural Resources, Construction and Maintenance Occupations
The most common Natural Resources, Construction and Maintenance occupations in Ripley are , and Farming, Fishing & Forestry (19 | 1.5%).
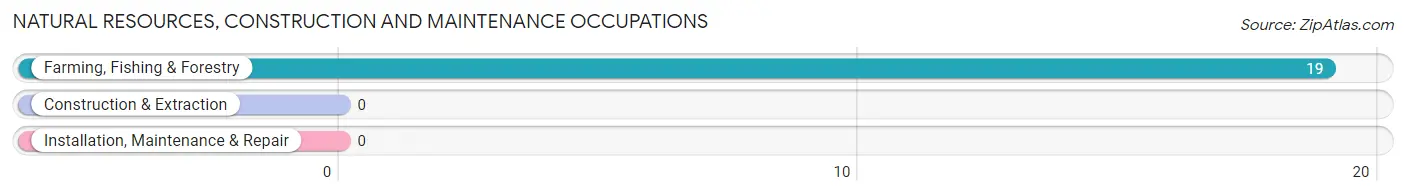
Natural Resources, Construction and Maintenance Occupations by Sex
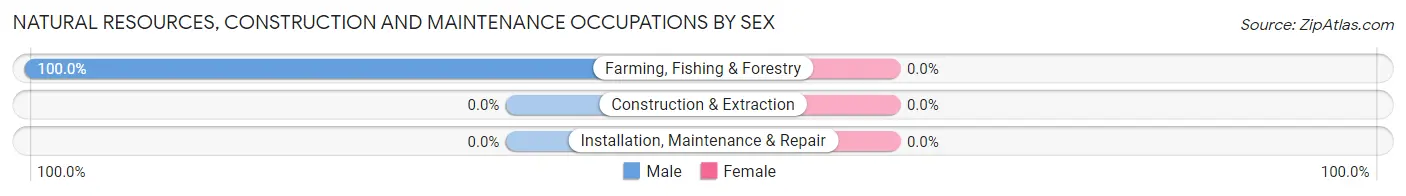
| Occupation | Male | Female |
| Farming, Fishing & Forestry | 19 (100.0%) | 0 (0.0%) |
| Construction & Extraction | 0 (0.0%) | 0 (0.0%) |
| Installation, Maintenance & Repair | 0 (0.0%) | 0 (0.0%) |
| Total (Category) | 19 (100.0%) | 0 (0.0%) |
| Total (Overall) | 665 (53.2%) | 584 (46.8%) |
Production, Transportation and Moving Occupations
The most common Production, Transportation and Moving occupations in Ripley are Material Moving (27 | 2.2%), and Production (11 | 0.9%).
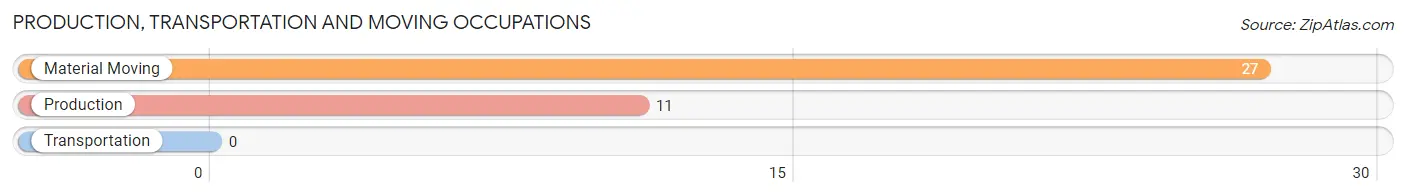
Production, Transportation and Moving Occupations by Sex
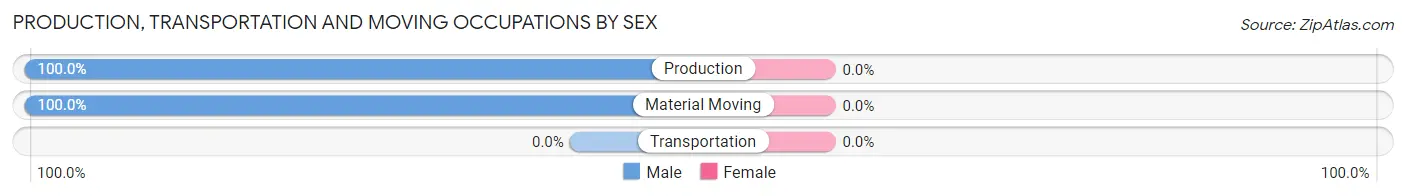
| Occupation | Male | Female |
| Production | 11 (100.0%) | 0 (0.0%) |
| Transportation | 0 (0.0%) | 0 (0.0%) |
| Material Moving | 27 (100.0%) | 0 (0.0%) |
| Total (Category) | 38 (100.0%) | 0 (0.0%) |
| Total (Overall) | 665 (53.2%) | 584 (46.8%) |
Employment Industries by Sex in Ripley
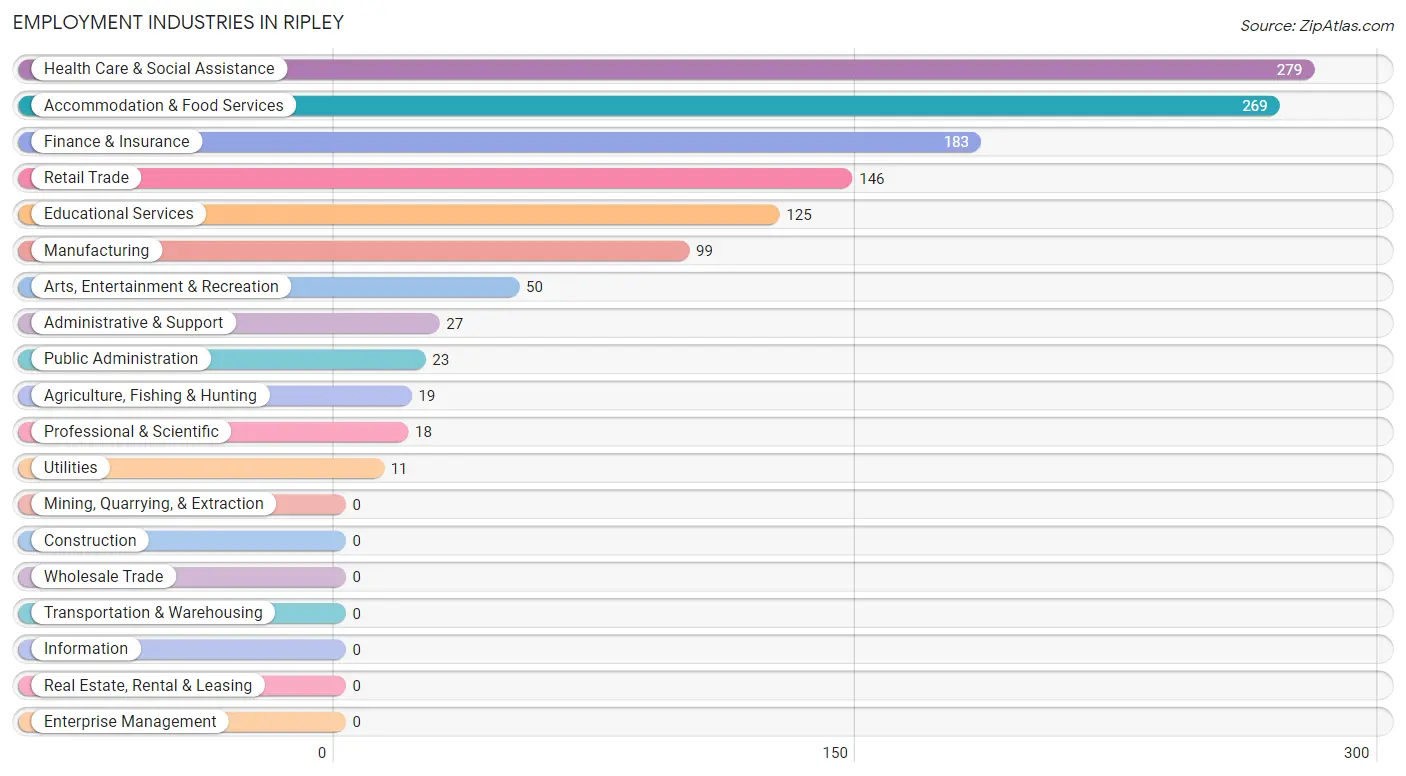
Employment Industries in Ripley
The major employment industries in Ripley include Health Care & Social Assistance (279 | 22.3%), Accommodation & Food Services (269 | 21.5%), Finance & Insurance (183 | 14.6%), Retail Trade (146 | 11.7%), and Educational Services (125 | 10.0%).
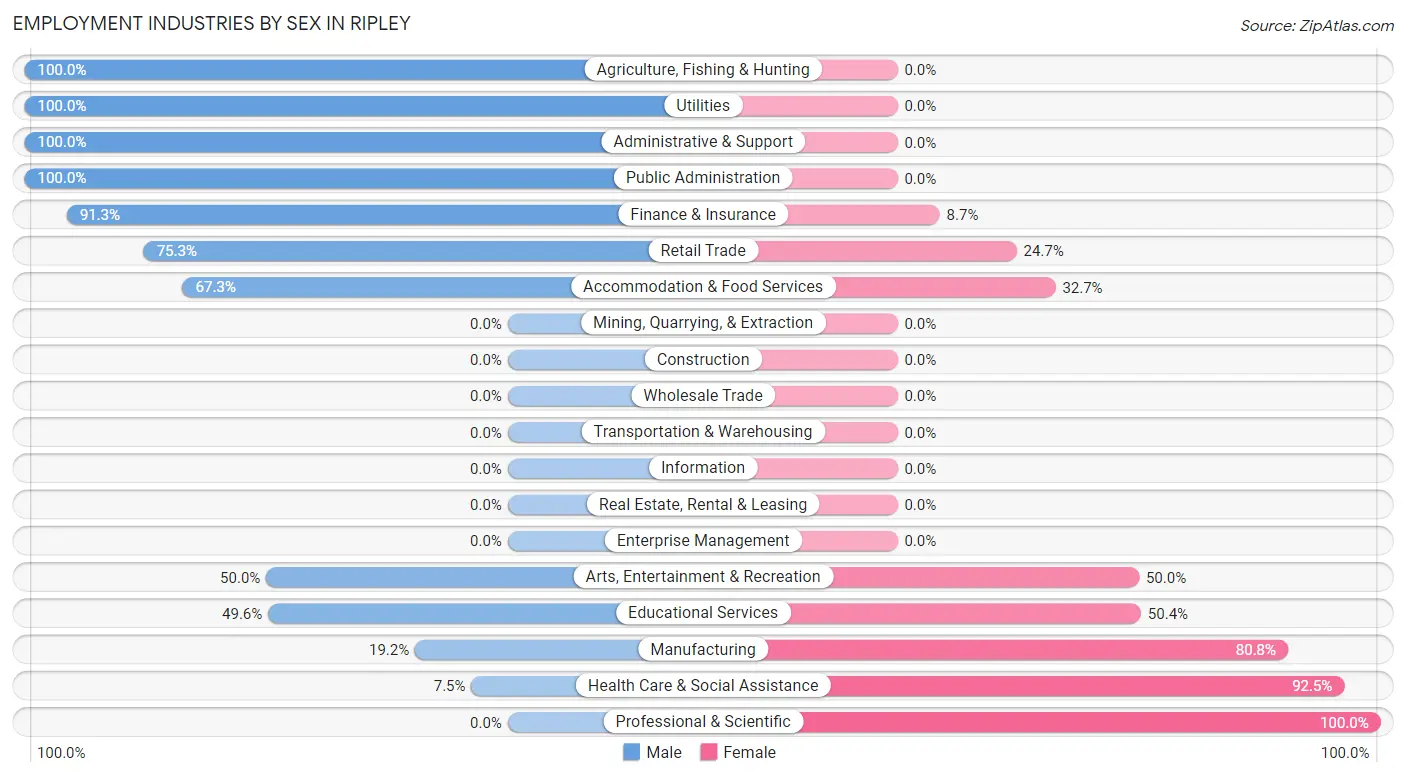
Employment Industries by Sex in Ripley
The Ripley industries that see more men than women are Agriculture, Fishing & Hunting (100.0%), Utilities (100.0%), and Administrative & Support (100.0%), whereas the industries that tend to have a higher number of women are Professional & Scientific (100.0%), Health Care & Social Assistance (92.5%), and Manufacturing (80.8%).
| Industry | Male | Female |
| Agriculture, Fishing & Hunting | 19 (100.0%) | 0 (0.0%) |
| Mining, Quarrying, & Extraction | 0 (0.0%) | 0 (0.0%) |
| Construction | 0 (0.0%) | 0 (0.0%) |
| Manufacturing | 19 (19.2%) | 80 (80.8%) |
| Wholesale Trade | 0 (0.0%) | 0 (0.0%) |
| Retail Trade | 110 (75.3%) | 36 (24.7%) |
| Transportation & Warehousing | 0 (0.0%) | 0 (0.0%) |
| Utilities | 11 (100.0%) | 0 (0.0%) |
| Information | 0 (0.0%) | 0 (0.0%) |
| Finance & Insurance | 167 (91.3%) | 16 (8.7%) |
| Real Estate, Rental & Leasing | 0 (0.0%) | 0 (0.0%) |
| Professional & Scientific | 0 (0.0%) | 18 (100.0%) |
| Enterprise Management | 0 (0.0%) | 0 (0.0%) |
| Administrative & Support | 27 (100.0%) | 0 (0.0%) |
| Educational Services | 62 (49.6%) | 63 (50.4%) |
| Health Care & Social Assistance | 21 (7.5%) | 258 (92.5%) |
| Arts, Entertainment & Recreation | 25 (50.0%) | 25 (50.0%) |
| Accommodation & Food Services | 181 (67.3%) | 88 (32.7%) |
| Public Administration | 23 (100.0%) | 0 (0.0%) |
| Total | 665 (53.2%) | 584 (46.8%) |
Education in Ripley
School Enrollment in Ripley
The most common levels of schooling among the 483 students in Ripley are elementary school (138 | 28.6%), kindergarten (85 | 17.6%), and high school (82 | 17.0%).
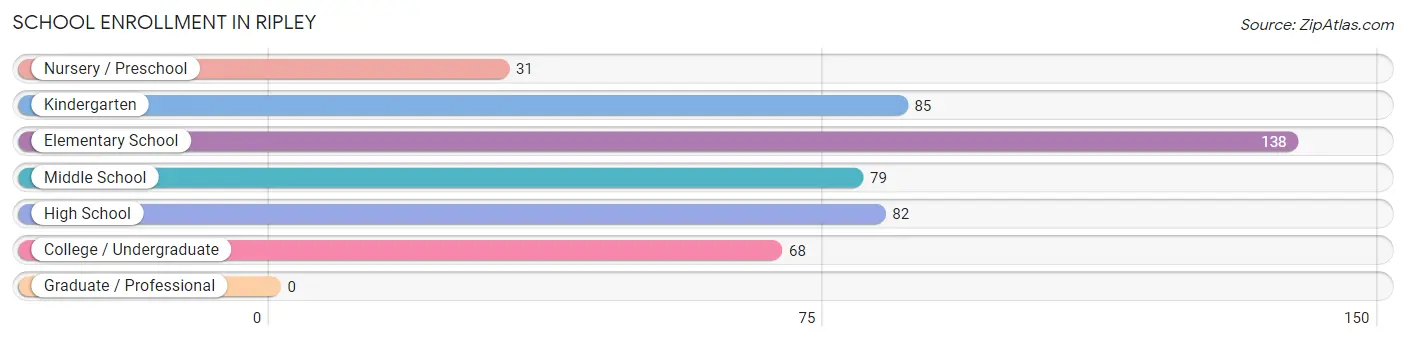
| School Level | # Students | % Students |
| Nursery / Preschool | 31 | 6.4% |
| Kindergarten | 85 | 17.6% |
| Elementary School | 138 | 28.6% |
| Middle School | 79 | 16.4% |
| High School | 82 | 17.0% |
| College / Undergraduate | 68 | 14.1% |
| Graduate / Professional | 0 | 0.0% |
| Total | 483 | 100.0% |
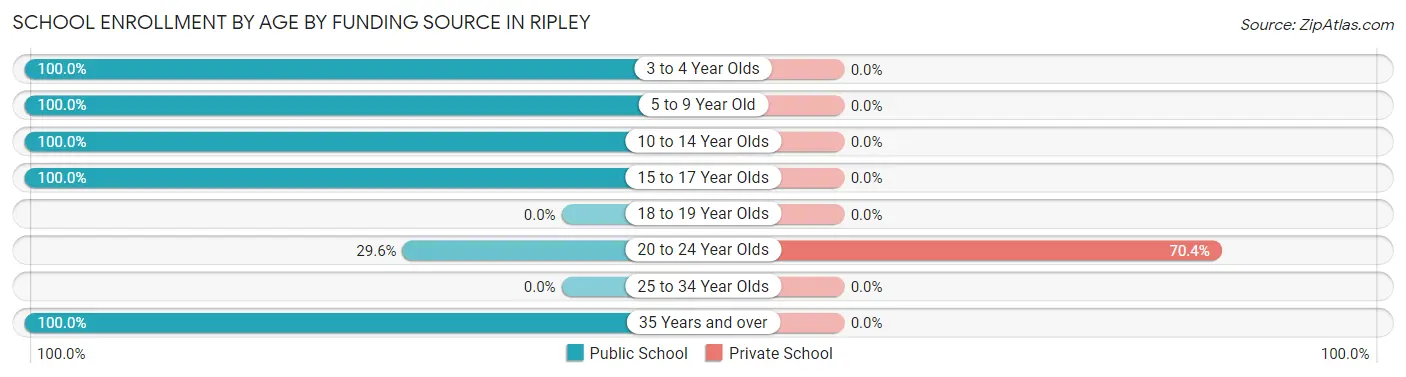
School Enrollment by Age by Funding Source in Ripley
Out of a total of 483 students who are enrolled in schools in Ripley, 38 (7.9%) attend a private institution, while the remaining 445 (92.1%) are enrolled in public schools. The age group of 20 to 24 year olds has the highest likelihood of being enrolled in private schools, with 38 (70.4% in the age bracket) enrolled. Conversely, the age group of 3 to 4 year olds has the lowest likelihood of being enrolled in a private school, with 14 (100.0% in the age bracket) attending a public institution.
| Age Bracket | Public School | Private School |
| 3 to 4 Year Olds | 14 (100.0%) | 0 (0.0%) |
| 5 to 9 Year Old | 240 (100.0%) | 0 (0.0%) |
| 10 to 14 Year Olds | 121 (100.0%) | 0 (0.0%) |
| 15 to 17 Year Olds | 40 (100.0%) | 0 (0.0%) |
| 18 to 19 Year Olds | 0 (0.0%) | 0 (0.0%) |
| 20 to 24 Year Olds | 16 (29.6%) | 38 (70.4%) |
| 25 to 34 Year Olds | 0 (0.0%) | 0 (0.0%) |
| 35 Years and over | 14 (100.0%) | 0 (0.0%) |
| Total | 445 (92.1%) | 38 (7.9%) |
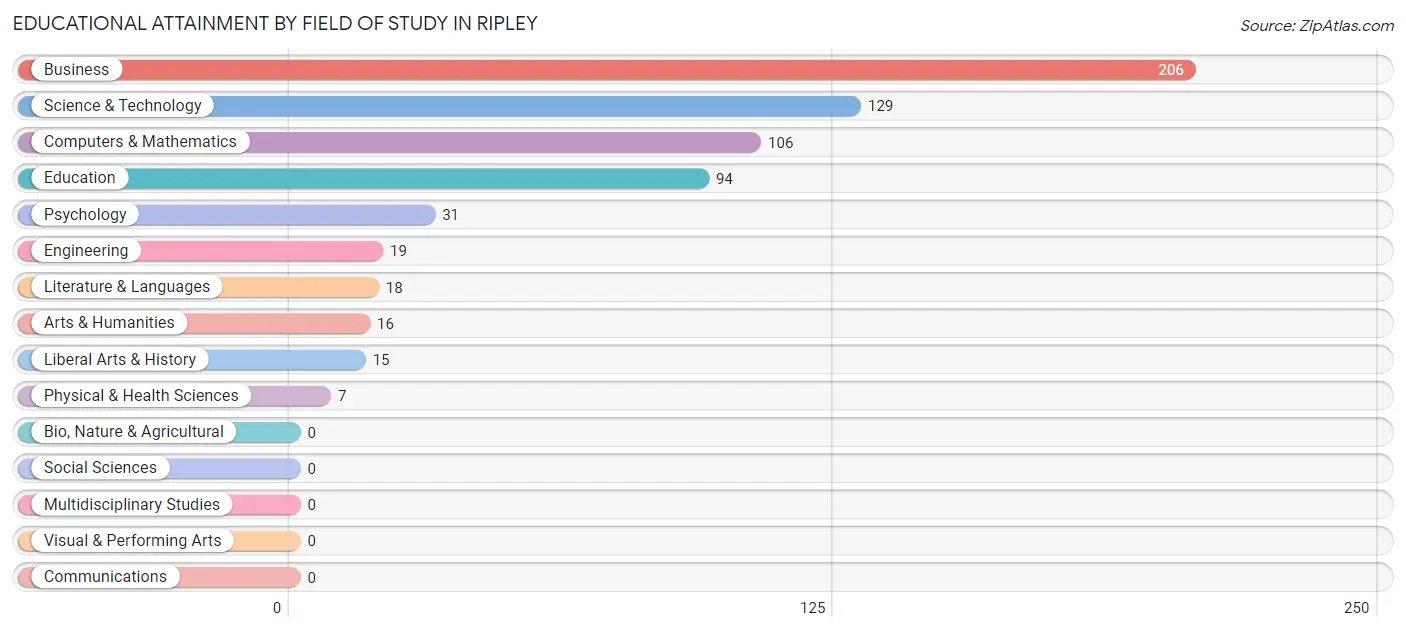
Educational Attainment by Field of Study in Ripley
Business (206 | 32.1%), science & technology (129 | 20.1%), computers & mathematics (106 | 16.5%), education (94 | 14.7%), and psychology (31 | 4.8%) are the most common fields of study among 641 individuals in Ripley who have obtained a bachelor's degree or higher.
| Field of Study | # Graduates | % Graduates |
| Computers & Mathematics | 106 | 16.5% |
| Bio, Nature & Agricultural | 0 | 0.0% |
| Physical & Health Sciences | 7 | 1.1% |
| Psychology | 31 | 4.8% |
| Social Sciences | 0 | 0.0% |
| Engineering | 19 | 3.0% |
| Multidisciplinary Studies | 0 | 0.0% |
| Science & Technology | 129 | 20.1% |
| Business | 206 | 32.1% |
| Education | 94 | 14.7% |
| Literature & Languages | 18 | 2.8% |
| Liberal Arts & History | 15 | 2.3% |
| Visual & Performing Arts | 0 | 0.0% |
| Communications | 0 | 0.0% |
| Arts & Humanities | 16 | 2.5% |
| Total | 641 | 100.0% |
Transportation & Commute in Ripley
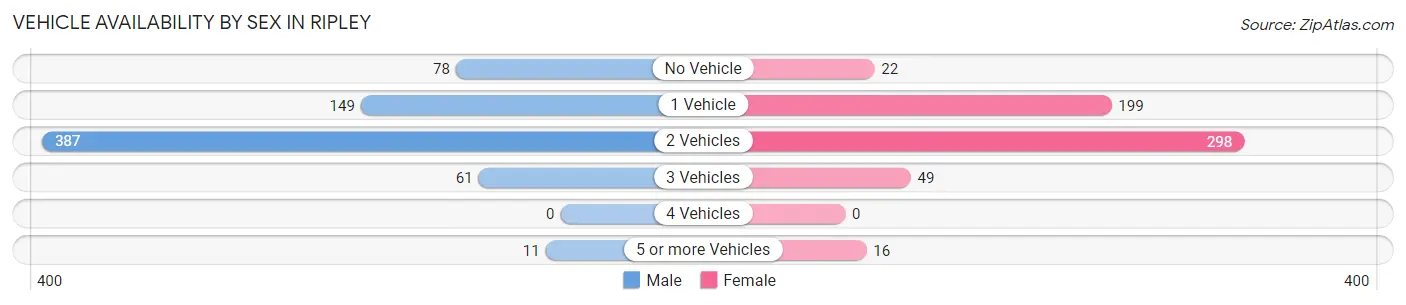
Vehicle Availability by Sex in Ripley
The most prevalent vehicle ownership categories in Ripley are males with 2 vehicles (387, accounting for 56.4%) and females with 2 vehicles (298, making up 66.3%).
| Vehicles Available | Male | Female |
| No Vehicle | 78 (11.4%) | 22 (3.8%) |
| 1 Vehicle | 149 (21.7%) | 199 (34.1%) |
| 2 Vehicles | 387 (56.4%) | 298 (51.0%) |
| 3 Vehicles | 61 (8.9%) | 49 (8.4%) |
| 4 Vehicles | 0 (0.0%) | 0 (0.0%) |
| 5 or more Vehicles | 11 (1.6%) | 16 (2.7%) |
| Total | 686 (100.0%) | 584 (100.0%) |
Commute Time in Ripley
The most frequently occuring commute durations in Ripley are 40 to 44 minutes (407 commuters, 33.8%), 10 to 14 minutes (168 commuters, 14.0%), and less than 5 minutes (124 commuters, 10.3%).
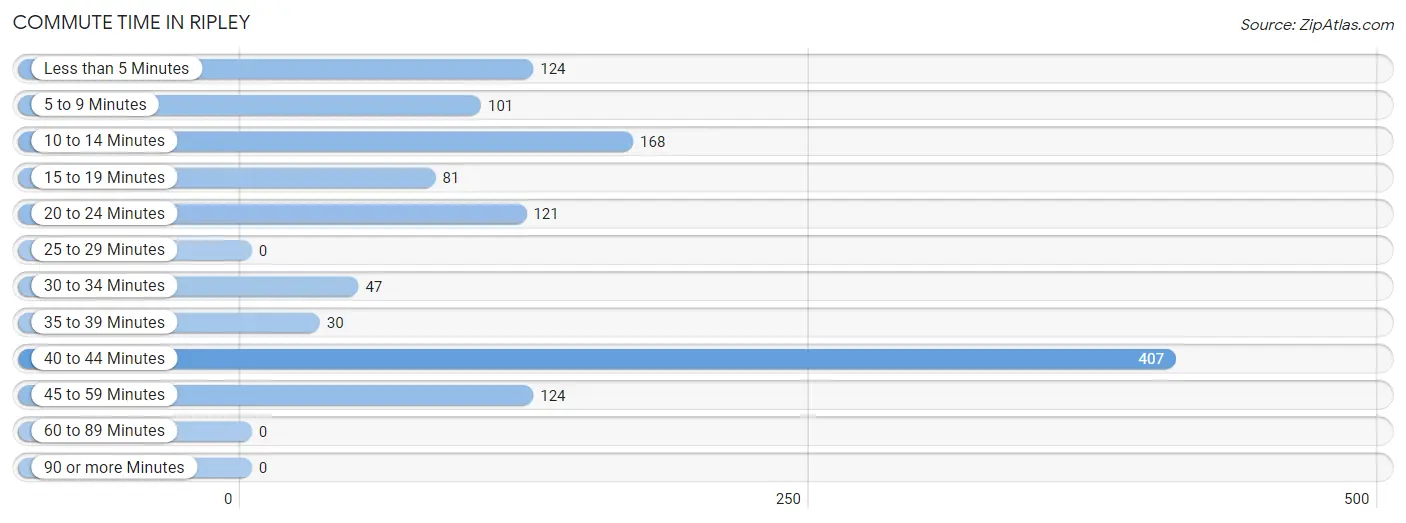
| Commute Time | # Commuters | % Commuters |
| Less than 5 Minutes | 124 | 10.3% |
| 5 to 9 Minutes | 101 | 8.4% |
| 10 to 14 Minutes | 168 | 14.0% |
| 15 to 19 Minutes | 81 | 6.7% |
| 20 to 24 Minutes | 121 | 10.1% |
| 25 to 29 Minutes | 0 | 0.0% |
| 30 to 34 Minutes | 47 | 3.9% |
| 35 to 39 Minutes | 30 | 2.5% |
| 40 to 44 Minutes | 407 | 33.8% |
| 45 to 59 Minutes | 124 | 10.3% |
| 60 to 89 Minutes | 0 | 0.0% |
| 90 or more Minutes | 0 | 0.0% |
Commute Time by Sex in Ripley
The most common commute times in Ripley are 40 to 44 minutes (135 commuters, 21.8%) for males and 40 to 44 minutes (272 commuters, 46.6%) for females.
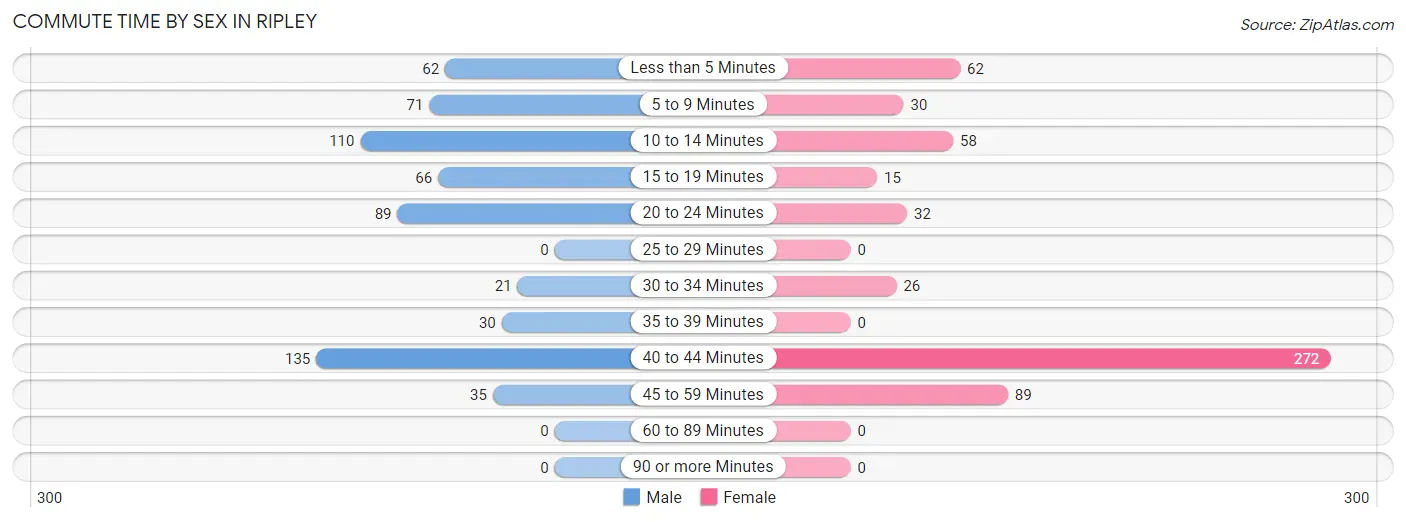
| Commute Time | Male | Female |
| Less than 5 Minutes | 62 (10.0%) | 62 (10.6%) |
| 5 to 9 Minutes | 71 (11.5%) | 30 (5.1%) |
| 10 to 14 Minutes | 110 (17.8%) | 58 (9.9%) |
| 15 to 19 Minutes | 66 (10.7%) | 15 (2.6%) |
| 20 to 24 Minutes | 89 (14.4%) | 32 (5.5%) |
| 25 to 29 Minutes | 0 (0.0%) | 0 (0.0%) |
| 30 to 34 Minutes | 21 (3.4%) | 26 (4.4%) |
| 35 to 39 Minutes | 30 (4.9%) | 0 (0.0%) |
| 40 to 44 Minutes | 135 (21.8%) | 272 (46.6%) |
| 45 to 59 Minutes | 35 (5.7%) | 89 (15.2%) |
| 60 to 89 Minutes | 0 (0.0%) | 0 (0.0%) |
| 90 or more Minutes | 0 (0.0%) | 0 (0.0%) |
Time of Departure to Work by Sex in Ripley
The most frequent times of departure to work in Ripley are 8:00 AM to 8:29 AM (240, 38.8%) for males and 6:00 AM to 6:29 AM (180, 30.8%) for females.
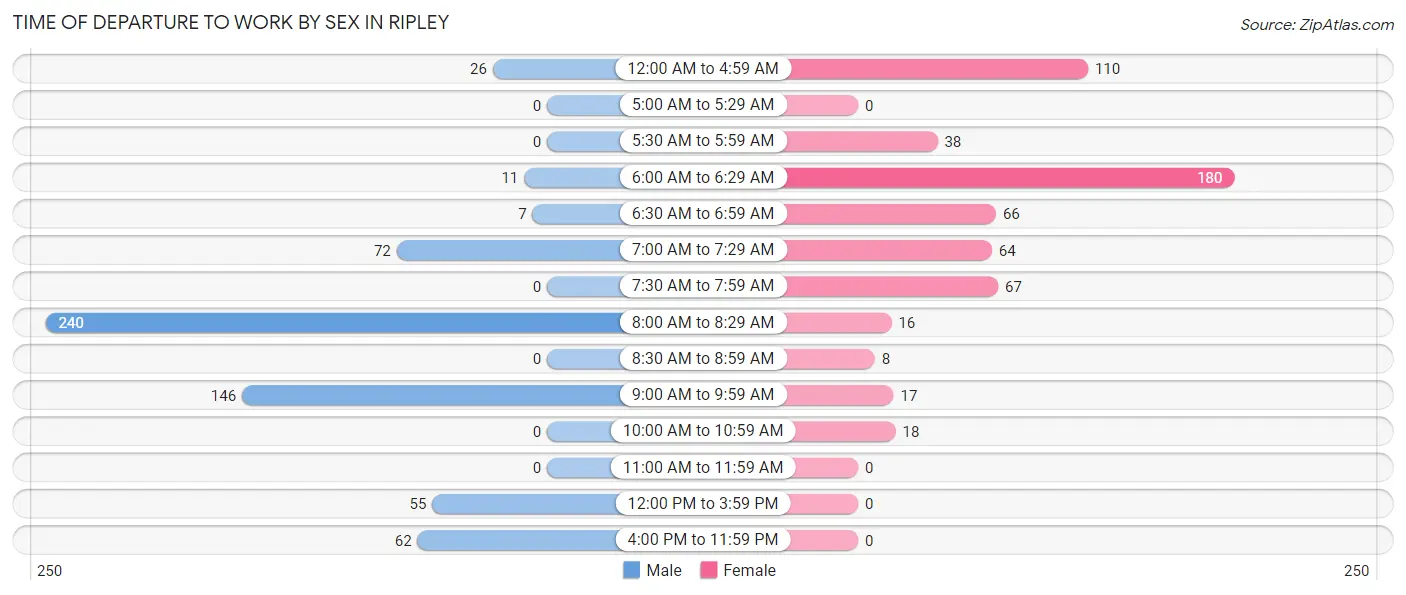
| Time of Departure | Male | Female |
| 12:00 AM to 4:59 AM | 26 (4.2%) | 110 (18.8%) |
| 5:00 AM to 5:29 AM | 0 (0.0%) | 0 (0.0%) |
| 5:30 AM to 5:59 AM | 0 (0.0%) | 38 (6.5%) |
| 6:00 AM to 6:29 AM | 11 (1.8%) | 180 (30.8%) |
| 6:30 AM to 6:59 AM | 7 (1.1%) | 66 (11.3%) |
| 7:00 AM to 7:29 AM | 72 (11.6%) | 64 (11.0%) |
| 7:30 AM to 7:59 AM | 0 (0.0%) | 67 (11.5%) |
| 8:00 AM to 8:29 AM | 240 (38.8%) | 16 (2.7%) |
| 8:30 AM to 8:59 AM | 0 (0.0%) | 8 (1.4%) |
| 9:00 AM to 9:59 AM | 146 (23.6%) | 17 (2.9%) |
| 10:00 AM to 10:59 AM | 0 (0.0%) | 18 (3.1%) |
| 11:00 AM to 11:59 AM | 0 (0.0%) | 0 (0.0%) |
| 12:00 PM to 3:59 PM | 55 (8.9%) | 0 (0.0%) |
| 4:00 PM to 11:59 PM | 62 (10.0%) | 0 (0.0%) |
| Total | 619 (100.0%) | 584 (100.0%) |
Housing Occupancy in Ripley
Occupancy by Ownership in Ripley
Of the total 1,445 dwellings in Ripley, owner-occupied units account for 637 (44.1%), while renter-occupied units make up 808 (55.9%).
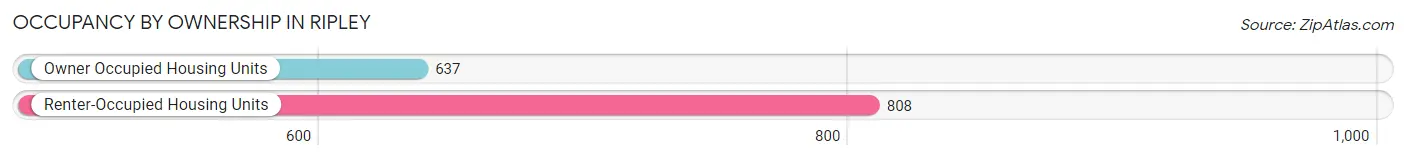
| Occupancy | # Housing Units | % Housing Units |
| Owner Occupied Housing Units | 637 | 44.1% |
| Renter-Occupied Housing Units | 808 | 55.9% |
| Total Occupied Housing Units | 1,445 | 100.0% |
Occupancy by Household Size in Ripley
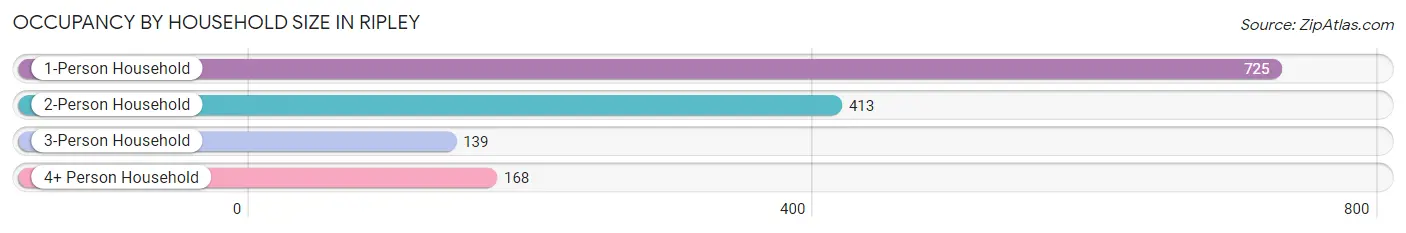
| Household Size | # Housing Units | % Housing Units |
| 1-Person Household | 725 | 50.2% |
| 2-Person Household | 413 | 28.6% |
| 3-Person Household | 139 | 9.6% |
| 4+ Person Household | 168 | 11.6% |
| Total Housing Units | 1,445 | 100.0% |
Occupancy by Ownership by Household Size in Ripley
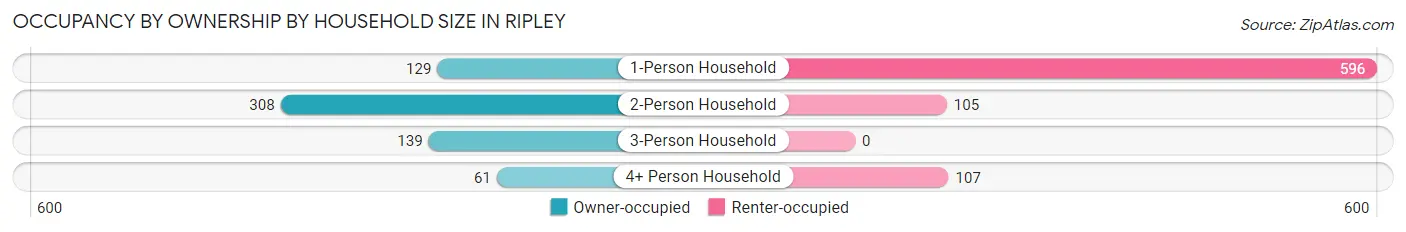
| Household Size | Owner-occupied | Renter-occupied |
| 1-Person Household | 129 (17.8%) | 596 (82.2%) |
| 2-Person Household | 308 (74.6%) | 105 (25.4%) |
| 3-Person Household | 139 (100.0%) | 0 (0.0%) |
| 4+ Person Household | 61 (36.3%) | 107 (63.7%) |
| Total Housing Units | 637 (44.1%) | 808 (55.9%) |
Occupancy by Educational Attainment in Ripley
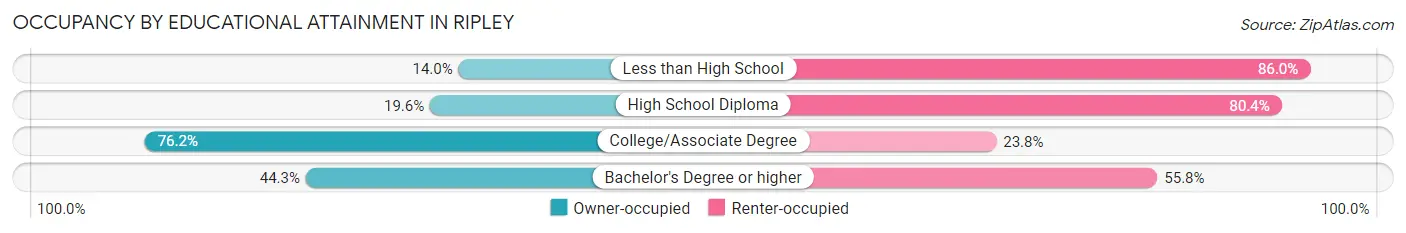
| Household Size | Owner-occupied | Renter-occupied |
| Less than High School | 19 (14.0%) | 117 (86.0%) |
| High School Diploma | 93 (19.6%) | 381 (80.4%) |
| College/Associate Degree | 371 (76.2%) | 116 (23.8%) |
| Bachelor's Degree or higher | 154 (44.3%) | 194 (55.7%) |
Occupancy by Age of Householder in Ripley
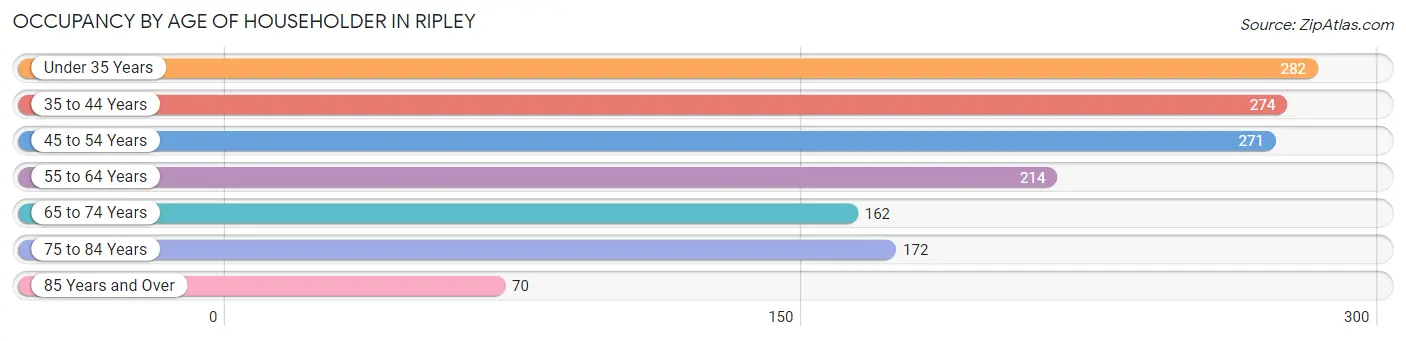
| Age Bracket | # Households | % Households |
| Under 35 Years | 282 | 19.5% |
| 35 to 44 Years | 274 | 19.0% |
| 45 to 54 Years | 271 | 18.8% |
| 55 to 64 Years | 214 | 14.8% |
| 65 to 74 Years | 162 | 11.2% |
| 75 to 84 Years | 172 | 11.9% |
| 85 Years and Over | 70 | 4.8% |
| Total | 1,445 | 100.0% |
Housing Finances in Ripley
Median Income by Occupancy in Ripley
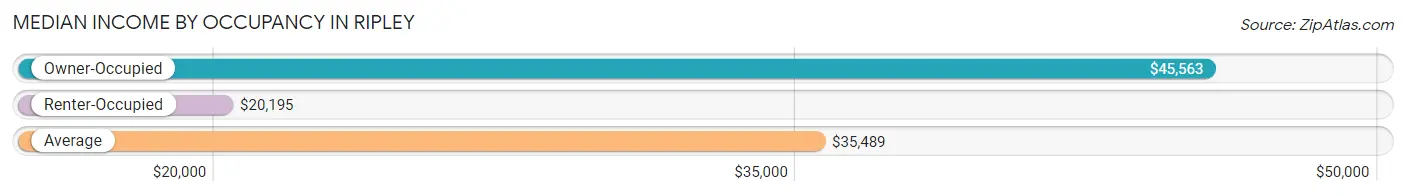
| Occupancy Type | # Households | Median Income |
| Owner-Occupied | 637 (44.1%) | $45,563 |
| Renter-Occupied | 808 (55.9%) | $20,195 |
| Average | 1,445 (100.0%) | $35,489 |
Occupancy by Householder Income Bracket in Ripley
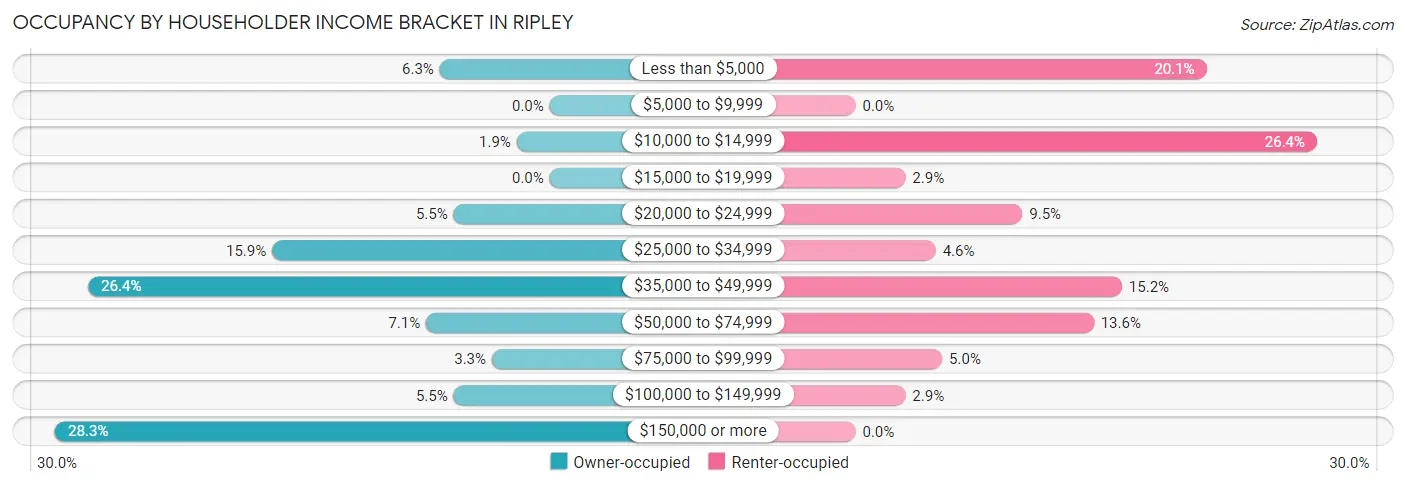
| Income Bracket | Owner-occupied | Renter-occupied |
| Less than $5,000 | 40 (6.3%) | 162 (20.1%) |
| $5,000 to $9,999 | 0 (0.0%) | 0 (0.0%) |
| $10,000 to $14,999 | 12 (1.9%) | 213 (26.4%) |
| $15,000 to $19,999 | 0 (0.0%) | 23 (2.9%) |
| $20,000 to $24,999 | 35 (5.5%) | 77 (9.5%) |
| $25,000 to $34,999 | 101 (15.9%) | 37 (4.6%) |
| $35,000 to $49,999 | 168 (26.4%) | 123 (15.2%) |
| $50,000 to $74,999 | 45 (7.1%) | 110 (13.6%) |
| $75,000 to $99,999 | 21 (3.3%) | 40 (5.0%) |
| $100,000 to $149,999 | 35 (5.5%) | 23 (2.9%) |
| $150,000 or more | 180 (28.3%) | 0 (0.0%) |
| Total | 637 (100.0%) | 808 (100.0%) |
Monthly Housing Cost Tiers in Ripley
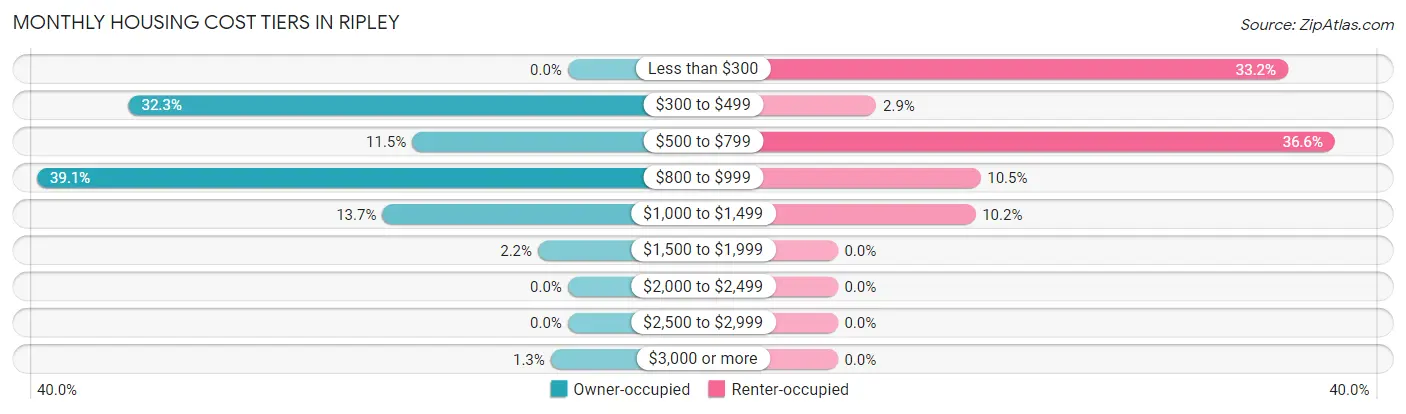
| Monthly Cost | Owner-occupied | Renter-occupied |
| Less than $300 | 0 (0.0%) | 268 (33.2%) |
| $300 to $499 | 206 (32.3%) | 23 (2.9%) |
| $500 to $799 | 73 (11.5%) | 296 (36.6%) |
| $800 to $999 | 249 (39.1%) | 85 (10.5%) |
| $1,000 to $1,499 | 87 (13.7%) | 82 (10.2%) |
| $1,500 to $1,999 | 14 (2.2%) | 0 (0.0%) |
| $2,000 to $2,499 | 0 (0.0%) | 0 (0.0%) |
| $2,500 to $2,999 | 0 (0.0%) | 0 (0.0%) |
| $3,000 or more | 8 (1.3%) | 0 (0.0%) |
| Total | 637 (100.0%) | 808 (100.0%) |
Physical Housing Characteristics in Ripley
Housing Structures in Ripley
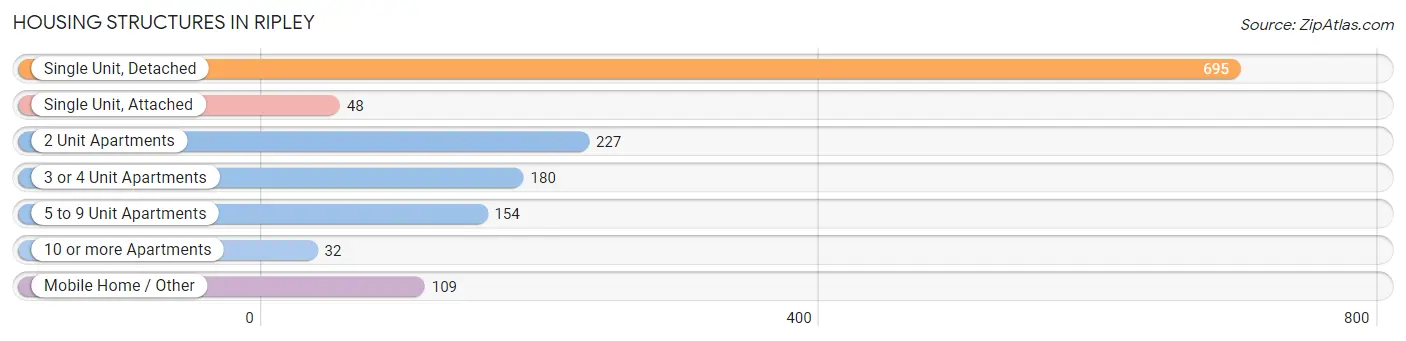
| Structure Type | # Housing Units | % Housing Units |
| Single Unit, Detached | 695 | 48.1% |
| Single Unit, Attached | 48 | 3.3% |
| 2 Unit Apartments | 227 | 15.7% |
| 3 or 4 Unit Apartments | 180 | 12.5% |
| 5 to 9 Unit Apartments | 154 | 10.7% |
| 10 or more Apartments | 32 | 2.2% |
| Mobile Home / Other | 109 | 7.5% |
| Total | 1,445 | 100.0% |
Housing Structures by Occupancy in Ripley
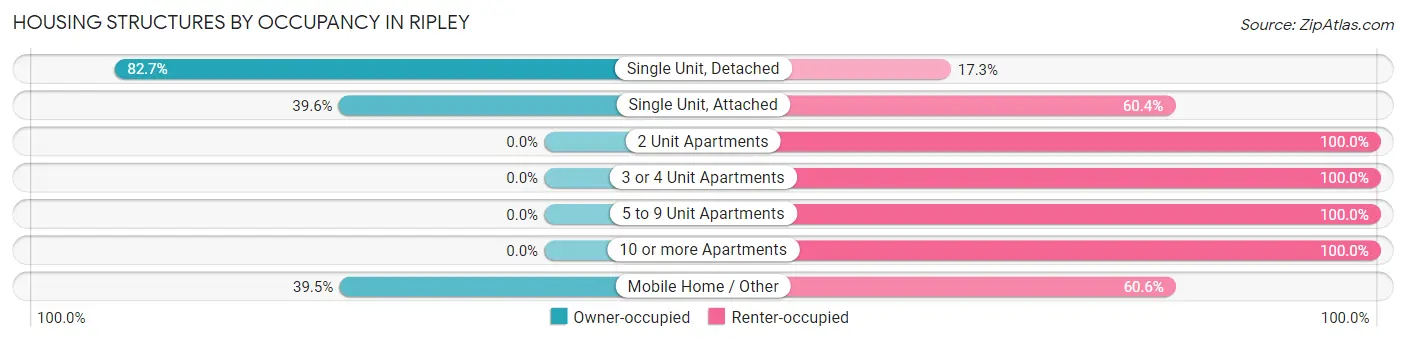
| Structure Type | Owner-occupied | Renter-occupied |
| Single Unit, Detached | 575 (82.7%) | 120 (17.3%) |
| Single Unit, Attached | 19 (39.6%) | 29 (60.4%) |
| 2 Unit Apartments | 0 (0.0%) | 227 (100.0%) |
| 3 or 4 Unit Apartments | 0 (0.0%) | 180 (100.0%) |
| 5 to 9 Unit Apartments | 0 (0.0%) | 154 (100.0%) |
| 10 or more Apartments | 0 (0.0%) | 32 (100.0%) |
| Mobile Home / Other | 43 (39.5%) | 66 (60.6%) |
| Total | 637 (44.1%) | 808 (55.9%) |
Housing Structures by Number of Rooms in Ripley
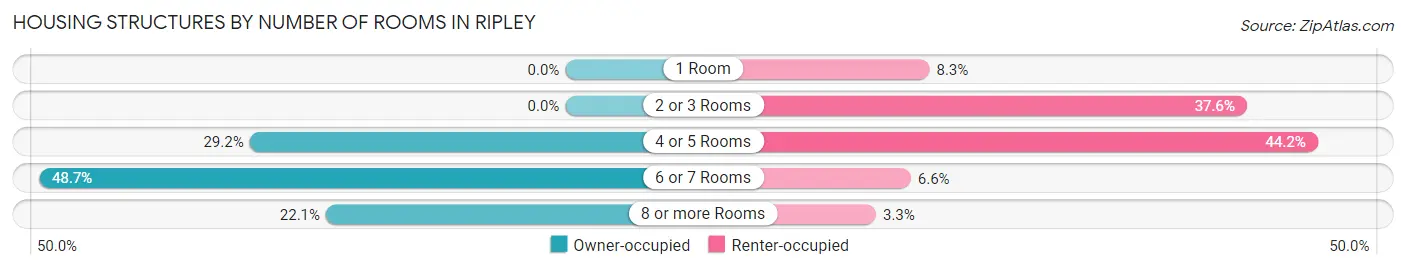
| Number of Rooms | Owner-occupied | Renter-occupied |
| 1 Room | 0 (0.0%) | 67 (8.3%) |
| 2 or 3 Rooms | 0 (0.0%) | 304 (37.6%) |
| 4 or 5 Rooms | 186 (29.2%) | 357 (44.2%) |
| 6 or 7 Rooms | 310 (48.7%) | 53 (6.6%) |
| 8 or more Rooms | 141 (22.1%) | 27 (3.3%) |
| Total | 637 (100.0%) | 808 (100.0%) |
Housing Structure by Heating Type in Ripley
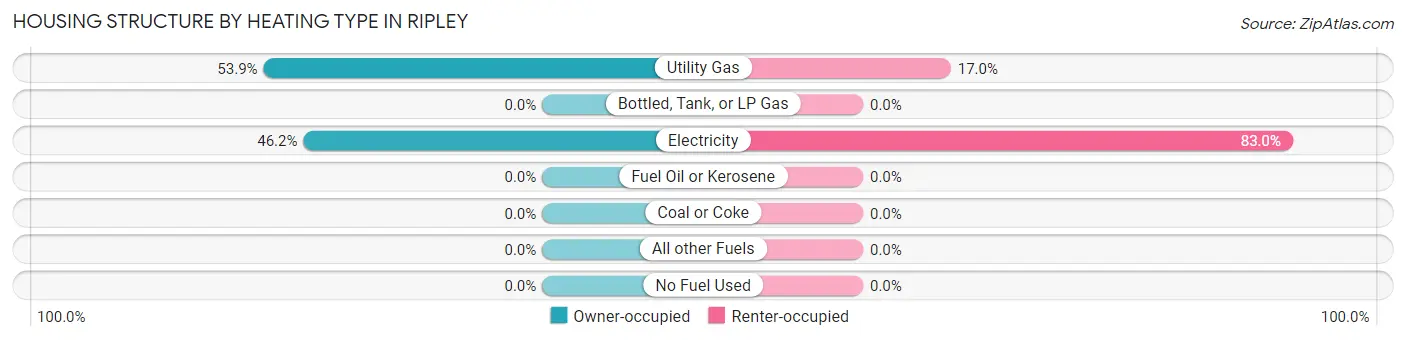
| Heating Type | Owner-occupied | Renter-occupied |
| Utility Gas | 343 (53.8%) | 137 (17.0%) |
| Bottled, Tank, or LP Gas | 0 (0.0%) | 0 (0.0%) |
| Electricity | 294 (46.2%) | 671 (83.0%) |
| Fuel Oil or Kerosene | 0 (0.0%) | 0 (0.0%) |
| Coal or Coke | 0 (0.0%) | 0 (0.0%) |
| All other Fuels | 0 (0.0%) | 0 (0.0%) |
| No Fuel Used | 0 (0.0%) | 0 (0.0%) |
| Total | 637 (100.0%) | 808 (100.0%) |
Household Vehicle Usage in Ripley
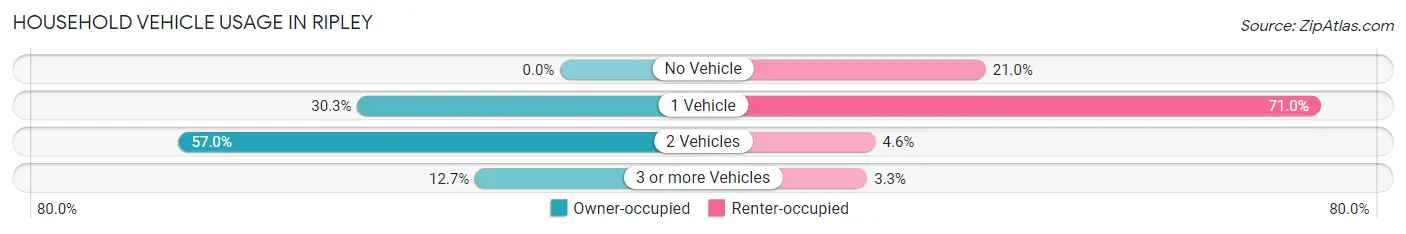
| Vehicles per Household | Owner-occupied | Renter-occupied |
| No Vehicle | 0 (0.0%) | 170 (21.0%) |
| 1 Vehicle | 193 (30.3%) | 574 (71.0%) |
| 2 Vehicles | 363 (57.0%) | 37 (4.6%) |
| 3 or more Vehicles | 81 (12.7%) | 27 (3.3%) |
| Total | 637 (100.0%) | 808 (100.0%) |
Real Estate & Mortgages in Ripley
Real Estate and Mortgage Overview in Ripley
| Characteristic | Without Mortgage | With Mortgage |
| Housing Units | 216 | 421 |
| Median Property Value | $144,800 | $111,700 |
| Median Household Income | $37,213 | $144 |
| Monthly Housing Costs | $410 | $8 |
| Real Estate Taxes | $1,049 | $0 |
Property Value by Mortgage Status in Ripley
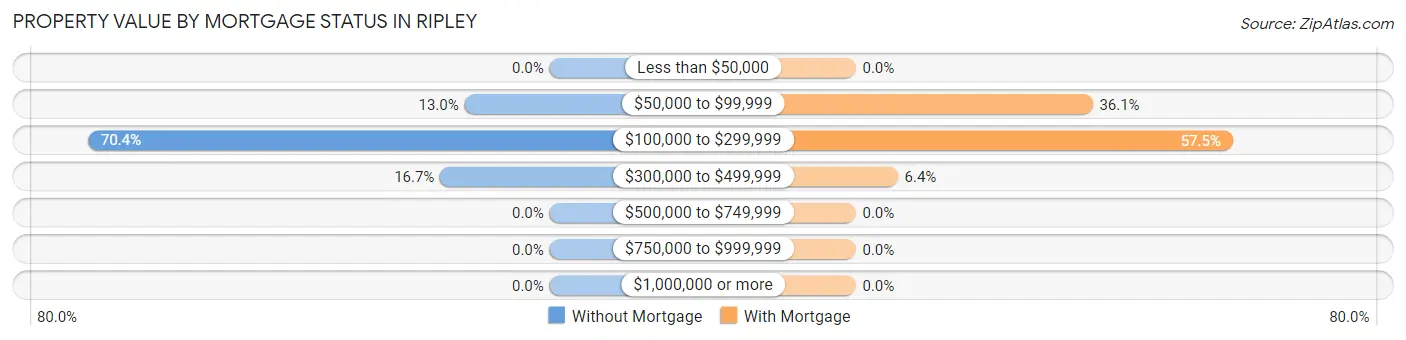
| Property Value | Without Mortgage | With Mortgage |
| Less than $50,000 | 0 (0.0%) | 0 (0.0%) |
| $50,000 to $99,999 | 28 (13.0%) | 152 (36.1%) |
| $100,000 to $299,999 | 152 (70.4%) | 242 (57.5%) |
| $300,000 to $499,999 | 36 (16.7%) | 27 (6.4%) |
| $500,000 to $749,999 | 0 (0.0%) | 0 (0.0%) |
| $750,000 to $999,999 | 0 (0.0%) | 0 (0.0%) |
| $1,000,000 or more | 0 (0.0%) | 0 (0.0%) |
| Total | 216 (100.0%) | 421 (100.0%) |
Household Income by Mortgage Status in Ripley
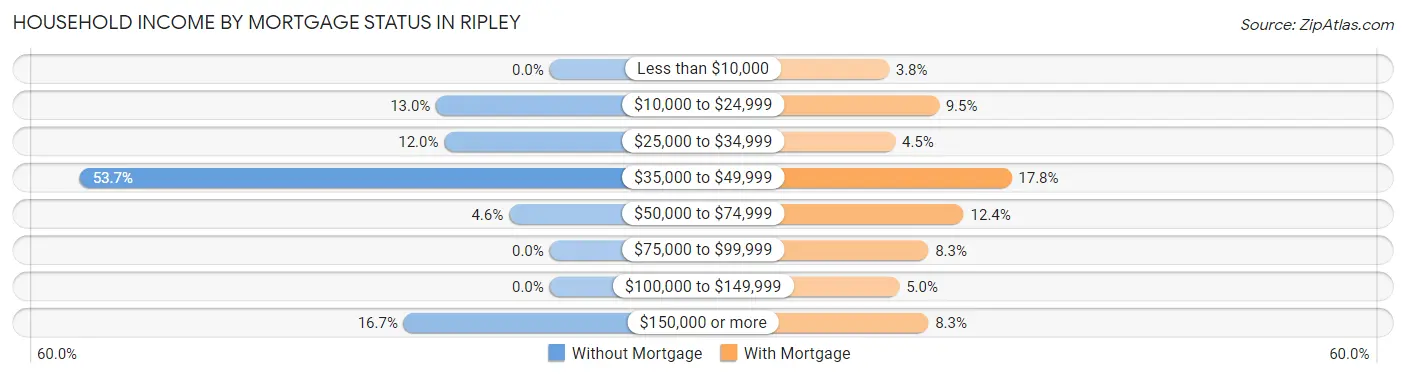
| Household Income | Without Mortgage | With Mortgage |
| Less than $10,000 | 0 (0.0%) | 16 (3.8%) |
| $10,000 to $24,999 | 28 (13.0%) | 40 (9.5%) |
| $25,000 to $34,999 | 26 (12.0%) | 19 (4.5%) |
| $35,000 to $49,999 | 116 (53.7%) | 75 (17.8%) |
| $50,000 to $74,999 | 10 (4.6%) | 52 (12.3%) |
| $75,000 to $99,999 | 0 (0.0%) | 35 (8.3%) |
| $100,000 to $149,999 | 0 (0.0%) | 21 (5.0%) |
| $150,000 or more | 36 (16.7%) | 35 (8.3%) |
| Total | 216 (100.0%) | 421 (100.0%) |
Property Value to Household Income Ratio in Ripley
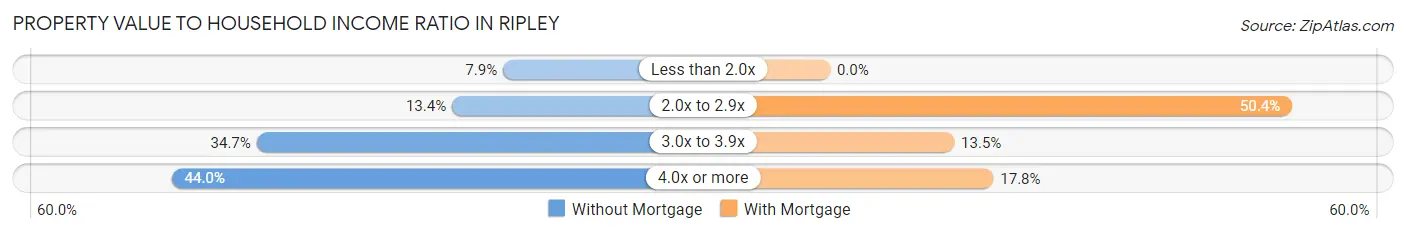
| Value-to-Income Ratio | Without Mortgage | With Mortgage |
| Less than 2.0x | 17 (7.9%) | 0 (0.0%) |
| 2.0x to 2.9x | 29 (13.4%) | 212 (50.4%) |
| 3.0x to 3.9x | 75 (34.7%) | 57 (13.5%) |
| 4.0x or more | 95 (44.0%) | 75 (17.8%) |
| Total | 216 (100.0%) | 421 (100.0%) |
Real Estate Taxes by Mortgage Status in Ripley
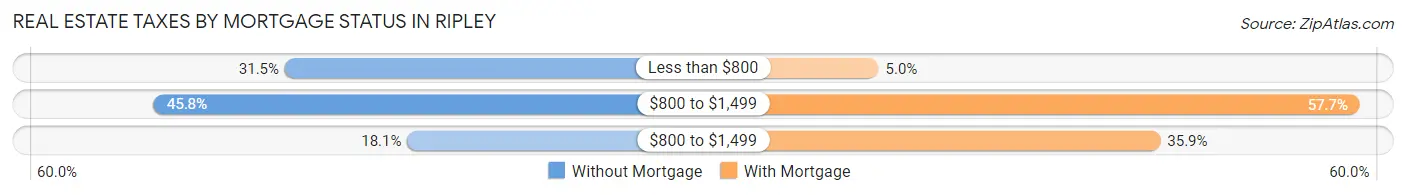
| Property Taxes | Without Mortgage | With Mortgage |
| Less than $800 | 68 (31.5%) | 21 (5.0%) |
| $800 to $1,499 | 99 (45.8%) | 243 (57.7%) |
| $800 to $1,499 | 39 (18.1%) | 151 (35.9%) |
| Total | 216 (100.0%) | 421 (100.0%) |
Health & Disability in Ripley
Health Insurance Coverage by Age in Ripley
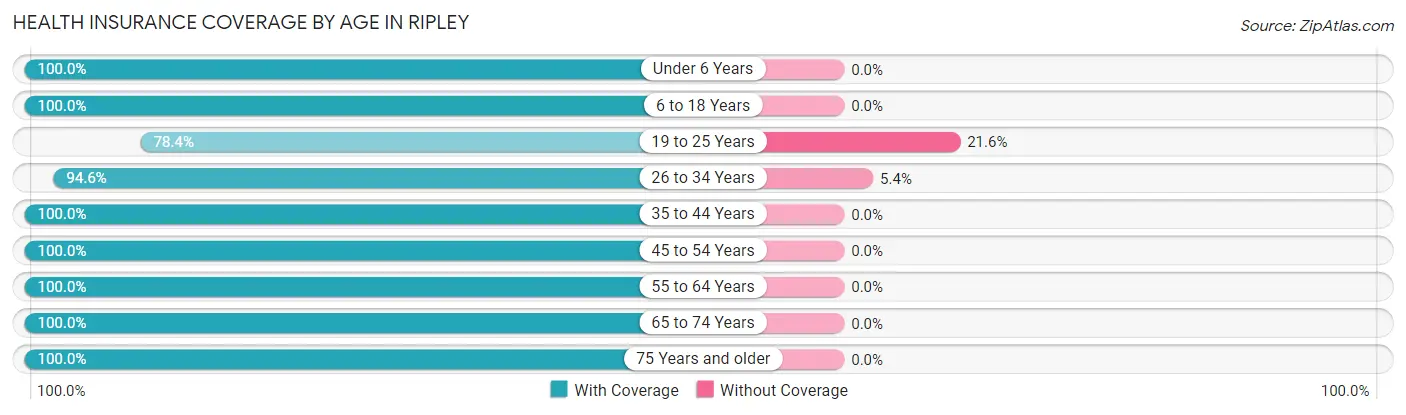
| Age Bracket | With Coverage | Without Coverage |
| Under 6 Years | 200 (100.0%) | 0 (0.0%) |
| 6 to 18 Years | 364 (100.0%) | 0 (0.0%) |
| 19 to 25 Years | 58 (78.4%) | 16 (21.6%) |
| 26 to 34 Years | 352 (94.6%) | 20 (5.4%) |
| 35 to 44 Years | 541 (100.0%) | 0 (0.0%) |
| 45 to 54 Years | 365 (100.0%) | 0 (0.0%) |
| 55 to 64 Years | 387 (100.0%) | 0 (0.0%) |
| 65 to 74 Years | 323 (100.0%) | 0 (0.0%) |
| 75 Years and older | 320 (100.0%) | 0 (0.0%) |
| Total | 2,910 (98.8%) | 36 (1.2%) |
Health Insurance Coverage by Citizenship Status in Ripley
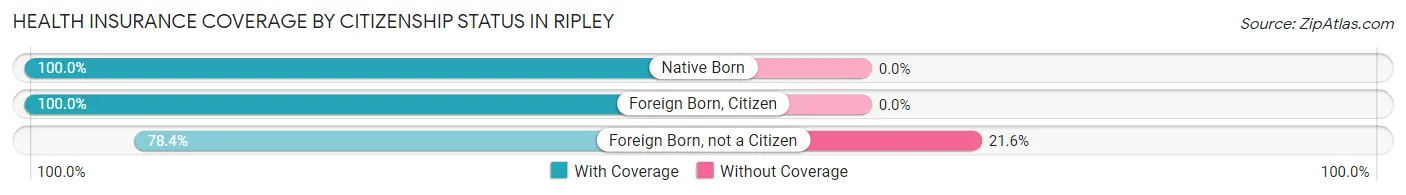
| Citizenship Status | With Coverage | Without Coverage |
| Native Born | 200 (100.0%) | 0 (0.0%) |
| Foreign Born, Citizen | 364 (100.0%) | 0 (0.0%) |
| Foreign Born, not a Citizen | 58 (78.4%) | 16 (21.6%) |
Health Insurance Coverage by Household Income in Ripley
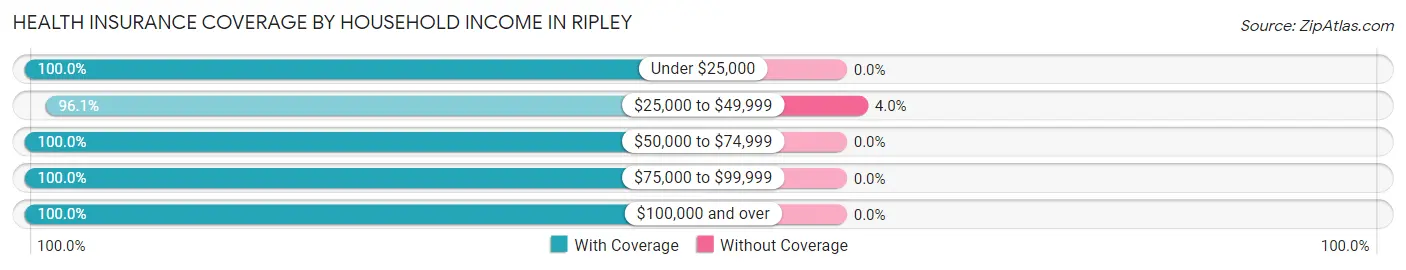
| Household Income | With Coverage | Without Coverage |
| Under $25,000 | 669 (100.0%) | 0 (0.0%) |
| $25,000 to $49,999 | 876 (96.1%) | 36 (4.0%) |
| $50,000 to $74,999 | 360 (100.0%) | 0 (0.0%) |
| $75,000 to $99,999 | 269 (100.0%) | 0 (0.0%) |
| $100,000 and over | 736 (100.0%) | 0 (0.0%) |
Public vs Private Health Insurance Coverage by Age in Ripley
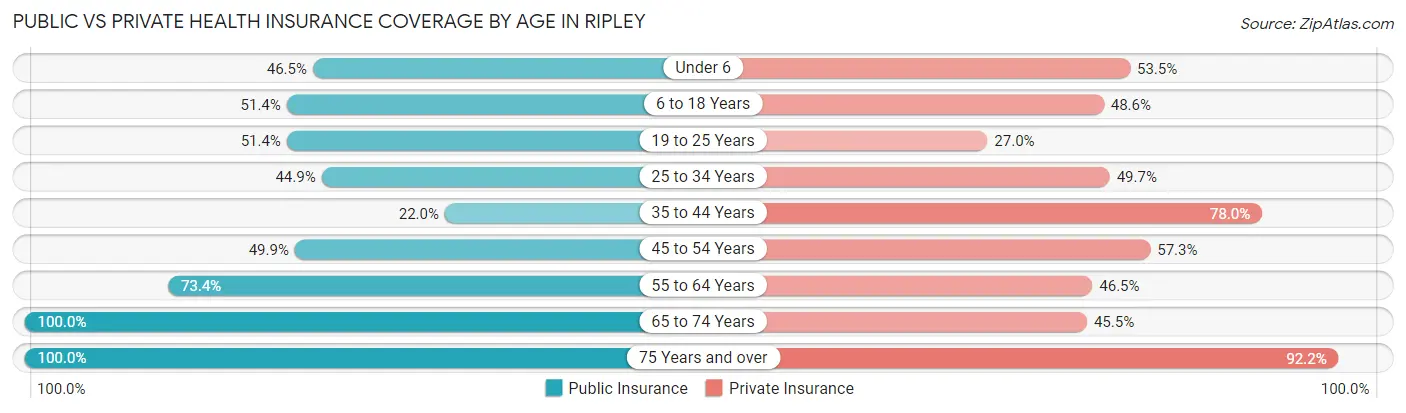
| Age Bracket | Public Insurance | Private Insurance |
| Under 6 | 93 (46.5%) | 107 (53.5%) |
| 6 to 18 Years | 187 (51.4%) | 177 (48.6%) |
| 19 to 25 Years | 38 (51.3%) | 20 (27.0%) |
| 25 to 34 Years | 167 (44.9%) | 185 (49.7%) |
| 35 to 44 Years | 119 (22.0%) | 422 (78.0%) |
| 45 to 54 Years | 182 (49.9%) | 209 (57.3%) |
| 55 to 64 Years | 284 (73.4%) | 180 (46.5%) |
| 65 to 74 Years | 323 (100.0%) | 147 (45.5%) |
| 75 Years and over | 320 (100.0%) | 295 (92.2%) |
| Total | 1,713 (58.2%) | 1,742 (59.1%) |
Disability Status by Sex by Age in Ripley
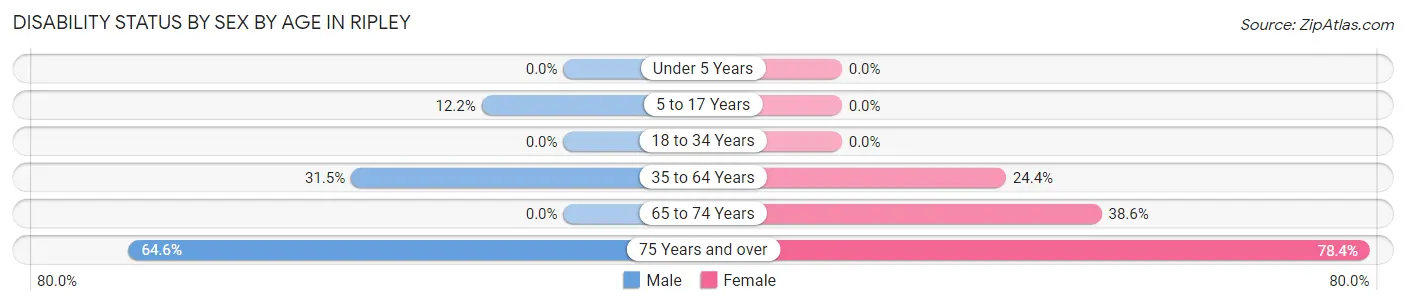
| Age Bracket | Male | Female |
| Under 5 Years | 0 (0.0%) | 0 (0.0%) |
| 5 to 17 Years | 39 (12.1%) | 0 (0.0%) |
| 18 to 34 Years | 0 (0.0%) | 0 (0.0%) |
| 35 to 64 Years | 220 (31.5%) | 145 (24.4%) |
| 65 to 74 Years | 0 (0.0%) | 86 (38.6%) |
| 75 Years and over | 102 (64.6%) | 127 (78.4%) |
Disability Class by Sex by Age in Ripley
Disability Class: Hearing Difficulty
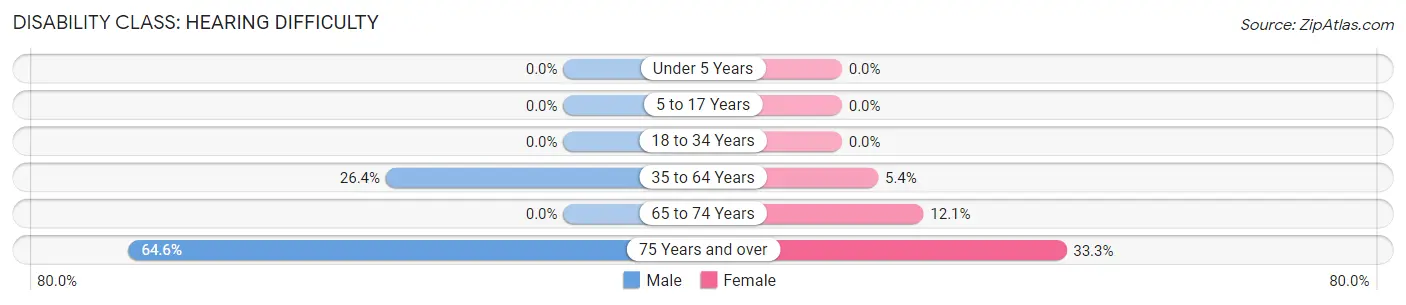
| Age Bracket | Male | Female |
| Under 5 Years | 0 (0.0%) | 0 (0.0%) |
| 5 to 17 Years | 0 (0.0%) | 0 (0.0%) |
| 18 to 34 Years | 0 (0.0%) | 0 (0.0%) |
| 35 to 64 Years | 184 (26.4%) | 32 (5.4%) |
| 65 to 74 Years | 0 (0.0%) | 27 (12.1%) |
| 75 Years and over | 102 (64.6%) | 54 (33.3%) |
Disability Class: Vision Difficulty
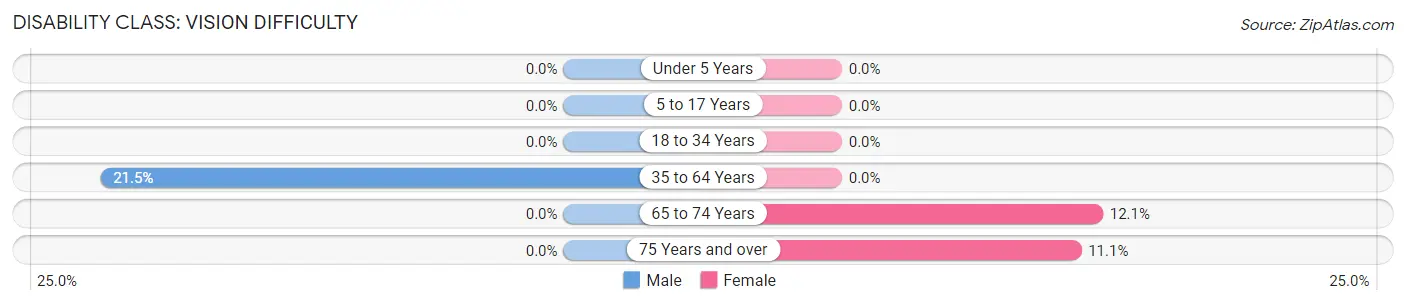
| Age Bracket | Male | Female |
| Under 5 Years | 0 (0.0%) | 0 (0.0%) |
| 5 to 17 Years | 0 (0.0%) | 0 (0.0%) |
| 18 to 34 Years | 0 (0.0%) | 0 (0.0%) |
| 35 to 64 Years | 150 (21.5%) | 0 (0.0%) |
| 65 to 74 Years | 0 (0.0%) | 27 (12.1%) |
| 75 Years and over | 0 (0.0%) | 18 (11.1%) |
Disability Class: Cognitive Difficulty
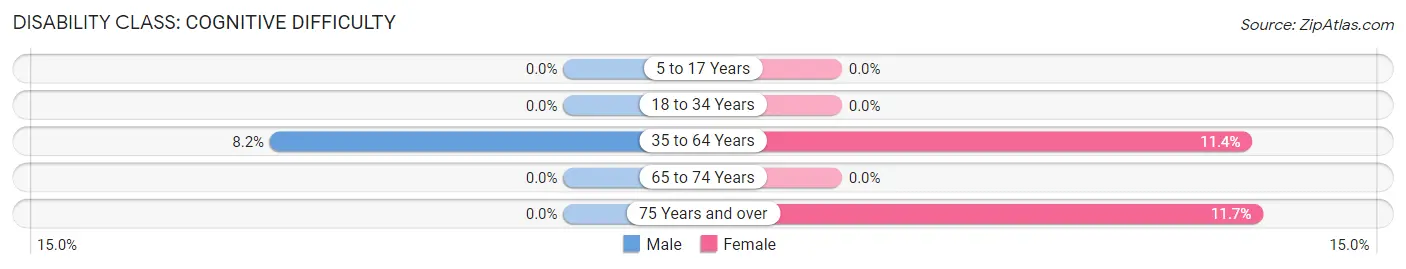
| Age Bracket | Male | Female |
| 5 to 17 Years | 0 (0.0%) | 0 (0.0%) |
| 18 to 34 Years | 0 (0.0%) | 0 (0.0%) |
| 35 to 64 Years | 57 (8.2%) | 68 (11.4%) |
| 65 to 74 Years | 0 (0.0%) | 0 (0.0%) |
| 75 Years and over | 0 (0.0%) | 19 (11.7%) |
Disability Class: Ambulatory Difficulty
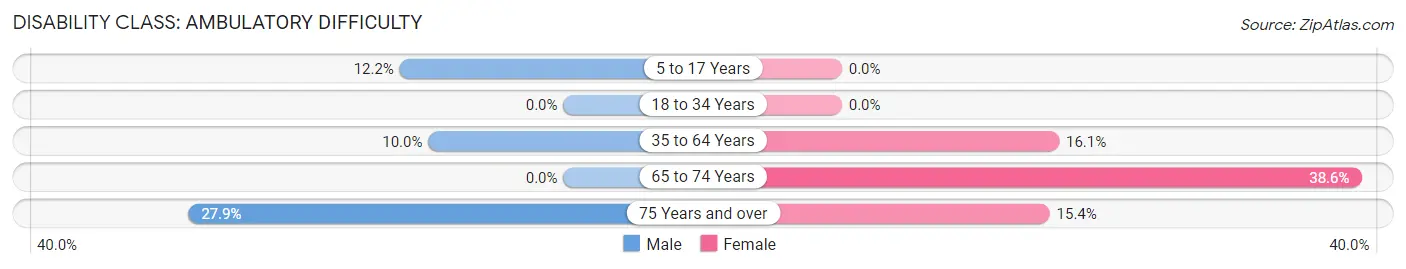
| Age Bracket | Male | Female |
| 5 to 17 Years | 39 (12.1%) | 0 (0.0%) |
| 18 to 34 Years | 0 (0.0%) | 0 (0.0%) |
| 35 to 64 Years | 70 (10.0%) | 96 (16.1%) |
| 65 to 74 Years | 0 (0.0%) | 86 (38.6%) |
| 75 Years and over | 44 (27.9%) | 25 (15.4%) |
Disability Class: Self-Care Difficulty
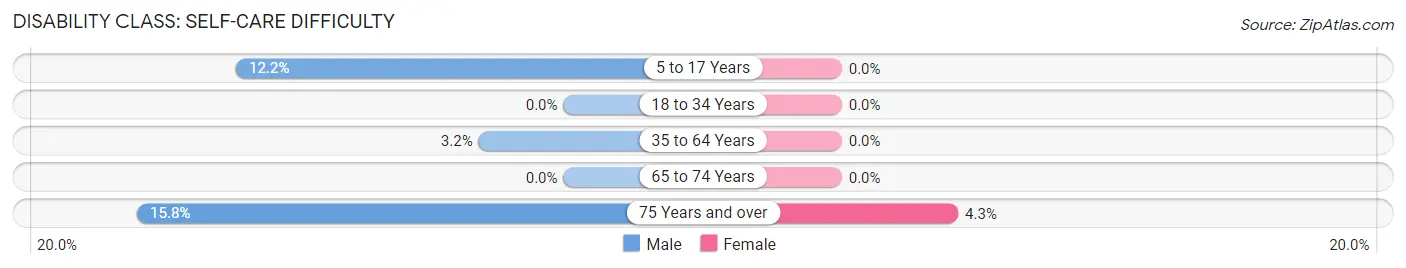
| Age Bracket | Male | Female |
| 5 to 17 Years | 39 (12.1%) | 0 (0.0%) |
| 18 to 34 Years | 0 (0.0%) | 0 (0.0%) |
| 35 to 64 Years | 22 (3.2%) | 0 (0.0%) |
| 65 to 74 Years | 0 (0.0%) | 0 (0.0%) |
| 75 Years and over | 25 (15.8%) | 7 (4.3%) |
Technology Access in Ripley
Computing Device Access in Ripley
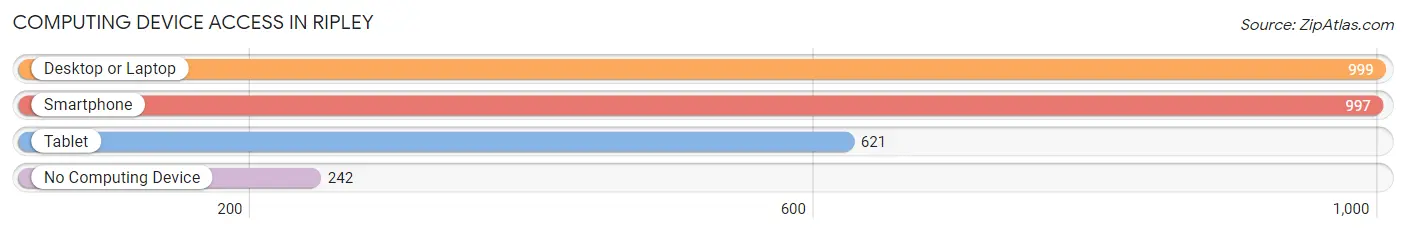
| Device Type | # Households | % Households |
| Desktop or Laptop | 999 | 69.1% |
| Smartphone | 997 | 69.0% |
| Tablet | 621 | 43.0% |
| No Computing Device | 242 | 16.8% |
| Total | 1,445 | 100.0% |
Internet Access in Ripley
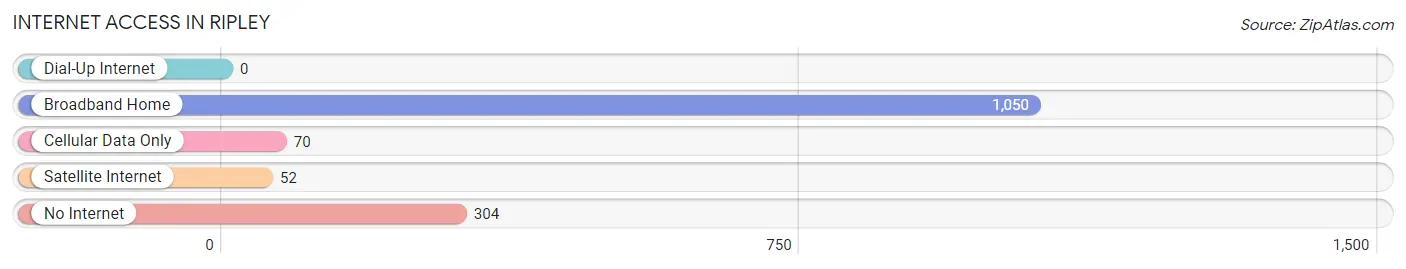
| Internet Type | # Households | % Households |
| Dial-Up Internet | 0 | 0.0% |
| Broadband Home | 1,050 | 72.7% |
| Cellular Data Only | 70 | 4.8% |
| Satellite Internet | 52 | 3.6% |
| No Internet | 304 | 21.0% |
| Total | 1,445 | 100.0% |
Ripley Summary
Ripley, West Virginia is a small town located in Jackson County, West Virginia. It is situated along the Ohio River, approximately 40 miles south of Parkersburg, West Virginia. The town was founded in 1832 and is the county seat of Jackson County. The population of Ripley was 3,252 at the 2010 census.
History
Ripley was founded in 1832 by William P. McWhorter, a local landowner. The town was named after his son, Ripley McWhorter. The town was incorporated in 1837 and was the county seat of Jackson County.
Ripley was an important stop on the Baltimore and Ohio Railroad, which ran through the town. The railroad was a major factor in the growth of the town, as it allowed for the transportation of goods and people.
Ripley was also an important stop on the Underground Railroad. The town was a safe haven for escaped slaves, and many of them settled in the area.
Geography
Ripley is located in Jackson County, West Virginia, along the Ohio River. The town is situated at the intersection of US Route 33 and West Virginia Route 62. The town is approximately 40 miles south of Parkersburg, West Virginia.
The terrain around Ripley is mostly flat, with some rolling hills. The town is located in the Appalachian Mountains, and the surrounding area is heavily forested.
Economy
Ripley’s economy is largely based on agriculture and tourism. The town is home to several small businesses, including restaurants, shops, and a few manufacturing plants.
The town is also home to several large employers, including the Jackson County Board of Education, the Jackson County Health Department, and the Jackson County Sheriff’s Office.
Demographics
As of the 2010 census, the population of Ripley was 3,252. The racial makeup of the town was 95.3% White, 1.7% African American, 0.3% Native American, 0.2% Asian, 0.1% Pacific Islander, 0.7% from other races, and 1.9% from two or more races. Hispanic or Latino of any race were 1.7% of the population.
The median income for a household in Ripley was $30,938, and the median income for a family was $37,917. The per capita income for the town was $17,845. About 17.2% of families and 20.2% of the population were below the poverty line, including 28.2% of those under age 18 and 11.2% of those age 65 or over.
Conclusion
Ripley, West Virginia is a small town located in Jackson County, West Virginia. It was founded in 1832 and is the county seat of Jackson County. The town is situated along the Ohio River, approximately 40 miles south of Parkersburg, West Virginia. The population of Ripley was 3,252 at the 2010 census. The town’s economy is largely based on agriculture and tourism, and it is home to several large employers. The racial makeup of the town was 95.3% White, 1.7% African American, 0.3% Native American, 0.2% Asian, 0.1% Pacific Islander, 0.7% from other races, and 1.9% from two or more races. The median income for a household in Ripley was $30,938, and the median income for a family was $37,917.
Common Questions
What is Per Capita Income in Ripley?
Per Capita income in Ripley is $26,670.
What is the Median Family Income in Ripley?
Median Family Income in Ripley is $64,643.
What is the Median Household income in Ripley?
Median Household Income in Ripley is $35,489.
What is Income or Wage Gap in Ripley?
Income or Wage Gap in Ripley is 0.0%.
Women in Ripley earn 100.0 cents for every dollar earned by a man.
What is Inequality or Gini Index in Ripley?
Inequality or Gini Index in Ripley is 0.53.
What is the Total Population of Ripley?
Total Population of Ripley is 3,084.
What is the Total Male Population of Ripley?
Total Male Population of Ripley is 1,676.
What is the Total Female Population of Ripley?
Total Female Population of Ripley is 1,408.
What is the Ratio of Males per 100 Females in Ripley?
There are 119.03 Males per 100 Females in Ripley.
What is the Ratio of Females per 100 Males in Ripley?
There are 84.01 Females per 100 Males in Ripley.
What is the Median Population Age in Ripley?
Median Population Age in Ripley is 43.8 Years.
What is the Average Family Size in Ripley
Average Family Size in Ripley is 3.1 People.
What is the Average Household Size in Ripley
Average Household Size in Ripley is 2.0 People.
How Large is the Labor Force in Ripley?
There are 1,326 People in the Labor Forcein in Ripley.
What is the Percentage of People in the Labor Force in Ripley?
51.8% of People are in the Labor Force in Ripley.
What is the Unemployment Rate in Ripley?
Unemployment Rate in Ripley is 4.3%.