Lost Creek, WV Map & Demographics
Lost Creek Map
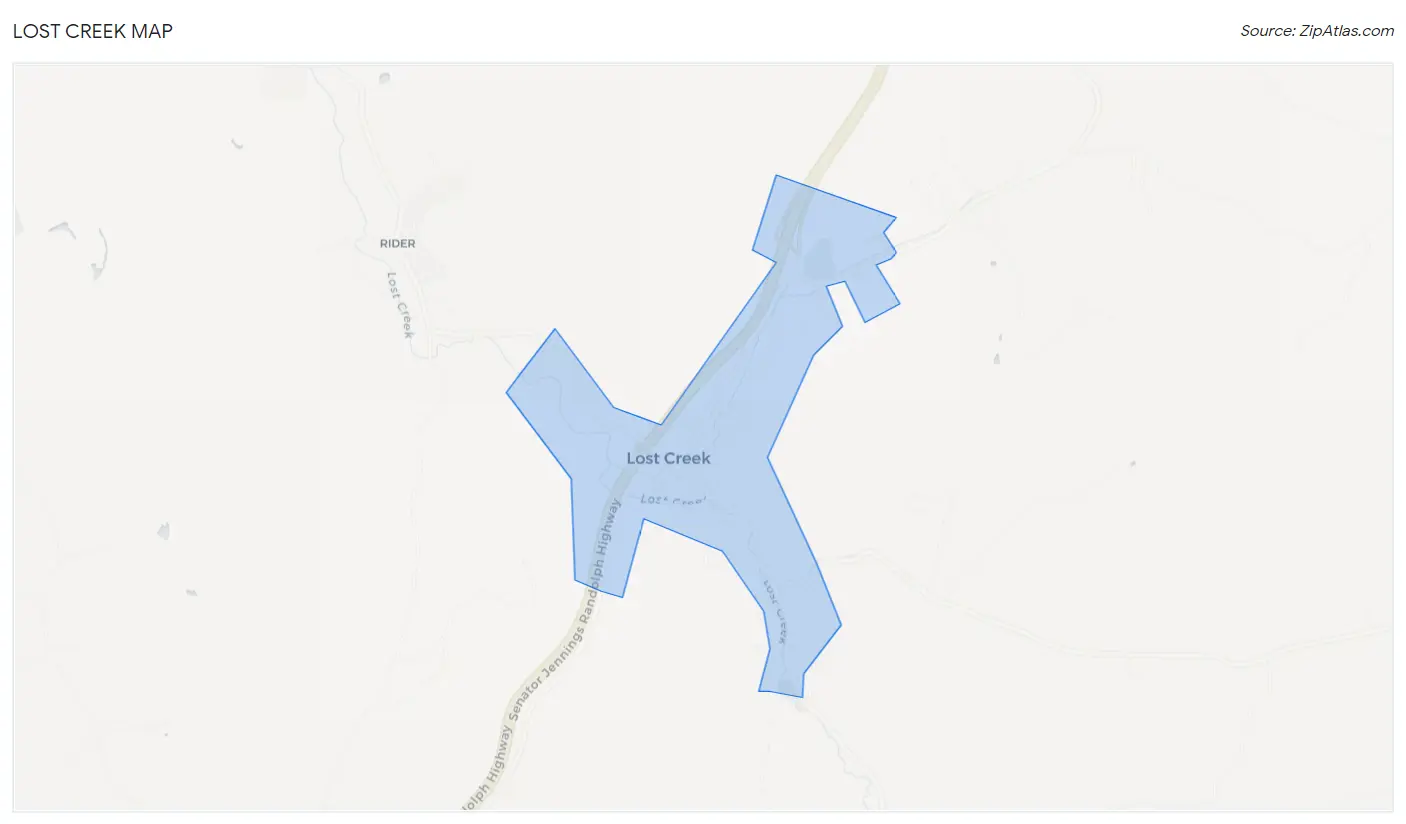
Lost Creek Overview
$28,456
PER CAPITA INCOME
$93,194
AVG FAMILY INCOME
$55,556
AVG HOUSEHOLD INCOME
44.3%
WAGE / INCOME GAP [ % ]
55.7¢/ $1
WAGE / INCOME GAP [ $ ]
0.43
INEQUALITY / GINI INDEX
386
TOTAL POPULATION
151
MALE POPULATION
235
FEMALE POPULATION
64.26
MALES / 100 FEMALES
155.63
FEMALES / 100 MALES
39.1
MEDIAN AGE
3.1
AVG FAMILY SIZE
2.7
AVG HOUSEHOLD SIZE
209
LABOR FORCE [ PEOPLE ]
68.3%
PERCENT IN LABOR FORCE
8.6%
UNEMPLOYMENT RATE
Lost Creek Zip Codes
Lost Creek Area Codes
Income in Lost Creek
Income Overview in Lost Creek
Per Capita Income in Lost Creek is $28,456, while median incomes of families and households are $93,194 and $55,556 respectively.
| Characteristic | Number | Measure |
| Per Capita Income | 386 | $28,456 |
| Median Family Income | 83 | $93,194 |
| Mean Family Income | 83 | $90,812 |
| Median Household Income | 142 | $55,556 |
| Mean Household Income | 142 | $71,227 |
| Income Deficit | 83 | $0 |
| Wage / Income Gap (%) | 386 | 44.35% |
| Wage / Income Gap ($) | 386 | 55.65¢ per $1 |
| Gini / Inequality Index | 386 | 0.43 |
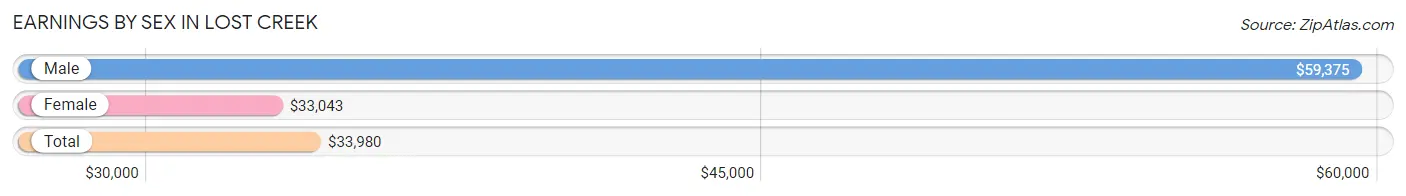
Earnings by Sex in Lost Creek
Average Earnings in Lost Creek are $33,980, $59,375 for men and $33,043 for women, a difference of 44.4%.
| Sex | Number | Average Earnings |
| Male | 68 (35.4%) | $59,375 |
| Female | 124 (64.6%) | $33,043 |
| Total | 192 (100.0%) | $33,980 |
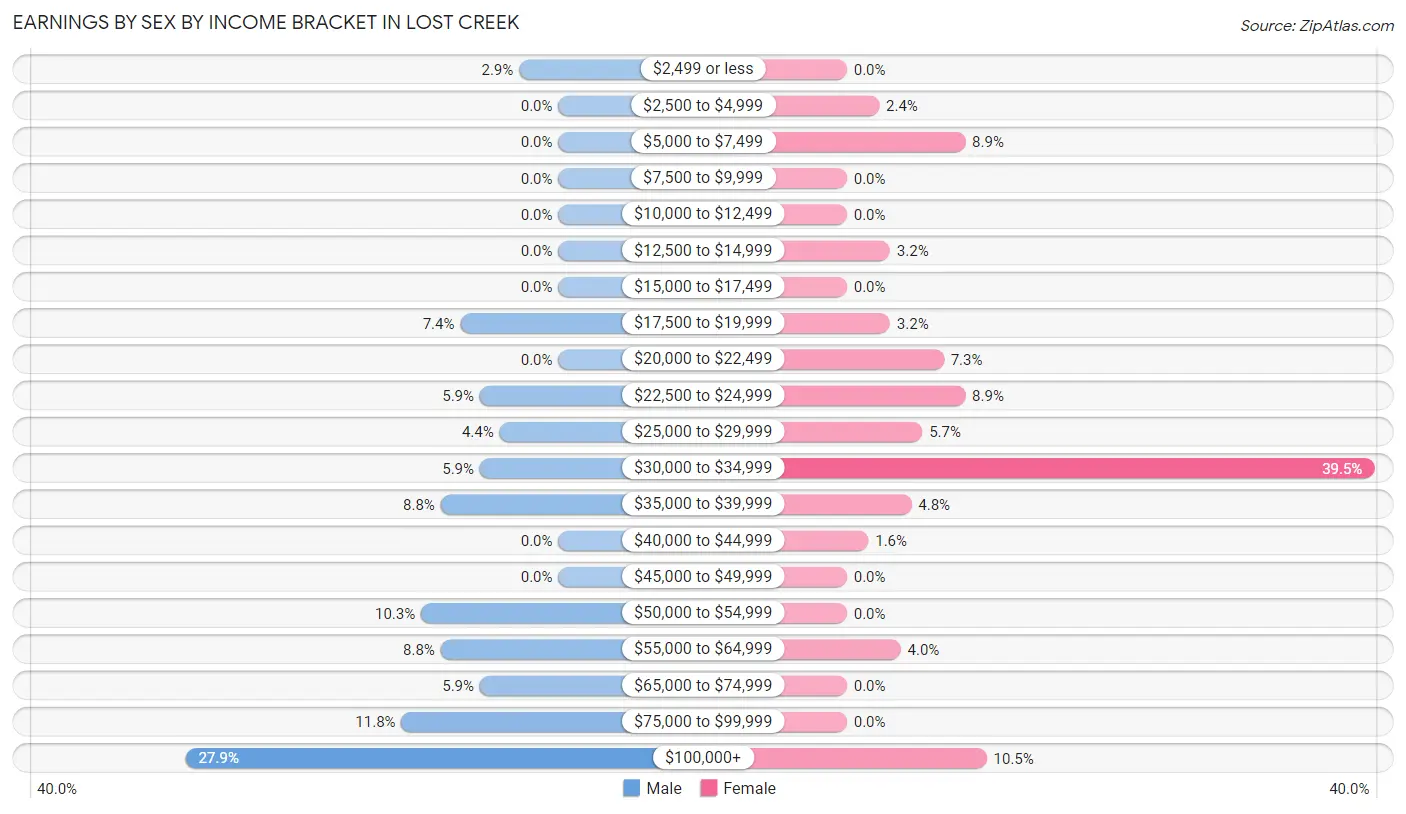
Earnings by Sex by Income Bracket in Lost Creek
The most common earnings brackets in Lost Creek are $100,000+ for men (19 | 27.9%) and $30,000 to $34,999 for women (49 | 39.5%).
| Income | Male | Female |
| $2,499 or less | 2 (2.9%) | 0 (0.0%) |
| $2,500 to $4,999 | 0 (0.0%) | 3 (2.4%) |
| $5,000 to $7,499 | 0 (0.0%) | 11 (8.9%) |
| $7,500 to $9,999 | 0 (0.0%) | 0 (0.0%) |
| $10,000 to $12,499 | 0 (0.0%) | 0 (0.0%) |
| $12,500 to $14,999 | 0 (0.0%) | 4 (3.2%) |
| $15,000 to $17,499 | 0 (0.0%) | 0 (0.0%) |
| $17,500 to $19,999 | 5 (7.3%) | 4 (3.2%) |
| $20,000 to $22,499 | 0 (0.0%) | 9 (7.3%) |
| $22,500 to $24,999 | 4 (5.9%) | 11 (8.9%) |
| $25,000 to $29,999 | 3 (4.4%) | 7 (5.7%) |
| $30,000 to $34,999 | 4 (5.9%) | 49 (39.5%) |
| $35,000 to $39,999 | 6 (8.8%) | 6 (4.8%) |
| $40,000 to $44,999 | 0 (0.0%) | 2 (1.6%) |
| $45,000 to $49,999 | 0 (0.0%) | 0 (0.0%) |
| $50,000 to $54,999 | 7 (10.3%) | 0 (0.0%) |
| $55,000 to $64,999 | 6 (8.8%) | 5 (4.0%) |
| $65,000 to $74,999 | 4 (5.9%) | 0 (0.0%) |
| $75,000 to $99,999 | 8 (11.8%) | 0 (0.0%) |
| $100,000+ | 19 (27.9%) | 13 (10.5%) |
| Total | 68 (100.0%) | 124 (100.0%) |
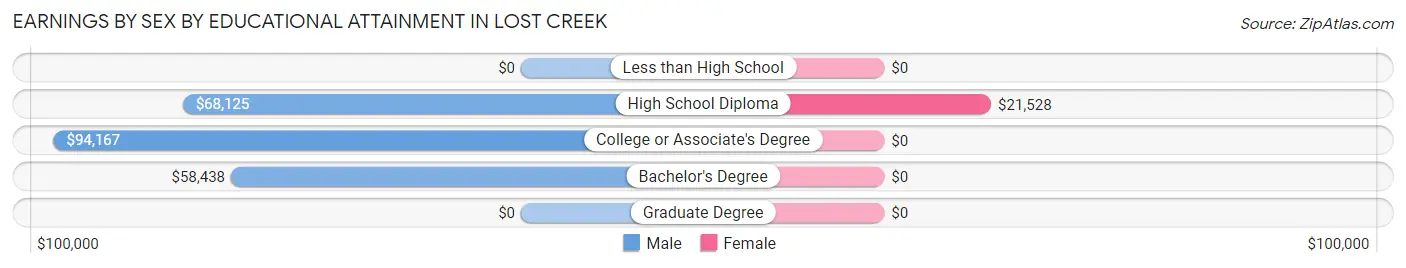
Earnings by Sex by Educational Attainment in Lost Creek
Average earnings in Lost Creek are $59,375 for men and $31,250 for women, a difference of 47.4%. Men with an educational attainment of college or associate's degree enjoy the highest average annual earnings of $94,167, while those with bachelor's degree education earn the least with $58,438. Women with an educational attainment of high school diploma earn the most with the average annual earnings of $21,528, while those with high school diploma education have the smallest earnings of $21,528.
| Educational Attainment | Male Income | Female Income |
| Less than High School | - | - |
| High School Diploma | $68,125 | $21,528 |
| College or Associate's Degree | $94,167 | $0 |
| Bachelor's Degree | $58,438 | $0 |
| Graduate Degree | - | - |
| Total | $59,375 | $31,250 |
Family Income in Lost Creek
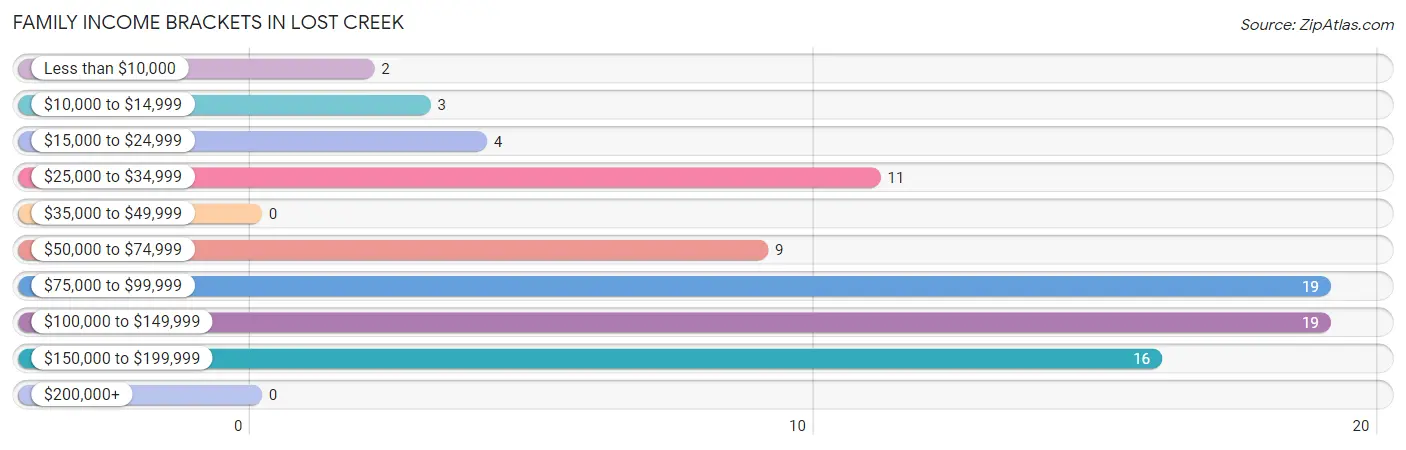
Family Income Brackets in Lost Creek
According to the Lost Creek family income data, there are 19 families falling into the $75,000 to $99,999 income range, which is the most common income bracket and makes up 22.9% of all families.
| Income Bracket | # Families | % Families |
| Less than $10,000 | 2 | 2.4% |
| $10,000 to $14,999 | 3 | 3.6% |
| $15,000 to $24,999 | 4 | 4.8% |
| $25,000 to $34,999 | 11 | 13.3% |
| $35,000 to $49,999 | 0 | 0.0% |
| $50,000 to $74,999 | 9 | 10.8% |
| $75,000 to $99,999 | 19 | 22.9% |
| $100,000 to $149,999 | 19 | 22.9% |
| $150,000 to $199,999 | 16 | 19.3% |
| $200,000+ | 0 | 0.0% |
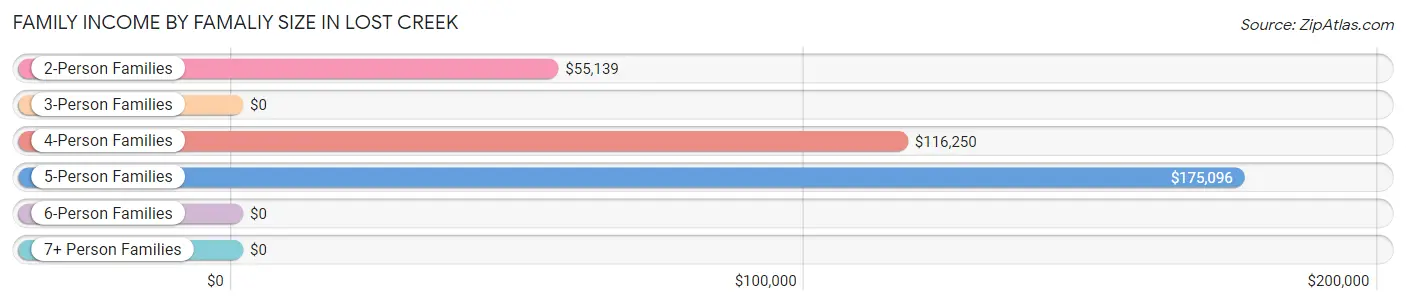
Family Income by Famaliy Size in Lost Creek
5-person families (25 | 30.1%) account for the highest median family income in Lost Creek with $175,096 per family, while 5-person families (25 | 30.1%) have the highest median income of $35,019 per family member.
| Income Bracket | # Families | Median Income |
| 2-Person Families | 29 (34.9%) | $55,139 |
| 3-Person Families | 13 (15.7%) | $0 |
| 4-Person Families | 16 (19.3%) | $116,250 |
| 5-Person Families | 25 (30.1%) | $175,096 |
| 6-Person Families | 0 (0.0%) | $0 |
| 7+ Person Families | 0 (0.0%) | $0 |
| Total | 83 (100.0%) | $93,194 |
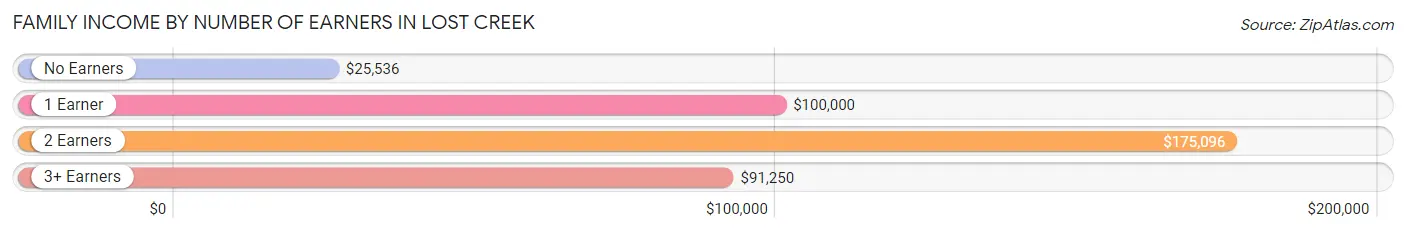
Family Income by Number of Earners in Lost Creek
The median family income in Lost Creek is $93,194, with families comprising 2 earners (25) having the highest median family income of $175,096, while families with no earners (17) have the lowest median family income of $25,536, accounting for 30.1% and 20.5% of families, respectively.
| Number of Earners | # Families | Median Income |
| No Earners | 17 (20.5%) | $25,536 |
| 1 Earner | 34 (41.0%) | $100,000 |
| 2 Earners | 25 (30.1%) | $175,096 |
| 3+ Earners | 7 (8.4%) | $91,250 |
| Total | 83 (100.0%) | $93,194 |
Household Income in Lost Creek
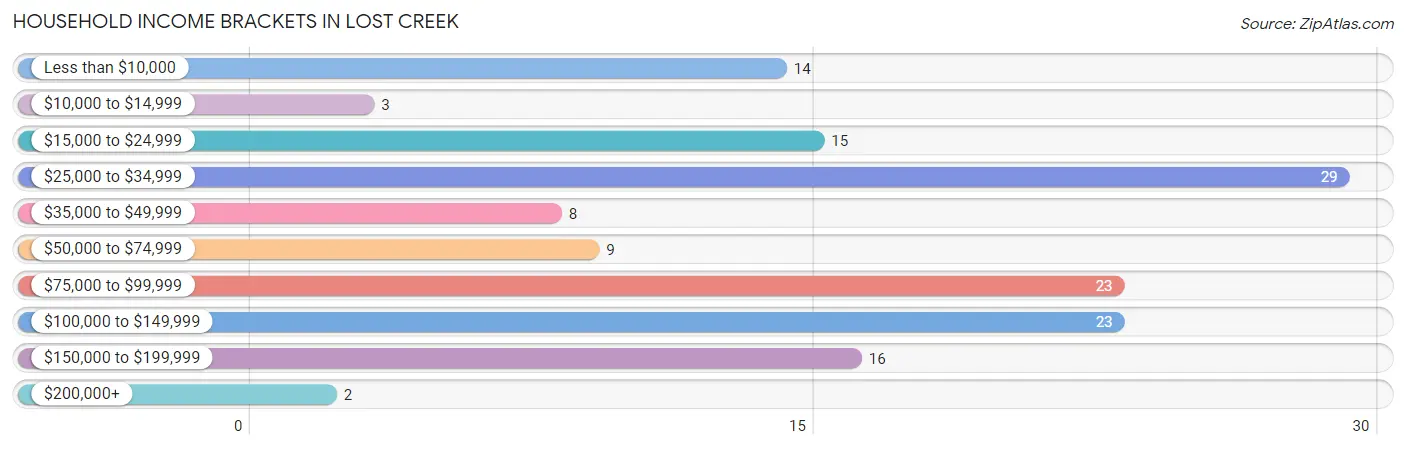
Household Income Brackets in Lost Creek
With 29 households falling in the category, the $25,000 to $34,999 income range is the most frequent in Lost Creek, accounting for 20.4% of all households. In contrast, only 2 households (1.4%) fall into the $200,000+ income bracket, making it the least populous group.
| Income Bracket | # Households | % Households |
| Less than $10,000 | 14 | 9.9% |
| $10,000 to $14,999 | 3 | 2.1% |
| $15,000 to $24,999 | 15 | 10.6% |
| $25,000 to $34,999 | 29 | 20.4% |
| $35,000 to $49,999 | 8 | 5.6% |
| $50,000 to $74,999 | 9 | 6.3% |
| $75,000 to $99,999 | 23 | 16.2% |
| $100,000 to $149,999 | 23 | 16.2% |
| $150,000 to $199,999 | 16 | 11.3% |
| $200,000+ | 2 | 1.4% |
Household Income by Householder Age in Lost Creek
The median household income in Lost Creek is $55,556, with the highest median household income of $110,625 found in the 25 to 44 years age bracket for the primary householder. A total of 40 households (28.2%) fall into this category. Meanwhile, the 15 to 24 years age bracket for the primary householder has the lowest median household income of $0, with 20 households (14.1%) in this group.
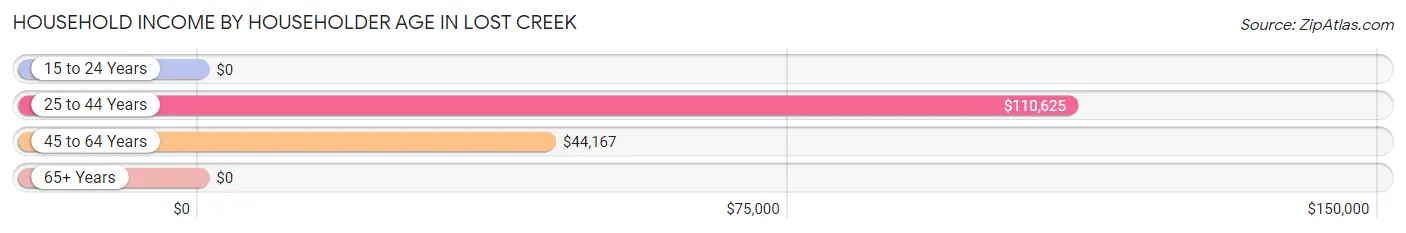
| Income Bracket | # Households | Median Income |
| 15 to 24 Years | 20 (14.1%) | $0 |
| 25 to 44 Years | 40 (28.2%) | $110,625 |
| 45 to 64 Years | 52 (36.6%) | $44,167 |
| 65+ Years | 30 (21.1%) | $0 |
| Total | 142 (100.0%) | $55,556 |
Poverty in Lost Creek
Income Below Poverty by Sex and Age in Lost Creek
With 14.6% poverty level for males and 16.5% for females among the residents of Lost Creek, 35 to 44 year old males and 12 to 14 year old females are the most vulnerable to poverty, with 11 males (50.0%) and 3 females (30.0%) in their respective age groups living below the poverty level.
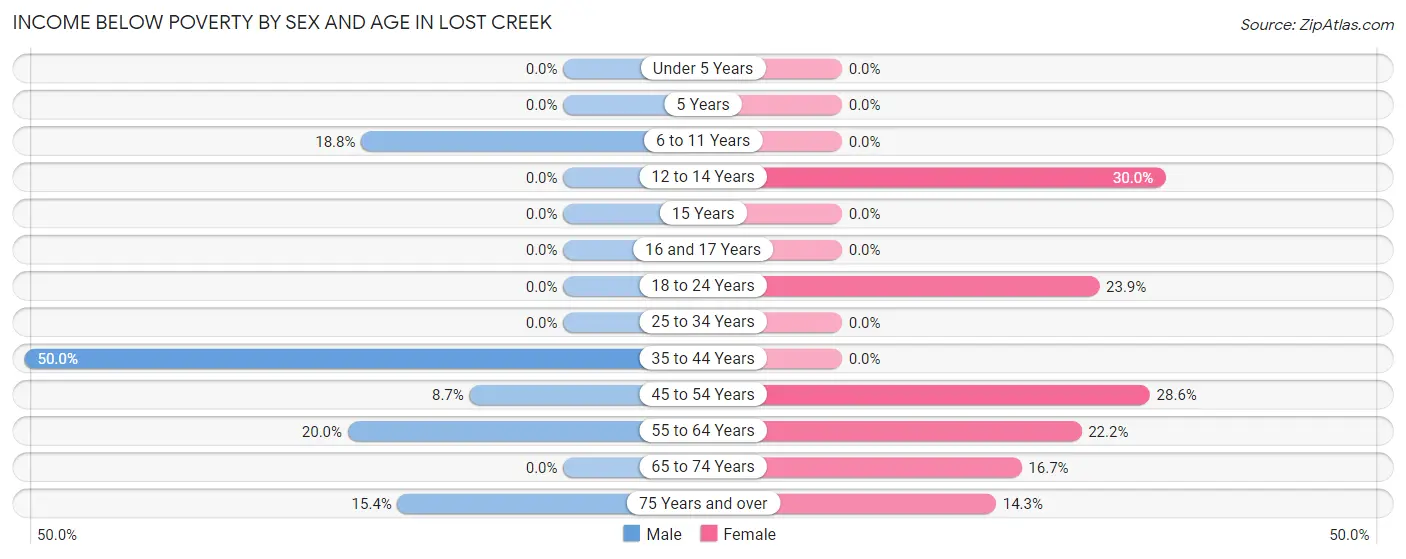
| Age Bracket | Male | Female |
| Under 5 Years | 0 (0.0%) | 0 (0.0%) |
| 5 Years | 0 (0.0%) | 0 (0.0%) |
| 6 to 11 Years | 3 (18.8%) | 0 (0.0%) |
| 12 to 14 Years | 0 (0.0%) | 3 (30.0%) |
| 15 Years | 0 (0.0%) | 0 (0.0%) |
| 16 and 17 Years | 0 (0.0%) | 0 (0.0%) |
| 18 to 24 Years | 0 (0.0%) | 16 (23.9%) |
| 25 to 34 Years | 0 (0.0%) | 0 (0.0%) |
| 35 to 44 Years | 11 (50.0%) | 0 (0.0%) |
| 45 to 54 Years | 2 (8.7%) | 10 (28.6%) |
| 55 to 64 Years | 4 (20.0%) | 6 (22.2%) |
| 65 to 74 Years | 0 (0.0%) | 1 (16.7%) |
| 75 Years and over | 2 (15.4%) | 2 (14.3%) |
| Total | 22 (14.6%) | 38 (16.5%) |
Income Above Poverty by Sex and Age in Lost Creek
According to the poverty statistics in Lost Creek, males aged under 5 years and females aged under 5 years are the age groups that are most secure financially, with 100.0% of males and 100.0% of females in these age groups living above the poverty line.
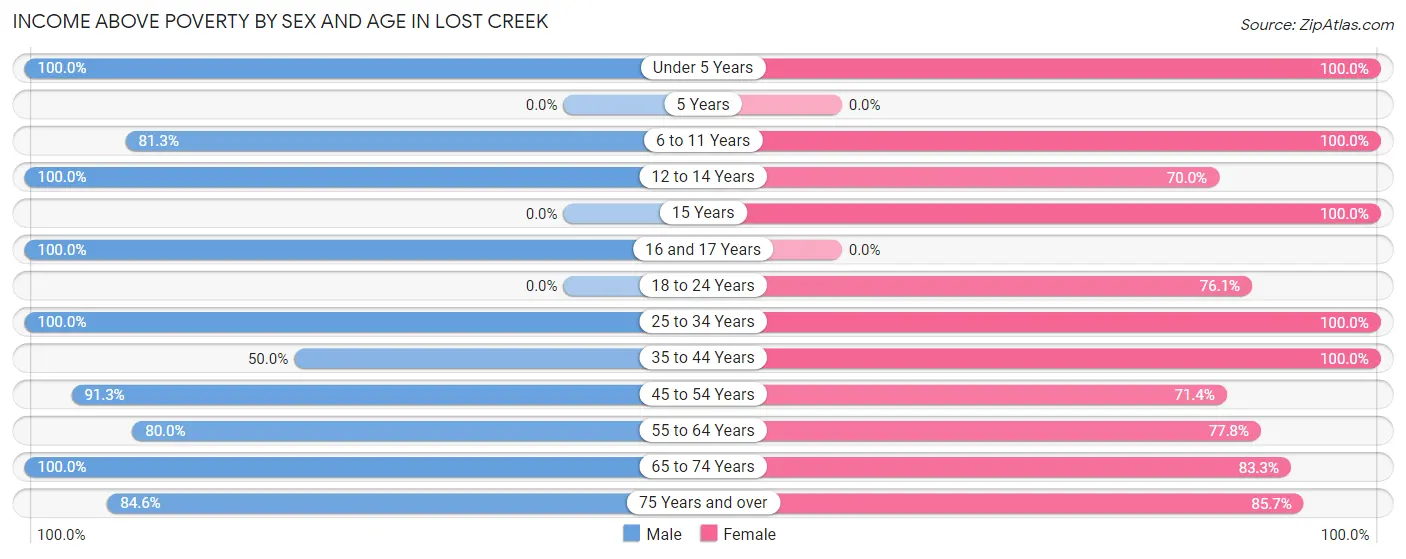
| Age Bracket | Male | Female |
| Under 5 Years | 16 (100.0%) | 15 (100.0%) |
| 5 Years | 0 (0.0%) | 0 (0.0%) |
| 6 to 11 Years | 13 (81.2%) | 10 (100.0%) |
| 12 to 14 Years | 4 (100.0%) | 7 (70.0%) |
| 15 Years | 0 (0.0%) | 4 (100.0%) |
| 16 and 17 Years | 5 (100.0%) | 0 (0.0%) |
| 18 to 24 Years | 0 (0.0%) | 51 (76.1%) |
| 25 to 34 Years | 25 (100.0%) | 15 (100.0%) |
| 35 to 44 Years | 11 (50.0%) | 27 (100.0%) |
| 45 to 54 Years | 21 (91.3%) | 25 (71.4%) |
| 55 to 64 Years | 16 (80.0%) | 21 (77.8%) |
| 65 to 74 Years | 7 (100.0%) | 5 (83.3%) |
| 75 Years and over | 11 (84.6%) | 12 (85.7%) |
| Total | 129 (85.4%) | 192 (83.5%) |
Income Below Poverty Among Married-Couple Families in Lost Creek
The poverty statistics for married-couple families in Lost Creek show that 9.5% or 7 of the total 74 families live below the poverty line. Families with no children have the highest poverty rate of 15.6%, comprising of 5 families. On the other hand, families with 3 or 4 children have the lowest poverty rate of 0.0%, which includes 0 families.
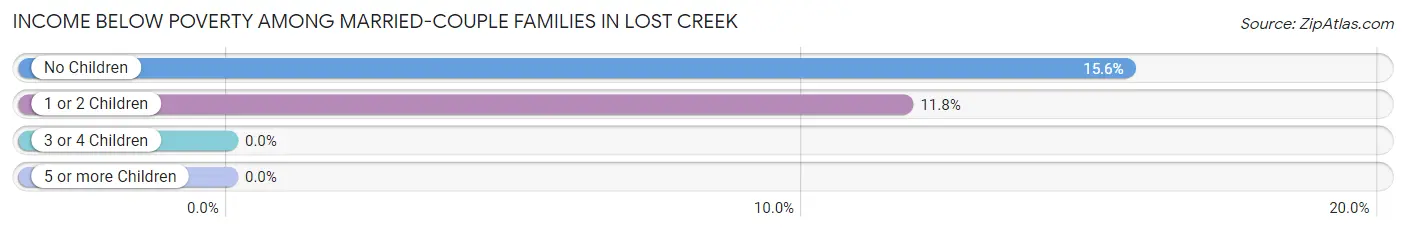
| Children | Above Poverty | Below Poverty |
| No Children | 27 (84.4%) | 5 (15.6%) |
| 1 or 2 Children | 15 (88.2%) | 2 (11.8%) |
| 3 or 4 Children | 25 (100.0%) | 0 (0.0%) |
| 5 or more Children | 0 (0.0%) | 0 (0.0%) |
| Total | 67 (90.5%) | 7 (9.5%) |
Income Below Poverty Among Single-Parent Households in Lost Creek
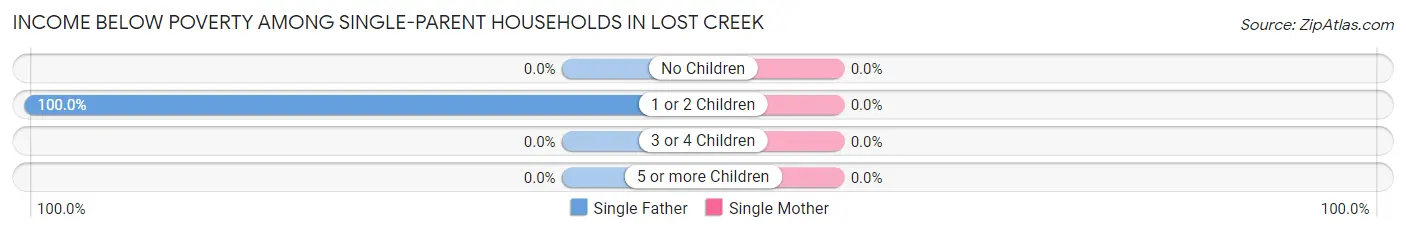
| Children | Single Father | Single Mother |
| No Children | 0 (0.0%) | 0 (0.0%) |
| 1 or 2 Children | 2 (100.0%) | 0 (0.0%) |
| 3 or 4 Children | 0 (0.0%) | 0 (0.0%) |
| 5 or more Children | 0 (0.0%) | 0 (0.0%) |
| Total | 2 (100.0%) | 0 (0.0%) |
Income Below Poverty Among Married-Couple vs Single-Parent Households in Lost Creek
The poverty data for Lost Creek shows that 7 of the married-couple family households (9.5%) and 2 of the single-parent households (22.2%) are living below the poverty level. Within the married-couple family households, those with no children have the highest poverty rate, with 5 households (15.6%) falling below the poverty line. Among the single-parent households, those with 1 or 2 children have the highest poverty rate, with 2 household (28.6%) living below poverty.
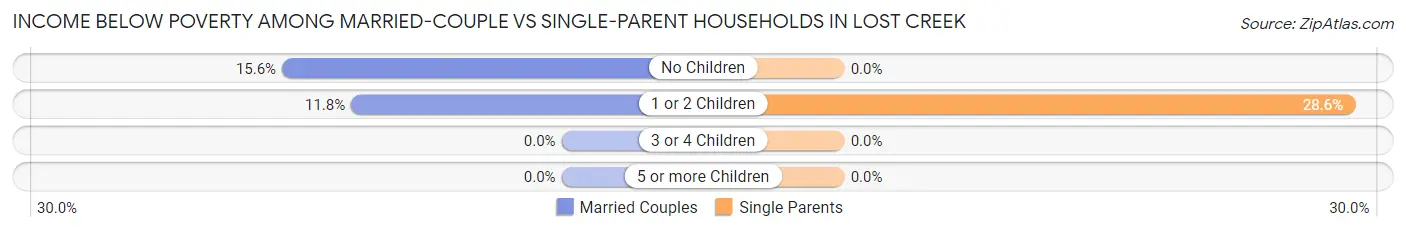
| Children | Married-Couple Families | Single-Parent Households |
| No Children | 5 (15.6%) | 0 (0.0%) |
| 1 or 2 Children | 2 (11.8%) | 2 (28.6%) |
| 3 or 4 Children | 0 (0.0%) | 0 (0.0%) |
| 5 or more Children | 0 (0.0%) | 0 (0.0%) |
| Total | 7 (9.5%) | 2 (22.2%) |
Race in Lost Creek
The most populous races in Lost Creek are White / Caucasian (381 | 98.7%), Hispanic or Latino (5 | 1.3%), and Some other Race (5 | 1.3%).
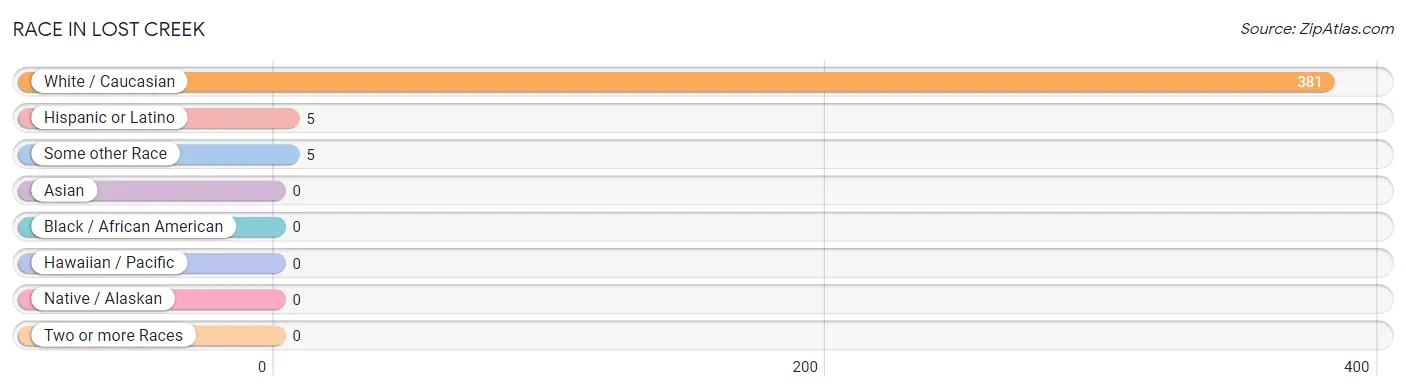
| Race | # Population | % Population |
| Asian | 0 | 0.0% |
| Black / African American | 0 | 0.0% |
| Hawaiian / Pacific | 0 | 0.0% |
| Hispanic or Latino | 5 | 1.3% |
| Native / Alaskan | 0 | 0.0% |
| White / Caucasian | 381 | 98.7% |
| Two or more Races | 0 | 0.0% |
| Some other Race | 5 | 1.3% |
| Total | 386 | 100.0% |
Ancestry in Lost Creek
The most populous ancestries reported in Lost Creek are German (61 | 15.8%), Scottish (50 | 13.0%), Irish (44 | 11.4%), English (33 | 8.6%), and Italian (32 | 8.3%), together accounting for 57.0% of all Lost Creek residents.
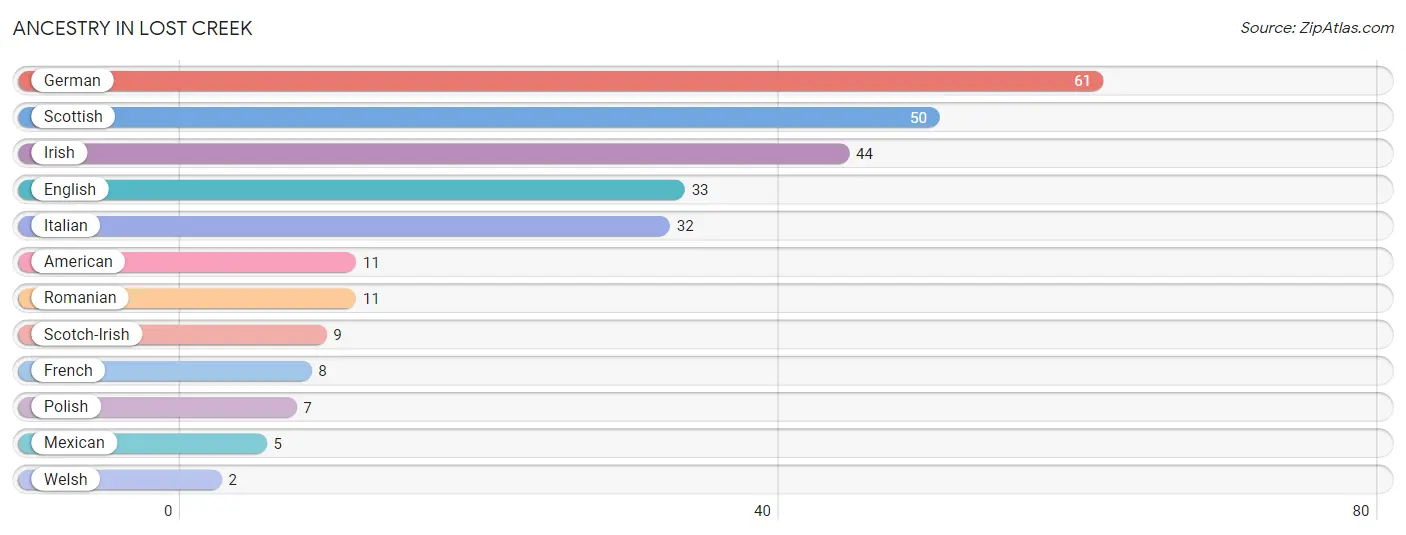
| Ancestry | # Population | % Population |
| American | 11 | 2.9% |
| English | 33 | 8.6% |
| French | 8 | 2.1% |
| German | 61 | 15.8% |
| Irish | 44 | 11.4% |
| Italian | 32 | 8.3% |
| Mexican | 5 | 1.3% |
| Polish | 7 | 1.8% |
| Romanian | 11 | 2.9% |
| Scotch-Irish | 9 | 2.3% |
| Scottish | 50 | 13.0% |
| Welsh | 2 | 0.5% | View All 12 Rows |
Immigrants in Lost Creek

| Immigration Origin | # Population | % Population | View All 0 Rows |
Sex and Age in Lost Creek
Sex and Age in Lost Creek
The most populous age groups in Lost Creek are 25 to 29 Years (17 | 11.3%) for men and 20 to 24 Years (64 | 27.2%) for women.
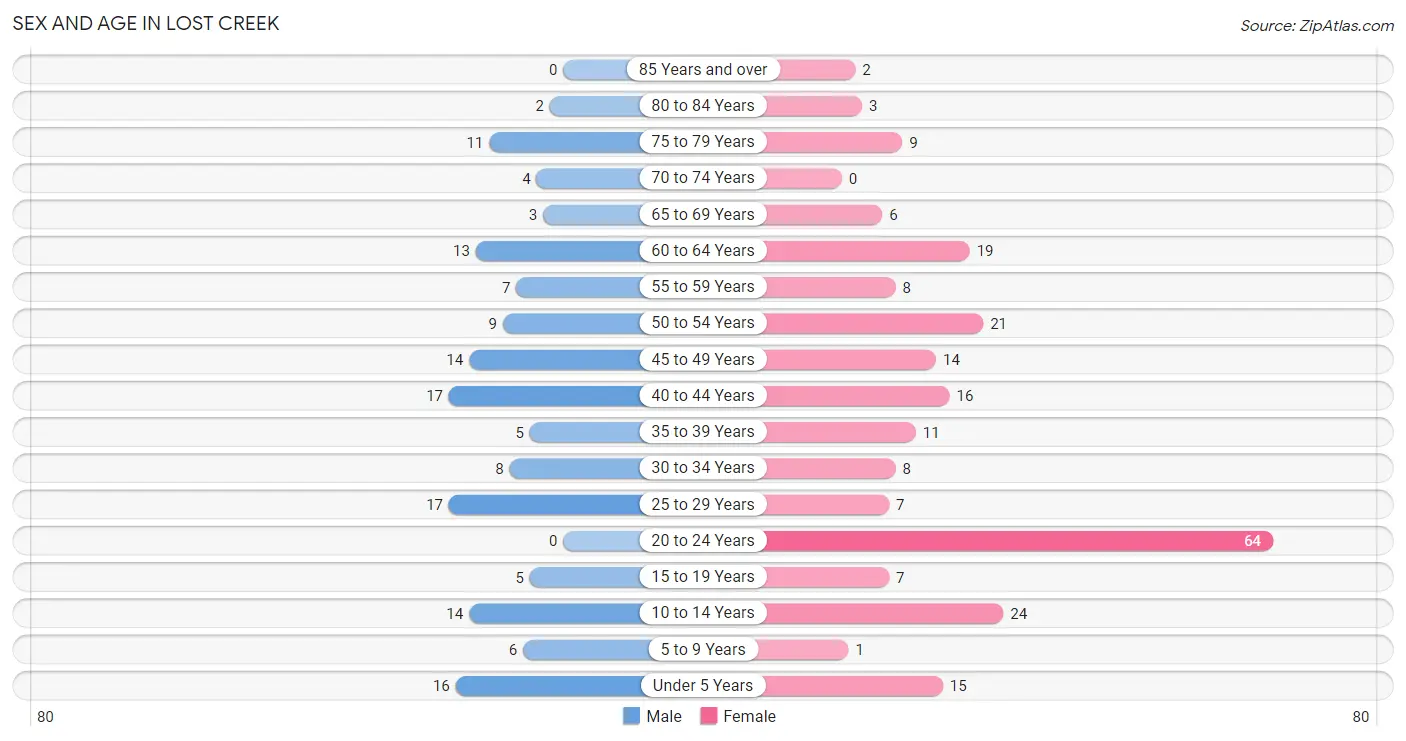
| Age Bracket | Male | Female |
| Under 5 Years | 16 (10.6%) | 15 (6.4%) |
| 5 to 9 Years | 6 (4.0%) | 1 (0.4%) |
| 10 to 14 Years | 14 (9.3%) | 24 (10.2%) |
| 15 to 19 Years | 5 (3.3%) | 7 (3.0%) |
| 20 to 24 Years | 0 (0.0%) | 64 (27.2%) |
| 25 to 29 Years | 17 (11.3%) | 7 (3.0%) |
| 30 to 34 Years | 8 (5.3%) | 8 (3.4%) |
| 35 to 39 Years | 5 (3.3%) | 11 (4.7%) |
| 40 to 44 Years | 17 (11.3%) | 16 (6.8%) |
| 45 to 49 Years | 14 (9.3%) | 14 (6.0%) |
| 50 to 54 Years | 9 (6.0%) | 21 (8.9%) |
| 55 to 59 Years | 7 (4.6%) | 8 (3.4%) |
| 60 to 64 Years | 13 (8.6%) | 19 (8.1%) |
| 65 to 69 Years | 3 (2.0%) | 6 (2.5%) |
| 70 to 74 Years | 4 (2.6%) | 0 (0.0%) |
| 75 to 79 Years | 11 (7.3%) | 9 (3.8%) |
| 80 to 84 Years | 2 (1.3%) | 3 (1.3%) |
| 85 Years and over | 0 (0.0%) | 2 (0.9%) |
| Total | 151 (100.0%) | 235 (100.0%) |
Families and Households in Lost Creek
Median Family Size in Lost Creek
The median family size in Lost Creek is 3.13 persons per family, with single female/mother families (7 | 8.4%) accounting for the largest median family size of 3.29 persons per family. On the other hand, single male/father families (2 | 2.4%) represent the smallest median family size with 2.50 persons per family.
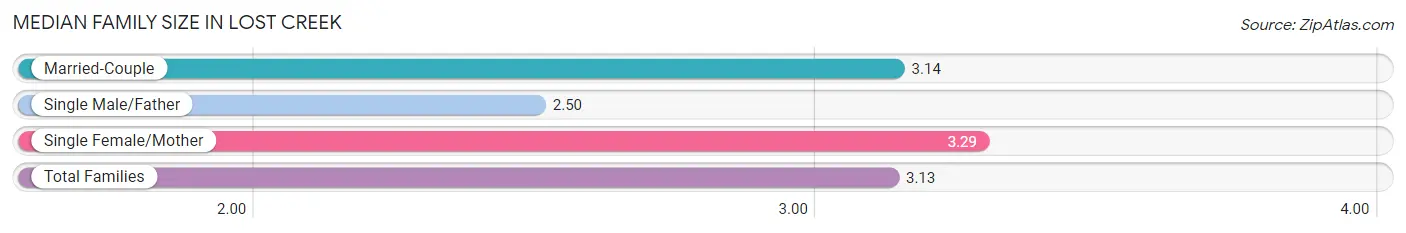
| Family Type | # Families | Family Size |
| Married-Couple | 74 (89.2%) | 3.14 |
| Single Male/Father | 2 (2.4%) | 2.50 |
| Single Female/Mother | 7 (8.4%) | 3.29 |
| Total Families | 83 (100.0%) | 3.13 |
Median Household Size in Lost Creek
The median household size in Lost Creek is 2.72 persons per household, with single female/mother households (7 | 4.9%) accounting for the largest median household size of 3.29 persons per household. non-family households (59 | 41.5%) represent the smallest median household size with 1.95 persons per household.
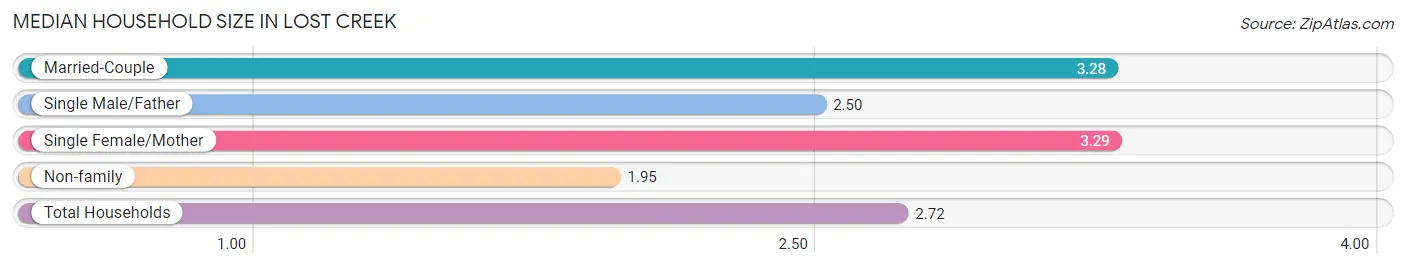
| Household Type | # Households | Household Size |
| Married-Couple | 74 (52.1%) | 3.28 |
| Single Male/Father | 2 (1.4%) | 2.50 |
| Single Female/Mother | 7 (4.9%) | 3.29 |
| Non-family | 59 (41.5%) | 1.95 |
| Total Households | 142 (100.0%) | 2.72 |
Household Size by Marriage Status in Lost Creek
Out of a total of 142 households in Lost Creek, 83 (58.5%) are family households, while 59 (41.5%) are nonfamily households. The most numerous type of family households are 2-person households, comprising 29, and the most common type of nonfamily households are 2-person households, comprising 37.
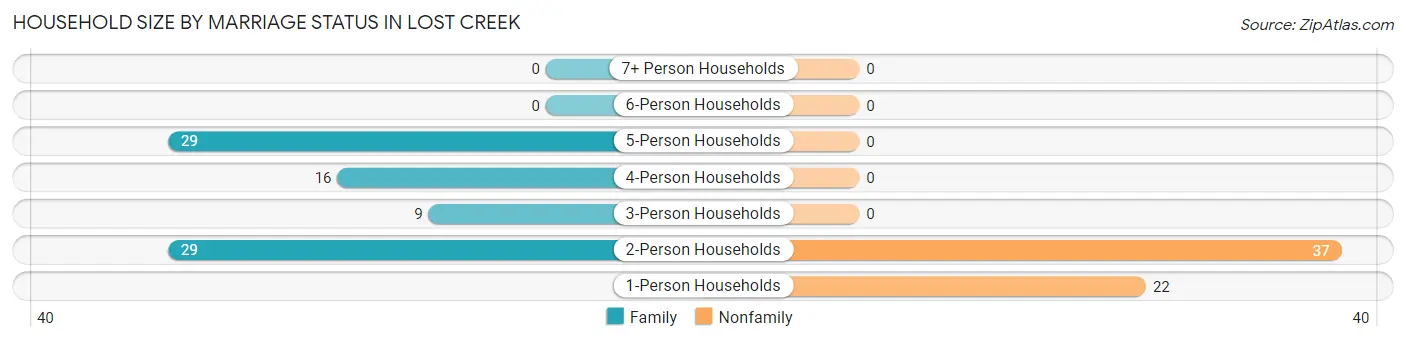
| Household Size | Family Households | Nonfamily Households |
| 1-Person Households | - | 22 (15.5%) |
| 2-Person Households | 29 (20.4%) | 37 (26.1%) |
| 3-Person Households | 9 (6.3%) | 0 (0.0%) |
| 4-Person Households | 16 (11.3%) | 0 (0.0%) |
| 5-Person Households | 29 (20.4%) | 0 (0.0%) |
| 6-Person Households | 0 (0.0%) | 0 (0.0%) |
| 7+ Person Households | 0 (0.0%) | 0 (0.0%) |
| Total | 83 (58.5%) | 59 (41.5%) |
Female Fertility in Lost Creek
Fertility by Age in Lost Creek
| Age Bracket | Women with Births | Births / 1,000 Women |
| 15 to 19 years | 0 (0.0%) | 0.0 |
| 20 to 34 years | 0 (0.0%) | 0.0 |
| 35 to 50 years | 0 (0.0%) | 0.0 |
| Total | 0 (0.0%) | 0.0 |
Fertility by Age by Marriage Status in Lost Creek
| Age Bracket | Married | Unmarried |
| 15 to 19 years | 0 (0.0%) | 0 (0.0%) |
| 20 to 34 years | 0 (0.0%) | 0 (0.0%) |
| 35 to 50 years | 0 (0.0%) | 0 (0.0%) |
| Total | 0 (0.0%) | 0 (0.0%) |
Fertility by Education in Lost Creek
| Educational Attainment | Women with Births | Births / 1,000 Women |
| Less than High School | 0 (0.0%) | 0.0 |
| High School Diploma | 0 (0.0%) | 0.0 |
| College or Associate's Degree | 0 (0.0%) | 0.0 |
| Bachelor's Degree | 0 (0.0%) | 0.0 |
| Graduate Degree | 0 (0.0%) | 0.0 |
| Total | 0 (0.0%) | 0.0 |
Fertility by Education by Marriage Status in Lost Creek
| Educational Attainment | Married | Unmarried |
| Less than High School | 0 (0.0%) | 0 (0.0%) |
| High School Diploma | 0 (0.0%) | 0 (0.0%) |
| College or Associate's Degree | 0 (0.0%) | 0 (0.0%) |
| Bachelor's Degree | 0 (0.0%) | 0 (0.0%) |
| Graduate Degree | 0 (0.0%) | 0 (0.0%) |
| Total | 0 (0.0%) | 0 (0.0%) |
Employment Characteristics in Lost Creek
Employment by Class of Employer in Lost Creek
Among the 187 employed individuals in Lost Creek, private company employees (156 | 83.4%), not-for-profit organizations (18 | 9.6%), and local government employees (7 | 3.7%) make up the most common classes of employment.
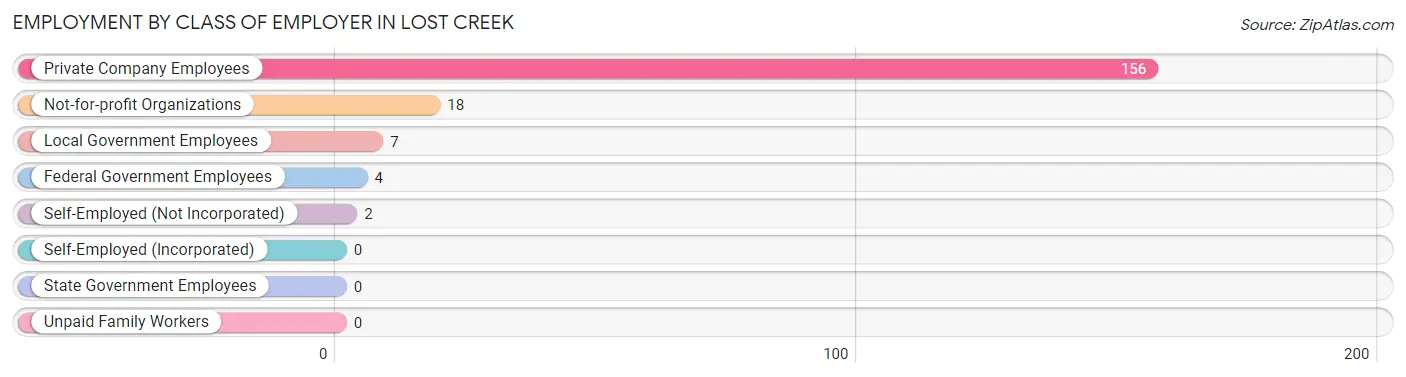
| Employer Class | # Employees | % Employees |
| Private Company Employees | 156 | 83.4% |
| Self-Employed (Incorporated) | 0 | 0.0% |
| Self-Employed (Not Incorporated) | 2 | 1.1% |
| Not-for-profit Organizations | 18 | 9.6% |
| Local Government Employees | 7 | 3.7% |
| State Government Employees | 0 | 0.0% |
| Federal Government Employees | 4 | 2.1% |
| Unpaid Family Workers | 0 | 0.0% |
| Total | 187 | 100.0% |
Employment Status by Age in Lost Creek
According to the labor force statistics for Lost Creek, out of the total population over 16 years of age (306), 68.3% or 209 individuals are in the labor force, with 8.6% or 18 of them unemployed. The age group with the highest labor force participation rate is 25 to 29 years, with 100.0% or 24 individuals in the labor force. Within the labor force, the 20 to 24 years age range has the highest percentage of unemployed individuals, with 27.6% or 16 of them being unemployed.
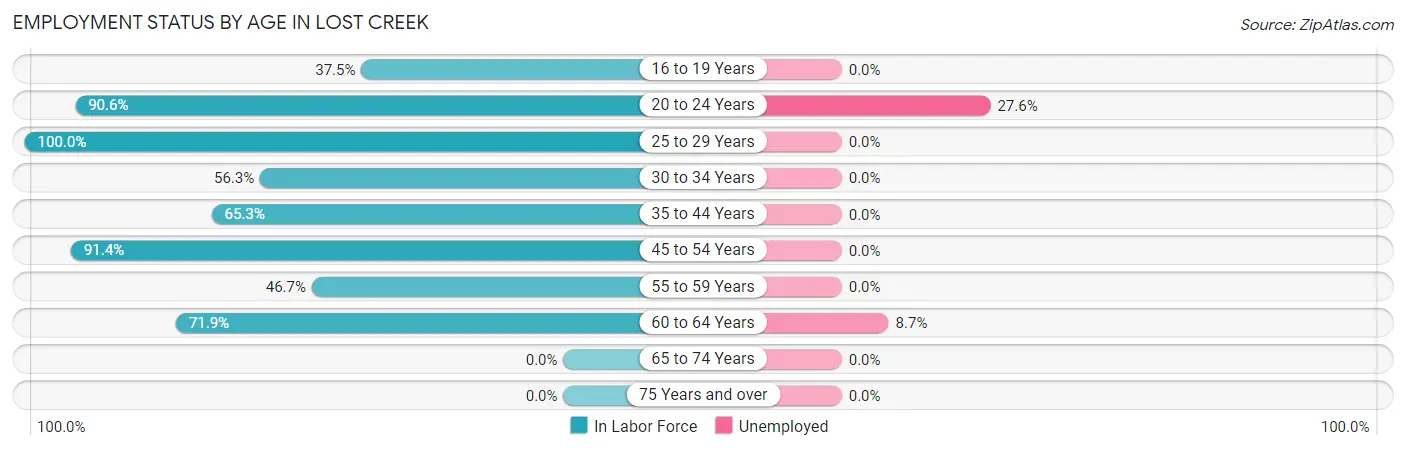
| Age Bracket | In Labor Force | Unemployed |
| 16 to 19 Years | 3 (37.5%) | 0 (0.0%) |
| 20 to 24 Years | 58 (90.6%) | 16 (27.6%) |
| 25 to 29 Years | 24 (100.0%) | 0 (0.0%) |
| 30 to 34 Years | 9 (56.3%) | 0 (0.0%) |
| 35 to 44 Years | 32 (65.3%) | 0 (0.0%) |
| 45 to 54 Years | 53 (91.4%) | 0 (0.0%) |
| 55 to 59 Years | 7 (46.7%) | 0 (0.0%) |
| 60 to 64 Years | 23 (71.9%) | 2 (8.7%) |
| 65 to 74 Years | 0 (0.0%) | 0 (0.0%) |
| 75 Years and over | 0 (0.0%) | 0 (0.0%) |
| Total | 209 (68.3%) | 18 (8.6%) |
Employment Status by Educational Attainment in Lost Creek
According to labor force statistics for Lost Creek, 76.3% of individuals (148) out of the total population between 25 and 64 years of age (194) are in the labor force, with 1.4% or 2 of them being unemployed. The group with the highest labor force participation rate are those with the educational attainment of college / associate degree, with 100.0% or 36 individuals in the labor force. Within the labor force, individuals with high school diploma education have the highest percentage of unemployment, with 3.5% or 2 of them being unemployed.
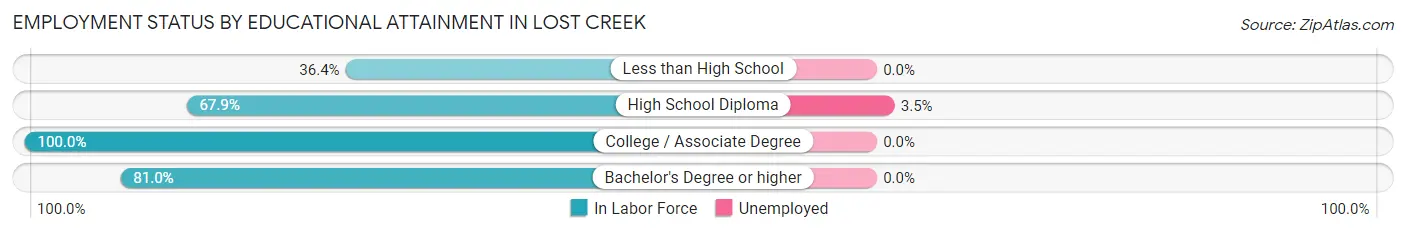
| Educational Attainment | In Labor Force | Unemployed |
| Less than High School | 4 (36.4%) | 0 (0.0%) |
| High School Diploma | 57 (67.9%) | 3 (3.5%) |
| College / Associate Degree | 36 (100.0%) | 0 (0.0%) |
| Bachelor's Degree or higher | 51 (81.0%) | 0 (0.0%) |
| Total | 148 (76.3%) | 3 (1.4%) |
Employment Occupations by Sex in Lost Creek
Management, Business, Science and Arts Occupations
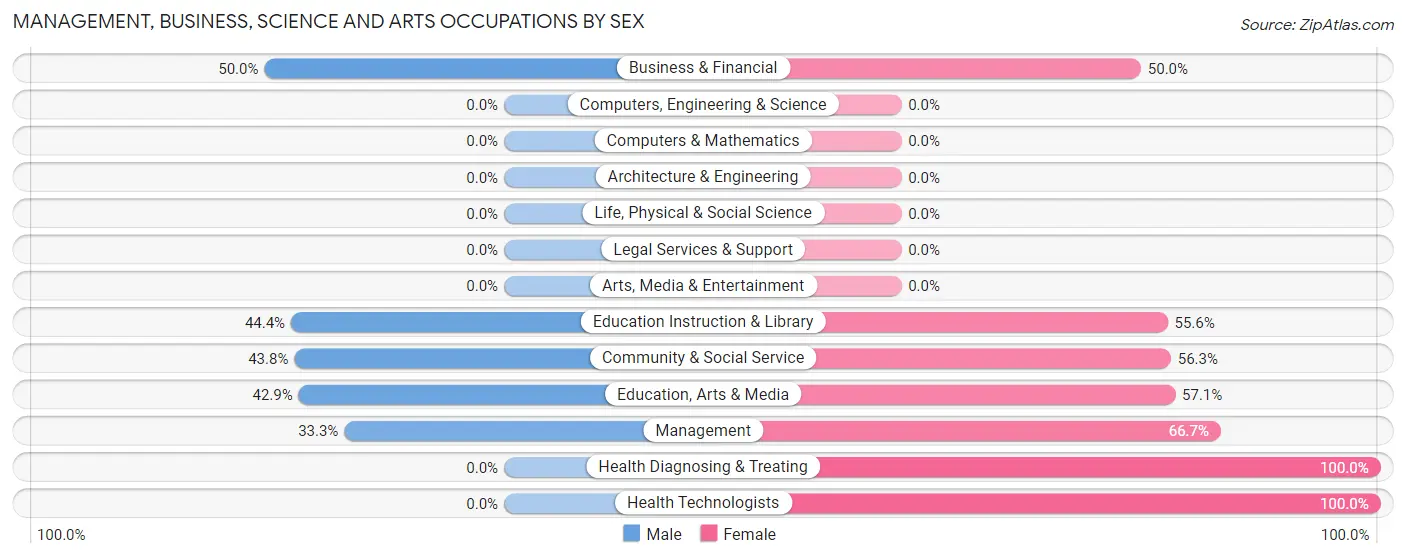
The most common Management, Business, Science and Arts occupations in Lost Creek are Health Diagnosing & Treating (24 | 12.6%), Health Technologists (24 | 12.6%), Community & Social Service (16 | 8.4%), Education Instruction & Library (9 | 4.7%), and Business & Financial (8 | 4.2%).
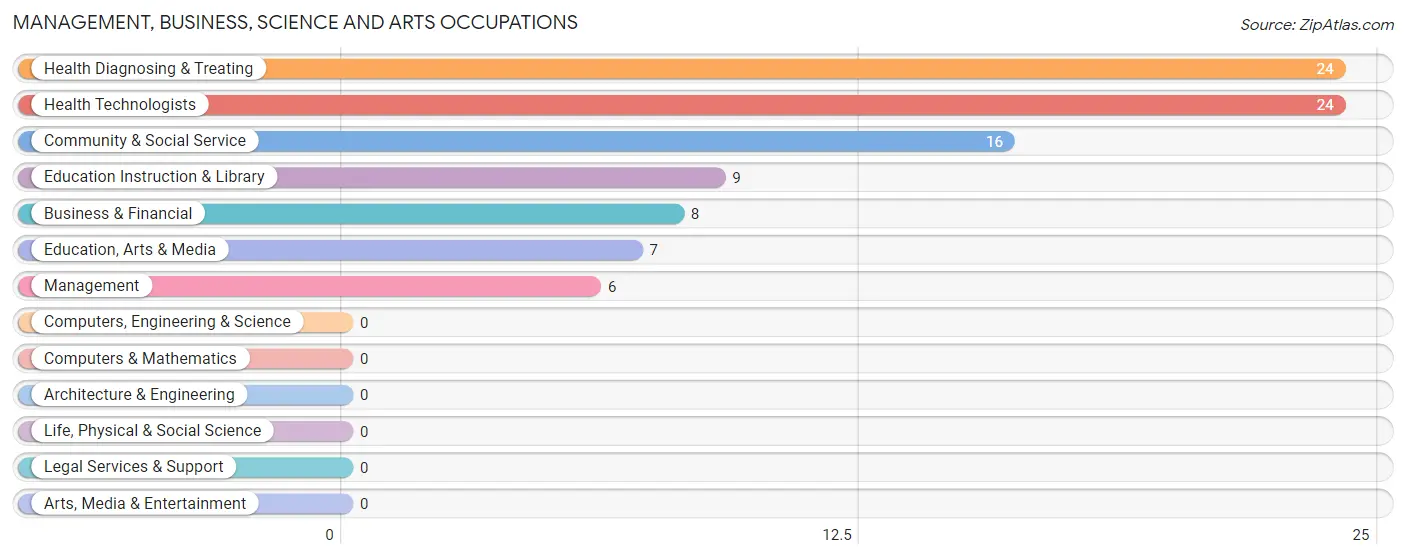
Management, Business, Science and Arts Occupations by Sex
Within the Management, Business, Science and Arts occupations in Lost Creek, the most male-oriented occupations are Business & Financial (50.0%), Education Instruction & Library (44.4%), and Community & Social Service (43.8%), while the most female-oriented occupations are Health Diagnosing & Treating (100.0%), Health Technologists (100.0%), and Management (66.7%).
| Occupation | Male | Female |
| Management | 2 (33.3%) | 4 (66.7%) |
| Business & Financial | 4 (50.0%) | 4 (50.0%) |
| Computers, Engineering & Science | 0 (0.0%) | 0 (0.0%) |
| Computers & Mathematics | 0 (0.0%) | 0 (0.0%) |
| Architecture & Engineering | 0 (0.0%) | 0 (0.0%) |
| Life, Physical & Social Science | 0 (0.0%) | 0 (0.0%) |
| Community & Social Service | 7 (43.8%) | 9 (56.2%) |
| Education, Arts & Media | 3 (42.9%) | 4 (57.1%) |
| Legal Services & Support | 0 (0.0%) | 0 (0.0%) |
| Education Instruction & Library | 4 (44.4%) | 5 (55.6%) |
| Arts, Media & Entertainment | 0 (0.0%) | 0 (0.0%) |
| Health Diagnosing & Treating | 0 (0.0%) | 24 (100.0%) |
| Health Technologists | 0 (0.0%) | 24 (100.0%) |
| Total (Category) | 13 (24.1%) | 41 (75.9%) |
| Total (Overall) | 68 (35.6%) | 123 (64.4%) |
Services Occupations
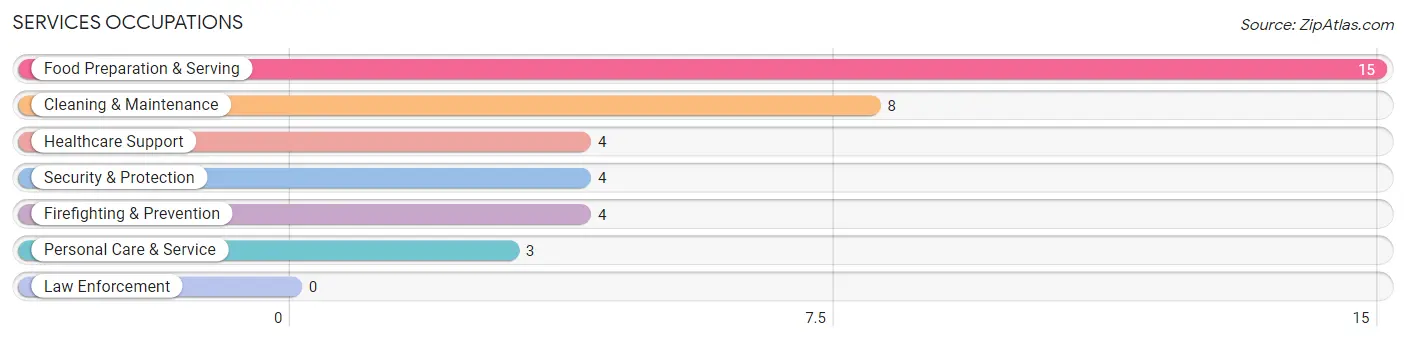
The most common Services occupations in Lost Creek are Food Preparation & Serving (15 | 7.9%), Cleaning & Maintenance (8 | 4.2%), Healthcare Support (4 | 2.1%), Security & Protection (4 | 2.1%), and Firefighting & Prevention (4 | 2.1%).
Services Occupations by Sex
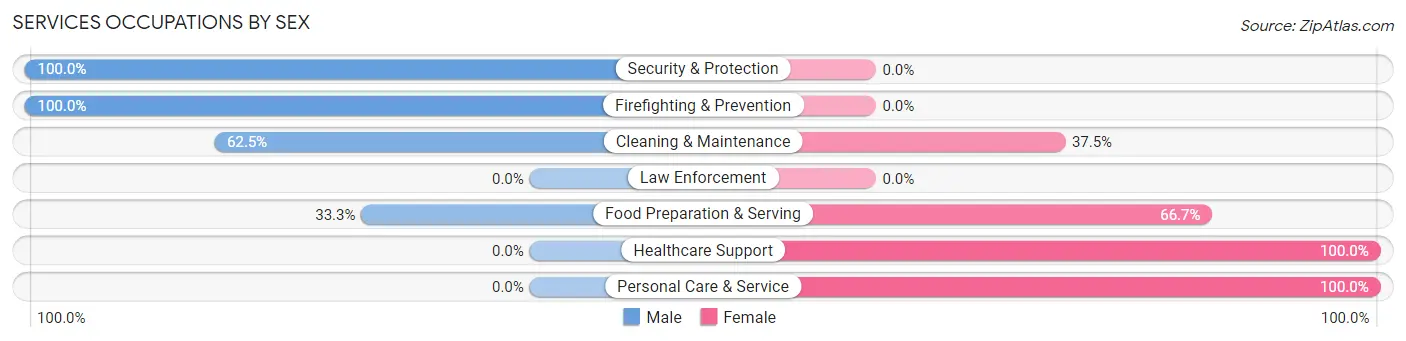
Within the Services occupations in Lost Creek, the most male-oriented occupations are Security & Protection (100.0%), Firefighting & Prevention (100.0%), and Cleaning & Maintenance (62.5%), while the most female-oriented occupations are Healthcare Support (100.0%), Personal Care & Service (100.0%), and Food Preparation & Serving (66.7%).
| Occupation | Male | Female |
| Healthcare Support | 0 (0.0%) | 4 (100.0%) |
| Security & Protection | 4 (100.0%) | 0 (0.0%) |
| Firefighting & Prevention | 4 (100.0%) | 0 (0.0%) |
| Law Enforcement | 0 (0.0%) | 0 (0.0%) |
| Food Preparation & Serving | 5 (33.3%) | 10 (66.7%) |
| Cleaning & Maintenance | 5 (62.5%) | 3 (37.5%) |
| Personal Care & Service | 0 (0.0%) | 3 (100.0%) |
| Total (Category) | 14 (41.2%) | 20 (58.8%) |
| Total (Overall) | 68 (35.6%) | 123 (64.4%) |
Sales and Office Occupations
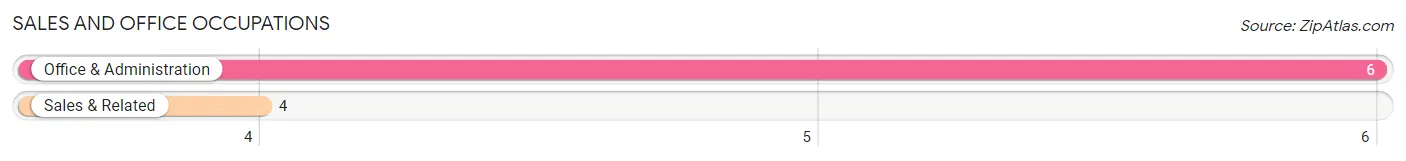
The most common Sales and Office occupations in Lost Creek are Office & Administration (6 | 3.1%), and Sales & Related (4 | 2.1%).
Sales and Office Occupations by Sex
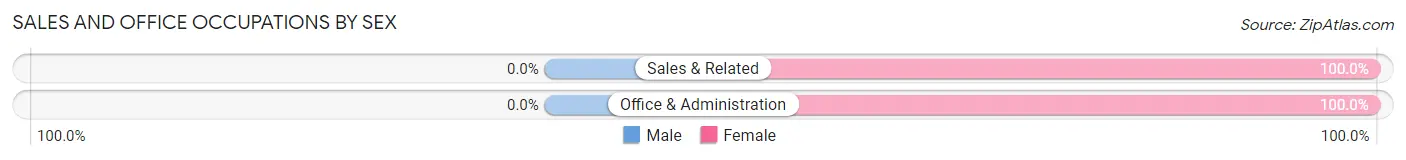
| Occupation | Male | Female |
| Sales & Related | 0 (0.0%) | 4 (100.0%) |
| Office & Administration | 0 (0.0%) | 6 (100.0%) |
| Total (Category) | 0 (0.0%) | 10 (100.0%) |
| Total (Overall) | 68 (35.6%) | 123 (64.4%) |
Natural Resources, Construction and Maintenance Occupations
The most common Natural Resources, Construction and Maintenance occupations in Lost Creek are Construction & Extraction (6 | 3.1%), Installation, Maintenance & Repair (6 | 3.1%), and Farming, Fishing & Forestry (3 | 1.6%).
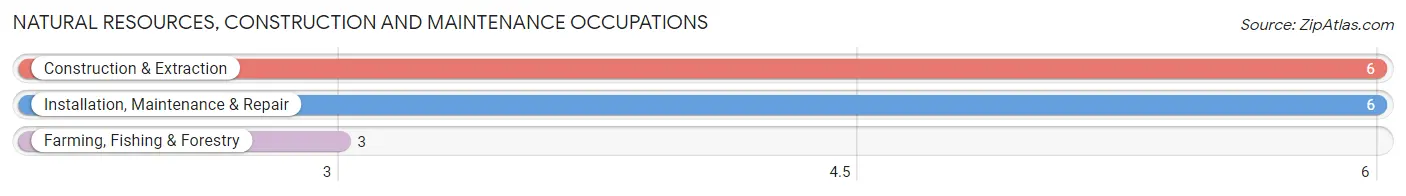
Natural Resources, Construction and Maintenance Occupations by Sex

| Occupation | Male | Female |
| Farming, Fishing & Forestry | 3 (100.0%) | 0 (0.0%) |
| Construction & Extraction | 6 (100.0%) | 0 (0.0%) |
| Installation, Maintenance & Repair | 6 (100.0%) | 0 (0.0%) |
| Total (Category) | 15 (100.0%) | 0 (0.0%) |
| Total (Overall) | 68 (35.6%) | 123 (64.4%) |
Production, Transportation and Moving Occupations
The most common Production, Transportation and Moving occupations in Lost Creek are Transportation (34 | 17.8%), Material Moving (24 | 12.6%), and Production (20 | 10.5%).
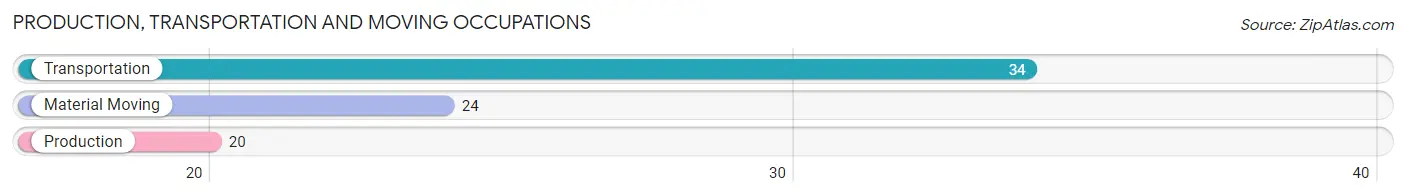
Production, Transportation and Moving Occupations by Sex
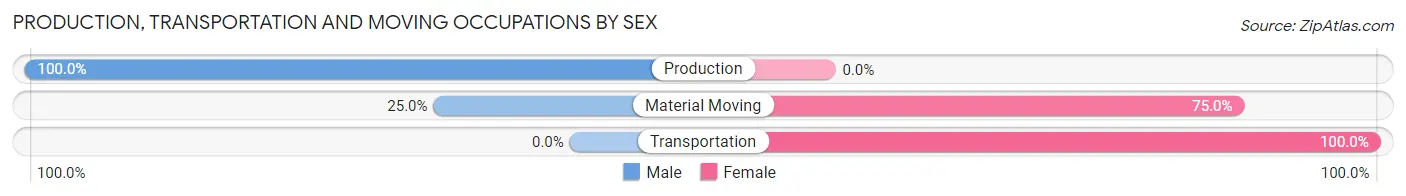
| Occupation | Male | Female |
| Production | 20 (100.0%) | 0 (0.0%) |
| Transportation | 0 (0.0%) | 34 (100.0%) |
| Material Moving | 6 (25.0%) | 18 (75.0%) |
| Total (Category) | 26 (33.3%) | 52 (66.7%) |
| Total (Overall) | 68 (35.6%) | 123 (64.4%) |
Employment Industries by Sex in Lost Creek
Employment Industries in Lost Creek
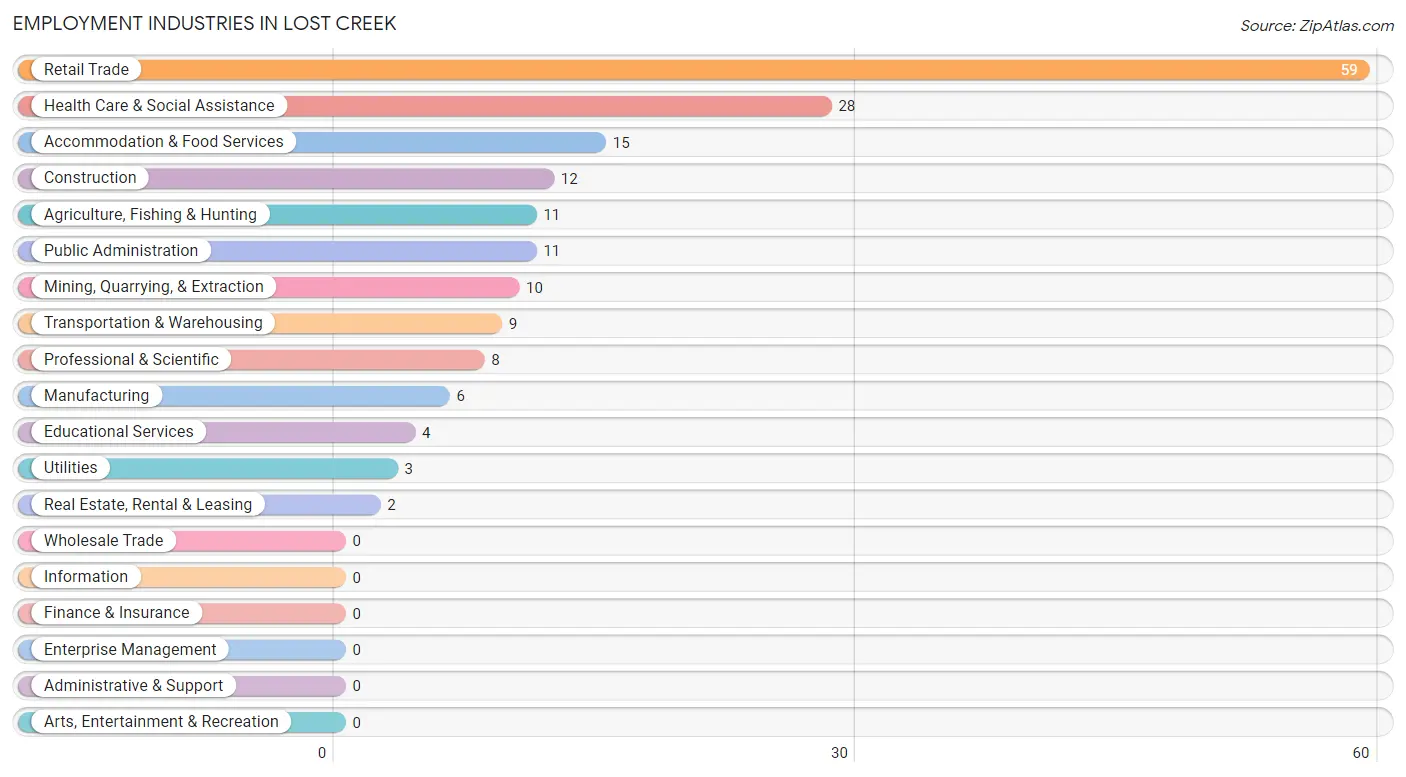
The major employment industries in Lost Creek include Retail Trade (59 | 30.9%), Health Care & Social Assistance (28 | 14.7%), Accommodation & Food Services (15 | 7.9%), Construction (12 | 6.3%), and Agriculture, Fishing & Hunting (11 | 5.8%).
Employment Industries by Sex in Lost Creek
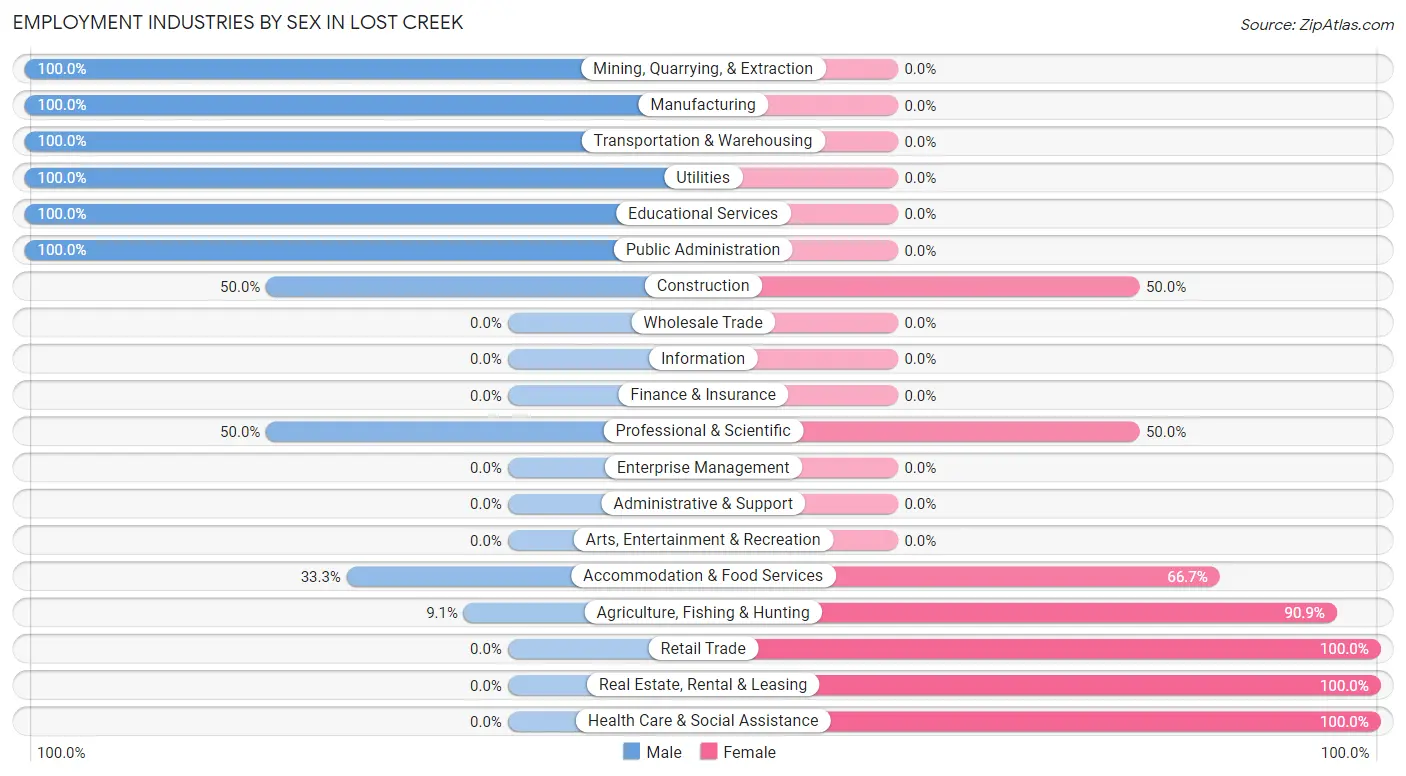
The Lost Creek industries that see more men than women are Mining, Quarrying, & Extraction (100.0%), Manufacturing (100.0%), and Transportation & Warehousing (100.0%), whereas the industries that tend to have a higher number of women are Retail Trade (100.0%), Real Estate, Rental & Leasing (100.0%), and Health Care & Social Assistance (100.0%).
| Industry | Male | Female |
| Agriculture, Fishing & Hunting | 1 (9.1%) | 10 (90.9%) |
| Mining, Quarrying, & Extraction | 10 (100.0%) | 0 (0.0%) |
| Construction | 6 (50.0%) | 6 (50.0%) |
| Manufacturing | 6 (100.0%) | 0 (0.0%) |
| Wholesale Trade | 0 (0.0%) | 0 (0.0%) |
| Retail Trade | 0 (0.0%) | 59 (100.0%) |
| Transportation & Warehousing | 9 (100.0%) | 0 (0.0%) |
| Utilities | 3 (100.0%) | 0 (0.0%) |
| Information | 0 (0.0%) | 0 (0.0%) |
| Finance & Insurance | 0 (0.0%) | 0 (0.0%) |
| Real Estate, Rental & Leasing | 0 (0.0%) | 2 (100.0%) |
| Professional & Scientific | 4 (50.0%) | 4 (50.0%) |
| Enterprise Management | 0 (0.0%) | 0 (0.0%) |
| Administrative & Support | 0 (0.0%) | 0 (0.0%) |
| Educational Services | 4 (100.0%) | 0 (0.0%) |
| Health Care & Social Assistance | 0 (0.0%) | 28 (100.0%) |
| Arts, Entertainment & Recreation | 0 (0.0%) | 0 (0.0%) |
| Accommodation & Food Services | 5 (33.3%) | 10 (66.7%) |
| Public Administration | 11 (100.0%) | 0 (0.0%) |
| Total | 68 (35.6%) | 123 (64.4%) |
Education in Lost Creek
School Enrollment in Lost Creek
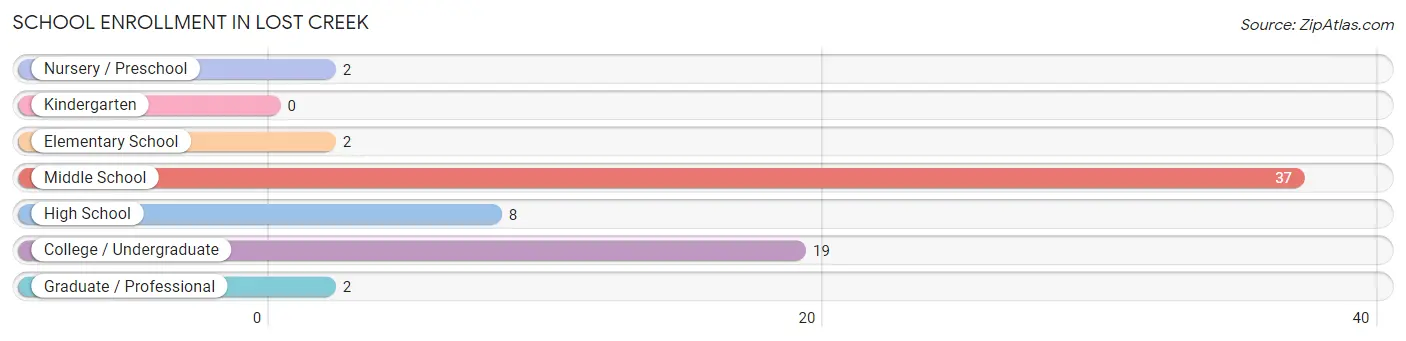
The most common levels of schooling among the 70 students in Lost Creek are middle school (37 | 52.9%), college / undergraduate (19 | 27.1%), and high school (8 | 11.4%).
| School Level | # Students | % Students |
| Nursery / Preschool | 2 | 2.9% |
| Kindergarten | 0 | 0.0% |
| Elementary School | 2 | 2.9% |
| Middle School | 37 | 52.9% |
| High School | 8 | 11.4% |
| College / Undergraduate | 19 | 27.1% |
| Graduate / Professional | 2 | 2.9% |
| Total | 70 | 100.0% |
School Enrollment by Age by Funding Source in Lost Creek
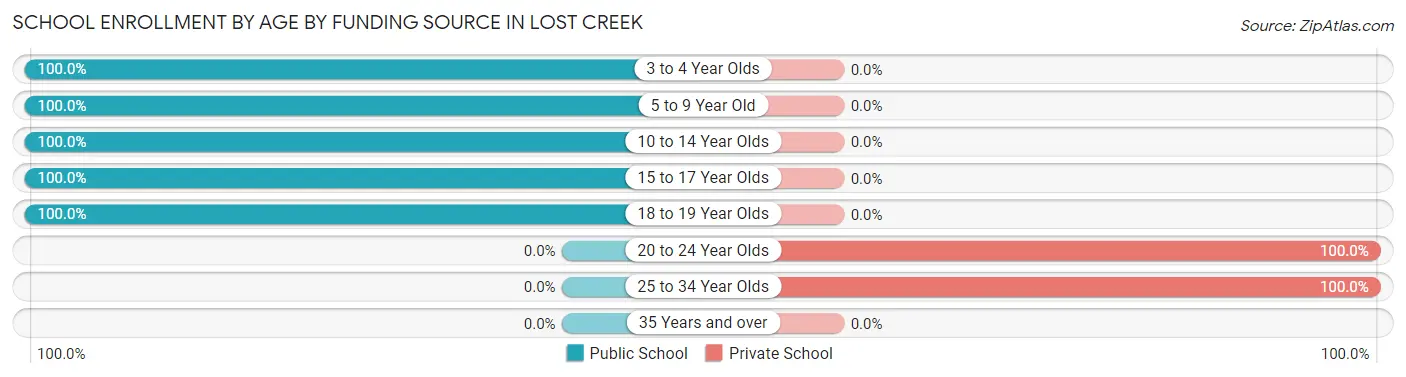
Out of a total of 70 students who are enrolled in schools in Lost Creek, 18 (25.7%) attend a private institution, while the remaining 52 (74.3%) are enrolled in public schools. The age group of 20 to 24 year olds has the highest likelihood of being enrolled in private schools, with 16 (100.0% in the age bracket) enrolled. Conversely, the age group of 3 to 4 year olds has the lowest likelihood of being enrolled in a private school, with 2 (100.0% in the age bracket) attending a public institution.
| Age Bracket | Public School | Private School |
| 3 to 4 Year Olds | 2 (100.0%) | 0 (0.0%) |
| 5 to 9 Year Old | 7 (100.0%) | 0 (0.0%) |
| 10 to 14 Year Olds | 31 (100.0%) | 0 (0.0%) |
| 15 to 17 Year Olds | 9 (100.0%) | 0 (0.0%) |
| 18 to 19 Year Olds | 3 (100.0%) | 0 (0.0%) |
| 20 to 24 Year Olds | 0 (0.0%) | 16 (100.0%) |
| 25 to 34 Year Olds | 0 (0.0%) | 2 (100.0%) |
| 35 Years and over | 0 (0.0%) | 0 (0.0%) |
| Total | 52 (74.3%) | 18 (25.7%) |
Educational Attainment by Field of Study in Lost Creek
Science & technology (24 | 37.5%), psychology (9 | 14.1%), education (8 | 12.5%), liberal arts & history (7 | 10.9%), and social sciences (4 | 6.2%) are the most common fields of study among 64 individuals in Lost Creek who have obtained a bachelor's degree or higher.
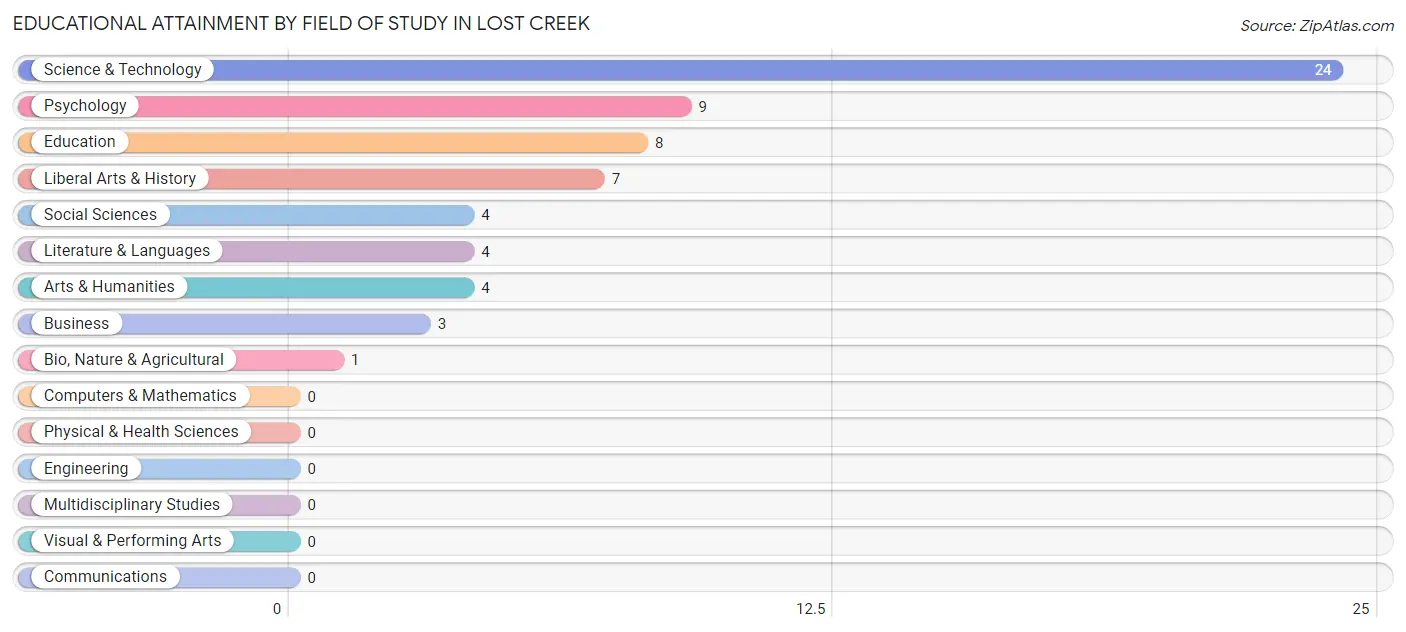
| Field of Study | # Graduates | % Graduates |
| Computers & Mathematics | 0 | 0.0% |
| Bio, Nature & Agricultural | 1 | 1.6% |
| Physical & Health Sciences | 0 | 0.0% |
| Psychology | 9 | 14.1% |
| Social Sciences | 4 | 6.2% |
| Engineering | 0 | 0.0% |
| Multidisciplinary Studies | 0 | 0.0% |
| Science & Technology | 24 | 37.5% |
| Business | 3 | 4.7% |
| Education | 8 | 12.5% |
| Literature & Languages | 4 | 6.2% |
| Liberal Arts & History | 7 | 10.9% |
| Visual & Performing Arts | 0 | 0.0% |
| Communications | 0 | 0.0% |
| Arts & Humanities | 4 | 6.2% |
| Total | 64 | 100.0% |
Transportation & Commute in Lost Creek
Vehicle Availability by Sex in Lost Creek
The most prevalent vehicle ownership categories in Lost Creek are males with 2 vehicles (39, accounting for 57.4%) and females with 2 vehicles (52, making up 32.8%).
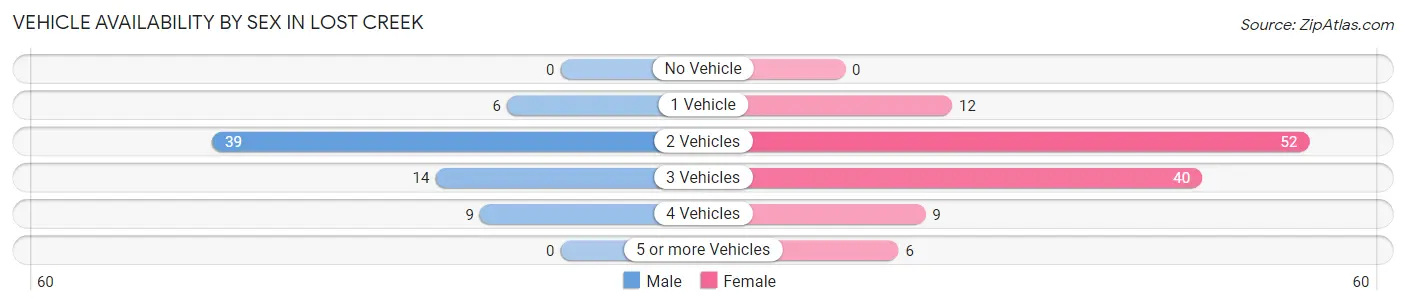
| Vehicles Available | Male | Female |
| No Vehicle | 0 (0.0%) | 0 (0.0%) |
| 1 Vehicle | 6 (8.8%) | 12 (10.1%) |
| 2 Vehicles | 39 (57.4%) | 52 (43.7%) |
| 3 Vehicles | 14 (20.6%) | 40 (33.6%) |
| 4 Vehicles | 9 (13.2%) | 9 (7.6%) |
| 5 or more Vehicles | 0 (0.0%) | 6 (5.0%) |
| Total | 68 (100.0%) | 119 (100.0%) |
Commute Time in Lost Creek
The most frequently occuring commute durations in Lost Creek are 15 to 19 minutes (61 commuters, 34.1%), 20 to 24 minutes (54 commuters, 30.2%), and 30 to 34 minutes (19 commuters, 10.6%).
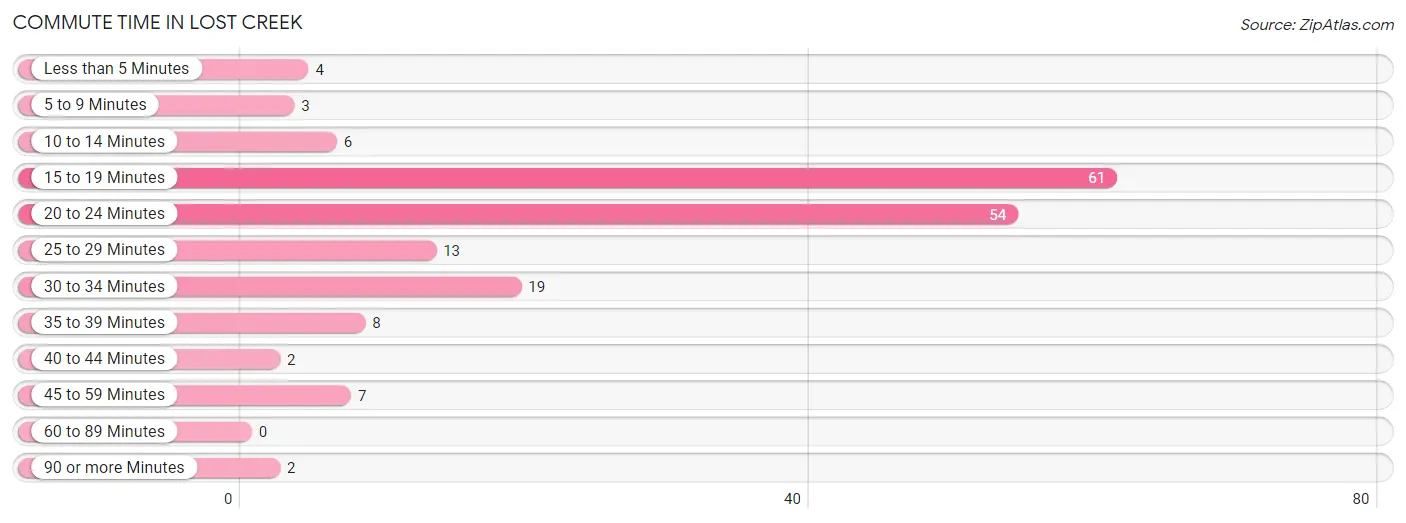
| Commute Time | # Commuters | % Commuters |
| Less than 5 Minutes | 4 | 2.2% |
| 5 to 9 Minutes | 3 | 1.7% |
| 10 to 14 Minutes | 6 | 3.4% |
| 15 to 19 Minutes | 61 | 34.1% |
| 20 to 24 Minutes | 54 | 30.2% |
| 25 to 29 Minutes | 13 | 7.3% |
| 30 to 34 Minutes | 19 | 10.6% |
| 35 to 39 Minutes | 8 | 4.5% |
| 40 to 44 Minutes | 2 | 1.1% |
| 45 to 59 Minutes | 7 | 3.9% |
| 60 to 89 Minutes | 0 | 0.0% |
| 90 or more Minutes | 2 | 1.1% |
Commute Time by Sex in Lost Creek
The most common commute times in Lost Creek are 20 to 24 minutes (21 commuters, 32.8%) for males and 15 to 19 minutes (47 commuters, 40.9%) for females.
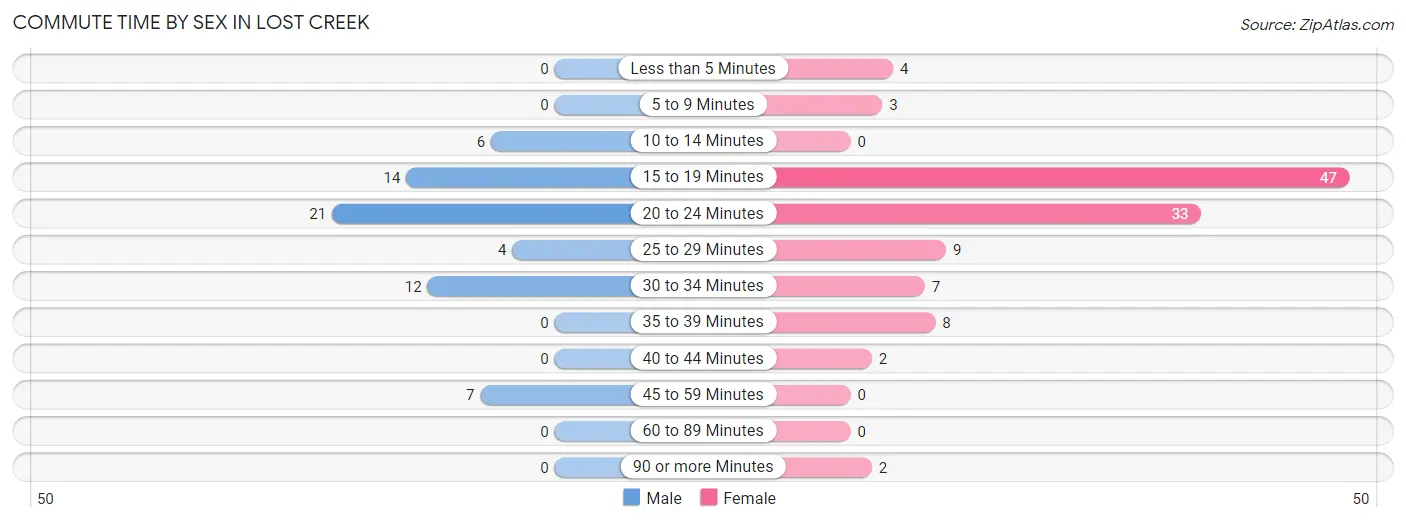
| Commute Time | Male | Female |
| Less than 5 Minutes | 0 (0.0%) | 4 (3.5%) |
| 5 to 9 Minutes | 0 (0.0%) | 3 (2.6%) |
| 10 to 14 Minutes | 6 (9.4%) | 0 (0.0%) |
| 15 to 19 Minutes | 14 (21.9%) | 47 (40.9%) |
| 20 to 24 Minutes | 21 (32.8%) | 33 (28.7%) |
| 25 to 29 Minutes | 4 (6.2%) | 9 (7.8%) |
| 30 to 34 Minutes | 12 (18.8%) | 7 (6.1%) |
| 35 to 39 Minutes | 0 (0.0%) | 8 (7.0%) |
| 40 to 44 Minutes | 0 (0.0%) | 2 (1.7%) |
| 45 to 59 Minutes | 7 (10.9%) | 0 (0.0%) |
| 60 to 89 Minutes | 0 (0.0%) | 0 (0.0%) |
| 90 or more Minutes | 0 (0.0%) | 2 (1.7%) |
Time of Departure to Work by Sex in Lost Creek
The most frequent times of departure to work in Lost Creek are 6:00 AM to 6:29 AM (23, 35.9%) for males and 7:00 AM to 7:29 AM (45, 39.1%) for females.
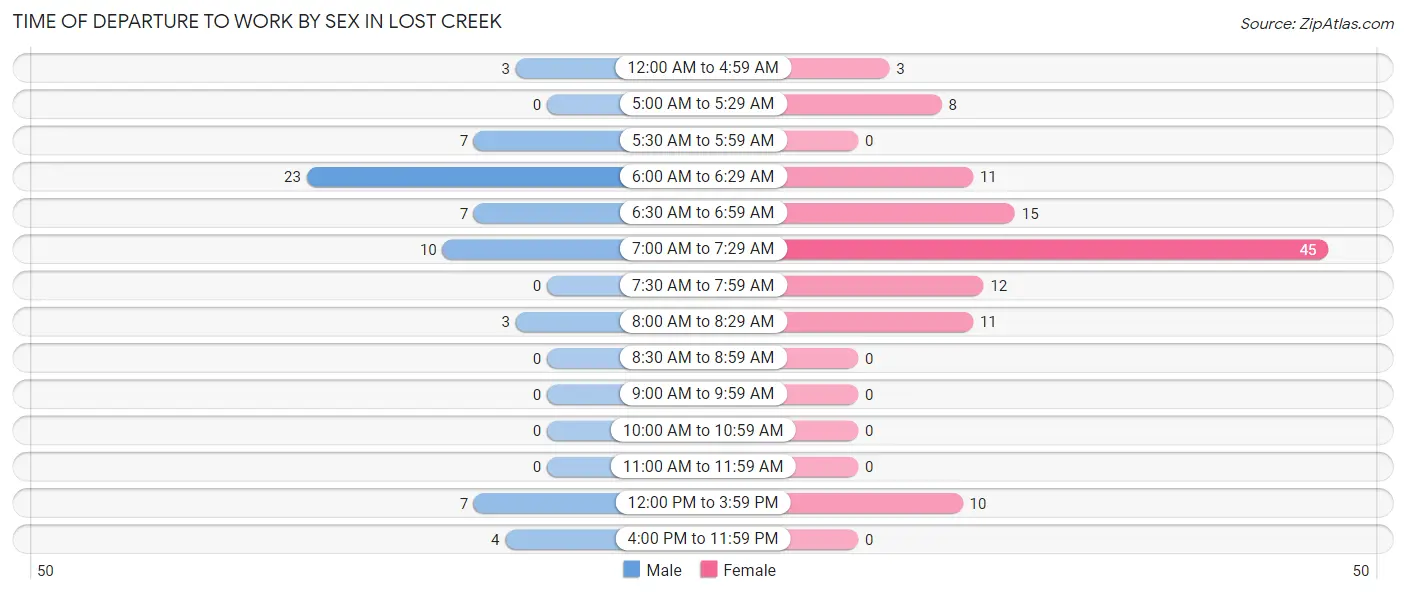
| Time of Departure | Male | Female |
| 12:00 AM to 4:59 AM | 3 (4.7%) | 3 (2.6%) |
| 5:00 AM to 5:29 AM | 0 (0.0%) | 8 (7.0%) |
| 5:30 AM to 5:59 AM | 7 (10.9%) | 0 (0.0%) |
| 6:00 AM to 6:29 AM | 23 (35.9%) | 11 (9.6%) |
| 6:30 AM to 6:59 AM | 7 (10.9%) | 15 (13.0%) |
| 7:00 AM to 7:29 AM | 10 (15.6%) | 45 (39.1%) |
| 7:30 AM to 7:59 AM | 0 (0.0%) | 12 (10.4%) |
| 8:00 AM to 8:29 AM | 3 (4.7%) | 11 (9.6%) |
| 8:30 AM to 8:59 AM | 0 (0.0%) | 0 (0.0%) |
| 9:00 AM to 9:59 AM | 0 (0.0%) | 0 (0.0%) |
| 10:00 AM to 10:59 AM | 0 (0.0%) | 0 (0.0%) |
| 11:00 AM to 11:59 AM | 0 (0.0%) | 0 (0.0%) |
| 12:00 PM to 3:59 PM | 7 (10.9%) | 10 (8.7%) |
| 4:00 PM to 11:59 PM | 4 (6.2%) | 0 (0.0%) |
| Total | 64 (100.0%) | 115 (100.0%) |
Housing Occupancy in Lost Creek
Occupancy by Ownership in Lost Creek
Of the total 142 dwellings in Lost Creek, owner-occupied units account for 113 (79.6%), while renter-occupied units make up 29 (20.4%).
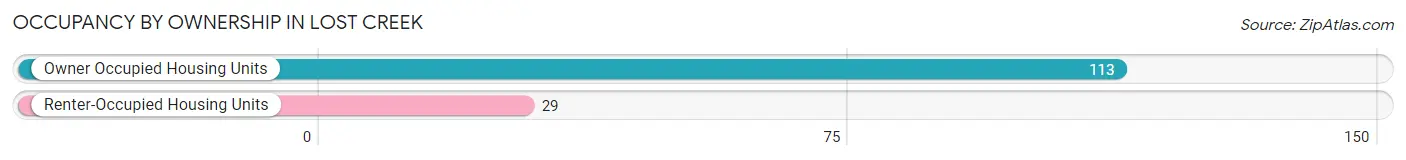
| Occupancy | # Housing Units | % Housing Units |
| Owner Occupied Housing Units | 113 | 79.6% |
| Renter-Occupied Housing Units | 29 | 20.4% |
| Total Occupied Housing Units | 142 | 100.0% |
Occupancy by Household Size in Lost Creek
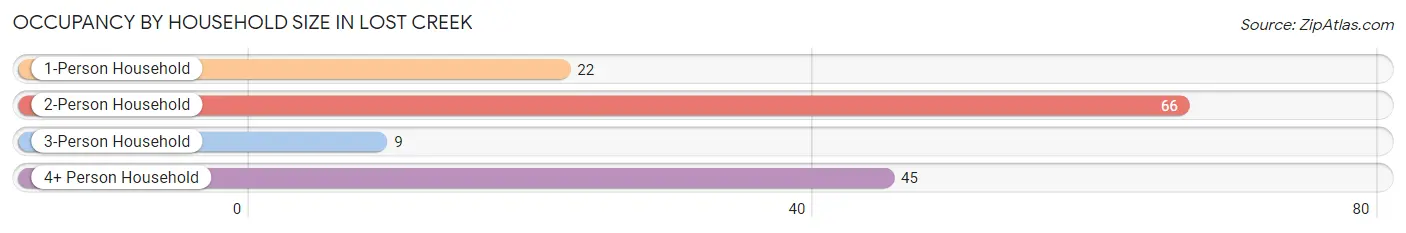
| Household Size | # Housing Units | % Housing Units |
| 1-Person Household | 22 | 15.5% |
| 2-Person Household | 66 | 46.5% |
| 3-Person Household | 9 | 6.3% |
| 4+ Person Household | 45 | 31.7% |
| Total Housing Units | 142 | 100.0% |
Occupancy by Ownership by Household Size in Lost Creek
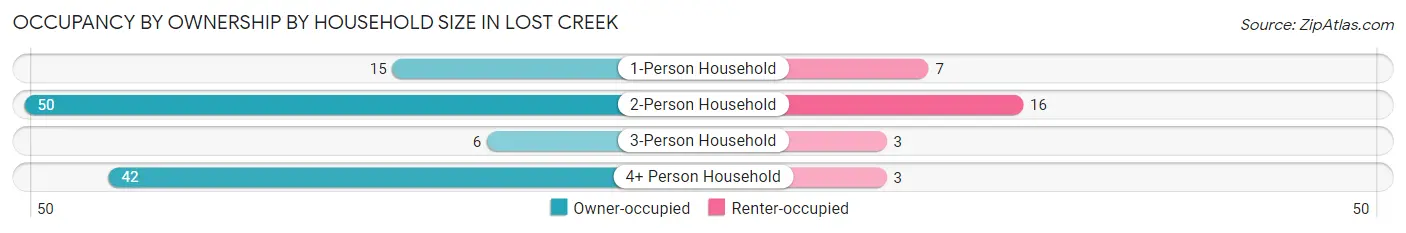
| Household Size | Owner-occupied | Renter-occupied |
| 1-Person Household | 15 (68.2%) | 7 (31.8%) |
| 2-Person Household | 50 (75.8%) | 16 (24.2%) |
| 3-Person Household | 6 (66.7%) | 3 (33.3%) |
| 4+ Person Household | 42 (93.3%) | 3 (6.7%) |
| Total Housing Units | 113 (79.6%) | 29 (20.4%) |
Occupancy by Educational Attainment in Lost Creek
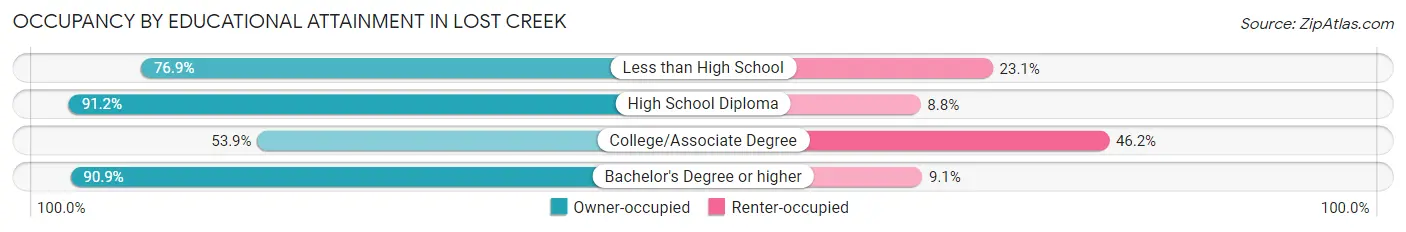
| Household Size | Owner-occupied | Renter-occupied |
| Less than High School | 10 (76.9%) | 3 (23.1%) |
| High School Diploma | 52 (91.2%) | 5 (8.8%) |
| College/Associate Degree | 21 (53.8%) | 18 (46.2%) |
| Bachelor's Degree or higher | 30 (90.9%) | 3 (9.1%) |
Occupancy by Age of Householder in Lost Creek
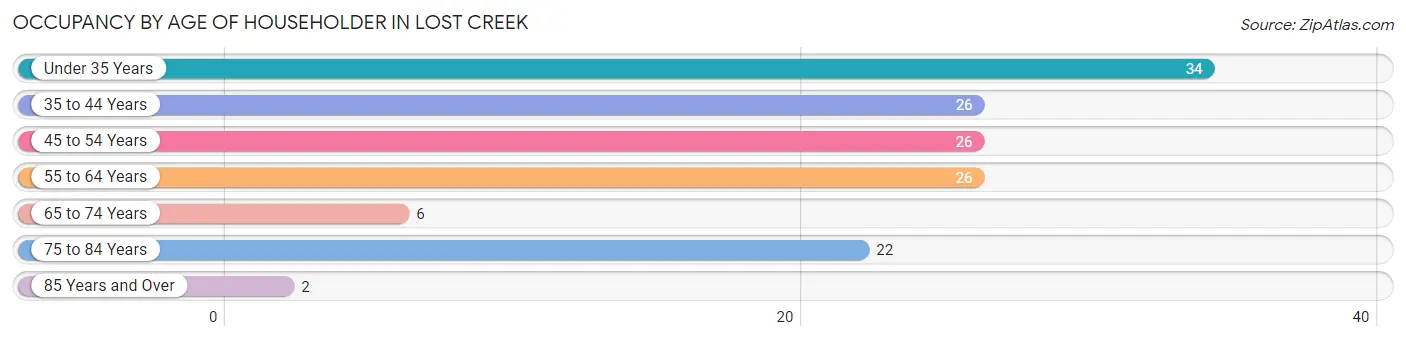
| Age Bracket | # Households | % Households |
| Under 35 Years | 34 | 23.9% |
| 35 to 44 Years | 26 | 18.3% |
| 45 to 54 Years | 26 | 18.3% |
| 55 to 64 Years | 26 | 18.3% |
| 65 to 74 Years | 6 | 4.2% |
| 75 to 84 Years | 22 | 15.5% |
| 85 Years and Over | 2 | 1.4% |
| Total | 142 | 100.0% |
Housing Finances in Lost Creek
Median Income by Occupancy in Lost Creek
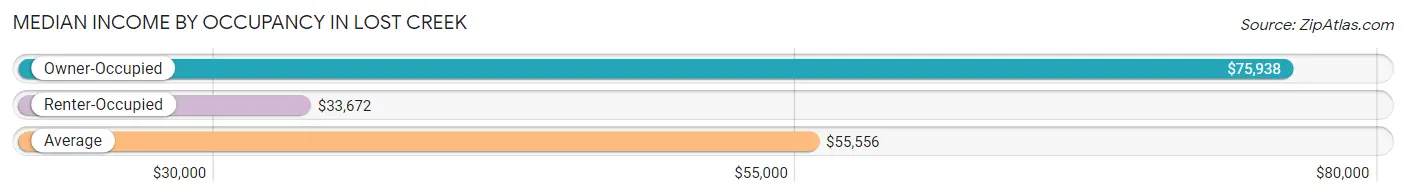
| Occupancy Type | # Households | Median Income |
| Owner-Occupied | 113 (79.6%) | $75,938 |
| Renter-Occupied | 29 (20.4%) | $33,672 |
| Average | 142 (100.0%) | $55,556 |
Occupancy by Householder Income Bracket in Lost Creek
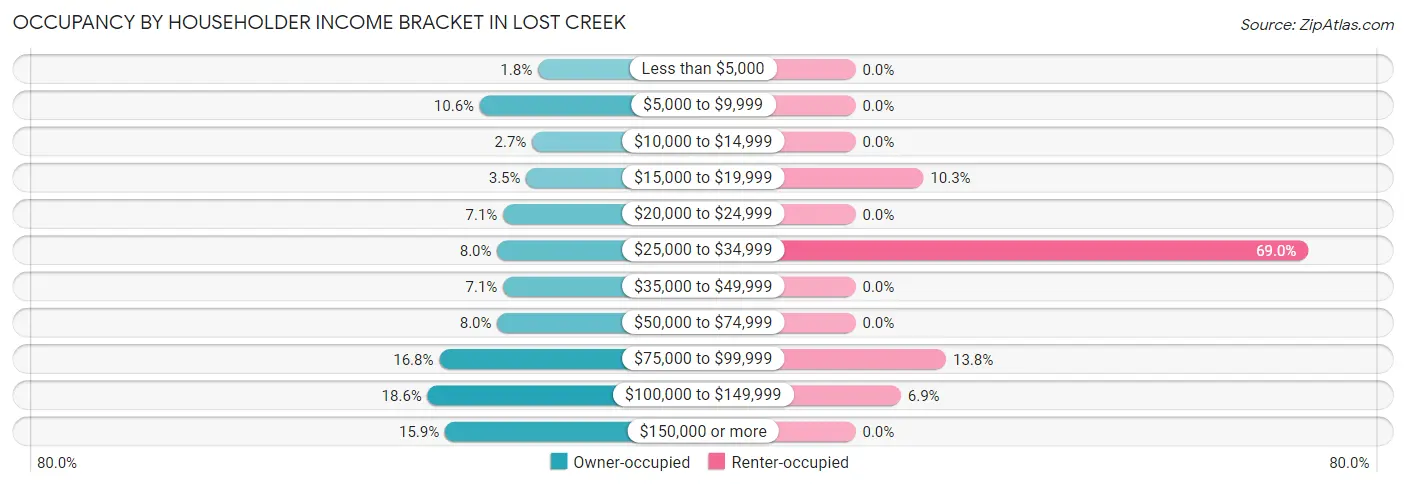
| Income Bracket | Owner-occupied | Renter-occupied |
| Less than $5,000 | 2 (1.8%) | 0 (0.0%) |
| $5,000 to $9,999 | 12 (10.6%) | 0 (0.0%) |
| $10,000 to $14,999 | 3 (2.6%) | 0 (0.0%) |
| $15,000 to $19,999 | 4 (3.5%) | 3 (10.3%) |
| $20,000 to $24,999 | 8 (7.1%) | 0 (0.0%) |
| $25,000 to $34,999 | 9 (8.0%) | 20 (69.0%) |
| $35,000 to $49,999 | 8 (7.1%) | 0 (0.0%) |
| $50,000 to $74,999 | 9 (8.0%) | 0 (0.0%) |
| $75,000 to $99,999 | 19 (16.8%) | 4 (13.8%) |
| $100,000 to $149,999 | 21 (18.6%) | 2 (6.9%) |
| $150,000 or more | 18 (15.9%) | 0 (0.0%) |
| Total | 113 (100.0%) | 29 (100.0%) |
Monthly Housing Cost Tiers in Lost Creek
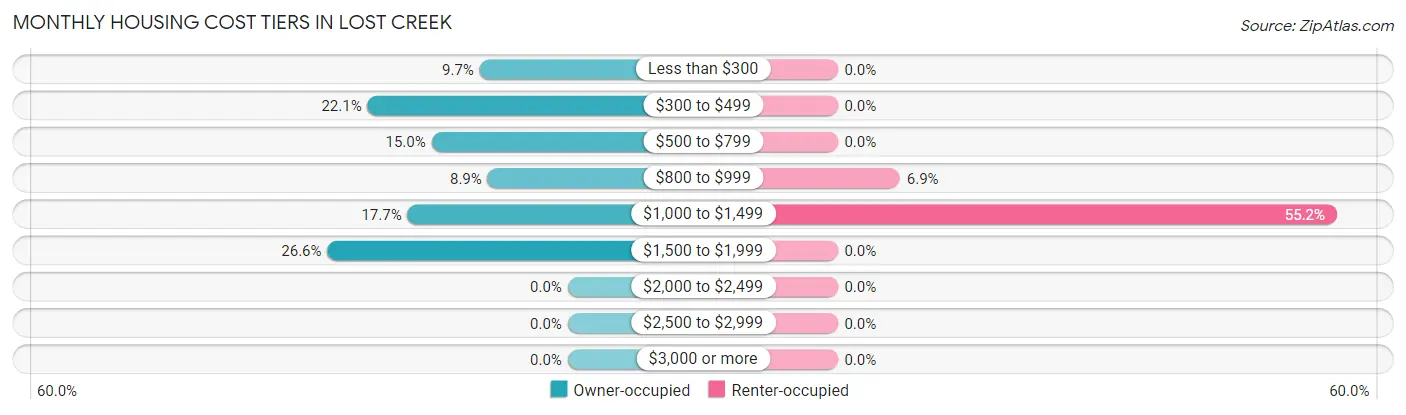
| Monthly Cost | Owner-occupied | Renter-occupied |
| Less than $300 | 11 (9.7%) | 0 (0.0%) |
| $300 to $499 | 25 (22.1%) | 0 (0.0%) |
| $500 to $799 | 17 (15.0%) | 0 (0.0%) |
| $800 to $999 | 10 (8.8%) | 2 (6.9%) |
| $1,000 to $1,499 | 20 (17.7%) | 16 (55.2%) |
| $1,500 to $1,999 | 30 (26.6%) | 0 (0.0%) |
| $2,000 to $2,499 | 0 (0.0%) | 0 (0.0%) |
| $2,500 to $2,999 | 0 (0.0%) | 0 (0.0%) |
| $3,000 or more | 0 (0.0%) | 0 (0.0%) |
| Total | 113 (100.0%) | 29 (100.0%) |
Physical Housing Characteristics in Lost Creek
Housing Structures in Lost Creek
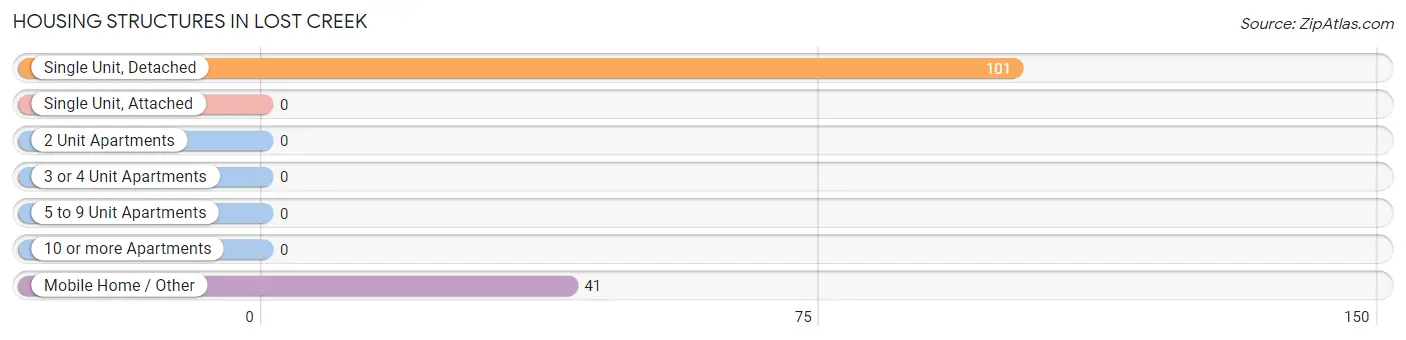
| Structure Type | # Housing Units | % Housing Units |
| Single Unit, Detached | 101 | 71.1% |
| Single Unit, Attached | 0 | 0.0% |
| 2 Unit Apartments | 0 | 0.0% |
| 3 or 4 Unit Apartments | 0 | 0.0% |
| 5 to 9 Unit Apartments | 0 | 0.0% |
| 10 or more Apartments | 0 | 0.0% |
| Mobile Home / Other | 41 | 28.9% |
| Total | 142 | 100.0% |
Housing Structures by Occupancy in Lost Creek
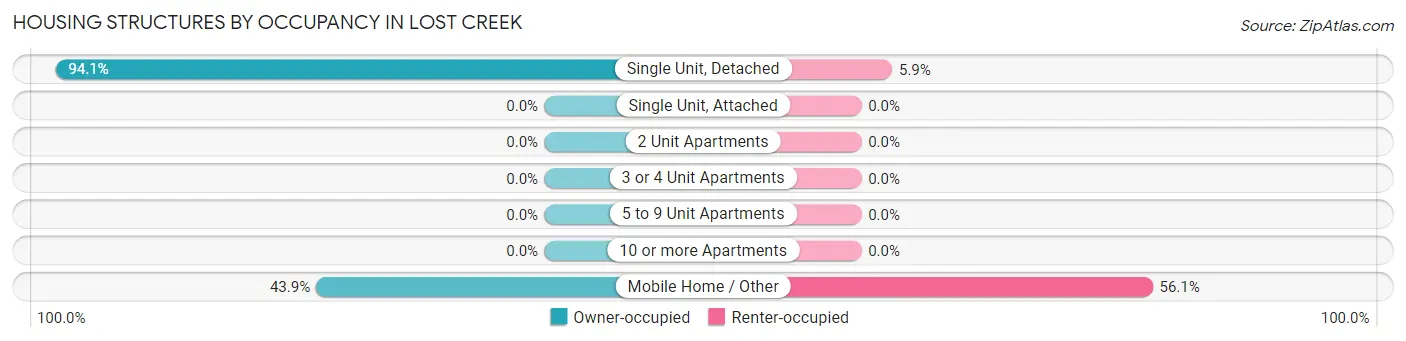
| Structure Type | Owner-occupied | Renter-occupied |
| Single Unit, Detached | 95 (94.1%) | 6 (5.9%) |
| Single Unit, Attached | 0 (0.0%) | 0 (0.0%) |
| 2 Unit Apartments | 0 (0.0%) | 0 (0.0%) |
| 3 or 4 Unit Apartments | 0 (0.0%) | 0 (0.0%) |
| 5 to 9 Unit Apartments | 0 (0.0%) | 0 (0.0%) |
| 10 or more Apartments | 0 (0.0%) | 0 (0.0%) |
| Mobile Home / Other | 18 (43.9%) | 23 (56.1%) |
| Total | 113 (79.6%) | 29 (20.4%) |
Housing Structures by Number of Rooms in Lost Creek
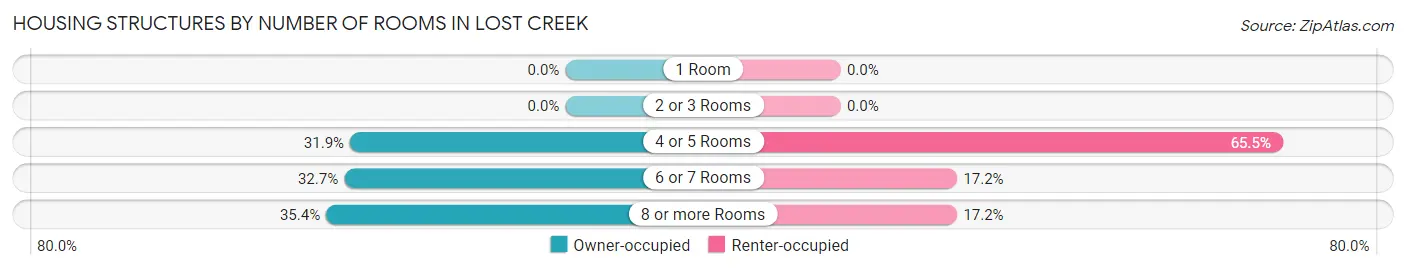
| Number of Rooms | Owner-occupied | Renter-occupied |
| 1 Room | 0 (0.0%) | 0 (0.0%) |
| 2 or 3 Rooms | 0 (0.0%) | 0 (0.0%) |
| 4 or 5 Rooms | 36 (31.9%) | 19 (65.5%) |
| 6 or 7 Rooms | 37 (32.7%) | 5 (17.2%) |
| 8 or more Rooms | 40 (35.4%) | 5 (17.2%) |
| Total | 113 (100.0%) | 29 (100.0%) |
Housing Structure by Heating Type in Lost Creek
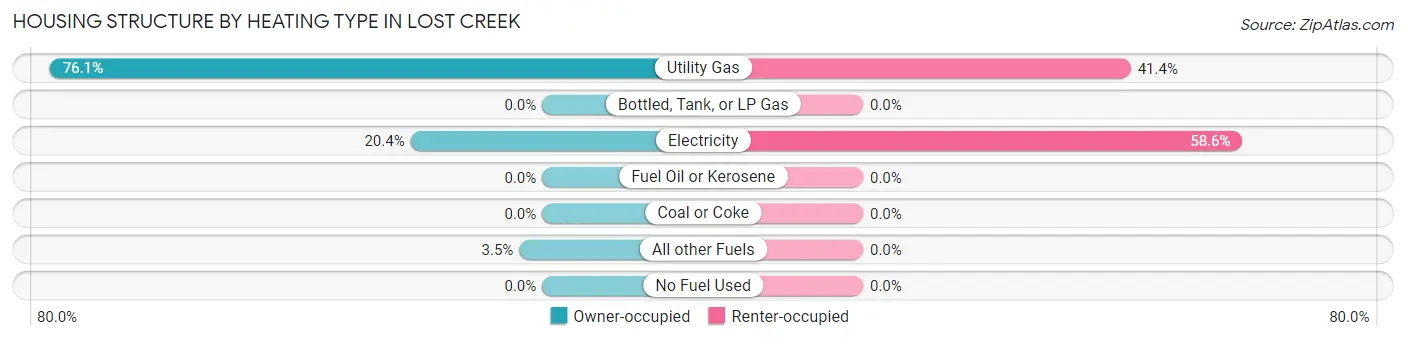
| Heating Type | Owner-occupied | Renter-occupied |
| Utility Gas | 86 (76.1%) | 12 (41.4%) |
| Bottled, Tank, or LP Gas | 0 (0.0%) | 0 (0.0%) |
| Electricity | 23 (20.3%) | 17 (58.6%) |
| Fuel Oil or Kerosene | 0 (0.0%) | 0 (0.0%) |
| Coal or Coke | 0 (0.0%) | 0 (0.0%) |
| All other Fuels | 4 (3.5%) | 0 (0.0%) |
| No Fuel Used | 0 (0.0%) | 0 (0.0%) |
| Total | 113 (100.0%) | 29 (100.0%) |
Household Vehicle Usage in Lost Creek
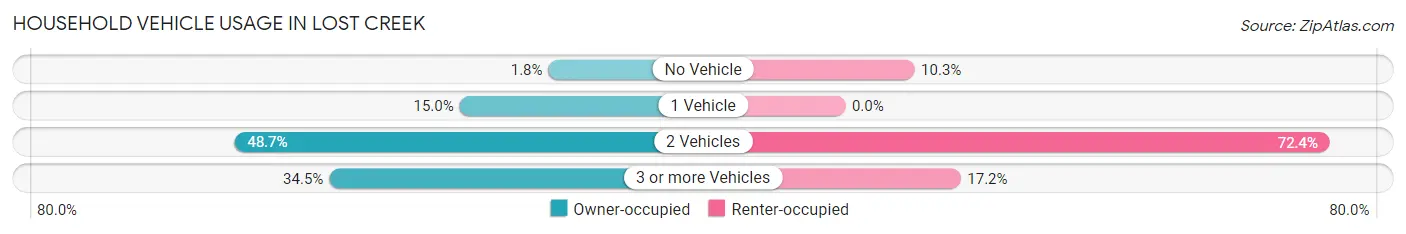
| Vehicles per Household | Owner-occupied | Renter-occupied |
| No Vehicle | 2 (1.8%) | 3 (10.3%) |
| 1 Vehicle | 17 (15.0%) | 0 (0.0%) |
| 2 Vehicles | 55 (48.7%) | 21 (72.4%) |
| 3 or more Vehicles | 39 (34.5%) | 5 (17.2%) |
| Total | 113 (100.0%) | 29 (100.0%) |
Real Estate & Mortgages in Lost Creek
Real Estate and Mortgage Overview in Lost Creek
| Characteristic | Without Mortgage | With Mortgage |
| Housing Units | 43 | 70 |
| Median Property Value | $87,500 | $153,800 |
| Median Household Income | $55,417 | $16 |
| Monthly Housing Costs | $403 | $0 |
| Real Estate Taxes | $500 | $10 |
Property Value by Mortgage Status in Lost Creek
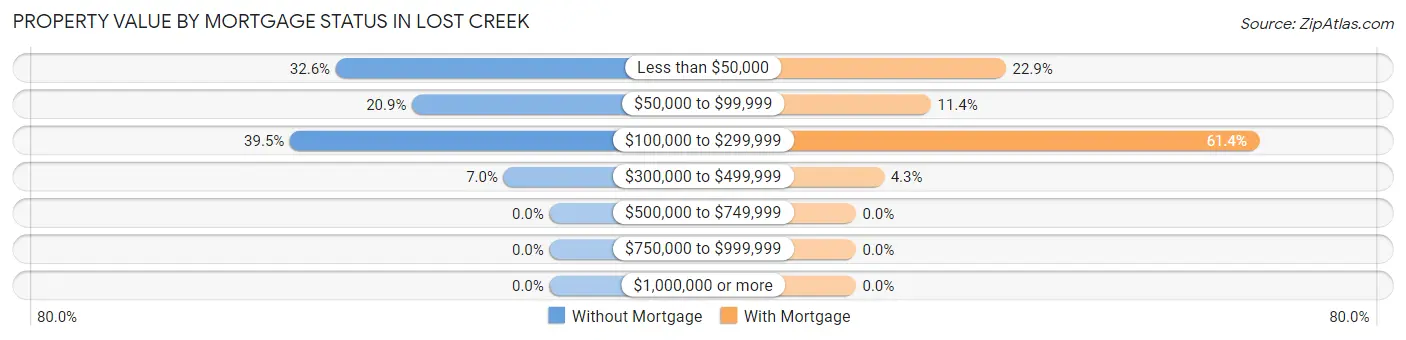
| Property Value | Without Mortgage | With Mortgage |
| Less than $50,000 | 14 (32.6%) | 16 (22.9%) |
| $50,000 to $99,999 | 9 (20.9%) | 8 (11.4%) |
| $100,000 to $299,999 | 17 (39.5%) | 43 (61.4%) |
| $300,000 to $499,999 | 3 (7.0%) | 3 (4.3%) |
| $500,000 to $749,999 | 0 (0.0%) | 0 (0.0%) |
| $750,000 to $999,999 | 0 (0.0%) | 0 (0.0%) |
| $1,000,000 or more | 0 (0.0%) | 0 (0.0%) |
| Total | 43 (100.0%) | 70 (100.0%) |
Household Income by Mortgage Status in Lost Creek
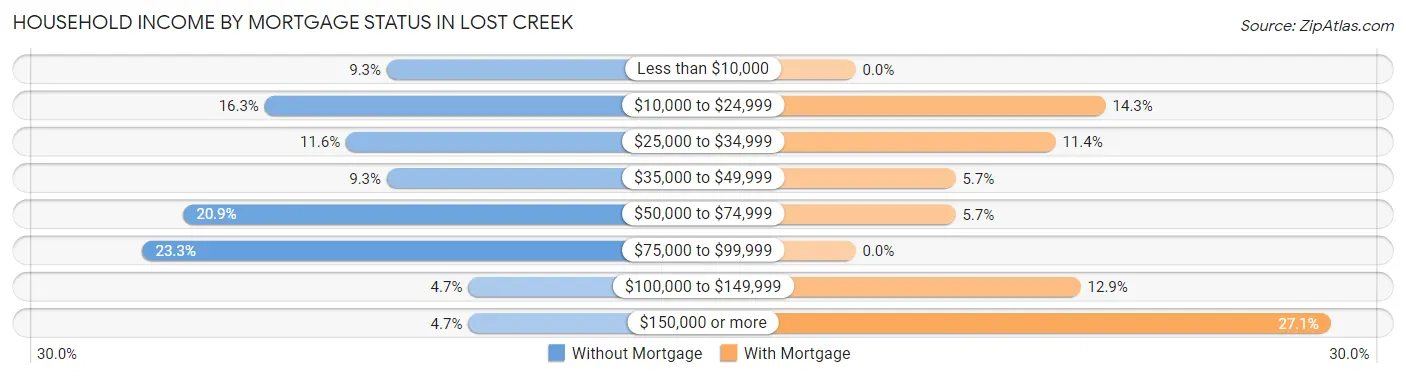
| Household Income | Without Mortgage | With Mortgage |
| Less than $10,000 | 4 (9.3%) | 0 (0.0%) |
| $10,000 to $24,999 | 7 (16.3%) | 10 (14.3%) |
| $25,000 to $34,999 | 5 (11.6%) | 8 (11.4%) |
| $35,000 to $49,999 | 4 (9.3%) | 4 (5.7%) |
| $50,000 to $74,999 | 9 (20.9%) | 4 (5.7%) |
| $75,000 to $99,999 | 10 (23.3%) | 0 (0.0%) |
| $100,000 to $149,999 | 2 (4.6%) | 9 (12.9%) |
| $150,000 or more | 2 (4.6%) | 19 (27.1%) |
| Total | 43 (100.0%) | 70 (100.0%) |
Property Value to Household Income Ratio in Lost Creek
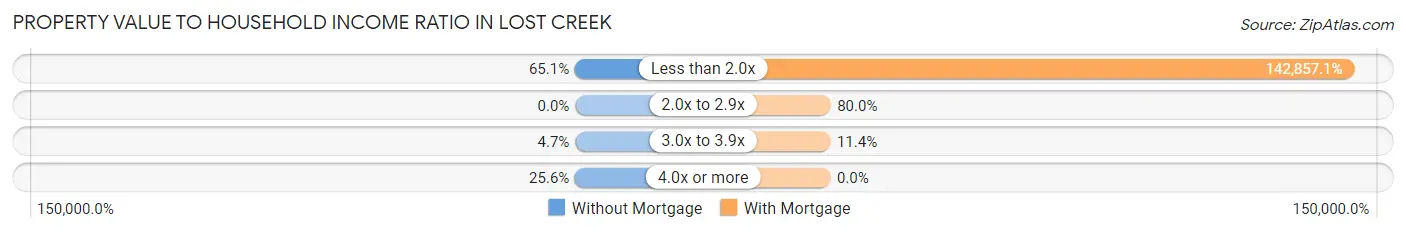
| Value-to-Income Ratio | Without Mortgage | With Mortgage |
| Less than 2.0x | 28 (65.1%) | 100,000 (142,857.1%) |
| 2.0x to 2.9x | 0 (0.0%) | 56 (80.0%) |
| 3.0x to 3.9x | 2 (4.6%) | 8 (11.4%) |
| 4.0x or more | 11 (25.6%) | 0 (0.0%) |
| Total | 43 (100.0%) | 70 (100.0%) |
Real Estate Taxes by Mortgage Status in Lost Creek
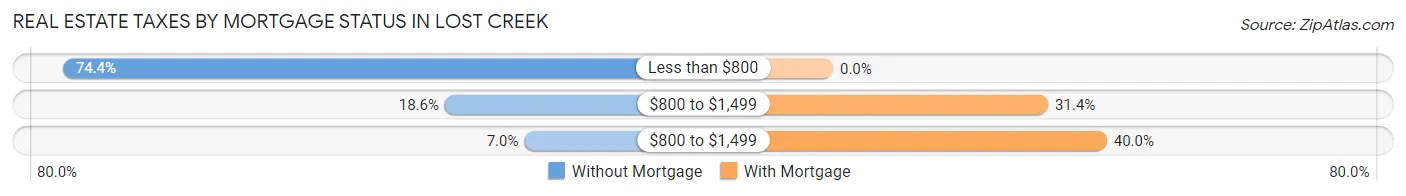
| Property Taxes | Without Mortgage | With Mortgage |
| Less than $800 | 32 (74.4%) | 0 (0.0%) |
| $800 to $1,499 | 8 (18.6%) | 22 (31.4%) |
| $800 to $1,499 | 3 (7.0%) | 28 (40.0%) |
| Total | 43 (100.0%) | 70 (100.0%) |
Health & Disability in Lost Creek
Health Insurance Coverage by Age in Lost Creek
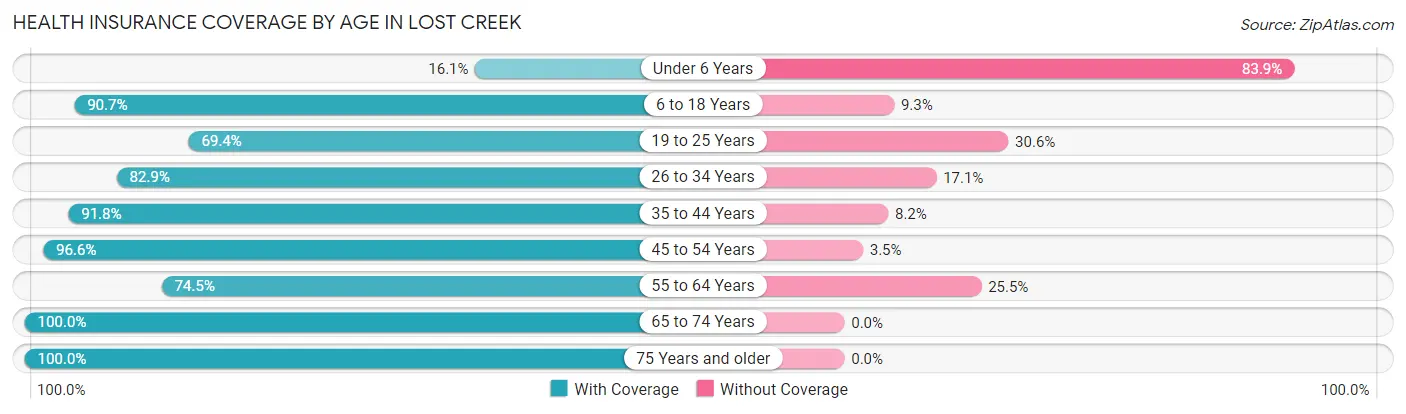
| Age Bracket | With Coverage | Without Coverage |
| Under 6 Years | 5 (16.1%) | 26 (83.9%) |
| 6 to 18 Years | 49 (90.7%) | 5 (9.3%) |
| 19 to 25 Years | 50 (69.4%) | 22 (30.6%) |
| 26 to 34 Years | 29 (82.9%) | 6 (17.1%) |
| 35 to 44 Years | 45 (91.8%) | 4 (8.2%) |
| 45 to 54 Years | 56 (96.6%) | 2 (3.5%) |
| 55 to 64 Years | 35 (74.5%) | 12 (25.5%) |
| 65 to 74 Years | 13 (100.0%) | 0 (0.0%) |
| 75 Years and older | 27 (100.0%) | 0 (0.0%) |
| Total | 309 (80.0%) | 77 (20.0%) |
Health Insurance Coverage by Citizenship Status in Lost Creek
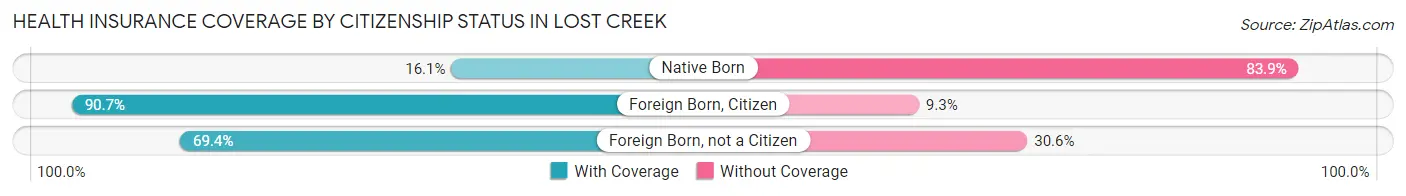
| Citizenship Status | With Coverage | Without Coverage |
| Native Born | 5 (16.1%) | 26 (83.9%) |
| Foreign Born, Citizen | 49 (90.7%) | 5 (9.3%) |
| Foreign Born, not a Citizen | 50 (69.4%) | 22 (30.6%) |
Health Insurance Coverage by Household Income in Lost Creek
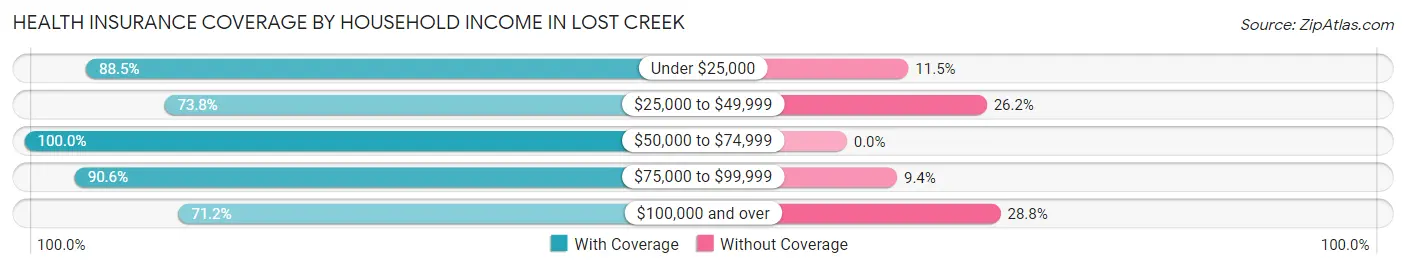
| Household Income | With Coverage | Without Coverage |
| Under $25,000 | 46 (88.5%) | 6 (11.5%) |
| $25,000 to $49,999 | 76 (73.8%) | 27 (26.2%) |
| $50,000 to $74,999 | 21 (100.0%) | 0 (0.0%) |
| $75,000 to $99,999 | 77 (90.6%) | 8 (9.4%) |
| $100,000 and over | 89 (71.2%) | 36 (28.8%) |
Public vs Private Health Insurance Coverage by Age in Lost Creek
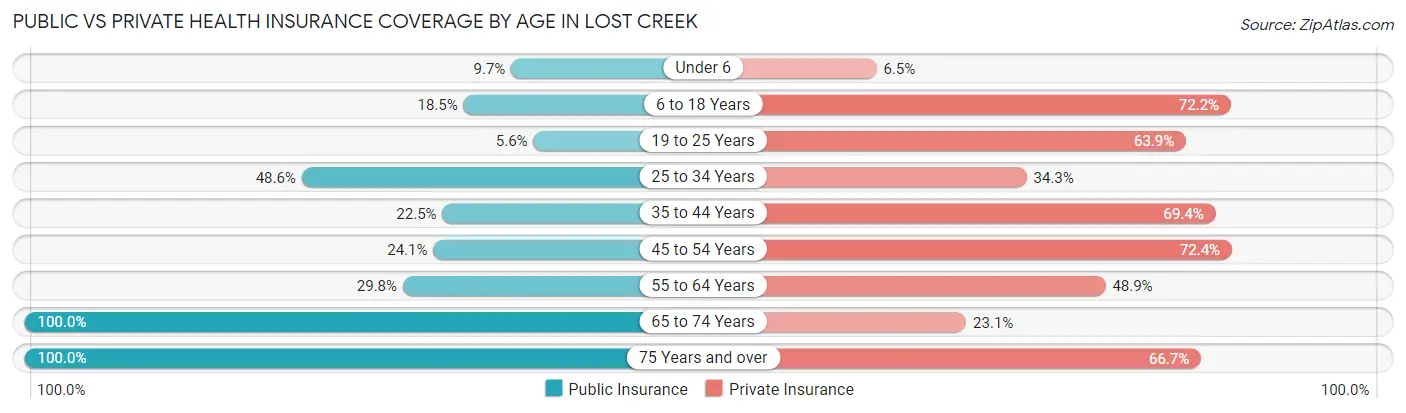
| Age Bracket | Public Insurance | Private Insurance |
| Under 6 | 3 (9.7%) | 2 (6.5%) |
| 6 to 18 Years | 10 (18.5%) | 39 (72.2%) |
| 19 to 25 Years | 4 (5.6%) | 46 (63.9%) |
| 25 to 34 Years | 17 (48.6%) | 12 (34.3%) |
| 35 to 44 Years | 11 (22.5%) | 34 (69.4%) |
| 45 to 54 Years | 14 (24.1%) | 42 (72.4%) |
| 55 to 64 Years | 14 (29.8%) | 23 (48.9%) |
| 65 to 74 Years | 13 (100.0%) | 3 (23.1%) |
| 75 Years and over | 27 (100.0%) | 18 (66.7%) |
| Total | 113 (29.3%) | 219 (56.7%) |
Disability Status by Sex by Age in Lost Creek
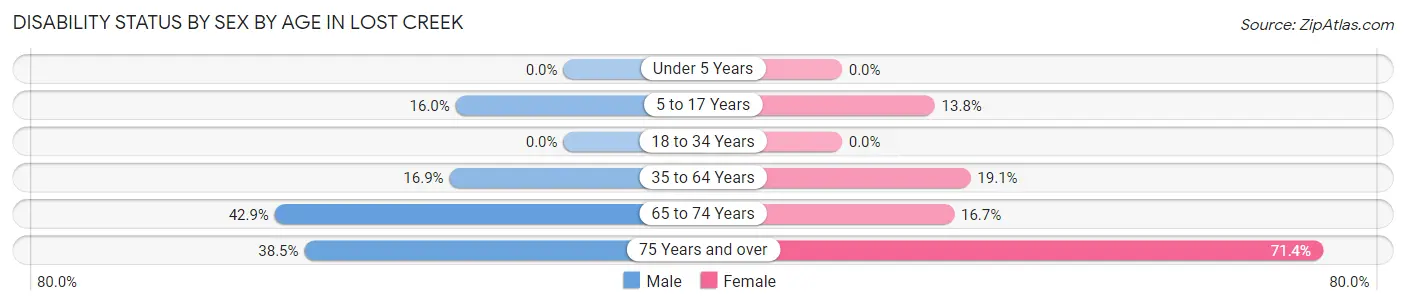
| Age Bracket | Male | Female |
| Under 5 Years | 0 (0.0%) | 0 (0.0%) |
| 5 to 17 Years | 4 (16.0%) | 4 (13.8%) |
| 18 to 34 Years | 0 (0.0%) | 0 (0.0%) |
| 35 to 64 Years | 11 (16.9%) | 17 (19.1%) |
| 65 to 74 Years | 3 (42.9%) | 1 (16.7%) |
| 75 Years and over | 5 (38.5%) | 10 (71.4%) |
Disability Class by Sex by Age in Lost Creek
Disability Class: Hearing Difficulty
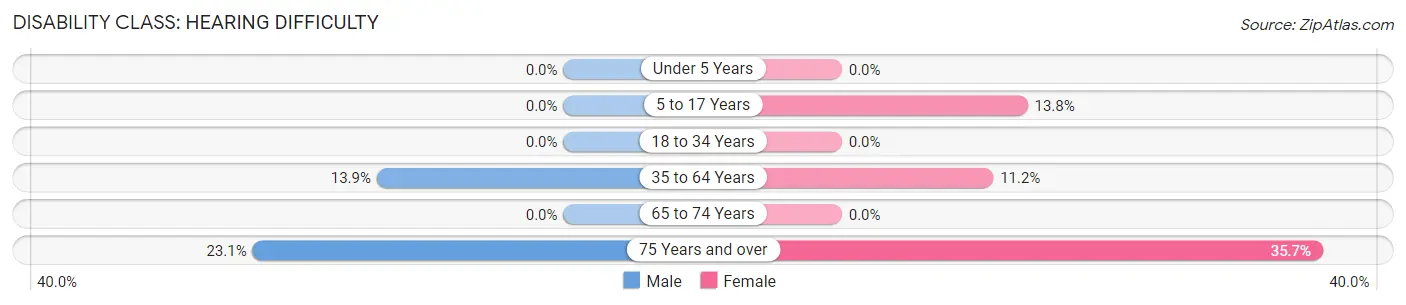
| Age Bracket | Male | Female |
| Under 5 Years | 0 (0.0%) | 0 (0.0%) |
| 5 to 17 Years | 0 (0.0%) | 4 (13.8%) |
| 18 to 34 Years | 0 (0.0%) | 0 (0.0%) |
| 35 to 64 Years | 9 (13.9%) | 10 (11.2%) |
| 65 to 74 Years | 0 (0.0%) | 0 (0.0%) |
| 75 Years and over | 3 (23.1%) | 5 (35.7%) |
Disability Class: Vision Difficulty
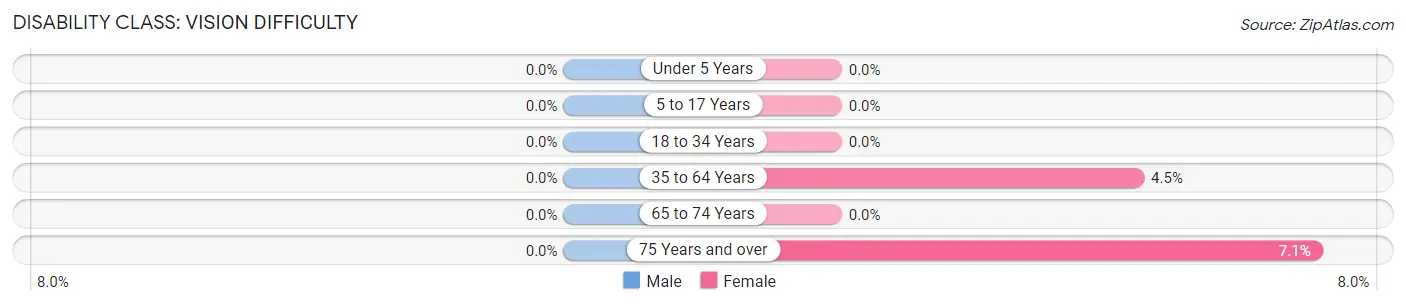
| Age Bracket | Male | Female |
| Under 5 Years | 0 (0.0%) | 0 (0.0%) |
| 5 to 17 Years | 0 (0.0%) | 0 (0.0%) |
| 18 to 34 Years | 0 (0.0%) | 0 (0.0%) |
| 35 to 64 Years | 0 (0.0%) | 4 (4.5%) |
| 65 to 74 Years | 0 (0.0%) | 0 (0.0%) |
| 75 Years and over | 0 (0.0%) | 1 (7.1%) |
Disability Class: Cognitive Difficulty
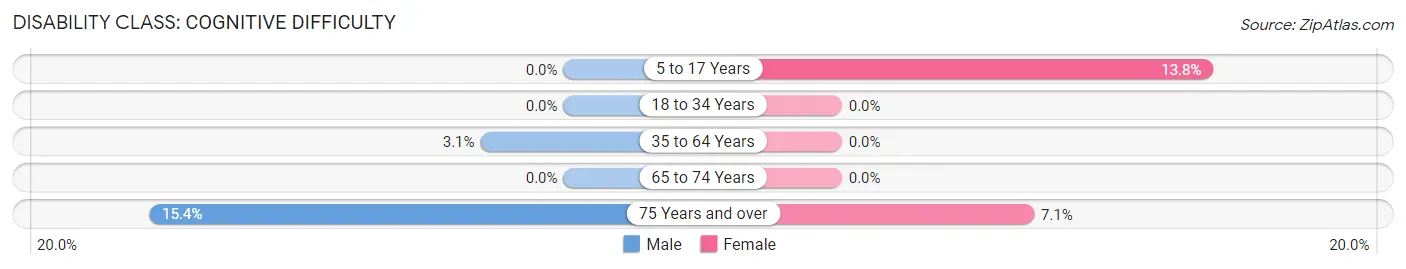
| Age Bracket | Male | Female |
| 5 to 17 Years | 0 (0.0%) | 4 (13.8%) |
| 18 to 34 Years | 0 (0.0%) | 0 (0.0%) |
| 35 to 64 Years | 2 (3.1%) | 0 (0.0%) |
| 65 to 74 Years | 0 (0.0%) | 0 (0.0%) |
| 75 Years and over | 2 (15.4%) | 1 (7.1%) |
Disability Class: Ambulatory Difficulty
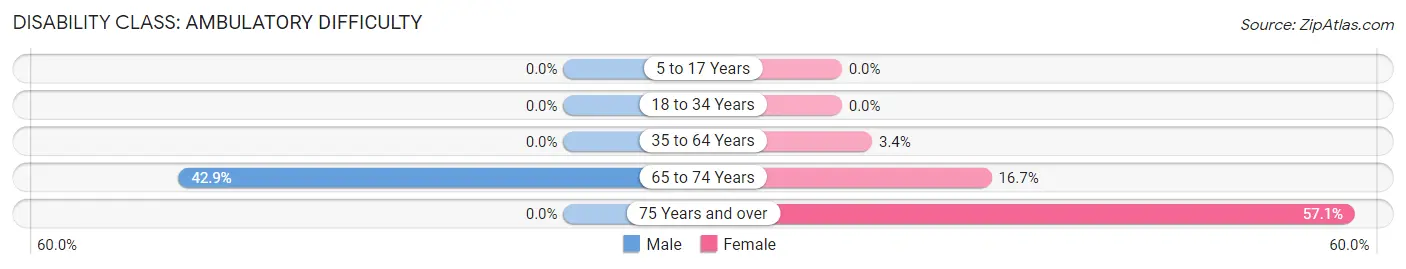
| Age Bracket | Male | Female |
| 5 to 17 Years | 0 (0.0%) | 0 (0.0%) |
| 18 to 34 Years | 0 (0.0%) | 0 (0.0%) |
| 35 to 64 Years | 0 (0.0%) | 3 (3.4%) |
| 65 to 74 Years | 3 (42.9%) | 1 (16.7%) |
| 75 Years and over | 0 (0.0%) | 8 (57.1%) |
Disability Class: Self-Care Difficulty
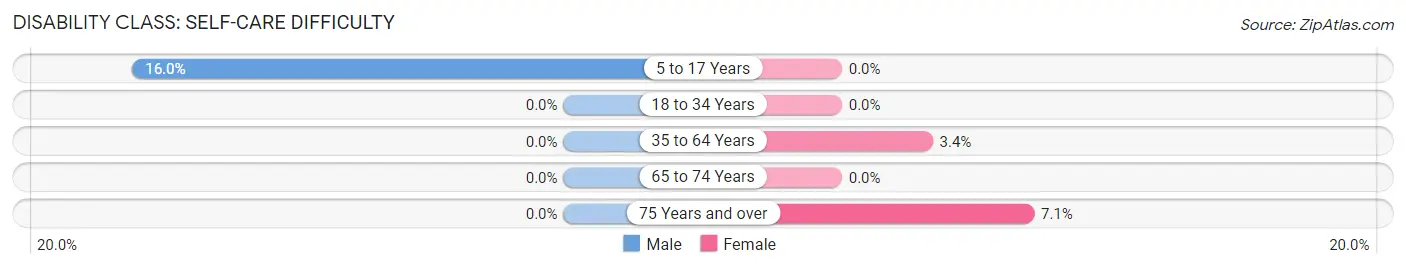
| Age Bracket | Male | Female |
| 5 to 17 Years | 4 (16.0%) | 0 (0.0%) |
| 18 to 34 Years | 0 (0.0%) | 0 (0.0%) |
| 35 to 64 Years | 0 (0.0%) | 3 (3.4%) |
| 65 to 74 Years | 0 (0.0%) | 0 (0.0%) |
| 75 Years and over | 0 (0.0%) | 1 (7.1%) |
Technology Access in Lost Creek
Computing Device Access in Lost Creek
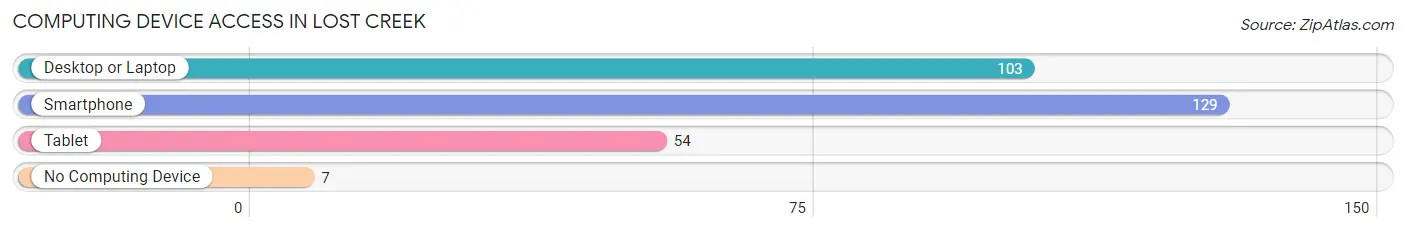
| Device Type | # Households | % Households |
| Desktop or Laptop | 103 | 72.5% |
| Smartphone | 129 | 90.8% |
| Tablet | 54 | 38.0% |
| No Computing Device | 7 | 4.9% |
| Total | 142 | 100.0% |
Internet Access in Lost Creek
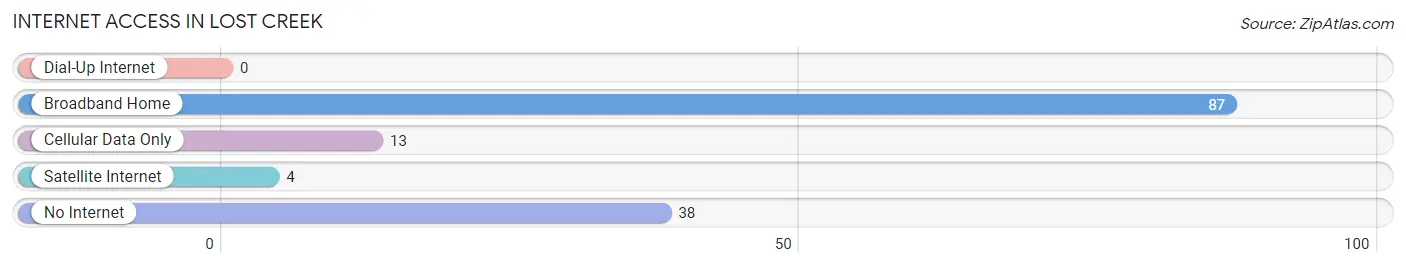
| Internet Type | # Households | % Households |
| Dial-Up Internet | 0 | 0.0% |
| Broadband Home | 87 | 61.3% |
| Cellular Data Only | 13 | 9.1% |
| Satellite Internet | 4 | 2.8% |
| No Internet | 38 | 26.8% |
| Total | 142 | 100.0% |
Lost Creek Summary
History
Lost Creek is a small unincorporated community located in Harrison County, West Virginia. It is situated along the West Fork River, approximately five miles south of Clarksburg. The town was founded in the late 1800s and was originally known as “Lost Creek Station” due to its location on the Baltimore and Ohio Railroad. The town was officially incorporated in 1891 and was named after the nearby creek.
The town was originally a small farming community, but it quickly grew into a bustling industrial center. The town was home to several coal mines, a brickyard, a sawmill, and a gristmill. The town also had a post office, a general store, and a hotel.
In the early 1900s, the town experienced a period of growth and prosperity. The population grew to over 500 people and the town had several businesses, including a bank, a movie theater, and a newspaper.
The town experienced a decline in the mid-1900s as the coal industry declined and the population began to move away. By the 1970s, the population had dropped to less than 200 people.
Geography
Lost Creek is located in Harrison County, West Virginia. It is situated along the West Fork River, approximately five miles south of Clarksburg. The town is located in the Appalachian Mountains and is surrounded by rolling hills and forests.
The climate in Lost Creek is humid and temperate. The average temperature in the summer is around 75 degrees Fahrenheit and the average temperature in the winter is around 40 degrees Fahrenheit.
The town is located near several state parks, including Coopers Rock State Forest and Blackwater Falls State Park.
Economy
The economy of Lost Creek is largely based on agriculture and tourism. The town is home to several farms, which produce a variety of crops, including corn, soybeans, and hay.
The town is also home to several tourist attractions, including the Lost Creek Country Store and the Lost Creek Museum. The town also hosts several festivals throughout the year, including the Lost Creek Apple Festival and the Lost Creek Bluegrass Festival.
Demographics
As of the 2010 census, the population of Lost Creek was 545 people. The racial makeup of the town was 97.3% White, 0.7% African American, 0.2% Native American, 0.2% Asian, and 1.6% from other races.
The median household income in Lost Creek was $35,625 and the median family income was $41,250. The per capita income was $17,845. About 11.3% of the population was below the poverty line.
Common Questions
What is Per Capita Income in Lost Creek?
Per Capita income in Lost Creek is $28,456.
What is the Median Family Income in Lost Creek?
Median Family Income in Lost Creek is $93,194.
What is the Median Household income in Lost Creek?
Median Household Income in Lost Creek is $55,556.
What is Income or Wage Gap in Lost Creek?
Income or Wage Gap in Lost Creek is 44.3%.
Women in Lost Creek earn 55.7 cents for every dollar earned by a man.
What is Inequality or Gini Index in Lost Creek?
Inequality or Gini Index in Lost Creek is 0.43.
What is the Total Population of Lost Creek?
Total Population of Lost Creek is 386.
What is the Total Male Population of Lost Creek?
Total Male Population of Lost Creek is 151.
What is the Total Female Population of Lost Creek?
Total Female Population of Lost Creek is 235.
What is the Ratio of Males per 100 Females in Lost Creek?
There are 64.26 Males per 100 Females in Lost Creek.
What is the Ratio of Females per 100 Males in Lost Creek?
There are 155.63 Females per 100 Males in Lost Creek.
What is the Median Population Age in Lost Creek?
Median Population Age in Lost Creek is 39.1 Years.
What is the Average Family Size in Lost Creek
Average Family Size in Lost Creek is 3.1 People.
What is the Average Household Size in Lost Creek
Average Household Size in Lost Creek is 2.7 People.
How Large is the Labor Force in Lost Creek?
There are 209 People in the Labor Forcein in Lost Creek.
What is the Percentage of People in the Labor Force in Lost Creek?
68.3% of People are in the Labor Force in Lost Creek.
What is the Unemployment Rate in Lost Creek?
Unemployment Rate in Lost Creek is 8.6%.