Rupert, WV Map & Demographics
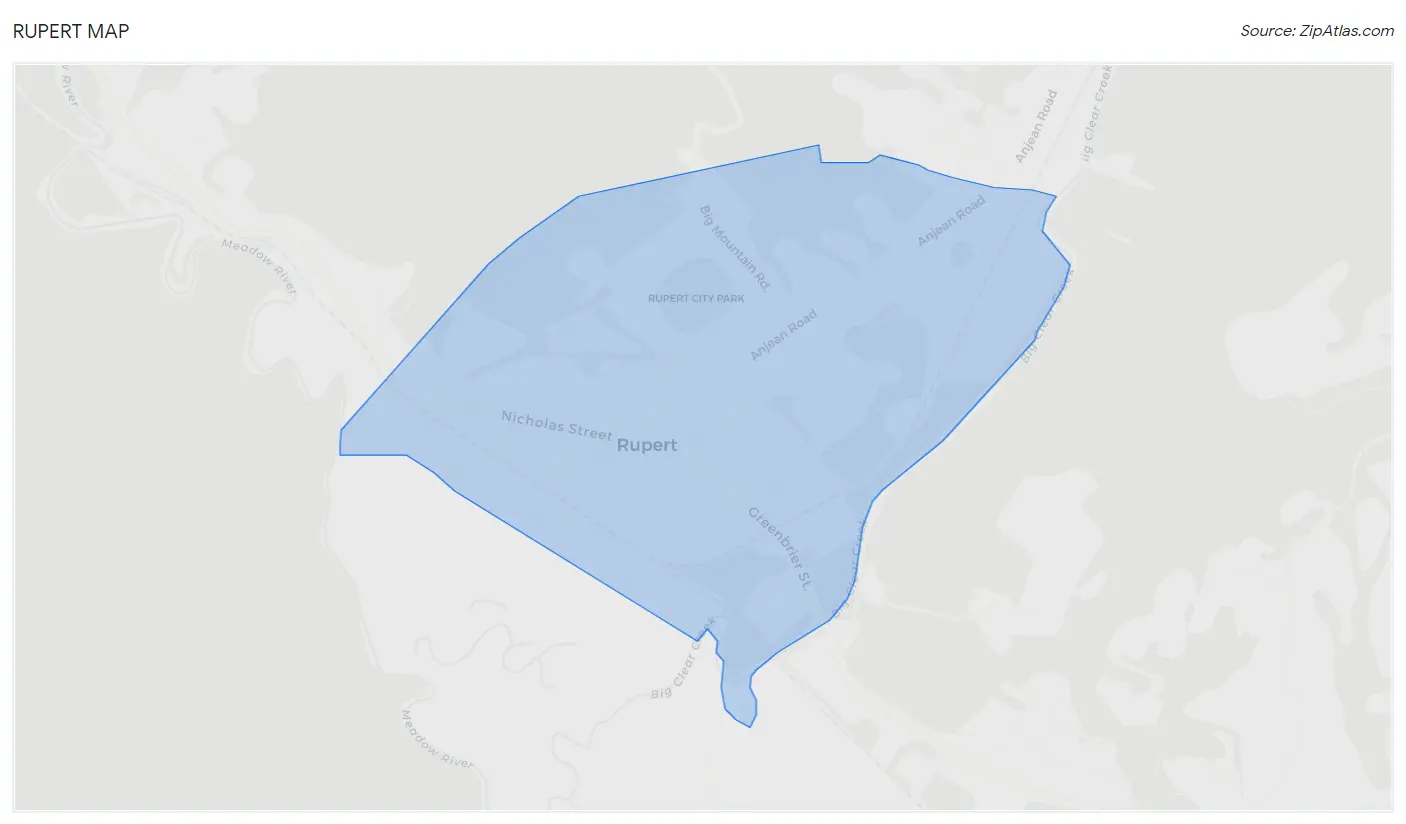
Rupert Map
Rupert Overview
$15,904
PER CAPITA INCOME
$25,676
AVG FAMILY INCOME
$27,244
AVG HOUSEHOLD INCOME
0.9%
WAGE / INCOME GAP [ % ]
99.1¢/ $1
WAGE / INCOME GAP [ $ ]
0.45
INEQUALITY / GINI INDEX
1,093
TOTAL POPULATION
521
MALE POPULATION
572
FEMALE POPULATION
91.08
MALES / 100 FEMALES
109.79
FEMALES / 100 MALES
34.6
MEDIAN AGE
2.9
AVG FAMILY SIZE
2.6
AVG HOUSEHOLD SIZE
451
LABOR FORCE [ PEOPLE ]
55.9%
PERCENT IN LABOR FORCE
2.4%
UNEMPLOYMENT RATE
Rupert Zip Codes
Income in Rupert
Income Overview in Rupert
Per Capita Income in Rupert is $15,904, while median incomes of families and households are $25,676 and $27,244 respectively.
| Characteristic | Number | Measure |
| Per Capita Income | 1,093 | $15,904 |
| Median Family Income | 266 | $25,676 |
| Mean Family Income | 266 | $39,379 |
| Median Household Income | 411 | $27,244 |
| Mean Household Income | 411 | $41,332 |
| Income Deficit | 266 | $0 |
| Wage / Income Gap (%) | 1,093 | 0.93% |
| Wage / Income Gap ($) | 1,093 | 99.07¢ per $1 |
| Gini / Inequality Index | 1,093 | 0.45 |
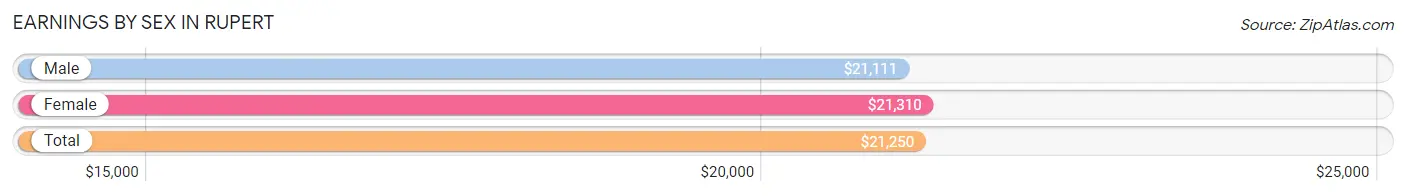
Earnings by Sex in Rupert
Average Earnings in Rupert are $21,250, $21,111 for men and $21,310 for women, a difference of 0.9%.
| Sex | Number | Average Earnings |
| Male | 248 (50.6%) | $21,111 |
| Female | 242 (49.4%) | $21,310 |
| Total | 490 (100.0%) | $21,250 |
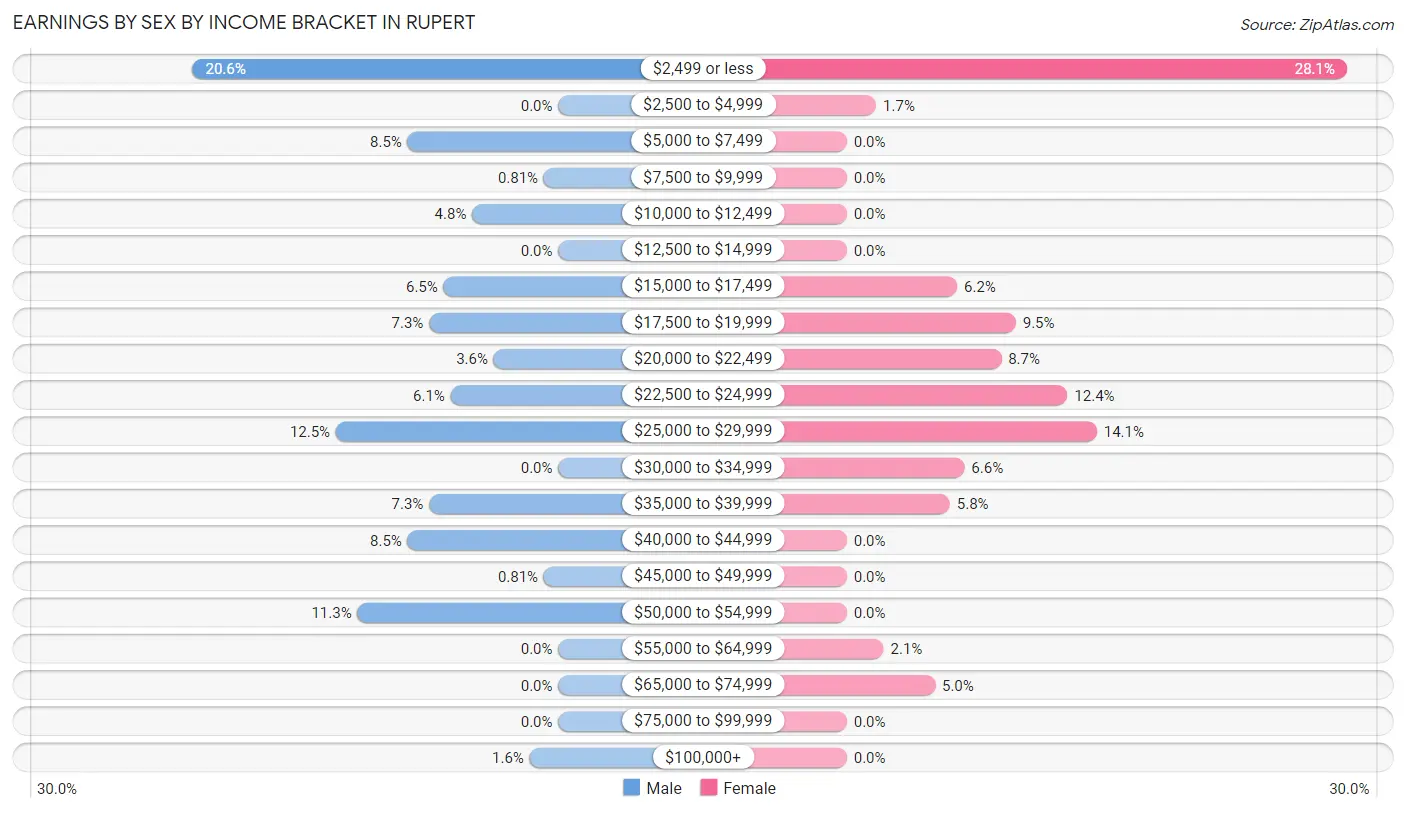
Earnings by Sex by Income Bracket in Rupert
The most common earnings brackets in Rupert are $2,499 or less for men (51 | 20.6%) and $2,499 or less for women (68 | 28.1%).
| Income | Male | Female |
| $2,499 or less | 51 (20.6%) | 68 (28.1%) |
| $2,500 to $4,999 | 0 (0.0%) | 4 (1.7%) |
| $5,000 to $7,499 | 21 (8.5%) | 0 (0.0%) |
| $7,500 to $9,999 | 2 (0.8%) | 0 (0.0%) |
| $10,000 to $12,499 | 12 (4.8%) | 0 (0.0%) |
| $12,500 to $14,999 | 0 (0.0%) | 0 (0.0%) |
| $15,000 to $17,499 | 16 (6.5%) | 15 (6.2%) |
| $17,500 to $19,999 | 18 (7.3%) | 23 (9.5%) |
| $20,000 to $22,499 | 9 (3.6%) | 21 (8.7%) |
| $22,500 to $24,999 | 15 (6.0%) | 30 (12.4%) |
| $25,000 to $29,999 | 31 (12.5%) | 34 (14.1%) |
| $30,000 to $34,999 | 0 (0.0%) | 16 (6.6%) |
| $35,000 to $39,999 | 18 (7.3%) | 14 (5.8%) |
| $40,000 to $44,999 | 21 (8.5%) | 0 (0.0%) |
| $45,000 to $49,999 | 2 (0.8%) | 0 (0.0%) |
| $50,000 to $54,999 | 28 (11.3%) | 0 (0.0%) |
| $55,000 to $64,999 | 0 (0.0%) | 5 (2.1%) |
| $65,000 to $74,999 | 0 (0.0%) | 12 (5.0%) |
| $75,000 to $99,999 | 0 (0.0%) | 0 (0.0%) |
| $100,000+ | 4 (1.6%) | 0 (0.0%) |
| Total | 248 (100.0%) | 242 (100.0%) |
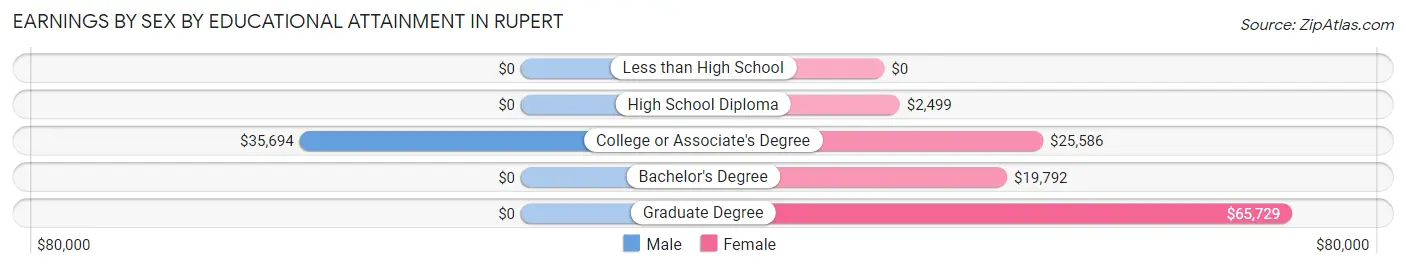
Earnings by Sex by Educational Attainment in Rupert
Average earnings in Rupert are $23,833 for men and $21,905 for women, a difference of 8.1%. Men with an educational attainment of college or associate's degree enjoy the highest average annual earnings of $35,694, while those with college or associate's degree education earn the least with $35,694. Women with an educational attainment of graduate degree earn the most with the average annual earnings of $65,729, while those with high school diploma education have the smallest earnings of $2,499.
| Educational Attainment | Male Income | Female Income |
| Less than High School | - | - |
| High School Diploma | - | - |
| College or Associate's Degree | $35,694 | $25,586 |
| Bachelor's Degree | - | - |
| Graduate Degree | - | - |
| Total | $23,833 | $21,905 |
Family Income in Rupert
Family Income Brackets in Rupert
According to the Rupert family income data, there are 63 families falling into the $15,000 to $24,999 income range, which is the most common income bracket and makes up 23.7% of all families.
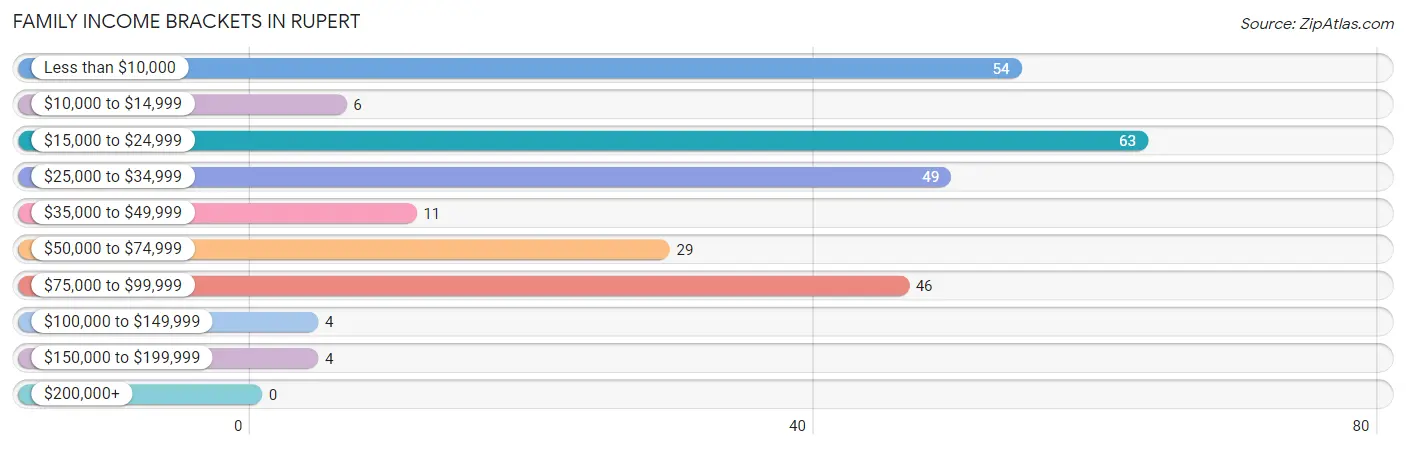
| Income Bracket | # Families | % Families |
| Less than $10,000 | 54 | 20.3% |
| $10,000 to $14,999 | 6 | 2.3% |
| $15,000 to $24,999 | 63 | 23.7% |
| $25,000 to $34,999 | 49 | 18.4% |
| $35,000 to $49,999 | 11 | 4.1% |
| $50,000 to $74,999 | 29 | 10.9% |
| $75,000 to $99,999 | 46 | 17.3% |
| $100,000 to $149,999 | 4 | 1.5% |
| $150,000 to $199,999 | 4 | 1.5% |
| $200,000+ | 0 | 0.0% |
Family Income by Famaliy Size in Rupert
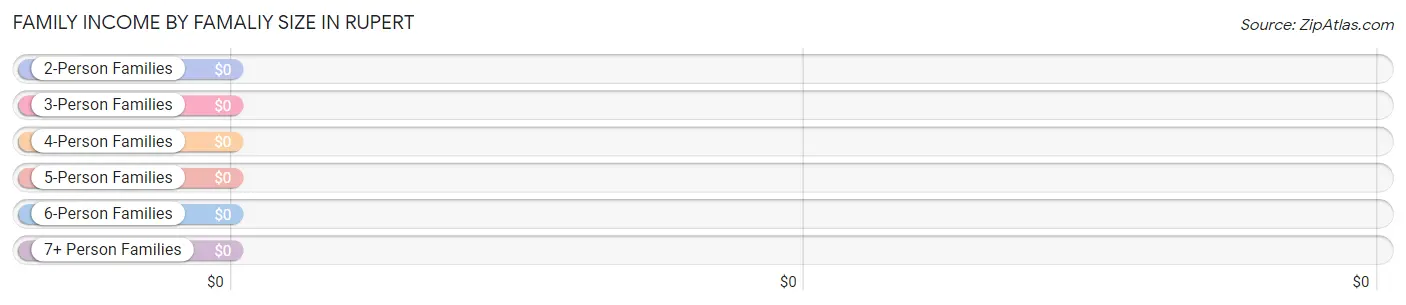
| Income Bracket | # Families | Median Income |
| 2-Person Families | 140 (52.6%) | $0 |
| 3-Person Families | 54 (20.3%) | $0 |
| 4-Person Families | 57 (21.4%) | $0 |
| 5-Person Families | 15 (5.6%) | $0 |
| 6-Person Families | 0 (0.0%) | $0 |
| 7+ Person Families | 0 (0.0%) | $0 |
| Total | 266 (100.0%) | $25,676 |
Family Income by Number of Earners in Rupert
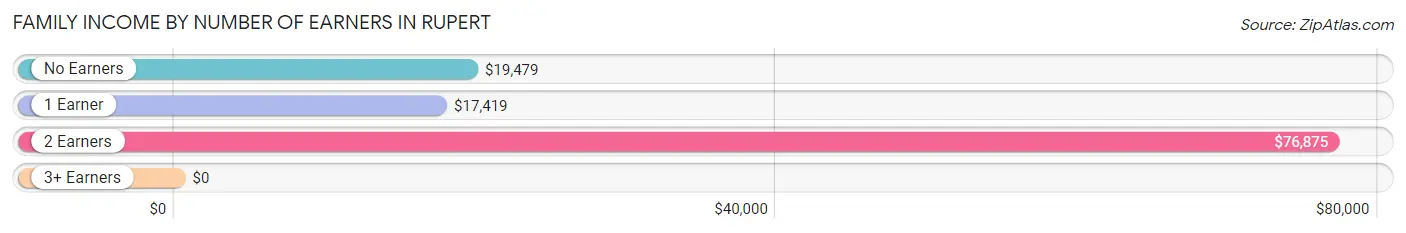
| Number of Earners | # Families | Median Income |
| No Earners | 31 (11.7%) | $19,479 |
| 1 Earner | 168 (63.2%) | $17,419 |
| 2 Earners | 64 (24.1%) | $76,875 |
| 3+ Earners | 3 (1.1%) | $0 |
| Total | 266 (100.0%) | $25,676 |
Household Income in Rupert
Household Income Brackets in Rupert
With 88 households falling in the category, the $15,000 to $24,999 income range is the most frequent in Rupert, accounting for 21.4% of all households.
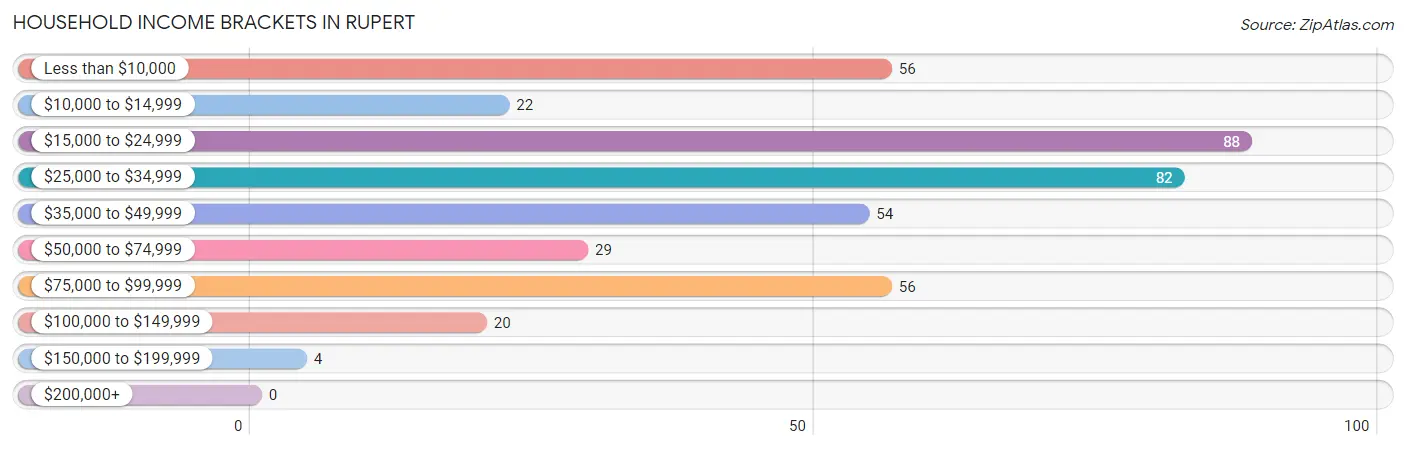
| Income Bracket | # Households | % Households |
| Less than $10,000 | 56 | 13.6% |
| $10,000 to $14,999 | 22 | 5.4% |
| $15,000 to $24,999 | 88 | 21.4% |
| $25,000 to $34,999 | 82 | 20.0% |
| $35,000 to $49,999 | 54 | 13.1% |
| $50,000 to $74,999 | 29 | 7.1% |
| $75,000 to $99,999 | 56 | 13.6% |
| $100,000 to $149,999 | 20 | 4.9% |
| $150,000 to $199,999 | 4 | 1.0% |
| $200,000+ | 0 | 0.0% |
Household Income by Householder Age in Rupert
The median household income in Rupert is $27,244, with the highest median household income of $38,500 found in the 45 to 64 years age bracket for the primary householder. A total of 134 households (32.6%) fall into this category.
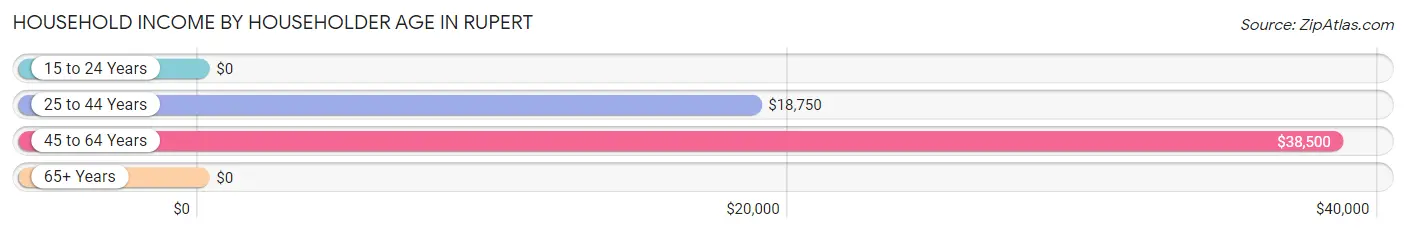
| Income Bracket | # Households | Median Income |
| 15 to 24 Years | 0 (0.0%) | $0 |
| 25 to 44 Years | 152 (37.0%) | $18,750 |
| 45 to 64 Years | 134 (32.6%) | $38,500 |
| 65+ Years | 125 (30.4%) | $0 |
| Total | 411 (100.0%) | $27,244 |
Poverty in Rupert
Income Below Poverty by Sex and Age in Rupert
With 31.9% poverty level for males and 53.7% for females among the residents of Rupert, under 5 year old males and 6 to 11 year old females are the most vulnerable to poverty, with 35 males (100.0%) and 170 females (97.7%) in their respective age groups living below the poverty level.
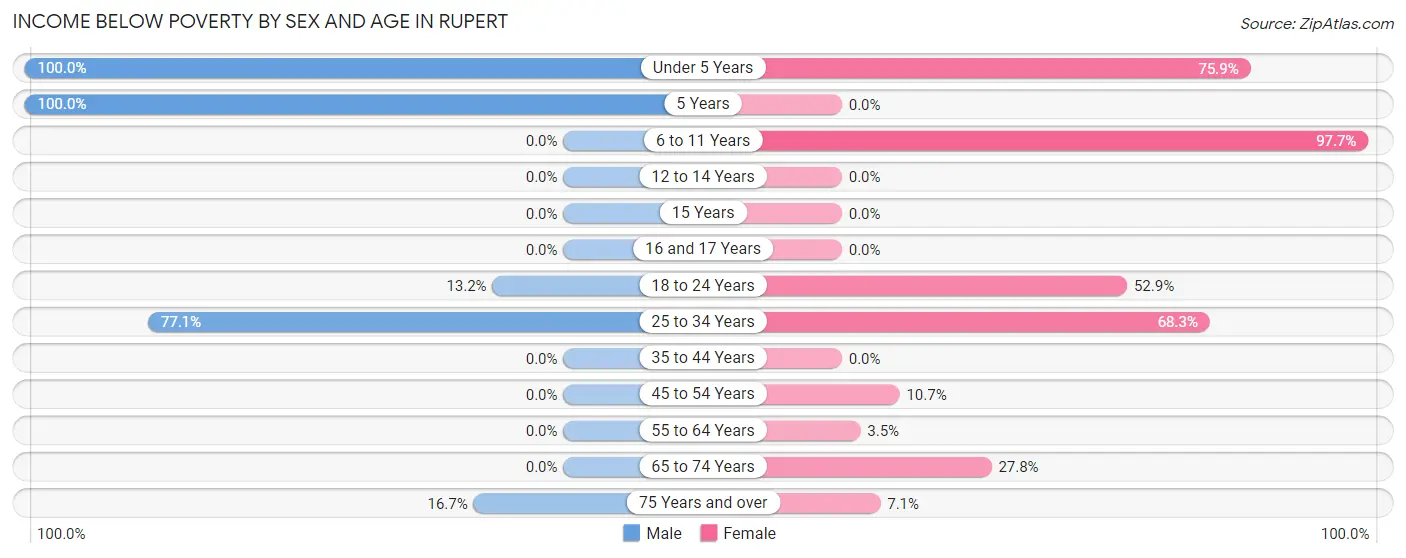
| Age Bracket | Male | Female |
| Under 5 Years | 35 (100.0%) | 22 (75.9%) |
| 5 Years | 22 (100.0%) | 0 (0.0%) |
| 6 to 11 Years | 0 (0.0%) | 170 (97.7%) |
| 12 to 14 Years | 0 (0.0%) | 0 (0.0%) |
| 15 Years | 0 (0.0%) | 0 (0.0%) |
| 16 and 17 Years | 0 (0.0%) | 0 (0.0%) |
| 18 to 24 Years | 5 (13.2%) | 9 (52.9%) |
| 25 to 34 Years | 91 (77.1%) | 84 (68.3%) |
| 35 to 44 Years | 0 (0.0%) | 0 (0.0%) |
| 45 to 54 Years | 0 (0.0%) | 6 (10.7%) |
| 55 to 64 Years | 0 (0.0%) | 3 (3.5%) |
| 65 to 74 Years | 0 (0.0%) | 10 (27.8%) |
| 75 Years and over | 6 (16.7%) | 2 (7.1%) |
| Total | 159 (31.9%) | 306 (53.7%) |
Income Above Poverty by Sex and Age in Rupert
According to the poverty statistics in Rupert, males aged 35 to 44 years and females aged 12 to 14 years are the age groups that are most secure financially, with 100.0% of males and 100.0% of females in these age groups living above the poverty line.
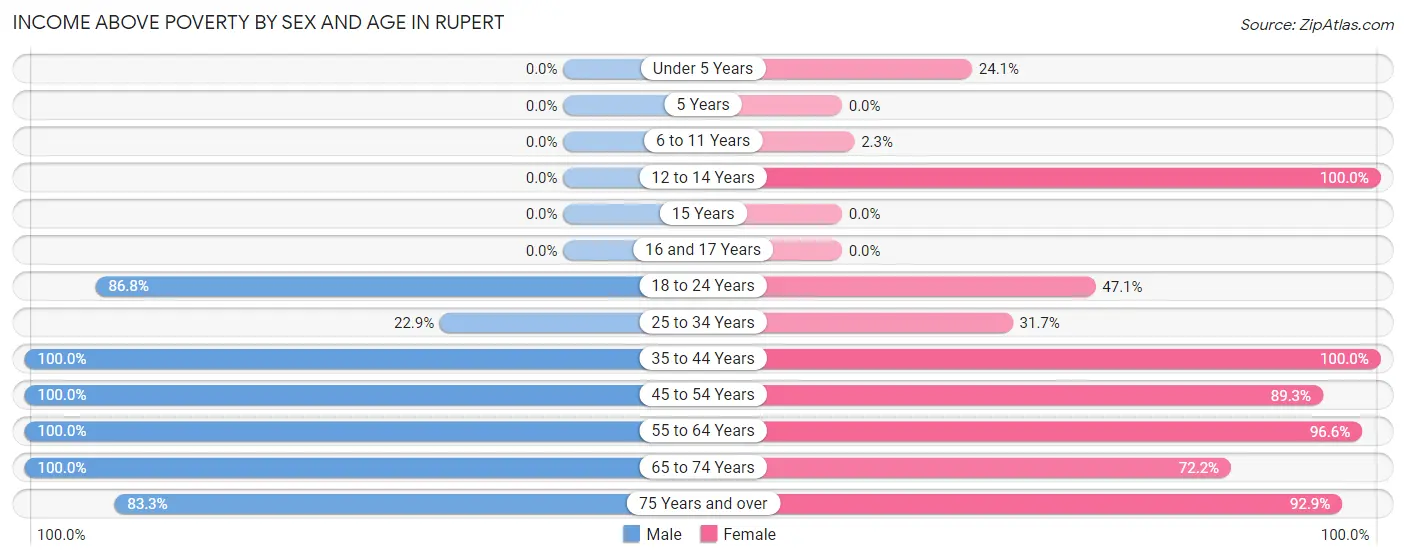
| Age Bracket | Male | Female |
| Under 5 Years | 0 (0.0%) | 7 (24.1%) |
| 5 Years | 0 (0.0%) | 0 (0.0%) |
| 6 to 11 Years | 0 (0.0%) | 4 (2.3%) |
| 12 to 14 Years | 0 (0.0%) | 3 (100.0%) |
| 15 Years | 0 (0.0%) | 0 (0.0%) |
| 16 and 17 Years | 0 (0.0%) | 0 (0.0%) |
| 18 to 24 Years | 33 (86.8%) | 8 (47.1%) |
| 25 to 34 Years | 27 (22.9%) | 39 (31.7%) |
| 35 to 44 Years | 52 (100.0%) | 17 (100.0%) |
| 45 to 54 Years | 60 (100.0%) | 50 (89.3%) |
| 55 to 64 Years | 92 (100.0%) | 84 (96.6%) |
| 65 to 74 Years | 45 (100.0%) | 26 (72.2%) |
| 75 Years and over | 30 (83.3%) | 26 (92.9%) |
| Total | 339 (68.1%) | 264 (46.3%) |
Income Below Poverty Among Married-Couple Families in Rupert
The poverty statistics for married-couple families in Rupert show that 15.0% or 22 of the total 147 families live below the poverty line. Families with 1 or 2 children have the highest poverty rate of 78.6%, comprising of 22 families. On the other hand, families with no children have the lowest poverty rate of 0.0%, which includes 0 families.
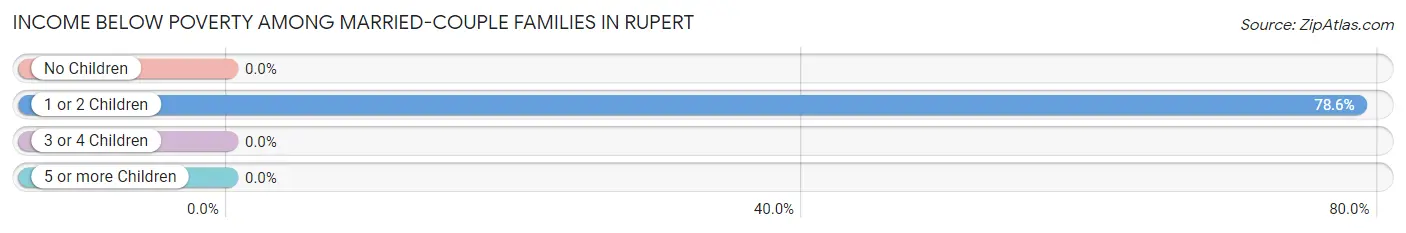
| Children | Above Poverty | Below Poverty |
| No Children | 119 (100.0%) | 0 (0.0%) |
| 1 or 2 Children | 6 (21.4%) | 22 (78.6%) |
| 3 or 4 Children | 0 (0.0%) | 0 (0.0%) |
| 5 or more Children | 0 (0.0%) | 0 (0.0%) |
| Total | 125 (85.0%) | 22 (15.0%) |
Income Below Poverty Among Single-Parent Households in Rupert
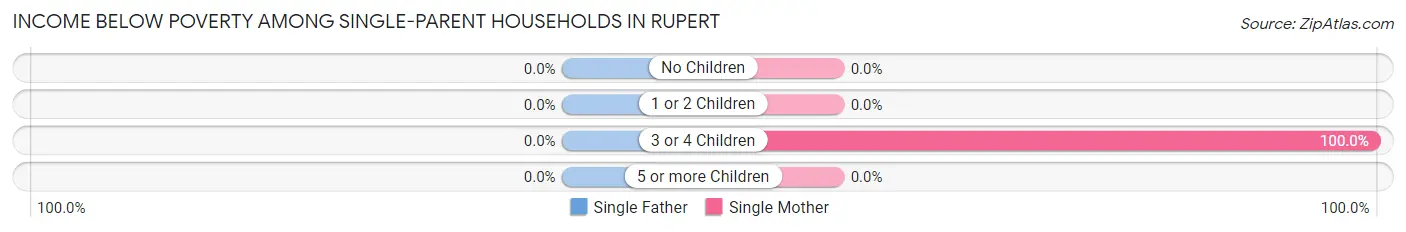
| Children | Single Father | Single Mother |
| No Children | 0 (0.0%) | 0 (0.0%) |
| 1 or 2 Children | 0 (0.0%) | 0 (0.0%) |
| 3 or 4 Children | 0 (0.0%) | 69 (100.0%) |
| 5 or more Children | 0 (0.0%) | 0 (0.0%) |
| Total | 0 (0.0%) | 69 (63.9%) |
Income Below Poverty Among Married-Couple vs Single-Parent Households in Rupert
The poverty data for Rupert shows that 22 of the married-couple family households (15.0%) and 69 of the single-parent households (58.0%) are living below the poverty level. Within the married-couple family households, those with 1 or 2 children have the highest poverty rate, with 22 households (78.6%) falling below the poverty line. Among the single-parent households, those with 3 or 4 children have the highest poverty rate, with 69 household (100.0%) living below poverty.
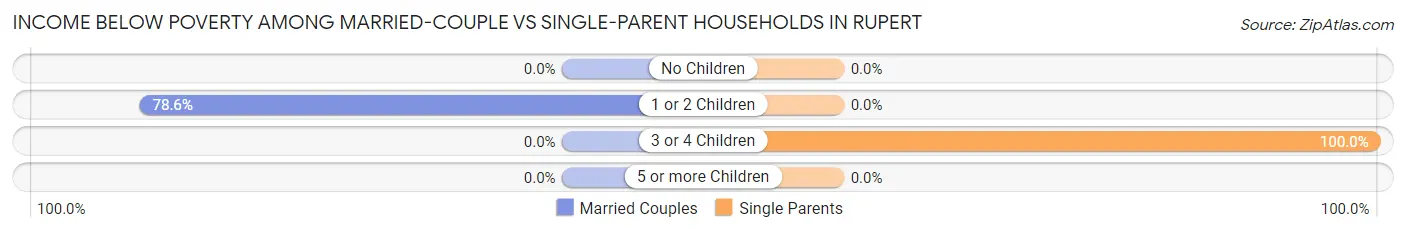
| Children | Married-Couple Families | Single-Parent Households |
| No Children | 0 (0.0%) | 0 (0.0%) |
| 1 or 2 Children | 22 (78.6%) | 0 (0.0%) |
| 3 or 4 Children | 0 (0.0%) | 69 (100.0%) |
| 5 or more Children | 0 (0.0%) | 0 (0.0%) |
| Total | 22 (15.0%) | 69 (58.0%) |
Race in Rupert
The most populous races in Rupert are White / Caucasian (997 | 91.2%), Hispanic or Latino (95 | 8.7%), and Two or more Races (52 | 4.8%).
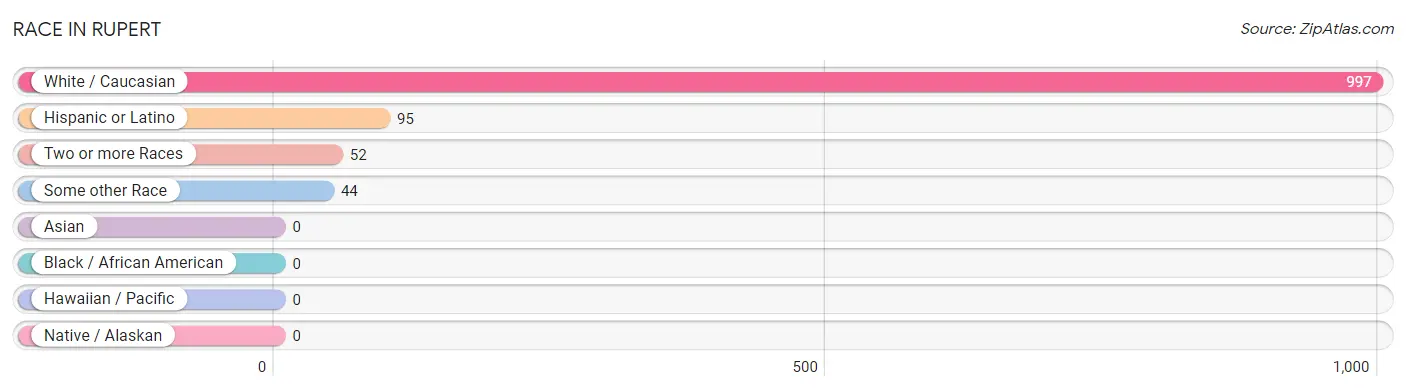
| Race | # Population | % Population |
| Asian | 0 | 0.0% |
| Black / African American | 0 | 0.0% |
| Hawaiian / Pacific | 0 | 0.0% |
| Hispanic or Latino | 95 | 8.7% |
| Native / Alaskan | 0 | 0.0% |
| White / Caucasian | 997 | 91.2% |
| Two or more Races | 52 | 4.8% |
| Some other Race | 44 | 4.0% |
| Total | 1,093 | 100.0% |
Ancestry in Rupert
The most populous ancestries reported in Rupert are American (540 | 49.4%), Irish (123 | 11.3%), Puerto Rican (41 | 3.7%), Dominican (39 | 3.6%), and German (38 | 3.5%), together accounting for 71.5% of all Rupert residents.
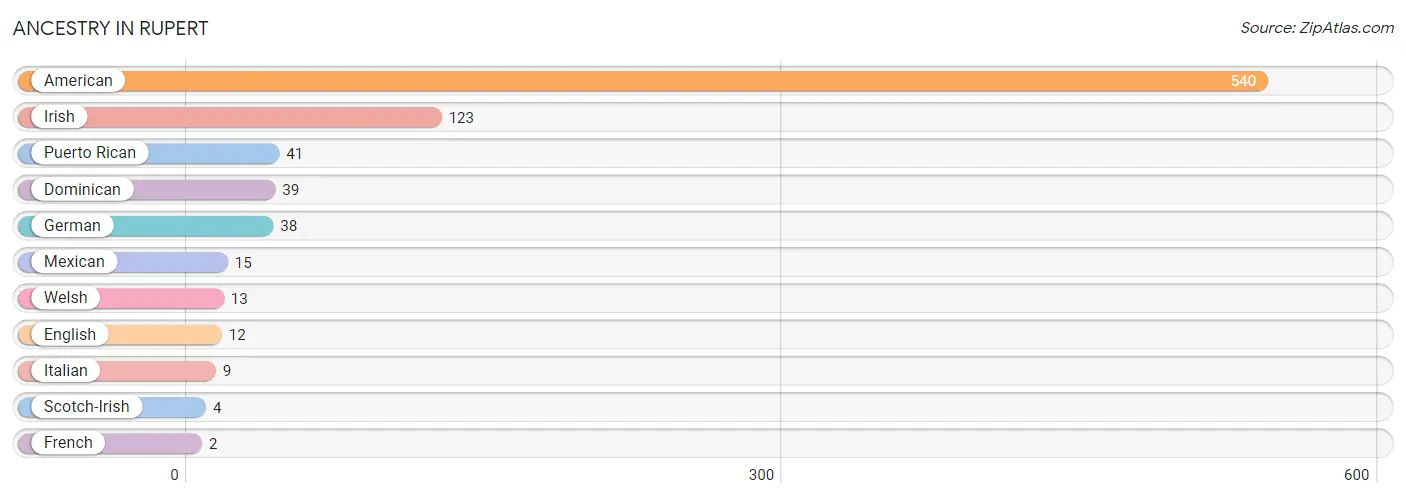
| Ancestry | # Population | % Population |
| American | 540 | 49.4% |
| Dominican | 39 | 3.6% |
| English | 12 | 1.1% |
| French | 2 | 0.2% |
| German | 38 | 3.5% |
| Irish | 123 | 11.3% |
| Italian | 9 | 0.8% |
| Mexican | 15 | 1.4% |
| Puerto Rican | 41 | 3.7% |
| Scotch-Irish | 4 | 0.4% |
| Welsh | 13 | 1.2% | View All 11 Rows |
Immigrants in Rupert
The most numerous immigrant groups reported in Rupert came from Latin America (33 | 3.0%), Caribbean (18 | 1.7%), Dominican Republic (18 | 1.7%), Central America (15 | 1.4%), and Mexico (15 | 1.4%), together accounting for 9.1% of all Rupert residents.
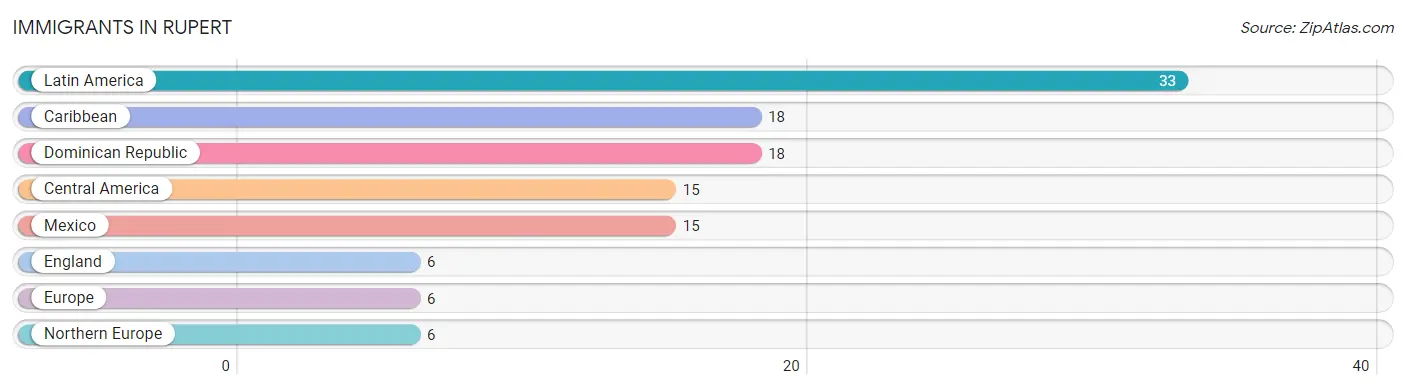
| Immigration Origin | # Population | % Population |
| Caribbean | 18 | 1.7% |
| Central America | 15 | 1.4% |
| Dominican Republic | 18 | 1.7% |
| England | 6 | 0.5% |
| Europe | 6 | 0.5% |
| Latin America | 33 | 3.0% |
| Mexico | 15 | 1.4% |
| Northern Europe | 6 | 0.5% | View All 8 Rows |
Sex and Age in Rupert
Sex and Age in Rupert
The most populous age groups in Rupert are 30 to 34 Years (99 | 19.0%) for men and 5 to 9 Years (128 | 22.4%) for women.
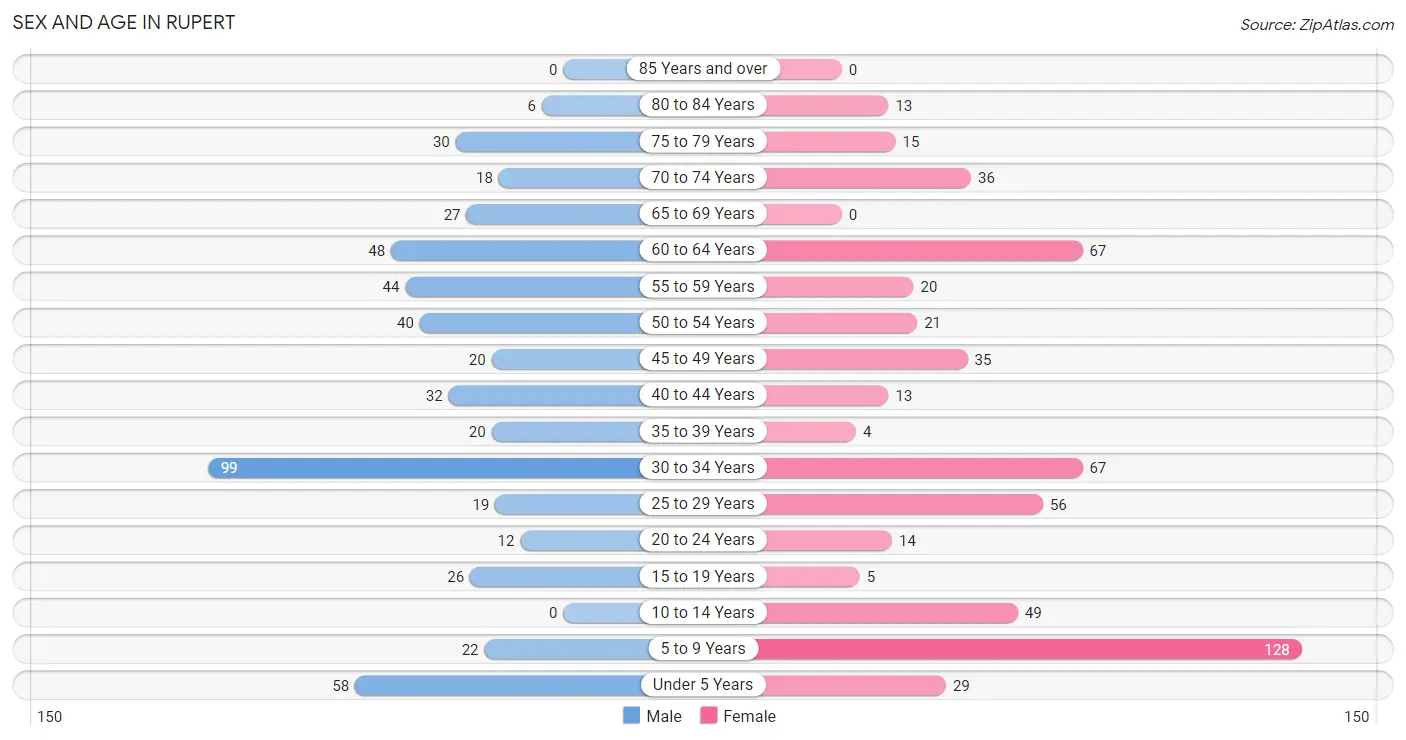
| Age Bracket | Male | Female |
| Under 5 Years | 58 (11.1%) | 29 (5.1%) |
| 5 to 9 Years | 22 (4.2%) | 128 (22.4%) |
| 10 to 14 Years | 0 (0.0%) | 49 (8.6%) |
| 15 to 19 Years | 26 (5.0%) | 5 (0.9%) |
| 20 to 24 Years | 12 (2.3%) | 14 (2.5%) |
| 25 to 29 Years | 19 (3.6%) | 56 (9.8%) |
| 30 to 34 Years | 99 (19.0%) | 67 (11.7%) |
| 35 to 39 Years | 20 (3.8%) | 4 (0.7%) |
| 40 to 44 Years | 32 (6.1%) | 13 (2.3%) |
| 45 to 49 Years | 20 (3.8%) | 35 (6.1%) |
| 50 to 54 Years | 40 (7.7%) | 21 (3.7%) |
| 55 to 59 Years | 44 (8.5%) | 20 (3.5%) |
| 60 to 64 Years | 48 (9.2%) | 67 (11.7%) |
| 65 to 69 Years | 27 (5.2%) | 0 (0.0%) |
| 70 to 74 Years | 18 (3.5%) | 36 (6.3%) |
| 75 to 79 Years | 30 (5.8%) | 15 (2.6%) |
| 80 to 84 Years | 6 (1.1%) | 13 (2.3%) |
| 85 Years and over | 0 (0.0%) | 0 (0.0%) |
| Total | 521 (100.0%) | 572 (100.0%) |
Families and Households in Rupert
Median Family Size in Rupert
The median family size in Rupert is 2.88 persons per family, with single female/mother families (108 | 40.6%) accounting for the largest median family size of 3.56 persons per family. On the other hand, single male/father families (11 | 4.1%) represent the smallest median family size with 2.09 persons per family.
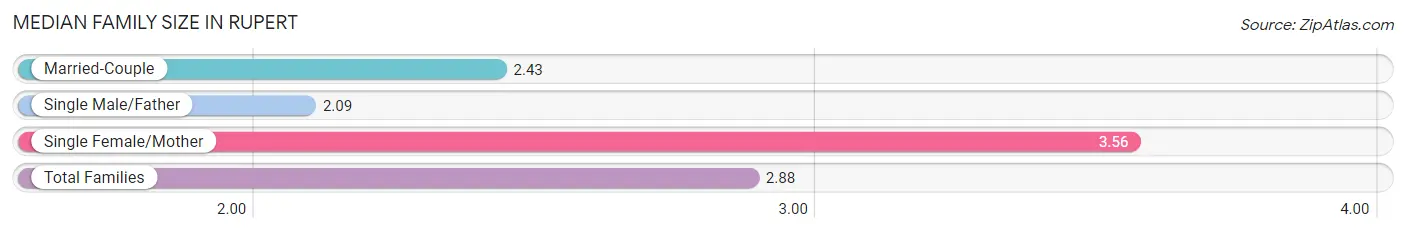
| Family Type | # Families | Family Size |
| Married-Couple | 147 (55.3%) | 2.43 |
| Single Male/Father | 11 (4.1%) | 2.09 |
| Single Female/Mother | 108 (40.6%) | 3.56 |
| Total Families | 266 (100.0%) | 2.88 |
Median Household Size in Rupert
The median household size in Rupert is 2.64 persons per household, with single female/mother households (108 | 26.3%) accounting for the largest median household size of 4.1 persons per household. non-family households (145 | 35.3%) represent the smallest median household size with 1.74 persons per household.
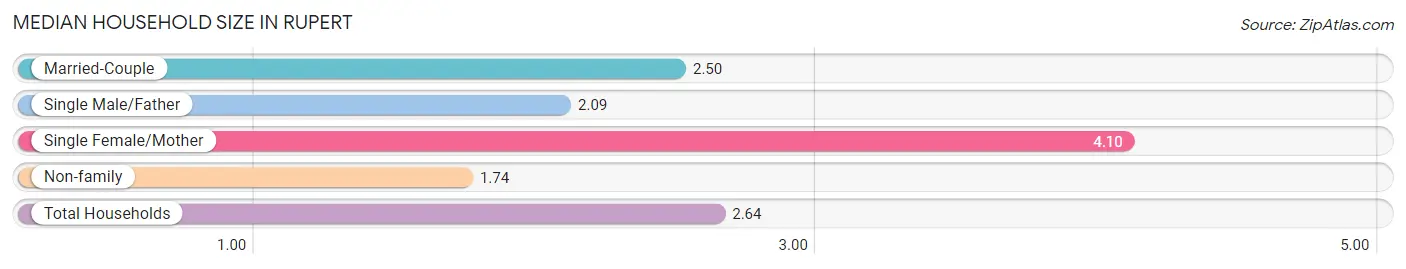
| Household Type | # Households | Household Size |
| Married-Couple | 147 (35.8%) | 2.50 |
| Single Male/Father | 11 (2.7%) | 2.09 |
| Single Female/Mother | 108 (26.3%) | 4.10 |
| Non-family | 145 (35.3%) | 1.74 |
| Total Households | 411 (100.0%) | 2.64 |
Household Size by Marriage Status in Rupert
Out of a total of 411 households in Rupert, 266 (64.7%) are family households, while 145 (35.3%) are nonfamily households. The most numerous type of family households are 2-person households, comprising 140, and the most common type of nonfamily households are 1-person households, comprising 106.
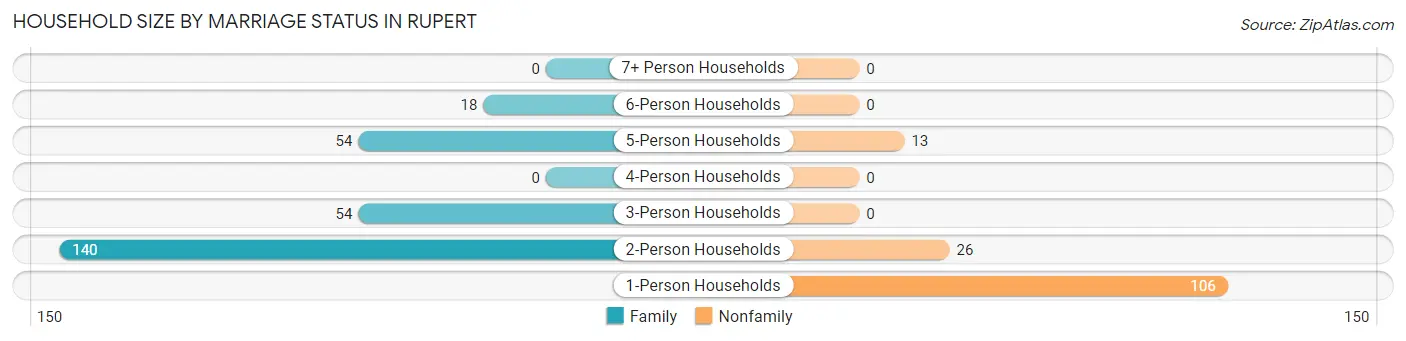
| Household Size | Family Households | Nonfamily Households |
| 1-Person Households | - | 106 (25.8%) |
| 2-Person Households | 140 (34.1%) | 26 (6.3%) |
| 3-Person Households | 54 (13.1%) | 0 (0.0%) |
| 4-Person Households | 0 (0.0%) | 0 (0.0%) |
| 5-Person Households | 54 (13.1%) | 13 (3.2%) |
| 6-Person Households | 18 (4.4%) | 0 (0.0%) |
| 7+ Person Households | 0 (0.0%) | 0 (0.0%) |
| Total | 266 (64.7%) | 145 (35.3%) |
Female Fertility in Rupert
Fertility by Age in Rupert
| Age Bracket | Women with Births | Births / 1,000 Women |
| 15 to 19 years | 0 (0.0%) | 0.0 |
| 20 to 34 years | 0 (0.0%) | 0.0 |
| 35 to 50 years | 0 (0.0%) | 0.0 |
| Total | 0 (0.0%) | 0.0 |
Fertility by Age by Marriage Status in Rupert
| Age Bracket | Married | Unmarried |
| 15 to 19 years | 0 (0.0%) | 0 (0.0%) |
| 20 to 34 years | 0 (0.0%) | 0 (0.0%) |
| 35 to 50 years | 0 (0.0%) | 0 (0.0%) |
| Total | 0 (0.0%) | 0 (0.0%) |
Fertility by Education in Rupert
| Educational Attainment | Women with Births | Births / 1,000 Women |
| Less than High School | 0 (0.0%) | 0.0 |
| High School Diploma | 0 (0.0%) | 0.0 |
| College or Associate's Degree | 0 (0.0%) | 0.0 |
| Bachelor's Degree | 0 (0.0%) | 0.0 |
| Graduate Degree | 0 (0.0%) | 0.0 |
| Total | 0 (0.0%) | 0.0 |
Fertility by Education by Marriage Status in Rupert
| Educational Attainment | Married | Unmarried |
| Less than High School | 0 (0.0%) | 0 (0.0%) |
| High School Diploma | 0 (0.0%) | 0 (0.0%) |
| College or Associate's Degree | 0 (0.0%) | 0 (0.0%) |
| Bachelor's Degree | 0 (0.0%) | 0 (0.0%) |
| Graduate Degree | 0 (0.0%) | 0 (0.0%) |
| Total | 0 (0.0%) | 0 (0.0%) |
Employment Characteristics in Rupert
Employment by Class of Employer in Rupert
Among the 429 employed individuals in Rupert, private company employees (377 | 87.9%), state government employees (47 | 11.0%), and self-employed (not incorporated) (3 | 0.7%) make up the most common classes of employment.
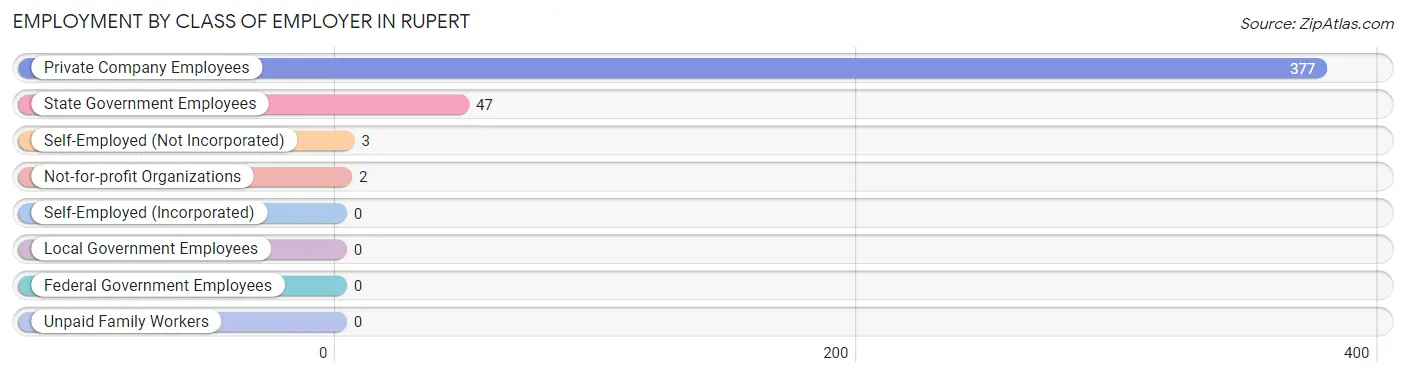
| Employer Class | # Employees | % Employees |
| Private Company Employees | 377 | 87.9% |
| Self-Employed (Incorporated) | 0 | 0.0% |
| Self-Employed (Not Incorporated) | 3 | 0.7% |
| Not-for-profit Organizations | 2 | 0.5% |
| Local Government Employees | 0 | 0.0% |
| State Government Employees | 47 | 11.0% |
| Federal Government Employees | 0 | 0.0% |
| Unpaid Family Workers | 0 | 0.0% |
| Total | 429 | 100.0% |
Employment Status by Age in Rupert
According to the labor force statistics for Rupert, out of the total population over 16 years of age (807), 55.9% or 451 individuals are in the labor force, with 2.4% or 11 of them unemployed. The age group with the highest labor force participation rate is 16 to 19 years, with 93.5% or 29 individuals in the labor force. Within the labor force, the 25 to 29 years age range has the highest percentage of unemployed individuals, with 19.0% or 11 of them being unemployed.
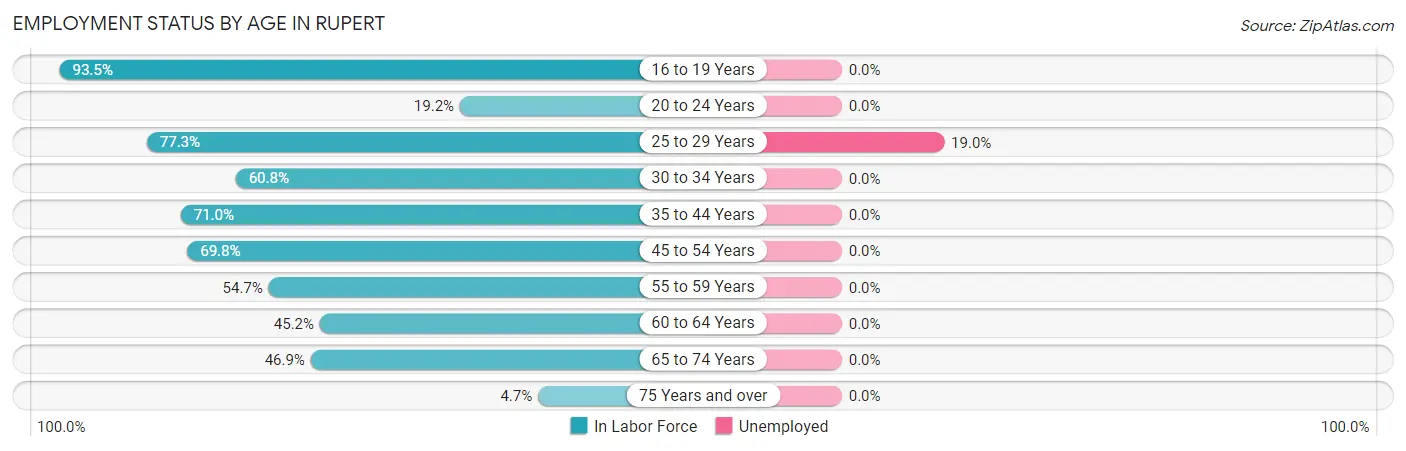
| Age Bracket | In Labor Force | Unemployed |
| 16 to 19 Years | 29 (93.5%) | 0 (0.0%) |
| 20 to 24 Years | 5 (19.2%) | 0 (0.0%) |
| 25 to 29 Years | 58 (77.3%) | 11 (19.0%) |
| 30 to 34 Years | 101 (60.8%) | 0 (0.0%) |
| 35 to 44 Years | 49 (71.0%) | 0 (0.0%) |
| 45 to 54 Years | 81 (69.8%) | 0 (0.0%) |
| 55 to 59 Years | 35 (54.7%) | 0 (0.0%) |
| 60 to 64 Years | 52 (45.2%) | 0 (0.0%) |
| 65 to 74 Years | 38 (46.9%) | 0 (0.0%) |
| 75 Years and over | 3 (4.7%) | 0 (0.0%) |
| Total | 451 (55.9%) | 11 (2.4%) |
Employment Status by Educational Attainment in Rupert
According to labor force statistics for Rupert, 62.1% of individuals (376) out of the total population between 25 and 64 years of age (605) are in the labor force, with 2.9% or 11 of them being unemployed. The group with the highest labor force participation rate are those with the educational attainment of bachelor's degree or higher, with 100.0% or 50 individuals in the labor force. Within the labor force, individuals with less than high school education have the highest percentage of unemployment, with 31.4% or 11 of them being unemployed.
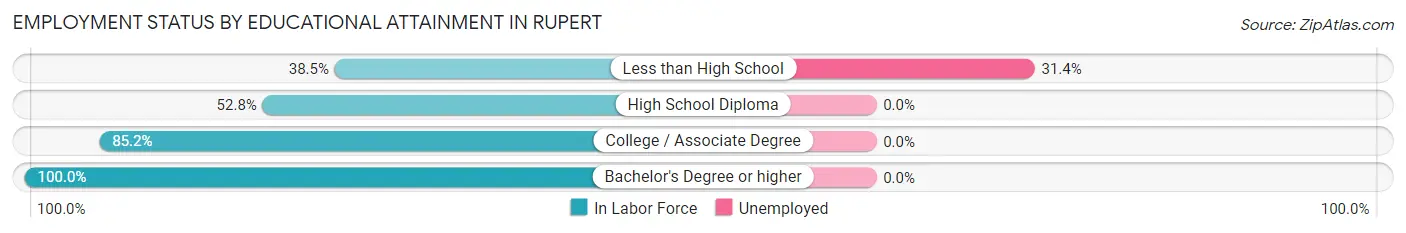
| Educational Attainment | In Labor Force | Unemployed |
| Less than High School | 35 (38.5%) | 29 (31.4%) |
| High School Diploma | 170 (52.8%) | 0 (0.0%) |
| College / Associate Degree | 121 (85.2%) | 0 (0.0%) |
| Bachelor's Degree or higher | 50 (100.0%) | 0 (0.0%) |
| Total | 376 (62.1%) | 18 (2.9%) |
Employment Occupations by Sex in Rupert
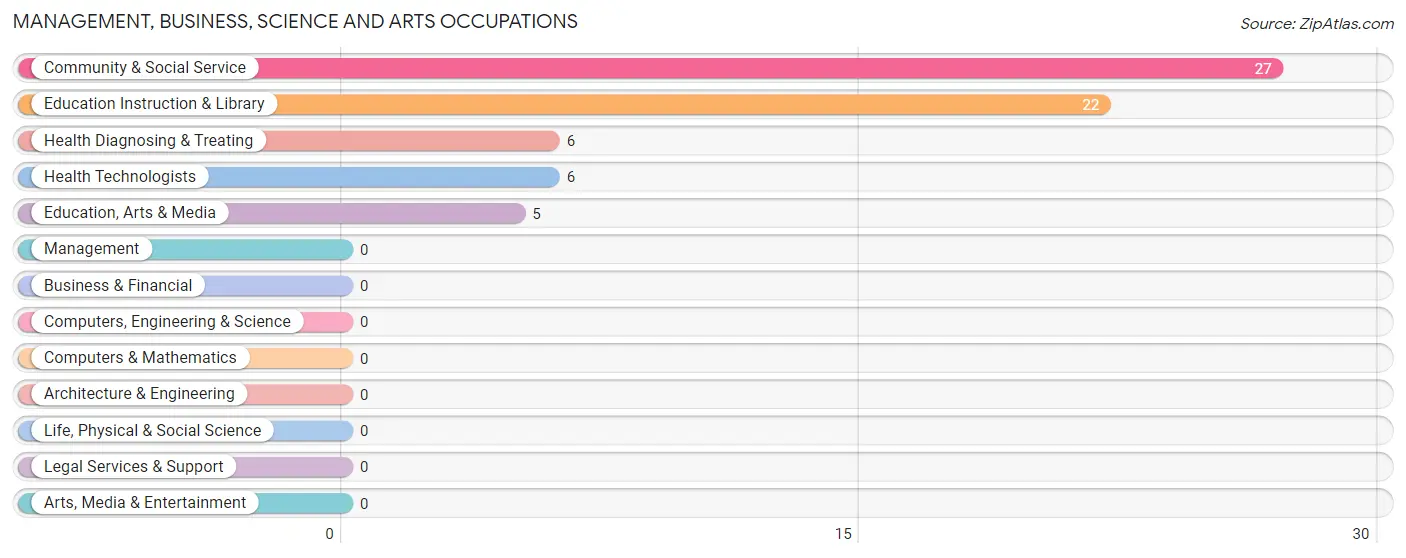
Management, Business, Science and Arts Occupations
The most common Management, Business, Science and Arts occupations in Rupert are Community & Social Service (27 | 6.1%), Education Instruction & Library (22 | 5.0%), Health Diagnosing & Treating (6 | 1.4%), Health Technologists (6 | 1.4%), and Education, Arts & Media (5 | 1.1%).
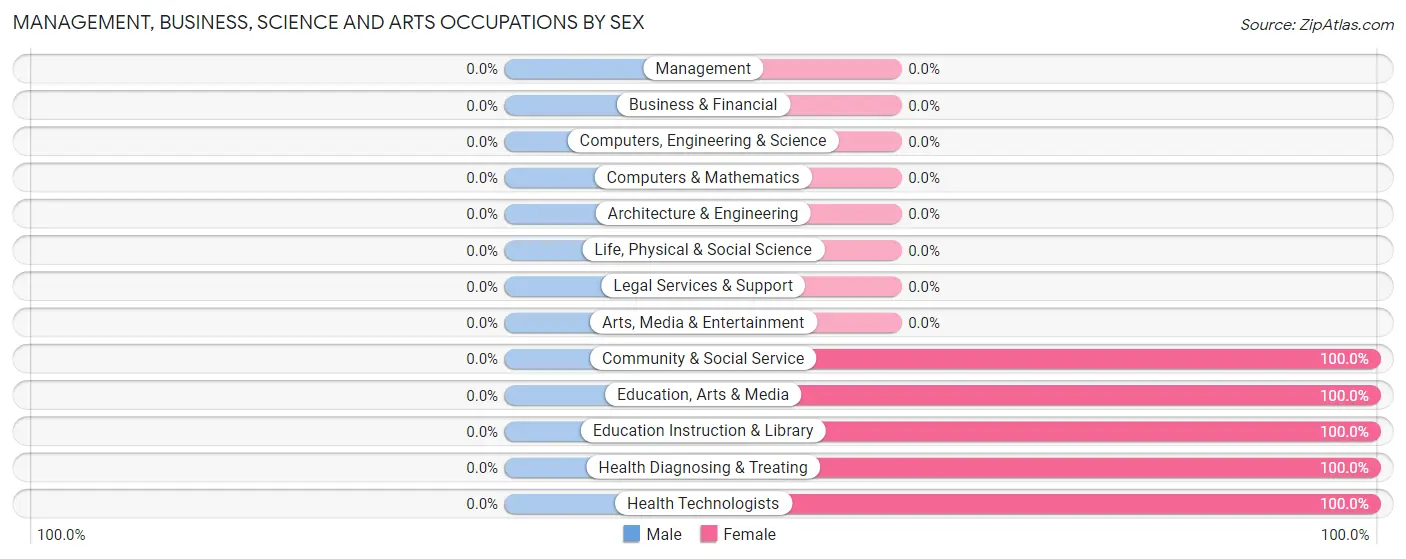
Management, Business, Science and Arts Occupations by Sex
| Occupation | Male | Female |
| Management | 0 (0.0%) | 0 (0.0%) |
| Business & Financial | 0 (0.0%) | 0 (0.0%) |
| Computers, Engineering & Science | 0 (0.0%) | 0 (0.0%) |
| Computers & Mathematics | 0 (0.0%) | 0 (0.0%) |
| Architecture & Engineering | 0 (0.0%) | 0 (0.0%) |
| Life, Physical & Social Science | 0 (0.0%) | 0 (0.0%) |
| Community & Social Service | 0 (0.0%) | 27 (100.0%) |
| Education, Arts & Media | 0 (0.0%) | 5 (100.0%) |
| Legal Services & Support | 0 (0.0%) | 0 (0.0%) |
| Education Instruction & Library | 0 (0.0%) | 22 (100.0%) |
| Arts, Media & Entertainment | 0 (0.0%) | 0 (0.0%) |
| Health Diagnosing & Treating | 0 (0.0%) | 6 (100.0%) |
| Health Technologists | 0 (0.0%) | 6 (100.0%) |
| Total (Category) | 0 (0.0%) | 33 (100.0%) |
| Total (Overall) | 200 (45.5%) | 240 (54.5%) |
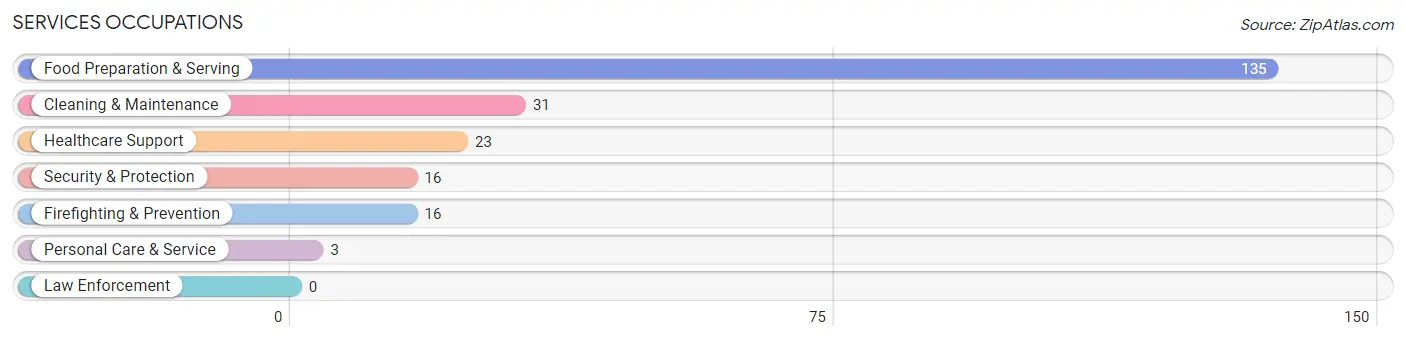
Services Occupations
The most common Services occupations in Rupert are Food Preparation & Serving (135 | 30.7%), Cleaning & Maintenance (31 | 7.0%), Healthcare Support (23 | 5.2%), Security & Protection (16 | 3.6%), and Firefighting & Prevention (16 | 3.6%).
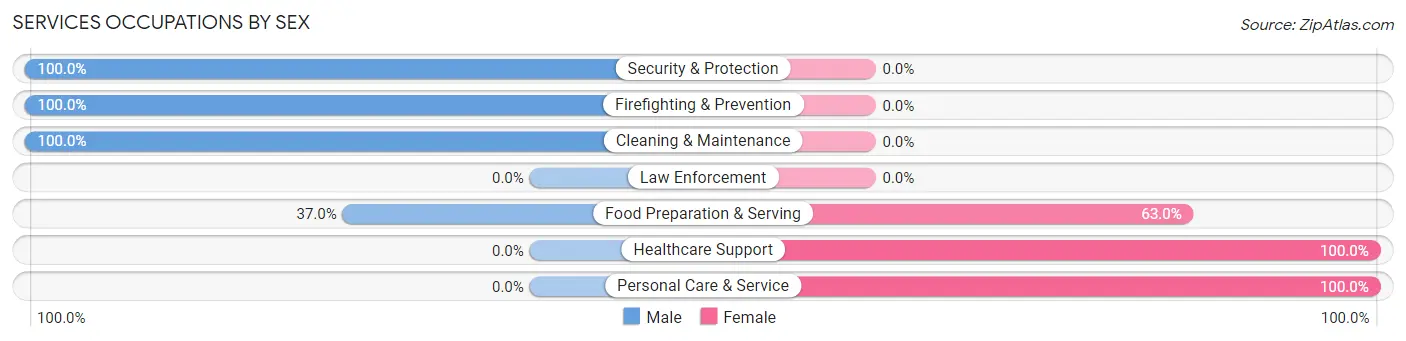
Services Occupations by Sex
Within the Services occupations in Rupert, the most male-oriented occupations are Security & Protection (100.0%), Firefighting & Prevention (100.0%), and Cleaning & Maintenance (100.0%), while the most female-oriented occupations are Healthcare Support (100.0%), Personal Care & Service (100.0%), and Food Preparation & Serving (63.0%).
| Occupation | Male | Female |
| Healthcare Support | 0 (0.0%) | 23 (100.0%) |
| Security & Protection | 16 (100.0%) | 0 (0.0%) |
| Firefighting & Prevention | 16 (100.0%) | 0 (0.0%) |
| Law Enforcement | 0 (0.0%) | 0 (0.0%) |
| Food Preparation & Serving | 50 (37.0%) | 85 (63.0%) |
| Cleaning & Maintenance | 31 (100.0%) | 0 (0.0%) |
| Personal Care & Service | 0 (0.0%) | 3 (100.0%) |
| Total (Category) | 97 (46.6%) | 111 (53.4%) |
| Total (Overall) | 200 (45.5%) | 240 (54.5%) |
Sales and Office Occupations
The most common Sales and Office occupations in Rupert are Sales & Related (126 | 28.6%), and Office & Administration (8 | 1.8%).
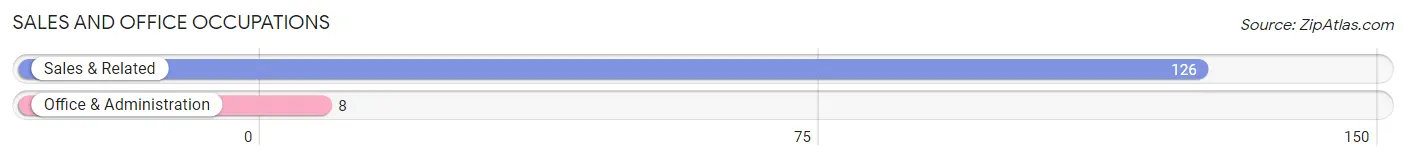
Sales and Office Occupations by Sex
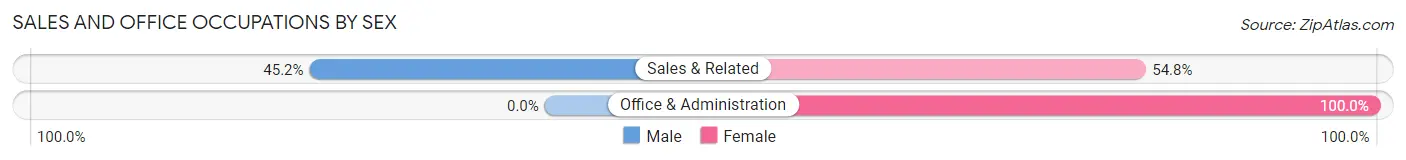
| Occupation | Male | Female |
| Sales & Related | 57 (45.2%) | 69 (54.8%) |
| Office & Administration | 0 (0.0%) | 8 (100.0%) |
| Total (Category) | 57 (42.5%) | 77 (57.5%) |
| Total (Overall) | 200 (45.5%) | 240 (54.5%) |
Natural Resources, Construction and Maintenance Occupations
The most common Natural Resources, Construction and Maintenance occupations in Rupert are Farming, Fishing & Forestry (9 | 2.1%), Construction & Extraction (9 | 2.1%), and Installation, Maintenance & Repair (3 | 0.7%).
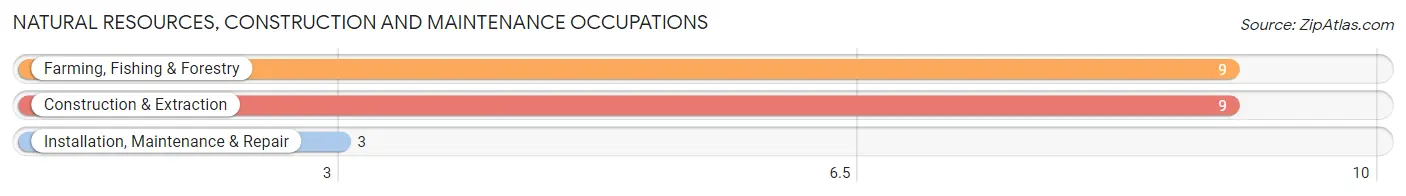
Natural Resources, Construction and Maintenance Occupations by Sex
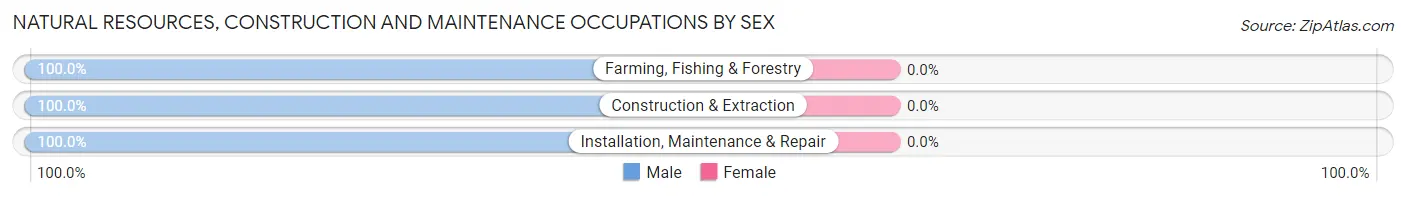
| Occupation | Male | Female |
| Farming, Fishing & Forestry | 9 (100.0%) | 0 (0.0%) |
| Construction & Extraction | 9 (100.0%) | 0 (0.0%) |
| Installation, Maintenance & Repair | 3 (100.0%) | 0 (0.0%) |
| Total (Category) | 21 (100.0%) | 0 (0.0%) |
| Total (Overall) | 200 (45.5%) | 240 (54.5%) |
Production, Transportation and Moving Occupations
The most common Production, Transportation and Moving occupations in Rupert are , and Production (44 | 10.0%).
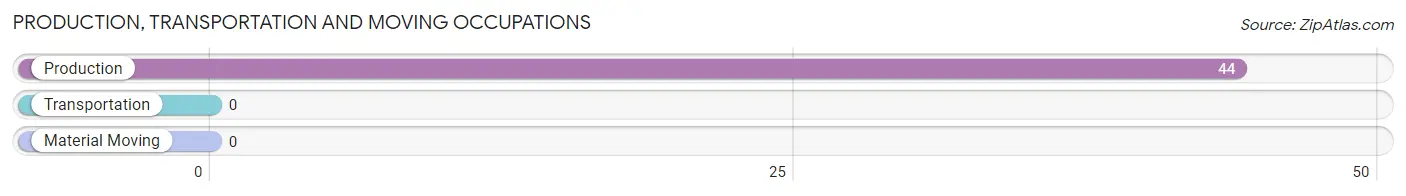
Production, Transportation and Moving Occupations by Sex
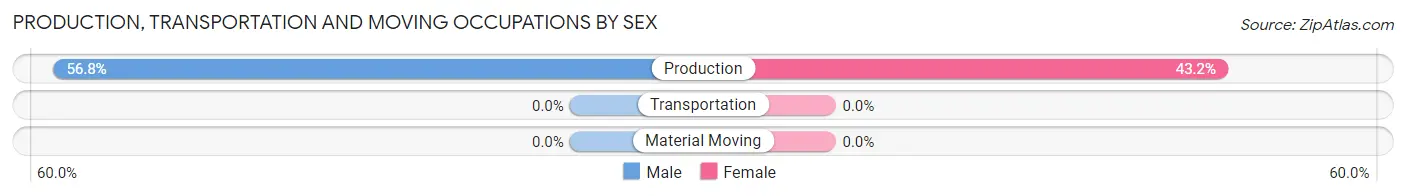
| Occupation | Male | Female |
| Production | 25 (56.8%) | 19 (43.2%) |
| Transportation | 0 (0.0%) | 0 (0.0%) |
| Material Moving | 0 (0.0%) | 0 (0.0%) |
| Total (Category) | 25 (56.8%) | 19 (43.2%) |
| Total (Overall) | 200 (45.5%) | 240 (54.5%) |
Employment Industries by Sex in Rupert
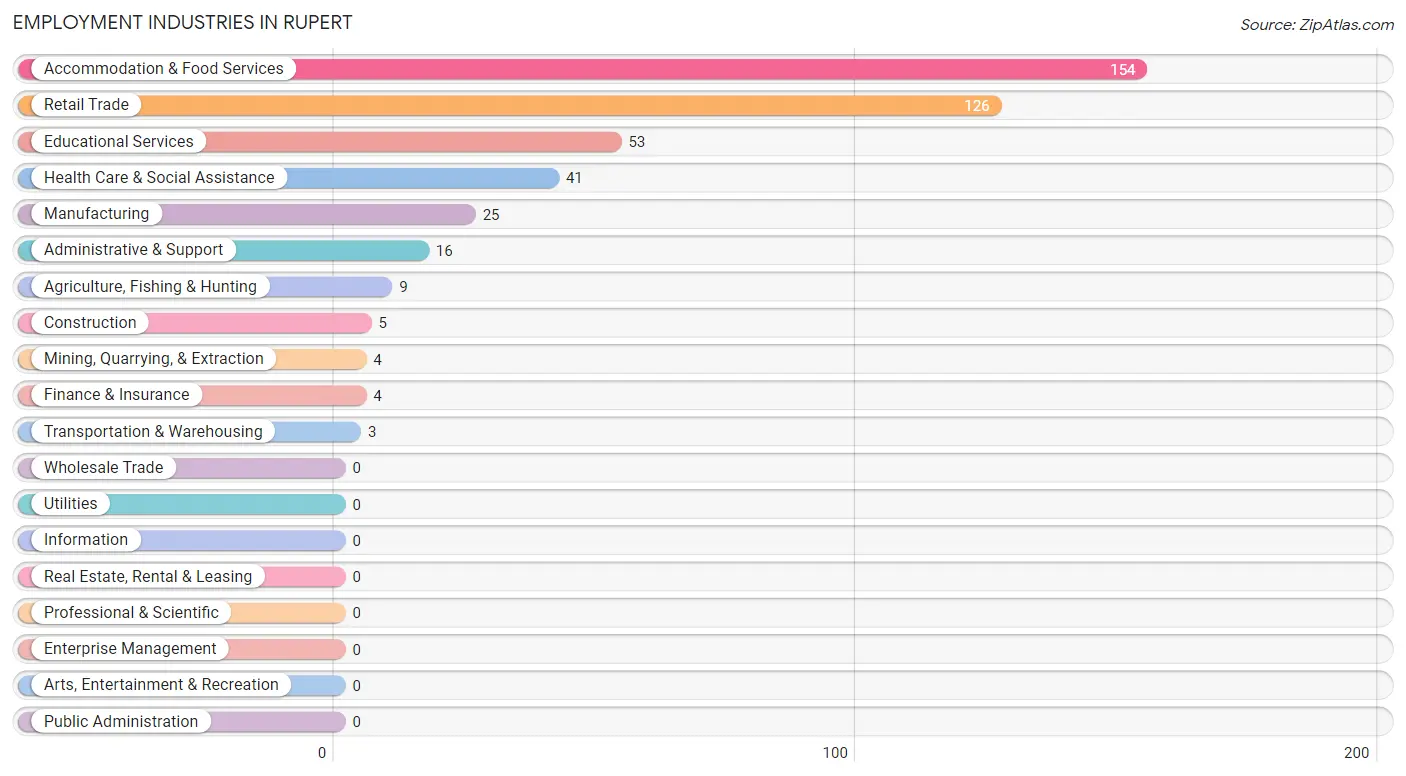
Employment Industries in Rupert
The major employment industries in Rupert include Accommodation & Food Services (154 | 35.0%), Retail Trade (126 | 28.6%), Educational Services (53 | 12.0%), Health Care & Social Assistance (41 | 9.3%), and Manufacturing (25 | 5.7%).
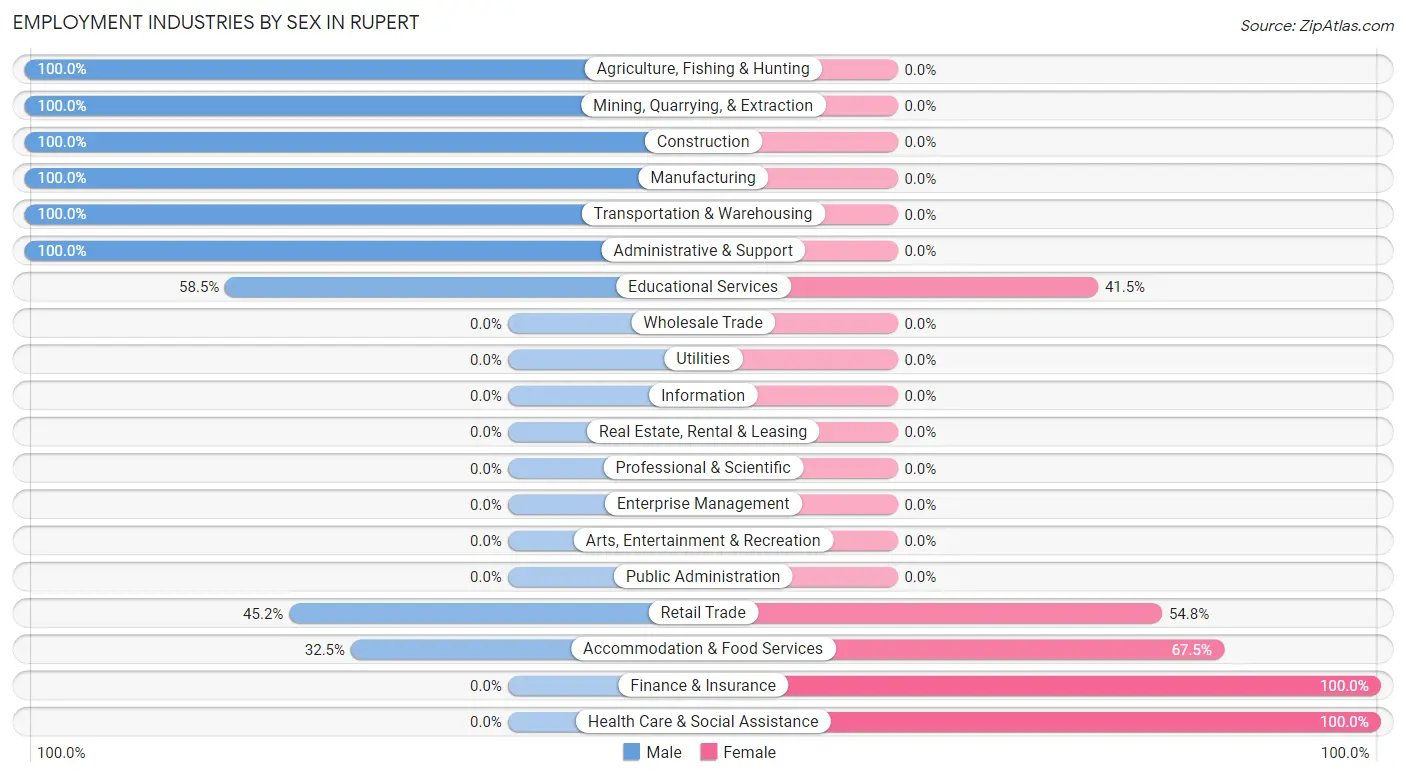
Employment Industries by Sex in Rupert
The Rupert industries that see more men than women are Agriculture, Fishing & Hunting (100.0%), Mining, Quarrying, & Extraction (100.0%), and Construction (100.0%), whereas the industries that tend to have a higher number of women are Finance & Insurance (100.0%), Health Care & Social Assistance (100.0%), and Accommodation & Food Services (67.5%).
| Industry | Male | Female |
| Agriculture, Fishing & Hunting | 9 (100.0%) | 0 (0.0%) |
| Mining, Quarrying, & Extraction | 4 (100.0%) | 0 (0.0%) |
| Construction | 5 (100.0%) | 0 (0.0%) |
| Manufacturing | 25 (100.0%) | 0 (0.0%) |
| Wholesale Trade | 0 (0.0%) | 0 (0.0%) |
| Retail Trade | 57 (45.2%) | 69 (54.8%) |
| Transportation & Warehousing | 3 (100.0%) | 0 (0.0%) |
| Utilities | 0 (0.0%) | 0 (0.0%) |
| Information | 0 (0.0%) | 0 (0.0%) |
| Finance & Insurance | 0 (0.0%) | 4 (100.0%) |
| Real Estate, Rental & Leasing | 0 (0.0%) | 0 (0.0%) |
| Professional & Scientific | 0 (0.0%) | 0 (0.0%) |
| Enterprise Management | 0 (0.0%) | 0 (0.0%) |
| Administrative & Support | 16 (100.0%) | 0 (0.0%) |
| Educational Services | 31 (58.5%) | 22 (41.5%) |
| Health Care & Social Assistance | 0 (0.0%) | 41 (100.0%) |
| Arts, Entertainment & Recreation | 0 (0.0%) | 0 (0.0%) |
| Accommodation & Food Services | 50 (32.5%) | 104 (67.5%) |
| Public Administration | 0 (0.0%) | 0 (0.0%) |
| Total | 200 (45.5%) | 240 (54.5%) |
Education in Rupert
School Enrollment in Rupert
The most common levels of schooling among the 236 students in Rupert are elementary school (159 | 67.4%), college / undergraduate (33 | 14.0%), and nursery / preschool (17 | 7.2%).
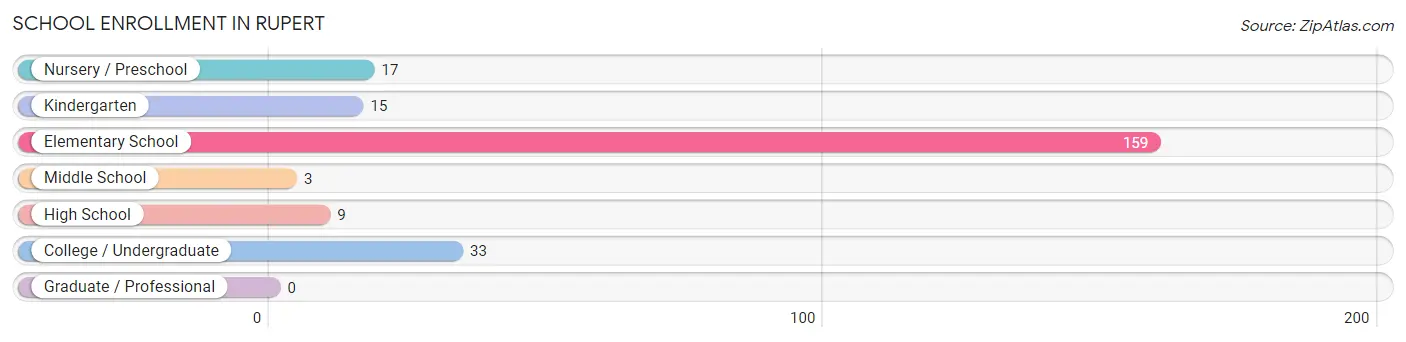
| School Level | # Students | % Students |
| Nursery / Preschool | 17 | 7.2% |
| Kindergarten | 15 | 6.4% |
| Elementary School | 159 | 67.4% |
| Middle School | 3 | 1.3% |
| High School | 9 | 3.8% |
| College / Undergraduate | 33 | 14.0% |
| Graduate / Professional | 0 | 0.0% |
| Total | 236 | 100.0% |
School Enrollment by Age by Funding Source in Rupert
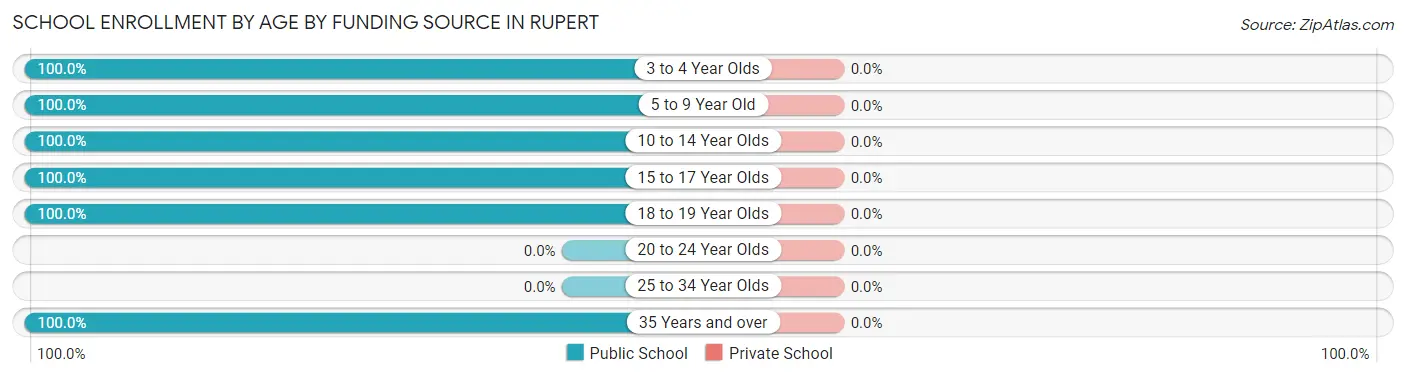
| Age Bracket | Public School | Private School |
| 3 to 4 Year Olds | 17 (100.0%) | 0 (0.0%) |
| 5 to 9 Year Old | 128 (100.0%) | 0 (0.0%) |
| 10 to 14 Year Olds | 49 (100.0%) | 0 (0.0%) |
| 15 to 17 Year Olds | 1 (100.0%) | 0 (0.0%) |
| 18 to 19 Year Olds | 29 (100.0%) | 0 (0.0%) |
| 20 to 24 Year Olds | 0 (0.0%) | 0 (0.0%) |
| 25 to 34 Year Olds | 0 (0.0%) | 0 (0.0%) |
| 35 Years and over | 12 (100.0%) | 0 (0.0%) |
| Total | 236 (100.0%) | 0 (0.0%) |
Educational Attainment by Field of Study in Rupert
Education (29 | 50.9%), business (22 | 38.6%), and science & technology (6 | 10.5%) are the most common fields of study among 57 individuals in Rupert who have obtained a bachelor's degree or higher.
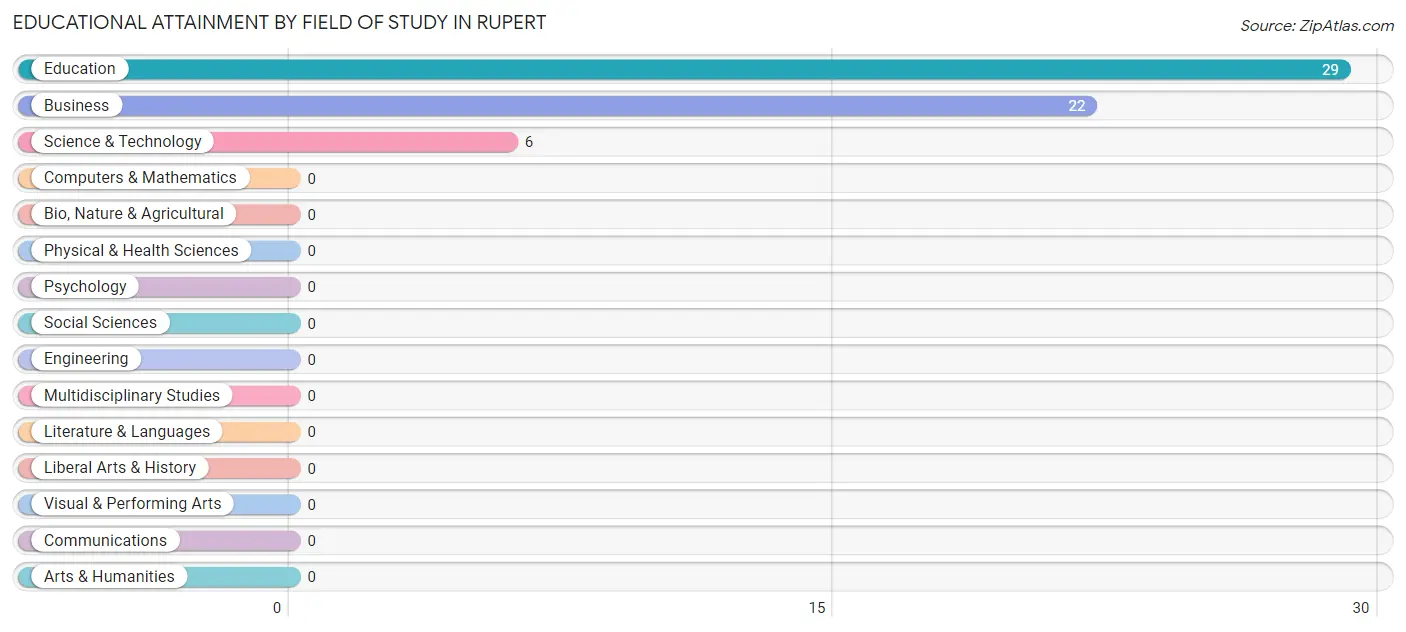
| Field of Study | # Graduates | % Graduates |
| Computers & Mathematics | 0 | 0.0% |
| Bio, Nature & Agricultural | 0 | 0.0% |
| Physical & Health Sciences | 0 | 0.0% |
| Psychology | 0 | 0.0% |
| Social Sciences | 0 | 0.0% |
| Engineering | 0 | 0.0% |
| Multidisciplinary Studies | 0 | 0.0% |
| Science & Technology | 6 | 10.5% |
| Business | 22 | 38.6% |
| Education | 29 | 50.9% |
| Literature & Languages | 0 | 0.0% |
| Liberal Arts & History | 0 | 0.0% |
| Visual & Performing Arts | 0 | 0.0% |
| Communications | 0 | 0.0% |
| Arts & Humanities | 0 | 0.0% |
| Total | 57 | 100.0% |
Transportation & Commute in Rupert
Vehicle Availability by Sex in Rupert
The most prevalent vehicle ownership categories in Rupert are males with 2 vehicles (124, accounting for 62.0%) and females with 2 vehicles (176, making up 54.1%).
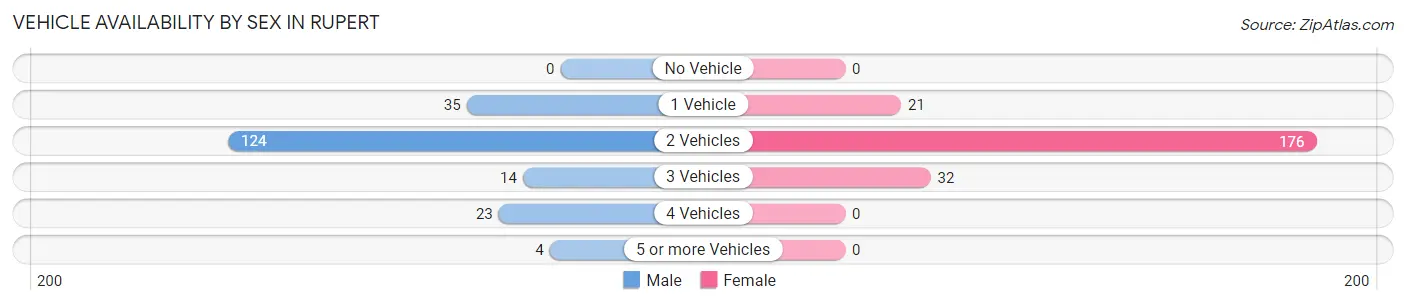
| Vehicles Available | Male | Female |
| No Vehicle | 0 (0.0%) | 0 (0.0%) |
| 1 Vehicle | 35 (17.5%) | 21 (9.2%) |
| 2 Vehicles | 124 (62.0%) | 176 (76.9%) |
| 3 Vehicles | 14 (7.0%) | 32 (14.0%) |
| 4 Vehicles | 23 (11.5%) | 0 (0.0%) |
| 5 or more Vehicles | 4 (2.0%) | 0 (0.0%) |
| Total | 200 (100.0%) | 229 (100.0%) |
Commute Time in Rupert
The most frequently occuring commute durations in Rupert are 30 to 34 minutes (151 commuters, 35.9%), 40 to 44 minutes (56 commuters, 13.3%), and 10 to 14 minutes (47 commuters, 11.2%).
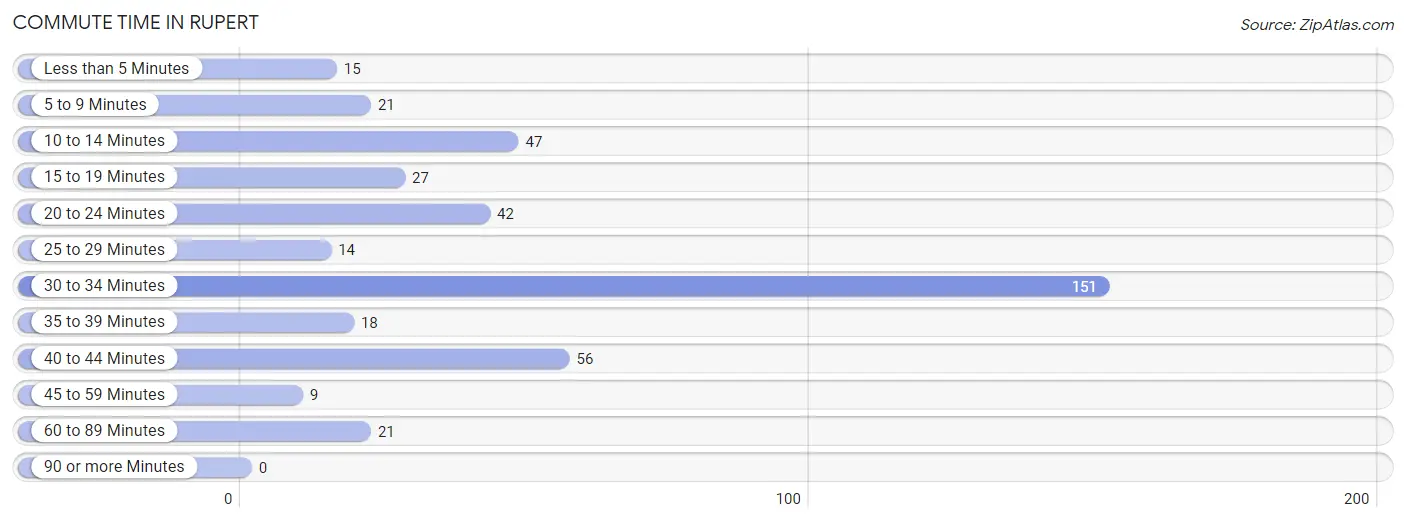
| Commute Time | # Commuters | % Commuters |
| Less than 5 Minutes | 15 | 3.6% |
| 5 to 9 Minutes | 21 | 5.0% |
| 10 to 14 Minutes | 47 | 11.2% |
| 15 to 19 Minutes | 27 | 6.4% |
| 20 to 24 Minutes | 42 | 10.0% |
| 25 to 29 Minutes | 14 | 3.3% |
| 30 to 34 Minutes | 151 | 35.9% |
| 35 to 39 Minutes | 18 | 4.3% |
| 40 to 44 Minutes | 56 | 13.3% |
| 45 to 59 Minutes | 9 | 2.1% |
| 60 to 89 Minutes | 21 | 5.0% |
| 90 or more Minutes | 0 | 0.0% |
Commute Time by Sex in Rupert
The most common commute times in Rupert are 30 to 34 minutes (45 commuters, 22.5%) for males and 30 to 34 minutes (106 commuters, 48.0%) for females.
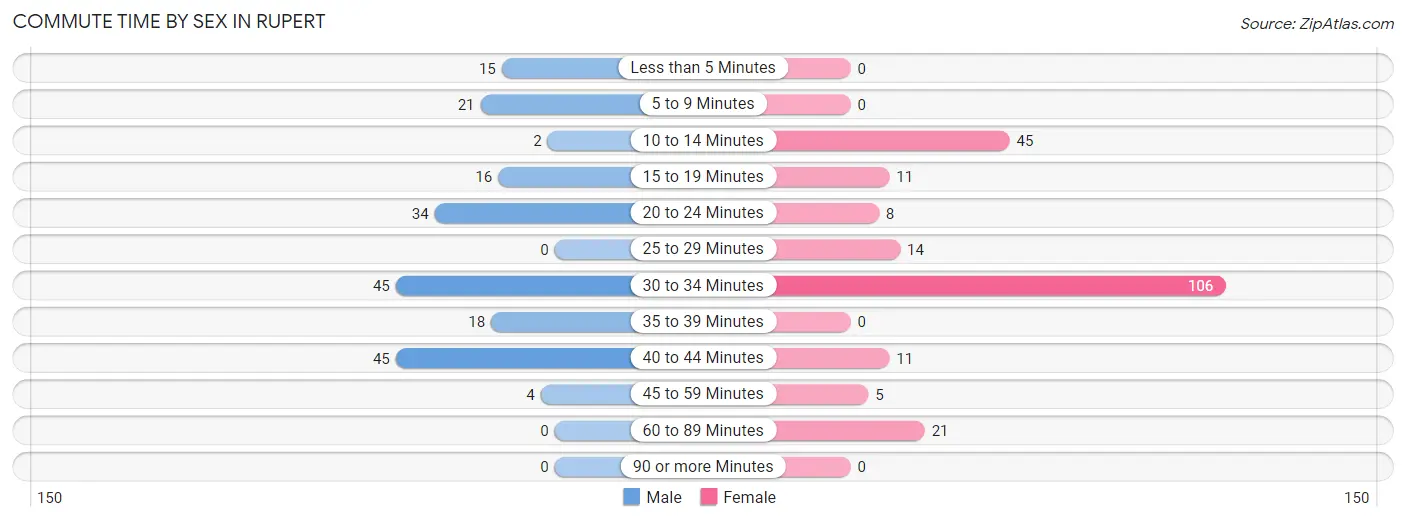
| Commute Time | Male | Female |
| Less than 5 Minutes | 15 (7.5%) | 0 (0.0%) |
| 5 to 9 Minutes | 21 (10.5%) | 0 (0.0%) |
| 10 to 14 Minutes | 2 (1.0%) | 45 (20.4%) |
| 15 to 19 Minutes | 16 (8.0%) | 11 (5.0%) |
| 20 to 24 Minutes | 34 (17.0%) | 8 (3.6%) |
| 25 to 29 Minutes | 0 (0.0%) | 14 (6.3%) |
| 30 to 34 Minutes | 45 (22.5%) | 106 (48.0%) |
| 35 to 39 Minutes | 18 (9.0%) | 0 (0.0%) |
| 40 to 44 Minutes | 45 (22.5%) | 11 (5.0%) |
| 45 to 59 Minutes | 4 (2.0%) | 5 (2.3%) |
| 60 to 89 Minutes | 0 (0.0%) | 21 (9.5%) |
| 90 or more Minutes | 0 (0.0%) | 0 (0.0%) |
Time of Departure to Work by Sex in Rupert
The most frequent times of departure to work in Rupert are 12:00 AM to 4:59 AM (70, 35.0%) for males and 6:00 AM to 6:29 AM (57, 25.8%) for females.
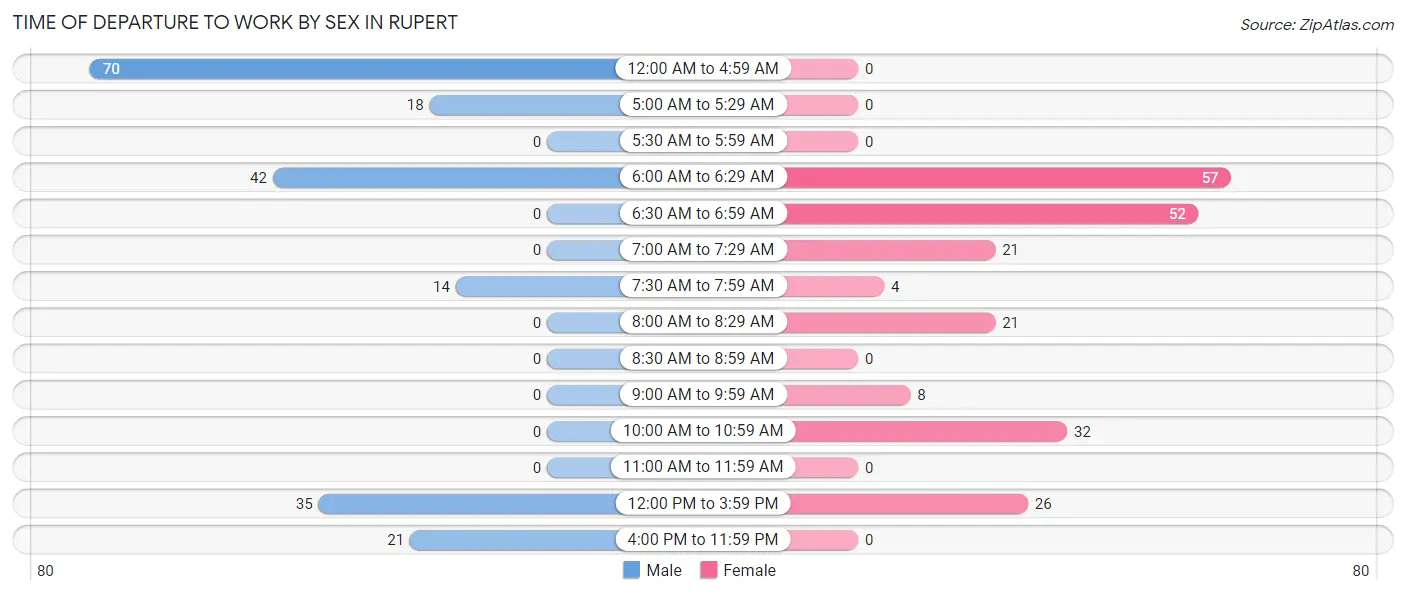
| Time of Departure | Male | Female |
| 12:00 AM to 4:59 AM | 70 (35.0%) | 0 (0.0%) |
| 5:00 AM to 5:29 AM | 18 (9.0%) | 0 (0.0%) |
| 5:30 AM to 5:59 AM | 0 (0.0%) | 0 (0.0%) |
| 6:00 AM to 6:29 AM | 42 (21.0%) | 57 (25.8%) |
| 6:30 AM to 6:59 AM | 0 (0.0%) | 52 (23.5%) |
| 7:00 AM to 7:29 AM | 0 (0.0%) | 21 (9.5%) |
| 7:30 AM to 7:59 AM | 14 (7.0%) | 4 (1.8%) |
| 8:00 AM to 8:29 AM | 0 (0.0%) | 21 (9.5%) |
| 8:30 AM to 8:59 AM | 0 (0.0%) | 0 (0.0%) |
| 9:00 AM to 9:59 AM | 0 (0.0%) | 8 (3.6%) |
| 10:00 AM to 10:59 AM | 0 (0.0%) | 32 (14.5%) |
| 11:00 AM to 11:59 AM | 0 (0.0%) | 0 (0.0%) |
| 12:00 PM to 3:59 PM | 35 (17.5%) | 26 (11.8%) |
| 4:00 PM to 11:59 PM | 21 (10.5%) | 0 (0.0%) |
| Total | 200 (100.0%) | 221 (100.0%) |
Housing Occupancy in Rupert
Occupancy by Ownership in Rupert
Of the total 411 dwellings in Rupert, owner-occupied units account for 237 (57.7%), while renter-occupied units make up 174 (42.3%).

| Occupancy | # Housing Units | % Housing Units |
| Owner Occupied Housing Units | 237 | 57.7% |
| Renter-Occupied Housing Units | 174 | 42.3% |
| Total Occupied Housing Units | 411 | 100.0% |
Occupancy by Household Size in Rupert
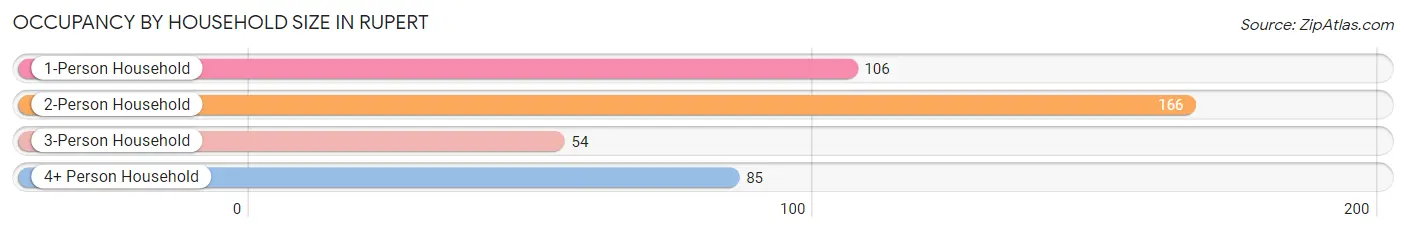
| Household Size | # Housing Units | % Housing Units |
| 1-Person Household | 106 | 25.8% |
| 2-Person Household | 166 | 40.4% |
| 3-Person Household | 54 | 13.1% |
| 4+ Person Household | 85 | 20.7% |
| Total Housing Units | 411 | 100.0% |
Occupancy by Ownership by Household Size in Rupert
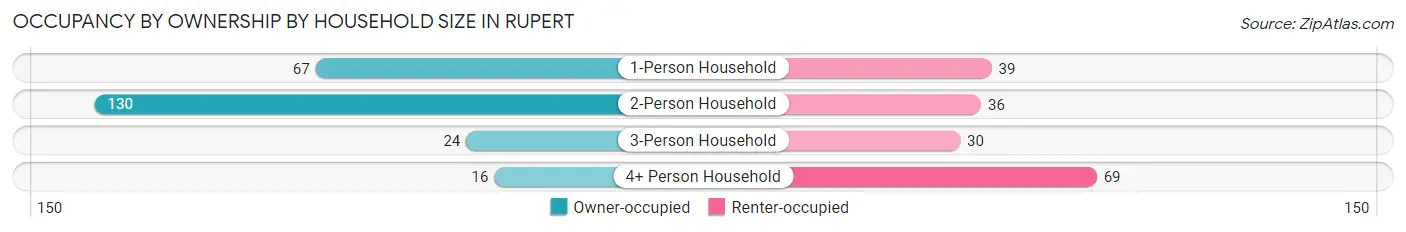
| Household Size | Owner-occupied | Renter-occupied |
| 1-Person Household | 67 (63.2%) | 39 (36.8%) |
| 2-Person Household | 130 (78.3%) | 36 (21.7%) |
| 3-Person Household | 24 (44.4%) | 30 (55.6%) |
| 4+ Person Household | 16 (18.8%) | 69 (81.2%) |
| Total Housing Units | 237 (57.7%) | 174 (42.3%) |
Occupancy by Educational Attainment in Rupert
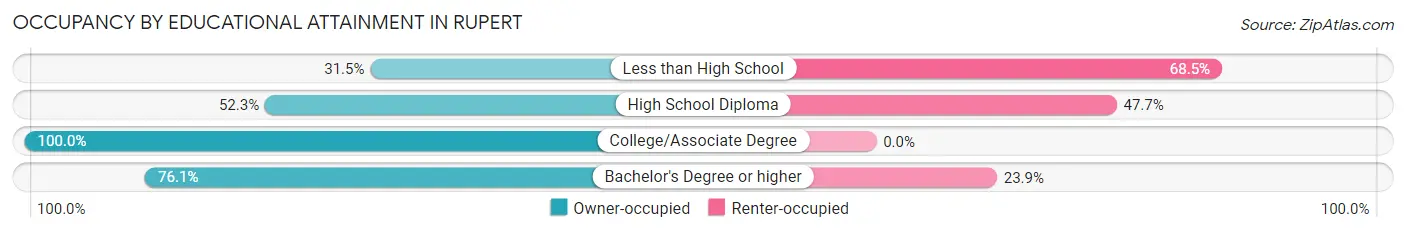
| Household Size | Owner-occupied | Renter-occupied |
| Less than High School | 28 (31.5%) | 61 (68.5%) |
| High School Diploma | 112 (52.3%) | 102 (47.7%) |
| College/Associate Degree | 62 (100.0%) | 0 (0.0%) |
| Bachelor's Degree or higher | 35 (76.1%) | 11 (23.9%) |
Occupancy by Age of Householder in Rupert
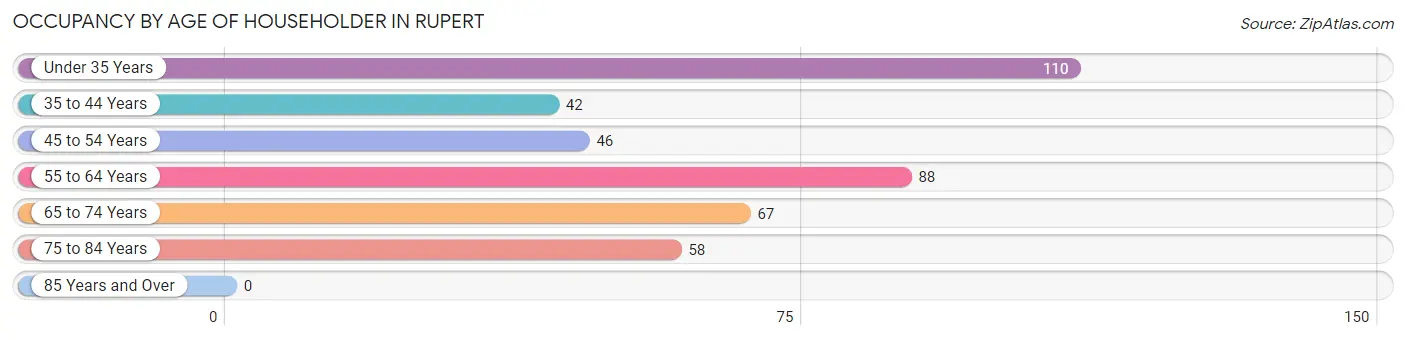
| Age Bracket | # Households | % Households |
| Under 35 Years | 110 | 26.8% |
| 35 to 44 Years | 42 | 10.2% |
| 45 to 54 Years | 46 | 11.2% |
| 55 to 64 Years | 88 | 21.4% |
| 65 to 74 Years | 67 | 16.3% |
| 75 to 84 Years | 58 | 14.1% |
| 85 Years and Over | 0 | 0.0% |
| Total | 411 | 100.0% |
Housing Finances in Rupert
Median Income by Occupancy in Rupert
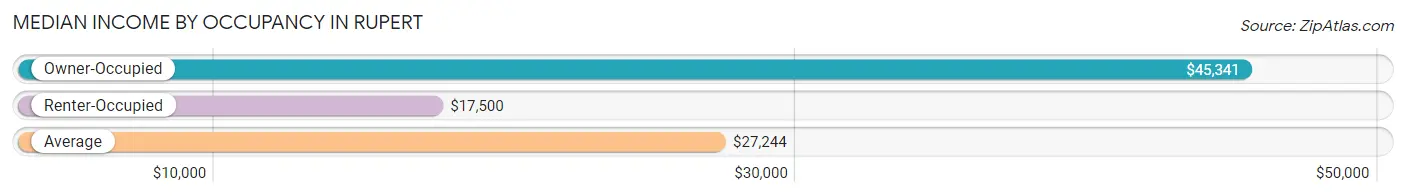
| Occupancy Type | # Households | Median Income |
| Owner-Occupied | 237 (57.7%) | $45,341 |
| Renter-Occupied | 174 (42.3%) | $17,500 |
| Average | 411 (100.0%) | $27,244 |
Occupancy by Householder Income Bracket in Rupert
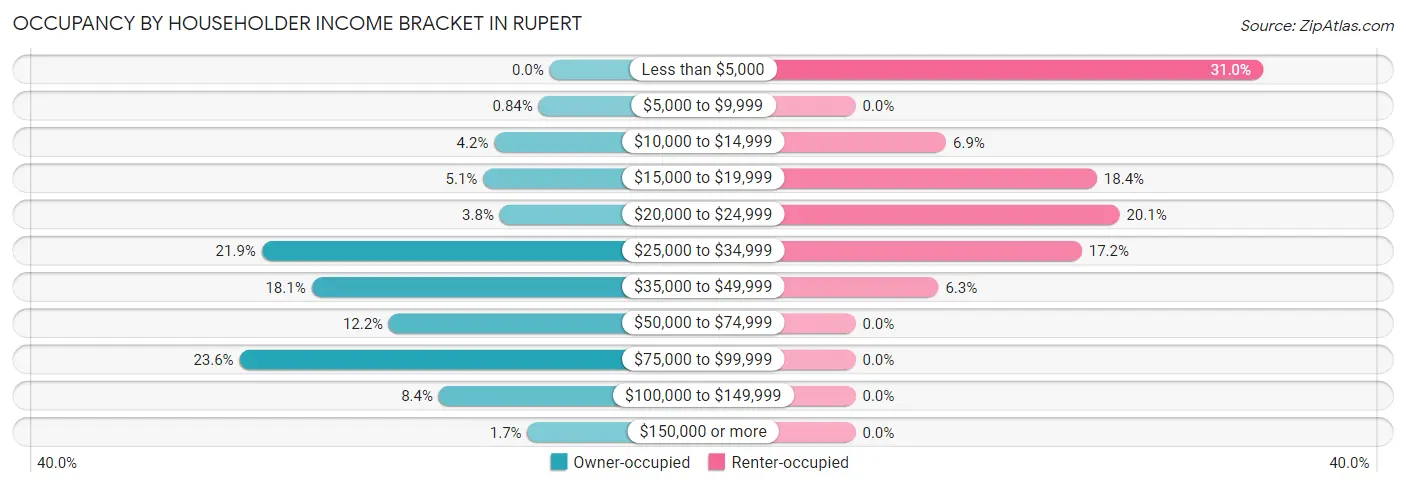
| Income Bracket | Owner-occupied | Renter-occupied |
| Less than $5,000 | 0 (0.0%) | 54 (31.0%) |
| $5,000 to $9,999 | 2 (0.8%) | 0 (0.0%) |
| $10,000 to $14,999 | 10 (4.2%) | 12 (6.9%) |
| $15,000 to $19,999 | 12 (5.1%) | 32 (18.4%) |
| $20,000 to $24,999 | 9 (3.8%) | 35 (20.1%) |
| $25,000 to $34,999 | 52 (21.9%) | 30 (17.2%) |
| $35,000 to $49,999 | 43 (18.1%) | 11 (6.3%) |
| $50,000 to $74,999 | 29 (12.2%) | 0 (0.0%) |
| $75,000 to $99,999 | 56 (23.6%) | 0 (0.0%) |
| $100,000 to $149,999 | 20 (8.4%) | 0 (0.0%) |
| $150,000 or more | 4 (1.7%) | 0 (0.0%) |
| Total | 237 (100.0%) | 174 (100.0%) |
Monthly Housing Cost Tiers in Rupert
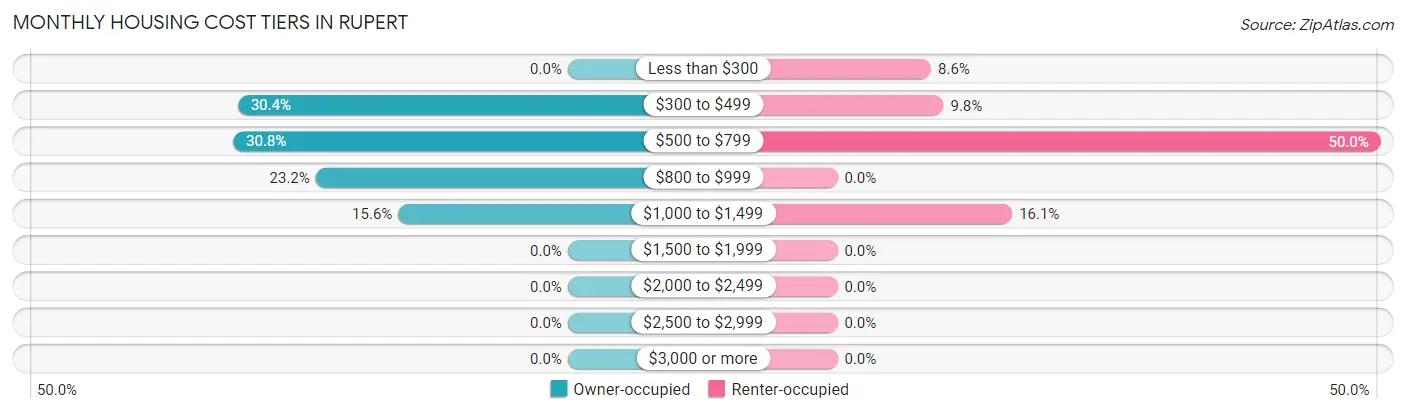
| Monthly Cost | Owner-occupied | Renter-occupied |
| Less than $300 | 0 (0.0%) | 15 (8.6%) |
| $300 to $499 | 72 (30.4%) | 17 (9.8%) |
| $500 to $799 | 73 (30.8%) | 87 (50.0%) |
| $800 to $999 | 55 (23.2%) | 0 (0.0%) |
| $1,000 to $1,499 | 37 (15.6%) | 28 (16.1%) |
| $1,500 to $1,999 | 0 (0.0%) | 0 (0.0%) |
| $2,000 to $2,499 | 0 (0.0%) | 0 (0.0%) |
| $2,500 to $2,999 | 0 (0.0%) | 0 (0.0%) |
| $3,000 or more | 0 (0.0%) | 0 (0.0%) |
| Total | 237 (100.0%) | 174 (100.0%) |
Physical Housing Characteristics in Rupert
Housing Structures in Rupert
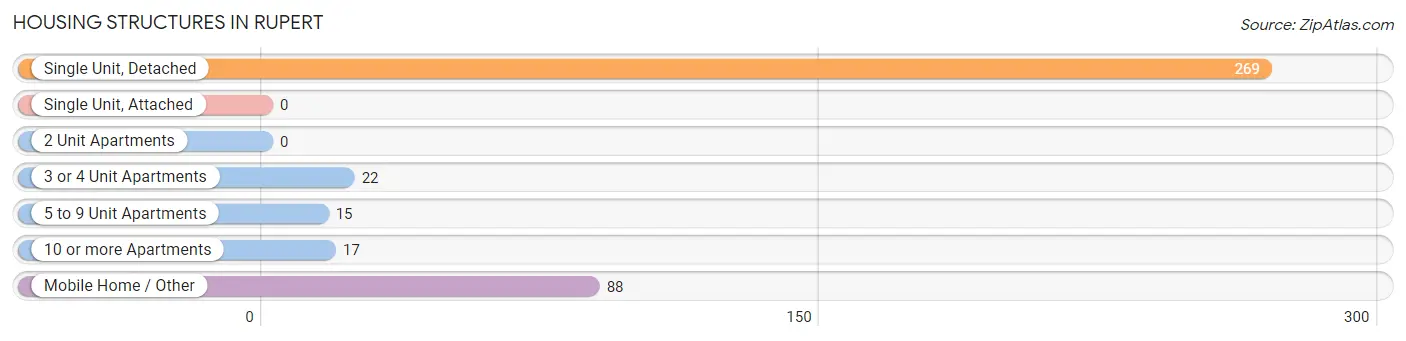
| Structure Type | # Housing Units | % Housing Units |
| Single Unit, Detached | 269 | 65.4% |
| Single Unit, Attached | 0 | 0.0% |
| 2 Unit Apartments | 0 | 0.0% |
| 3 or 4 Unit Apartments | 22 | 5.3% |
| 5 to 9 Unit Apartments | 15 | 3.6% |
| 10 or more Apartments | 17 | 4.1% |
| Mobile Home / Other | 88 | 21.4% |
| Total | 411 | 100.0% |
Housing Structures by Occupancy in Rupert
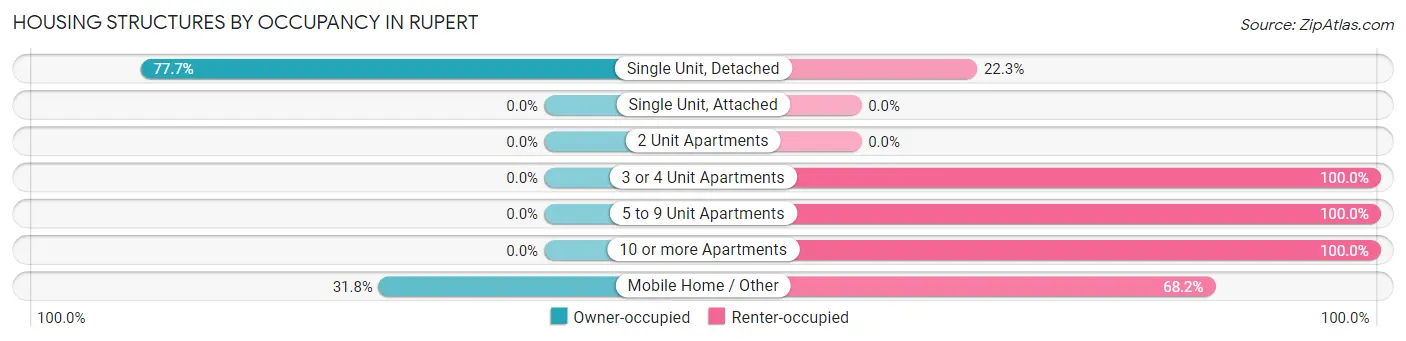
| Structure Type | Owner-occupied | Renter-occupied |
| Single Unit, Detached | 209 (77.7%) | 60 (22.3%) |
| Single Unit, Attached | 0 (0.0%) | 0 (0.0%) |
| 2 Unit Apartments | 0 (0.0%) | 0 (0.0%) |
| 3 or 4 Unit Apartments | 0 (0.0%) | 22 (100.0%) |
| 5 to 9 Unit Apartments | 0 (0.0%) | 15 (100.0%) |
| 10 or more Apartments | 0 (0.0%) | 17 (100.0%) |
| Mobile Home / Other | 28 (31.8%) | 60 (68.2%) |
| Total | 237 (57.7%) | 174 (42.3%) |
Housing Structures by Number of Rooms in Rupert
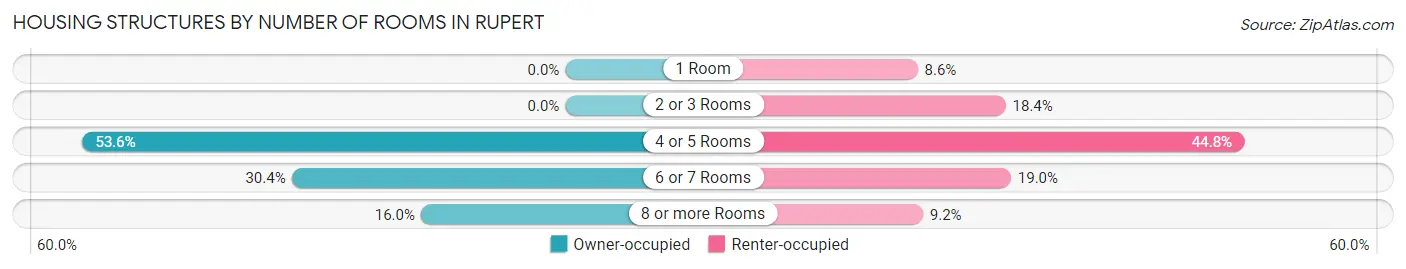
| Number of Rooms | Owner-occupied | Renter-occupied |
| 1 Room | 0 (0.0%) | 15 (8.6%) |
| 2 or 3 Rooms | 0 (0.0%) | 32 (18.4%) |
| 4 or 5 Rooms | 127 (53.6%) | 78 (44.8%) |
| 6 or 7 Rooms | 72 (30.4%) | 33 (19.0%) |
| 8 or more Rooms | 38 (16.0%) | 16 (9.2%) |
| Total | 237 (100.0%) | 174 (100.0%) |
Housing Structure by Heating Type in Rupert
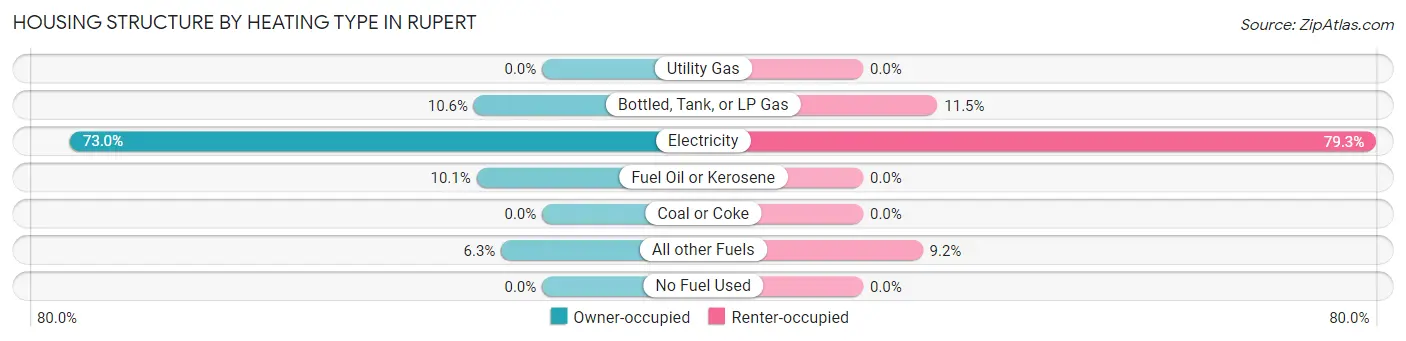
| Heating Type | Owner-occupied | Renter-occupied |
| Utility Gas | 0 (0.0%) | 0 (0.0%) |
| Bottled, Tank, or LP Gas | 25 (10.5%) | 20 (11.5%) |
| Electricity | 173 (73.0%) | 138 (79.3%) |
| Fuel Oil or Kerosene | 24 (10.1%) | 0 (0.0%) |
| Coal or Coke | 0 (0.0%) | 0 (0.0%) |
| All other Fuels | 15 (6.3%) | 16 (9.2%) |
| No Fuel Used | 0 (0.0%) | 0 (0.0%) |
| Total | 237 (100.0%) | 174 (100.0%) |
Household Vehicle Usage in Rupert
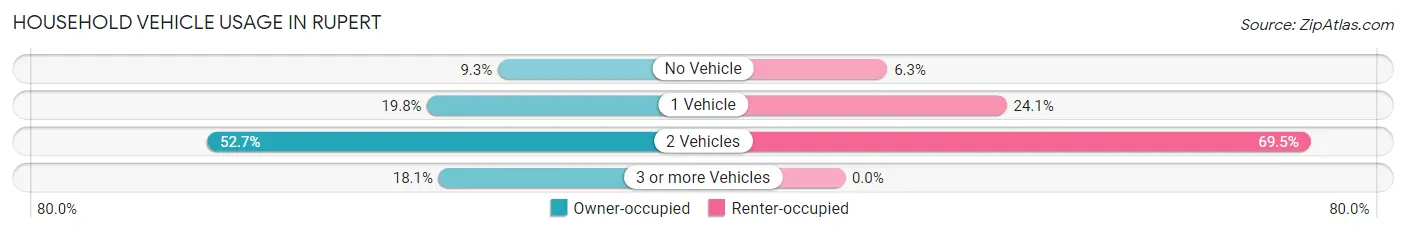
| Vehicles per Household | Owner-occupied | Renter-occupied |
| No Vehicle | 22 (9.3%) | 11 (6.3%) |
| 1 Vehicle | 47 (19.8%) | 42 (24.1%) |
| 2 Vehicles | 125 (52.7%) | 121 (69.5%) |
| 3 or more Vehicles | 43 (18.1%) | 0 (0.0%) |
| Total | 237 (100.0%) | 174 (100.0%) |
Real Estate & Mortgages in Rupert
Real Estate and Mortgage Overview in Rupert
| Characteristic | Without Mortgage | With Mortgage |
| Housing Units | 98 | 139 |
| Median Property Value | $106,900 | $83,600 |
| Median Household Income | $28,478 | $4 |
| Monthly Housing Costs | $453 | $0 |
| Real Estate Taxes | $470 | $44 |
Property Value by Mortgage Status in Rupert
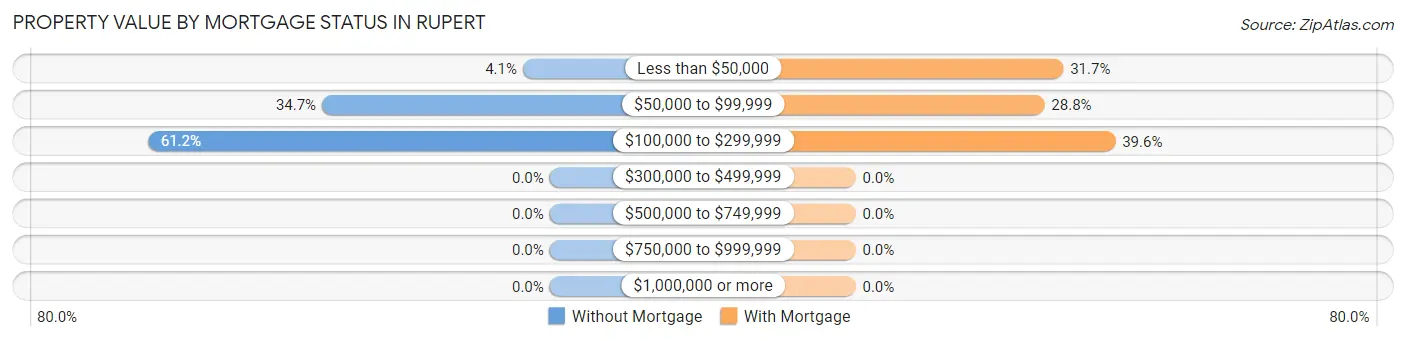
| Property Value | Without Mortgage | With Mortgage |
| Less than $50,000 | 4 (4.1%) | 44 (31.7%) |
| $50,000 to $99,999 | 34 (34.7%) | 40 (28.8%) |
| $100,000 to $299,999 | 60 (61.2%) | 55 (39.6%) |
| $300,000 to $499,999 | 0 (0.0%) | 0 (0.0%) |
| $500,000 to $749,999 | 0 (0.0%) | 0 (0.0%) |
| $750,000 to $999,999 | 0 (0.0%) | 0 (0.0%) |
| $1,000,000 or more | 0 (0.0%) | 0 (0.0%) |
| Total | 98 (100.0%) | 139 (100.0%) |
Household Income by Mortgage Status in Rupert
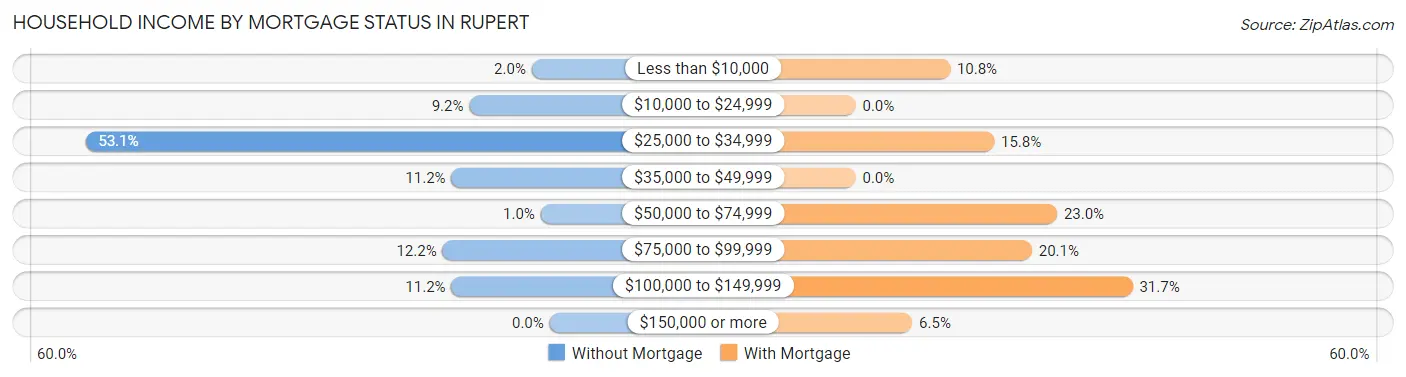
| Household Income | Without Mortgage | With Mortgage |
| Less than $10,000 | 2 (2.0%) | 15 (10.8%) |
| $10,000 to $24,999 | 9 (9.2%) | 0 (0.0%) |
| $25,000 to $34,999 | 52 (53.1%) | 22 (15.8%) |
| $35,000 to $49,999 | 11 (11.2%) | 0 (0.0%) |
| $50,000 to $74,999 | 1 (1.0%) | 32 (23.0%) |
| $75,000 to $99,999 | 12 (12.2%) | 28 (20.1%) |
| $100,000 to $149,999 | 11 (11.2%) | 44 (31.7%) |
| $150,000 or more | 0 (0.0%) | 9 (6.5%) |
| Total | 98 (100.0%) | 139 (100.0%) |
Property Value to Household Income Ratio in Rupert
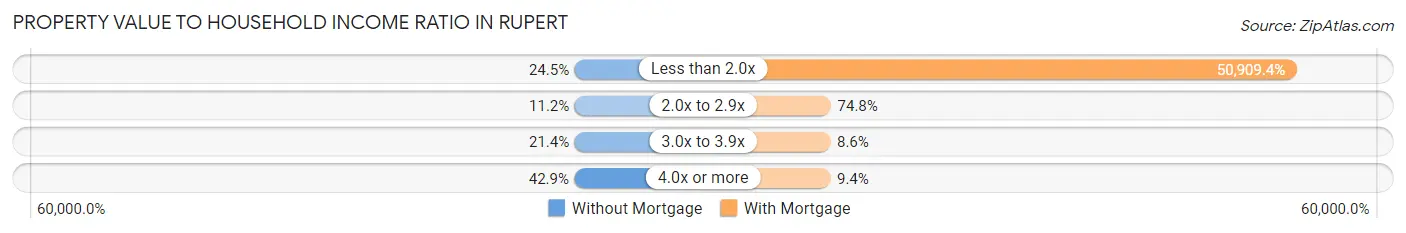
| Value-to-Income Ratio | Without Mortgage | With Mortgage |
| Less than 2.0x | 24 (24.5%) | 70,764 (50,909.4%) |
| 2.0x to 2.9x | 11 (11.2%) | 104 (74.8%) |
| 3.0x to 3.9x | 21 (21.4%) | 12 (8.6%) |
| 4.0x or more | 42 (42.9%) | 13 (9.3%) |
| Total | 98 (100.0%) | 139 (100.0%) |
Real Estate Taxes by Mortgage Status in Rupert
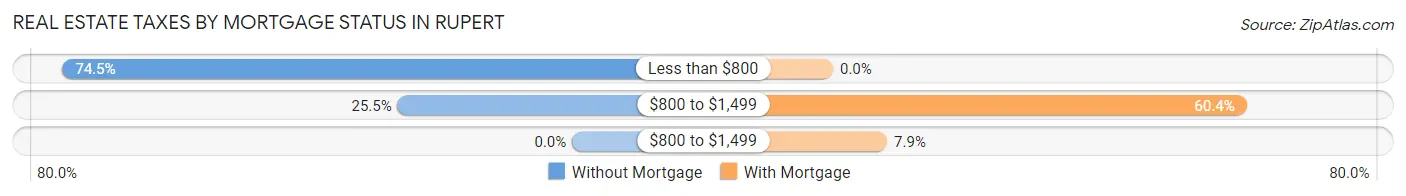
| Property Taxes | Without Mortgage | With Mortgage |
| Less than $800 | 73 (74.5%) | 0 (0.0%) |
| $800 to $1,499 | 25 (25.5%) | 84 (60.4%) |
| $800 to $1,499 | 0 (0.0%) | 11 (7.9%) |
| Total | 98 (100.0%) | 139 (100.0%) |
Health & Disability in Rupert
Health Insurance Coverage by Age in Rupert
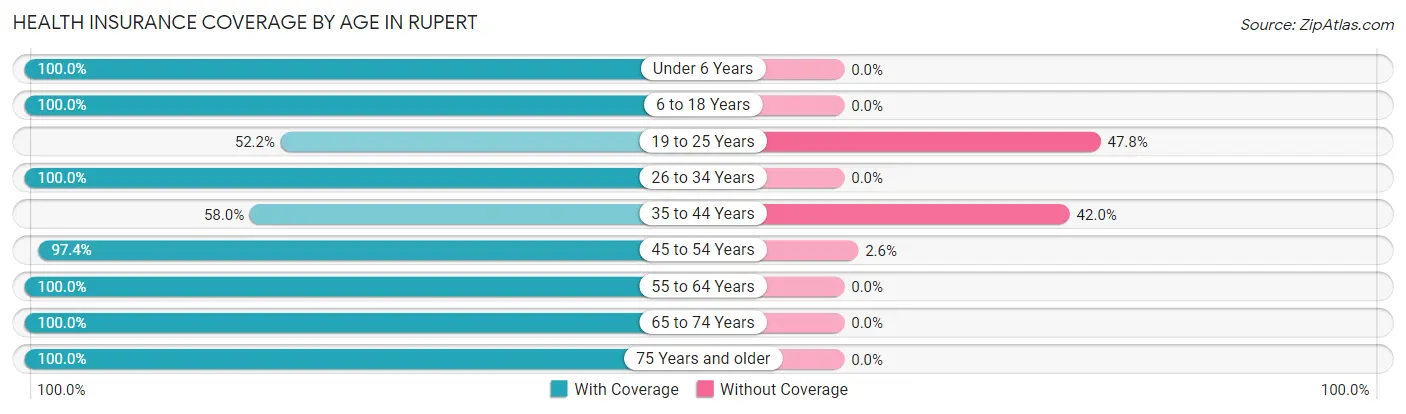
| Age Bracket | With Coverage | Without Coverage |
| Under 6 Years | 109 (100.0%) | 0 (0.0%) |
| 6 to 18 Years | 185 (100.0%) | 0 (0.0%) |
| 19 to 25 Years | 47 (52.2%) | 43 (47.8%) |
| 26 to 34 Years | 198 (100.0%) | 0 (0.0%) |
| 35 to 44 Years | 40 (58.0%) | 29 (42.0%) |
| 45 to 54 Years | 113 (97.4%) | 3 (2.6%) |
| 55 to 64 Years | 179 (100.0%) | 0 (0.0%) |
| 65 to 74 Years | 81 (100.0%) | 0 (0.0%) |
| 75 Years and older | 64 (100.0%) | 0 (0.0%) |
| Total | 1,016 (93.1%) | 75 (6.9%) |
Health Insurance Coverage by Citizenship Status in Rupert
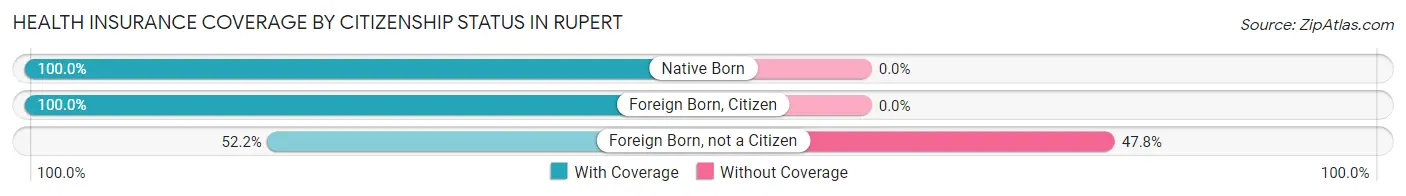
| Citizenship Status | With Coverage | Without Coverage |
| Native Born | 109 (100.0%) | 0 (0.0%) |
| Foreign Born, Citizen | 185 (100.0%) | 0 (0.0%) |
| Foreign Born, not a Citizen | 47 (52.2%) | 43 (47.8%) |
Health Insurance Coverage by Household Income in Rupert
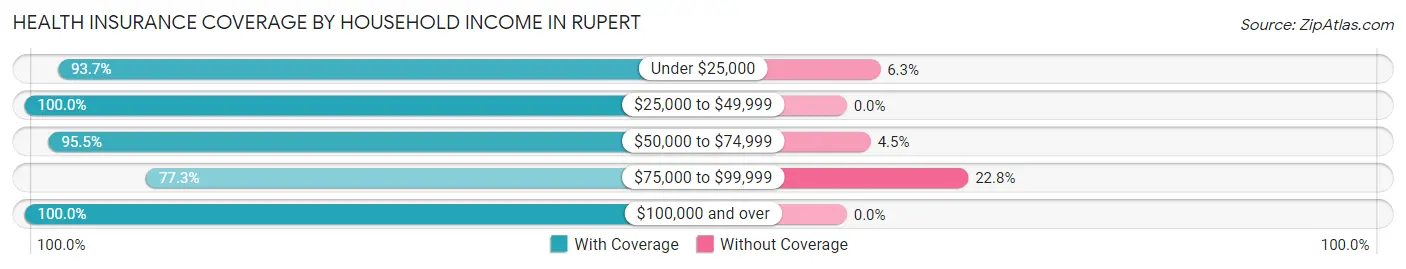
| Household Income | With Coverage | Without Coverage |
| Under $25,000 | 434 (93.7%) | 29 (6.3%) |
| $25,000 to $49,999 | 309 (100.0%) | 0 (0.0%) |
| $50,000 to $74,999 | 64 (95.5%) | 3 (4.5%) |
| $75,000 to $99,999 | 146 (77.2%) | 43 (22.8%) |
| $100,000 and over | 58 (100.0%) | 0 (0.0%) |
Public vs Private Health Insurance Coverage by Age in Rupert
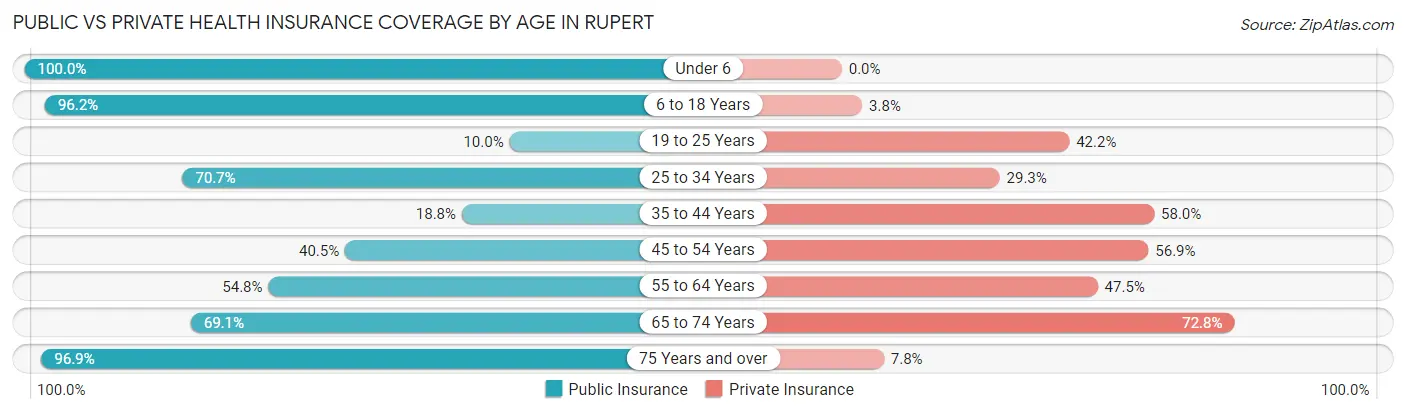
| Age Bracket | Public Insurance | Private Insurance |
| Under 6 | 109 (100.0%) | 0 (0.0%) |
| 6 to 18 Years | 178 (96.2%) | 7 (3.8%) |
| 19 to 25 Years | 9 (10.0%) | 38 (42.2%) |
| 25 to 34 Years | 140 (70.7%) | 58 (29.3%) |
| 35 to 44 Years | 13 (18.8%) | 40 (58.0%) |
| 45 to 54 Years | 47 (40.5%) | 66 (56.9%) |
| 55 to 64 Years | 98 (54.7%) | 85 (47.5%) |
| 65 to 74 Years | 56 (69.1%) | 59 (72.8%) |
| 75 Years and over | 62 (96.9%) | 5 (7.8%) |
| Total | 712 (65.3%) | 358 (32.8%) |
Disability Status by Sex by Age in Rupert
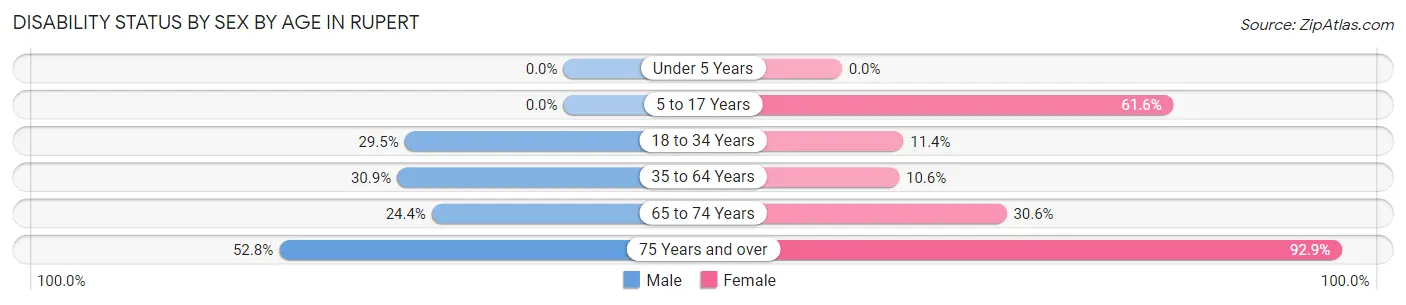
| Age Bracket | Male | Female |
| Under 5 Years | 0 (0.0%) | 0 (0.0%) |
| 5 to 17 Years | 0 (0.0%) | 109 (61.6%) |
| 18 to 34 Years | 46 (29.5%) | 16 (11.4%) |
| 35 to 64 Years | 63 (30.9%) | 17 (10.6%) |
| 65 to 74 Years | 11 (24.4%) | 11 (30.6%) |
| 75 Years and over | 19 (52.8%) | 26 (92.9%) |
Disability Class by Sex by Age in Rupert
Disability Class: Hearing Difficulty
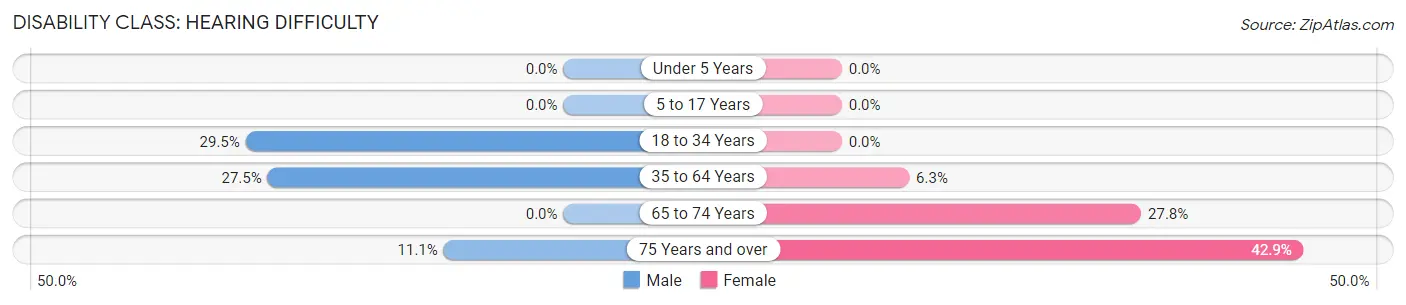
| Age Bracket | Male | Female |
| Under 5 Years | 0 (0.0%) | 0 (0.0%) |
| 5 to 17 Years | 0 (0.0%) | 0 (0.0%) |
| 18 to 34 Years | 46 (29.5%) | 0 (0.0%) |
| 35 to 64 Years | 56 (27.5%) | 10 (6.2%) |
| 65 to 74 Years | 0 (0.0%) | 10 (27.8%) |
| 75 Years and over | 4 (11.1%) | 12 (42.9%) |
Disability Class: Vision Difficulty
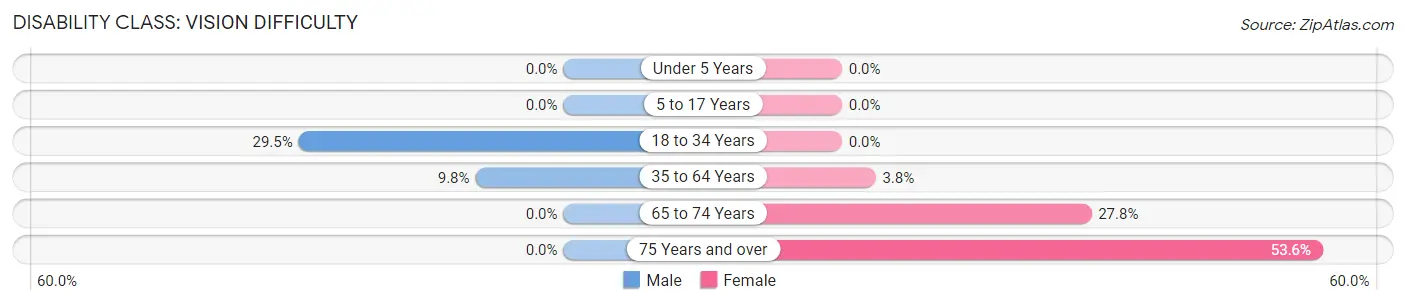
| Age Bracket | Male | Female |
| Under 5 Years | 0 (0.0%) | 0 (0.0%) |
| 5 to 17 Years | 0 (0.0%) | 0 (0.0%) |
| 18 to 34 Years | 46 (29.5%) | 0 (0.0%) |
| 35 to 64 Years | 20 (9.8%) | 6 (3.7%) |
| 65 to 74 Years | 0 (0.0%) | 10 (27.8%) |
| 75 Years and over | 0 (0.0%) | 15 (53.6%) |
Disability Class: Cognitive Difficulty
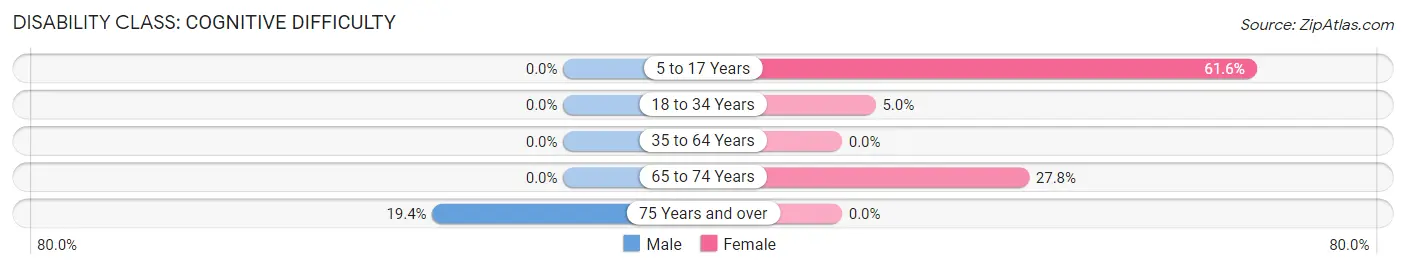
| Age Bracket | Male | Female |
| 5 to 17 Years | 0 (0.0%) | 109 (61.6%) |
| 18 to 34 Years | 0 (0.0%) | 7 (5.0%) |
| 35 to 64 Years | 0 (0.0%) | 0 (0.0%) |
| 65 to 74 Years | 0 (0.0%) | 10 (27.8%) |
| 75 Years and over | 7 (19.4%) | 0 (0.0%) |
Disability Class: Ambulatory Difficulty
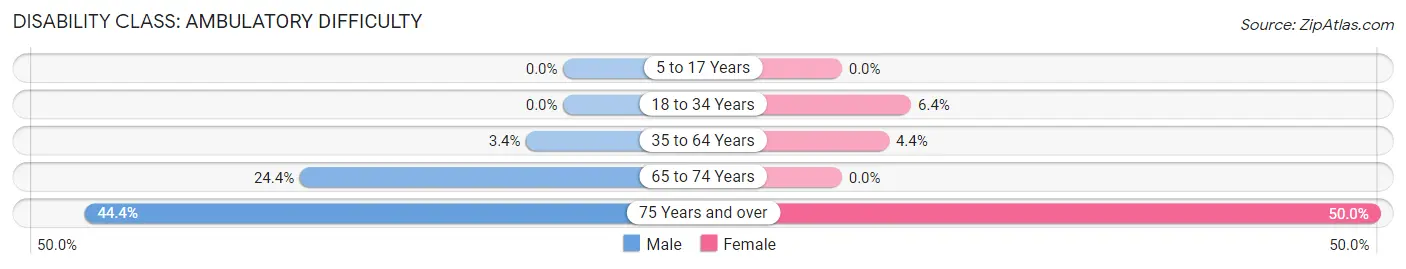
| Age Bracket | Male | Female |
| 5 to 17 Years | 0 (0.0%) | 0 (0.0%) |
| 18 to 34 Years | 0 (0.0%) | 9 (6.4%) |
| 35 to 64 Years | 7 (3.4%) | 7 (4.4%) |
| 65 to 74 Years | 11 (24.4%) | 0 (0.0%) |
| 75 Years and over | 16 (44.4%) | 14 (50.0%) |
Disability Class: Self-Care Difficulty
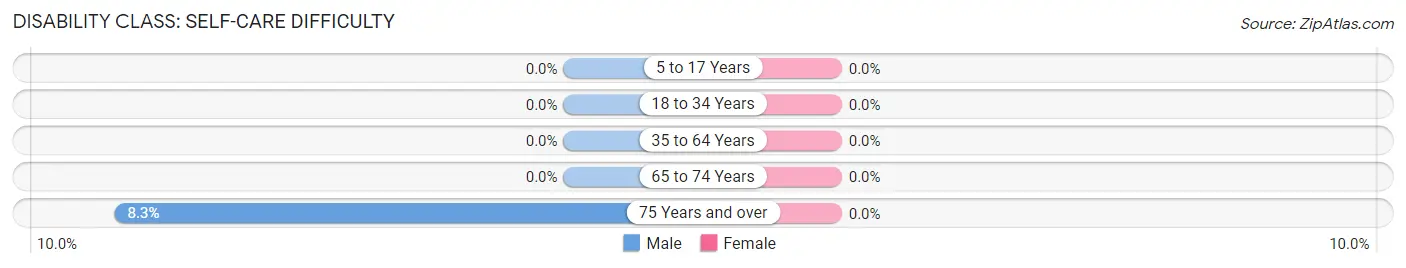
| Age Bracket | Male | Female |
| 5 to 17 Years | 0 (0.0%) | 0 (0.0%) |
| 18 to 34 Years | 0 (0.0%) | 0 (0.0%) |
| 35 to 64 Years | 0 (0.0%) | 0 (0.0%) |
| 65 to 74 Years | 0 (0.0%) | 0 (0.0%) |
| 75 Years and over | 3 (8.3%) | 0 (0.0%) |
Technology Access in Rupert
Computing Device Access in Rupert
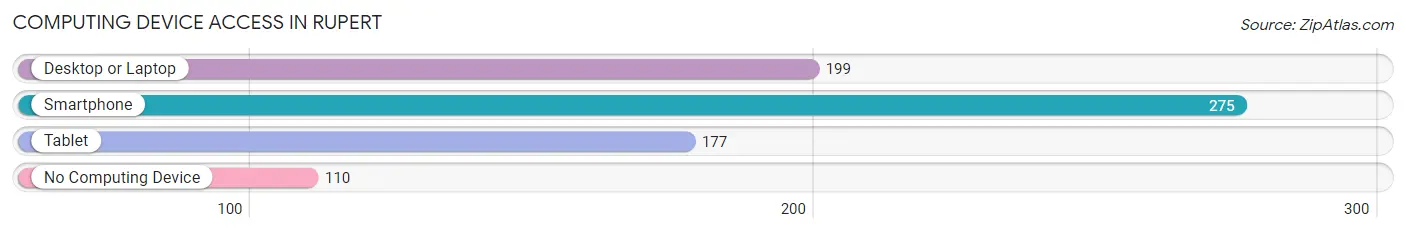
| Device Type | # Households | % Households |
| Desktop or Laptop | 199 | 48.4% |
| Smartphone | 275 | 66.9% |
| Tablet | 177 | 43.1% |
| No Computing Device | 110 | 26.8% |
| Total | 411 | 100.0% |
Internet Access in Rupert
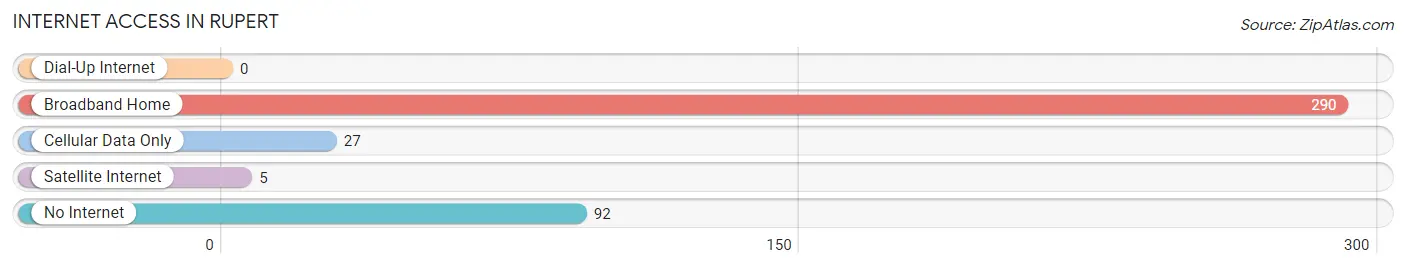
| Internet Type | # Households | % Households |
| Dial-Up Internet | 0 | 0.0% |
| Broadband Home | 290 | 70.6% |
| Cellular Data Only | 27 | 6.6% |
| Satellite Internet | 5 | 1.2% |
| No Internet | 92 | 22.4% |
| Total | 411 | 100.0% |
Rupert Summary
Rupert, West Virginia is a small town located in Greenbrier County, in the southeastern part of the state. It is situated in the Appalachian Mountains, and is part of the larger Greenbrier Valley region. The town has a population of just over 500 people, and is known for its rural charm and small-town atmosphere.
History
Rupert was founded in 1883 by a group of settlers from Pennsylvania. The town was named after Rupert, Pennsylvania, the hometown of the settlers. The town was originally a farming community, and the settlers grew a variety of crops, including corn, wheat, and tobacco. The town also had a sawmill and a gristmill, which provided lumber and grain for the local community.
In the early 1900s, the town began to grow and develop. The railroad came to Rupert in 1906, and the town became a stop on the Chesapeake and Ohio Railway. This allowed the town to become more connected to the outside world, and it began to attract more businesses and residents.
In the 1920s, the town experienced a period of growth and prosperity. The population increased, and new businesses opened, including a bank, a hotel, and a movie theater. The town also had a thriving music scene, and was home to several popular bands.
Geography
Rupert is located in the southeastern part of West Virginia, in the Appalachian Mountains. The town is situated in the Greenbrier Valley, and is surrounded by rolling hills and forests. The town is located near the Greenbrier River, and is just a few miles from the New River Gorge National Park.
The climate in Rupert is temperate, with hot summers and cold winters. The average temperature in the summer is around 75 degrees Fahrenheit, and the average temperature in the winter is around 35 degrees Fahrenheit. The town receives an average of 40 inches of precipitation each year.
Economy
Rupert’s economy is largely based on tourism and agriculture. The town is home to several popular tourist attractions, including the Greenbrier River Trail, the New River Gorge National Park, and the Greenbrier Valley Railroad. The town also has several farms, which produce a variety of crops, including corn, wheat, and tobacco.
The town also has several small businesses, including restaurants, shops, and a movie theater. The town is also home to several manufacturing companies, which produce a variety of products, including furniture, clothing, and electronics.
Demographics
As of the 2010 census, Rupert had a population of 517 people. The racial makeup of the town was 97.3% White, 0.6% African American, 0.2% Native American, 0.2% Asian, 0.2% from other races, and 1.6% from two or more races. The median household income was $30,000, and the median age was 44.
Rupert is a small, rural town with a strong sense of community. The town is known for its friendly atmosphere and its commitment to preserving its rural charm. The town is also home to several popular tourist attractions, and is a popular destination for outdoor enthusiasts.
Common Questions
What is Per Capita Income in Rupert?
Per Capita income in Rupert is $15,904.
What is the Median Family Income in Rupert?
Median Family Income in Rupert is $25,676.
What is the Median Household income in Rupert?
Median Household Income in Rupert is $27,244.
What is Income or Wage Gap in Rupert?
Income or Wage Gap in Rupert is 0.9%.
Women in Rupert earn 99.1 cents for every dollar earned by a man.
What is Inequality or Gini Index in Rupert?
Inequality or Gini Index in Rupert is 0.45.
What is the Total Population of Rupert?
Total Population of Rupert is 1,093.
What is the Total Male Population of Rupert?
Total Male Population of Rupert is 521.
What is the Total Female Population of Rupert?
Total Female Population of Rupert is 572.
What is the Ratio of Males per 100 Females in Rupert?
There are 91.08 Males per 100 Females in Rupert.
What is the Ratio of Females per 100 Males in Rupert?
There are 109.79 Females per 100 Males in Rupert.
What is the Median Population Age in Rupert?
Median Population Age in Rupert is 34.6 Years.
What is the Average Family Size in Rupert
Average Family Size in Rupert is 2.9 People.
What is the Average Household Size in Rupert
Average Household Size in Rupert is 2.6 People.
How Large is the Labor Force in Rupert?
There are 451 People in the Labor Forcein in Rupert.
What is the Percentage of People in the Labor Force in Rupert?
55.9% of People are in the Labor Force in Rupert.
What is the Unemployment Rate in Rupert?
Unemployment Rate in Rupert is 2.4%.