Grafton, WV Map & Demographics
Grafton Map
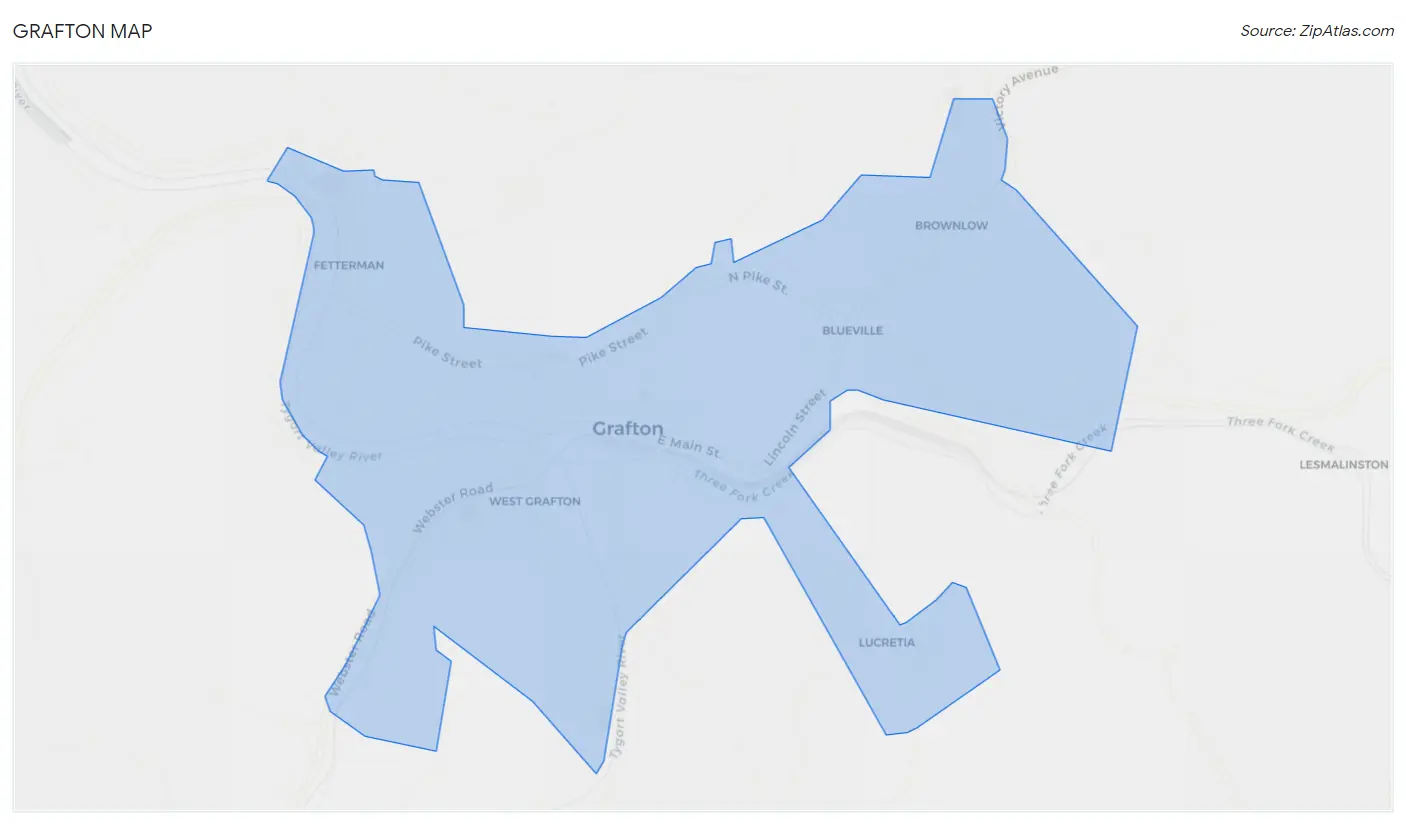
Grafton Overview
$21,466
PER CAPITA INCOME
$46,386
AVG FAMILY INCOME
$38,934
AVG HOUSEHOLD INCOME
9.3%
WAGE / INCOME GAP [ % ]
90.7¢/ $1
WAGE / INCOME GAP [ $ ]
$17,036
FAMILY INCOME DEFICIT
0.45
INEQUALITY / GINI INDEX
4,711
TOTAL POPULATION
2,426
MALE POPULATION
2,285
FEMALE POPULATION
106.17
MALES / 100 FEMALES
94.19
FEMALES / 100 MALES
39.2
MEDIAN AGE
3.0
AVG FAMILY SIZE
2.4
AVG HOUSEHOLD SIZE
2,132
LABOR FORCE [ PEOPLE ]
56.6%
PERCENT IN LABOR FORCE
11.3%
UNEMPLOYMENT RATE
Grafton Zip Codes
Grafton Area Codes
Income in Grafton
Income Overview in Grafton
Per Capita Income in Grafton is $21,466, while median incomes of families and households are $46,386 and $38,934 respectively.
| Characteristic | Number | Measure |
| Per Capita Income | 4,711 | $21,466 |
| Median Family Income | 1,198 | $46,386 |
| Mean Family Income | 1,198 | $62,537 |
| Median Household Income | 1,897 | $38,934 |
| Mean Household Income | 1,897 | $52,541 |
| Income Deficit | 1,198 | $17,036 |
| Wage / Income Gap (%) | 4,711 | 9.27% |
| Wage / Income Gap ($) | 4,711 | 90.73¢ per $1 |
| Gini / Inequality Index | 4,711 | 0.45 |
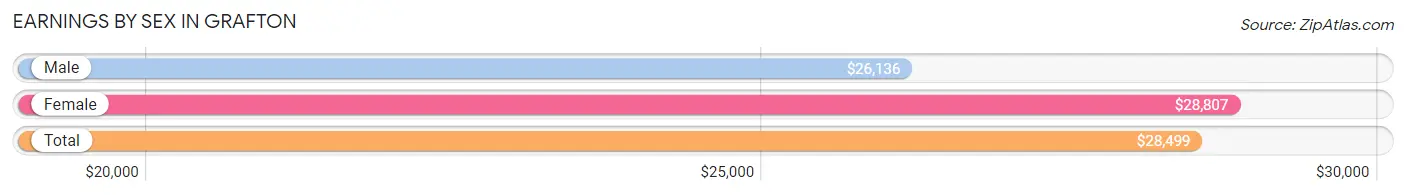
Earnings by Sex in Grafton
Average Earnings in Grafton are $28,499, $26,136 for men and $28,807 for women, a difference of 9.3%.
| Sex | Number | Average Earnings |
| Male | 1,160 (50.7%) | $26,136 |
| Female | 1,129 (49.3%) | $28,807 |
| Total | 2,289 (100.0%) | $28,499 |
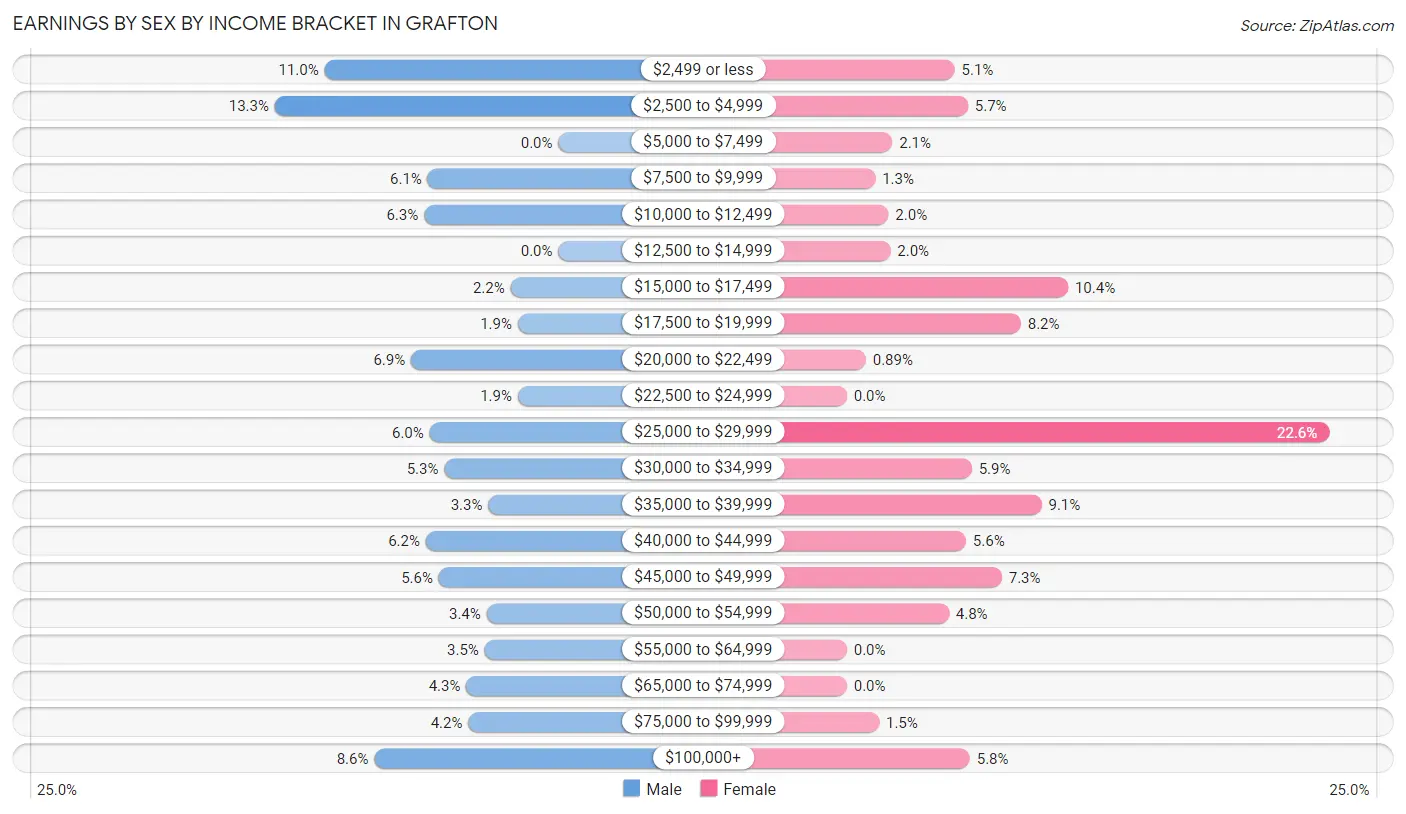
Earnings by Sex by Income Bracket in Grafton
The most common earnings brackets in Grafton are $2,500 to $4,999 for men (154 | 13.3%) and $25,000 to $29,999 for women (255 | 22.6%).
| Income | Male | Female |
| $2,499 or less | 127 (11.0%) | 57 (5.1%) |
| $2,500 to $4,999 | 154 (13.3%) | 64 (5.7%) |
| $5,000 to $7,499 | 0 (0.0%) | 24 (2.1%) |
| $7,500 to $9,999 | 71 (6.1%) | 15 (1.3%) |
| $10,000 to $12,499 | 73 (6.3%) | 22 (1.9%) |
| $12,500 to $14,999 | 0 (0.0%) | 23 (2.0%) |
| $15,000 to $17,499 | 26 (2.2%) | 117 (10.4%) |
| $17,500 to $19,999 | 22 (1.9%) | 92 (8.2%) |
| $20,000 to $22,499 | 80 (6.9%) | 10 (0.9%) |
| $22,500 to $24,999 | 22 (1.9%) | 0 (0.0%) |
| $25,000 to $29,999 | 70 (6.0%) | 255 (22.6%) |
| $30,000 to $34,999 | 62 (5.3%) | 66 (5.9%) |
| $35,000 to $39,999 | 38 (3.3%) | 103 (9.1%) |
| $40,000 to $44,999 | 72 (6.2%) | 63 (5.6%) |
| $45,000 to $49,999 | 65 (5.6%) | 82 (7.3%) |
| $50,000 to $54,999 | 39 (3.4%) | 54 (4.8%) |
| $55,000 to $64,999 | 40 (3.5%) | 0 (0.0%) |
| $65,000 to $74,999 | 50 (4.3%) | 0 (0.0%) |
| $75,000 to $99,999 | 49 (4.2%) | 17 (1.5%) |
| $100,000+ | 100 (8.6%) | 65 (5.8%) |
| Total | 1,160 (100.0%) | 1,129 (100.0%) |
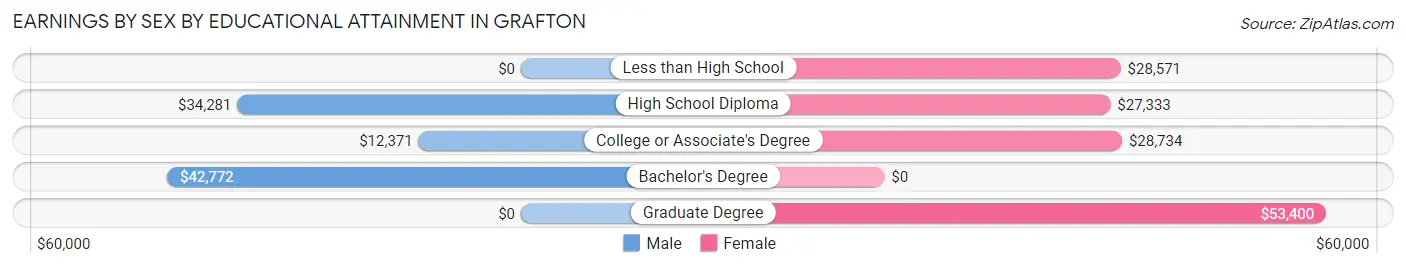
Earnings by Sex by Educational Attainment in Grafton
Average earnings in Grafton are $29,555 for men and $29,141 for women, a difference of 1.4%. Men with an educational attainment of bachelor's degree enjoy the highest average annual earnings of $42,772, while those with college or associate's degree education earn the least with $12,371. Women with an educational attainment of graduate degree earn the most with the average annual earnings of $53,400, while those with high school diploma education have the smallest earnings of $27,333.
| Educational Attainment | Male Income | Female Income |
| Less than High School | - | - |
| High School Diploma | $34,281 | $27,333 |
| College or Associate's Degree | $12,371 | $28,734 |
| Bachelor's Degree | $42,772 | $0 |
| Graduate Degree | - | - |
| Total | $29,555 | $29,141 |
Family Income in Grafton
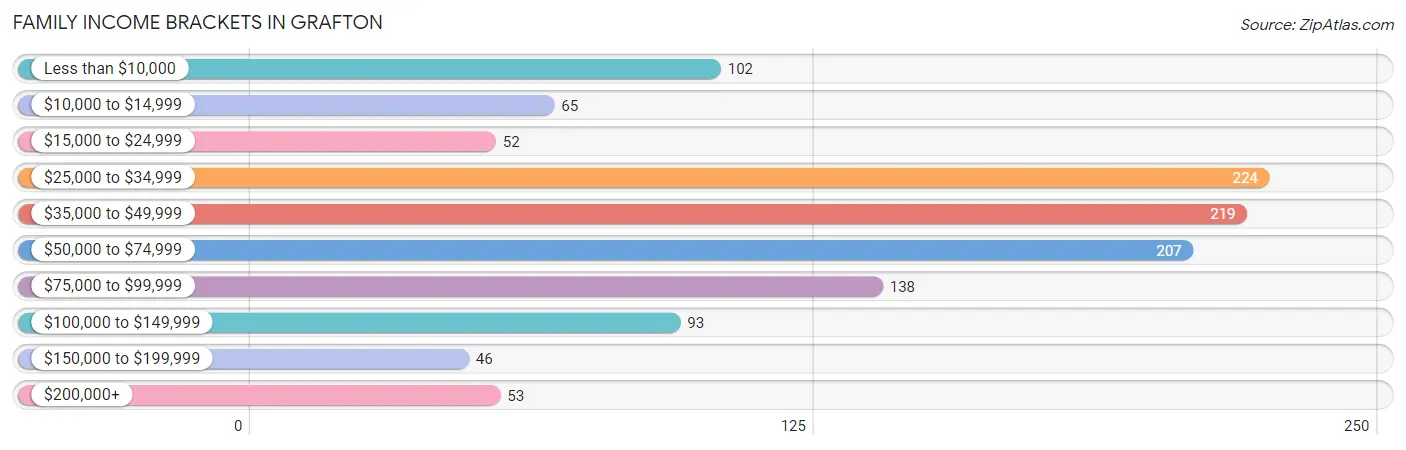
Family Income Brackets in Grafton
According to the Grafton family income data, there are 224 families falling into the $25,000 to $34,999 income range, which is the most common income bracket and makes up 18.7% of all families. Conversely, the $150,000 to $199,999 income bracket is the least frequent group with only 46 families (3.8%) belonging to this category.
| Income Bracket | # Families | % Families |
| Less than $10,000 | 102 | 8.5% |
| $10,000 to $14,999 | 65 | 5.4% |
| $15,000 to $24,999 | 52 | 4.3% |
| $25,000 to $34,999 | 224 | 18.7% |
| $35,000 to $49,999 | 219 | 18.3% |
| $50,000 to $74,999 | 207 | 17.3% |
| $75,000 to $99,999 | 138 | 11.5% |
| $100,000 to $149,999 | 93 | 7.8% |
| $150,000 to $199,999 | 46 | 3.8% |
| $200,000+ | 53 | 4.4% |
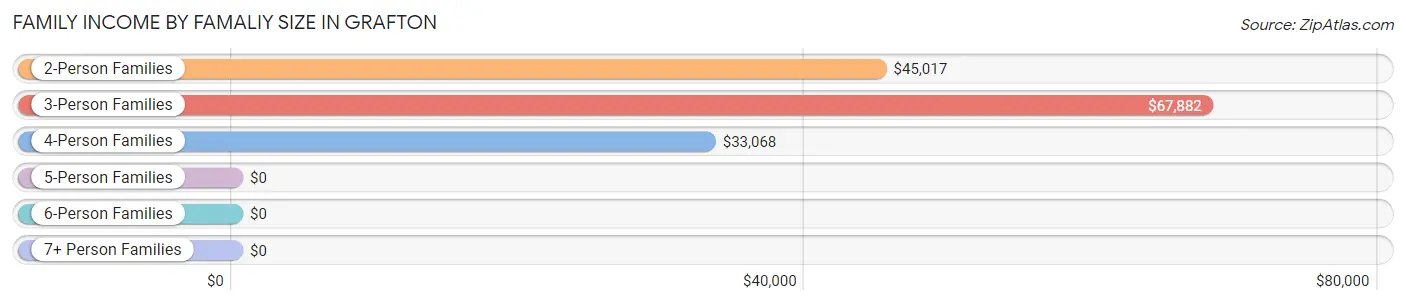
Family Income by Famaliy Size in Grafton
3-person families (217 | 18.1%) account for the highest median family income in Grafton with $67,882 per family, while 3-person families (217 | 18.1%) have the highest median income of $22,627 per family member.
| Income Bracket | # Families | Median Income |
| 2-Person Families | 689 (57.5%) | $45,017 |
| 3-Person Families | 217 (18.1%) | $67,882 |
| 4-Person Families | 148 (12.3%) | $33,068 |
| 5-Person Families | 89 (7.4%) | $0 |
| 6-Person Families | 26 (2.2%) | $0 |
| 7+ Person Families | 29 (2.4%) | $0 |
| Total | 1,198 (100.0%) | $46,386 |
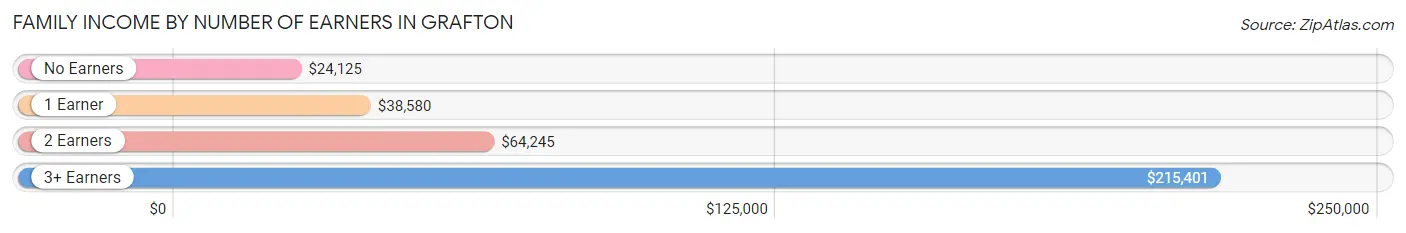
Family Income by Number of Earners in Grafton
The median family income in Grafton is $46,386, with families comprising 3+ earners (89) having the highest median family income of $215,401, while families with no earners (141) have the lowest median family income of $24,125, accounting for 7.4% and 11.8% of families, respectively.
| Number of Earners | # Families | Median Income |
| No Earners | 141 (11.8%) | $24,125 |
| 1 Earner | 610 (50.9%) | $38,580 |
| 2 Earners | 358 (29.9%) | $64,245 |
| 3+ Earners | 89 (7.4%) | $215,401 |
| Total | 1,198 (100.0%) | $46,386 |
Household Income in Grafton
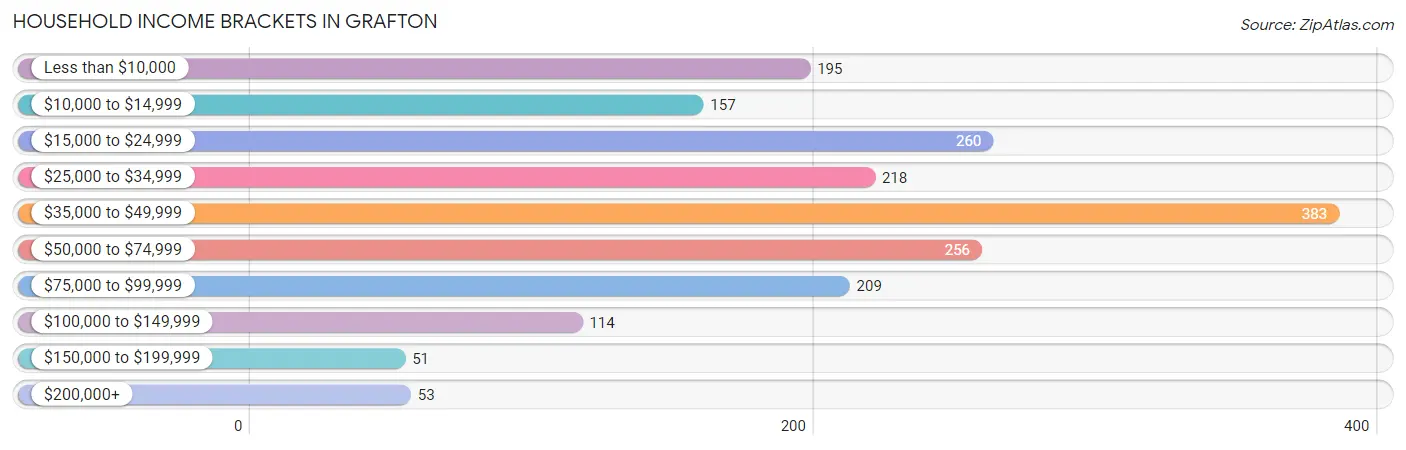
Household Income Brackets in Grafton
With 383 households falling in the category, the $35,000 to $49,999 income range is the most frequent in Grafton, accounting for 20.2% of all households. In contrast, only 51 households (2.7%) fall into the $150,000 to $199,999 income bracket, making it the least populous group.
| Income Bracket | # Households | % Households |
| Less than $10,000 | 195 | 10.3% |
| $10,000 to $14,999 | 157 | 8.3% |
| $15,000 to $24,999 | 260 | 13.7% |
| $25,000 to $34,999 | 218 | 11.5% |
| $35,000 to $49,999 | 383 | 20.2% |
| $50,000 to $74,999 | 256 | 13.5% |
| $75,000 to $99,999 | 209 | 11.0% |
| $100,000 to $149,999 | 114 | 6.0% |
| $150,000 to $199,999 | 51 | 2.7% |
| $200,000+ | 53 | 2.8% |
Household Income by Householder Age in Grafton
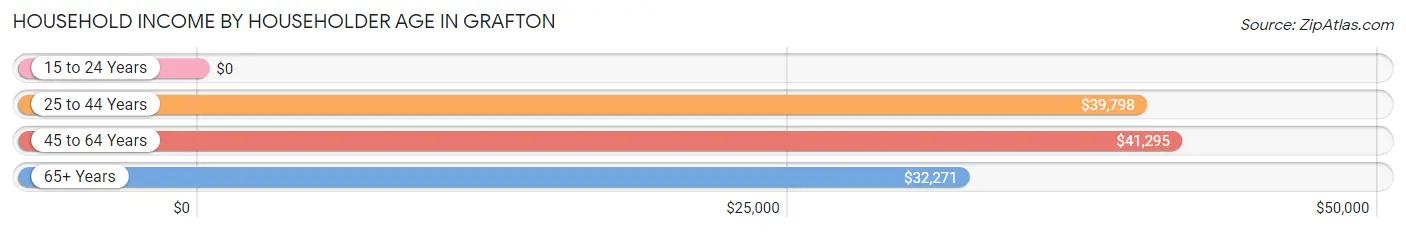
The median household income in Grafton is $38,934, with the highest median household income of $41,295 found in the 45 to 64 years age bracket for the primary householder. A total of 757 households (39.9%) fall into this category. Meanwhile, the 15 to 24 years age bracket for the primary householder has the lowest median household income of $0, with 57 households (3.0%) in this group.
| Income Bracket | # Households | Median Income |
| 15 to 24 Years | 57 (3.0%) | $0 |
| 25 to 44 Years | 626 (33.0%) | $39,798 |
| 45 to 64 Years | 757 (39.9%) | $41,295 |
| 65+ Years | 457 (24.1%) | $32,271 |
| Total | 1,897 (100.0%) | $38,934 |
Poverty in Grafton
Income Below Poverty by Sex and Age in Grafton
With 30.0% poverty level for males and 24.3% for females among the residents of Grafton, 12 to 14 year old males and 15 year old females are the most vulnerable to poverty, with 18 males (100.0%) and 46 females (100.0%) in their respective age groups living below the poverty level.
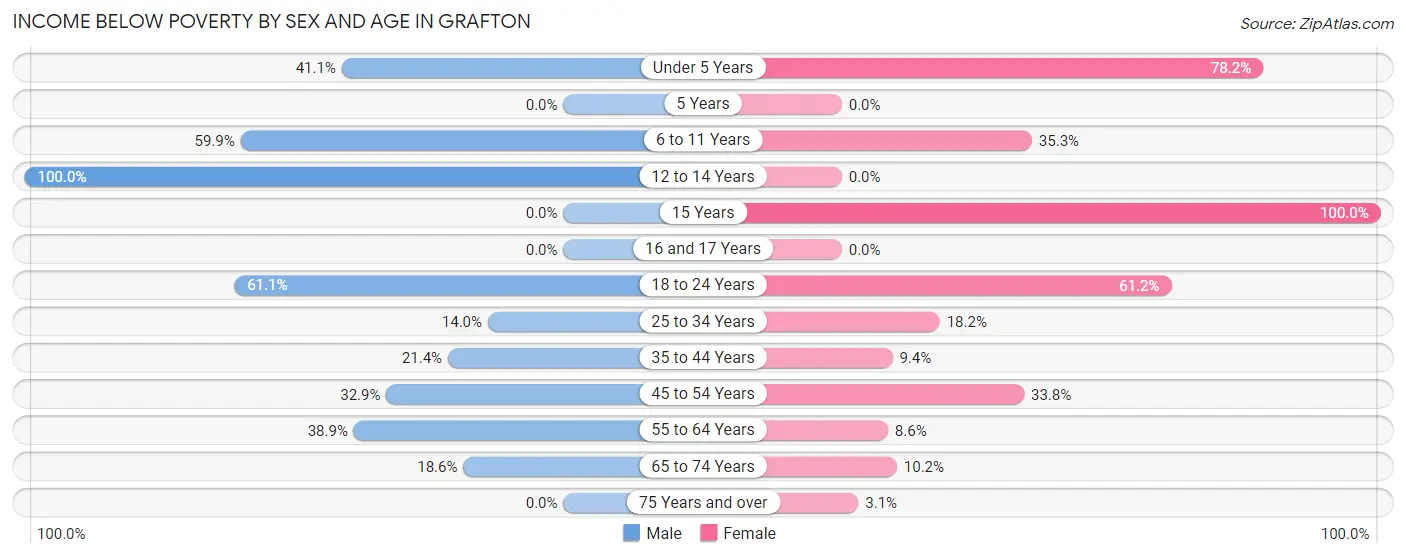
| Age Bracket | Male | Female |
| Under 5 Years | 72 (41.1%) | 86 (78.2%) |
| 5 Years | 0 (0.0%) | 0 (0.0%) |
| 6 to 11 Years | 136 (59.9%) | 54 (35.3%) |
| 12 to 14 Years | 18 (100.0%) | 0 (0.0%) |
| 15 Years | 0 (0.0%) | 46 (100.0%) |
| 16 and 17 Years | 0 (0.0%) | 0 (0.0%) |
| 18 to 24 Years | 113 (61.1%) | 137 (61.2%) |
| 25 to 34 Years | 43 (14.0%) | 46 (18.2%) |
| 35 to 44 Years | 75 (21.4%) | 32 (9.4%) |
| 45 to 54 Years | 116 (32.9%) | 91 (33.8%) |
| 55 to 64 Years | 121 (38.9%) | 25 (8.6%) |
| 65 to 74 Years | 26 (18.6%) | 19 (10.2%) |
| 75 Years and over | 0 (0.0%) | 7 (3.1%) |
| Total | 720 (30.0%) | 543 (24.3%) |
Income Above Poverty by Sex and Age in Grafton
According to the poverty statistics in Grafton, males aged 5 years and females aged 12 to 14 years are the age groups that are most secure financially, with 100.0% of males and 100.0% of females in these age groups living above the poverty line.
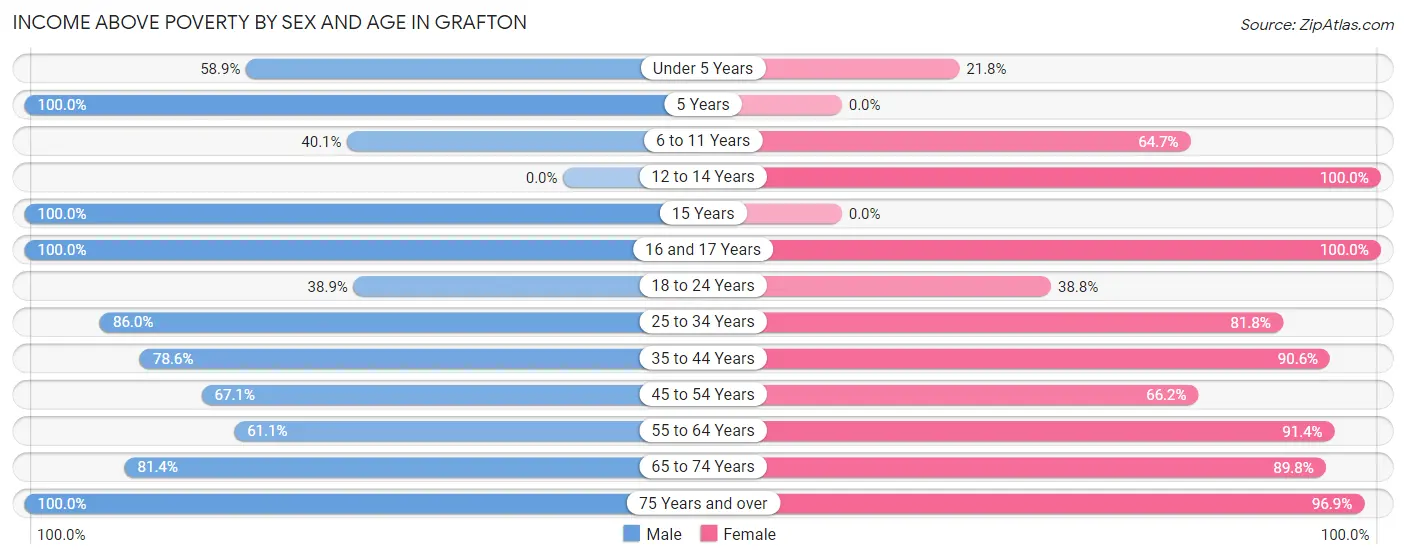
| Age Bracket | Male | Female |
| Under 5 Years | 103 (58.9%) | 24 (21.8%) |
| 5 Years | 36 (100.0%) | 0 (0.0%) |
| 6 to 11 Years | 91 (40.1%) | 99 (64.7%) |
| 12 to 14 Years | 0 (0.0%) | 107 (100.0%) |
| 15 Years | 65 (100.0%) | 0 (0.0%) |
| 16 and 17 Years | 113 (100.0%) | 28 (100.0%) |
| 18 to 24 Years | 72 (38.9%) | 87 (38.8%) |
| 25 to 34 Years | 264 (86.0%) | 207 (81.8%) |
| 35 to 44 Years | 275 (78.6%) | 308 (90.6%) |
| 45 to 54 Years | 237 (67.1%) | 178 (66.2%) |
| 55 to 64 Years | 190 (61.1%) | 267 (91.4%) |
| 65 to 74 Years | 114 (81.4%) | 167 (89.8%) |
| 75 Years and over | 117 (100.0%) | 221 (96.9%) |
| Total | 1,677 (70.0%) | 1,693 (75.7%) |
Income Below Poverty Among Married-Couple Families in Grafton
The poverty statistics for married-couple families in Grafton show that 14.2% or 105 of the total 737 families live below the poverty line. Families with 3 or 4 children have the highest poverty rate of 26.9%, comprising of 29 families. On the other hand, families with no children have the lowest poverty rate of 9.6%, which includes 44 families.
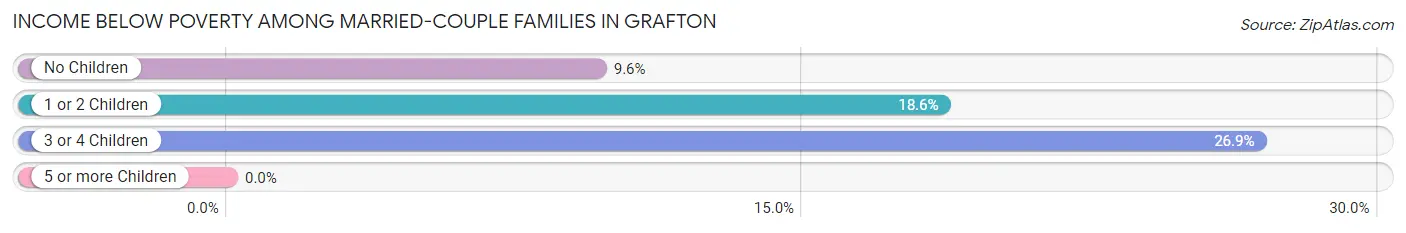
| Children | Above Poverty | Below Poverty |
| No Children | 413 (90.4%) | 44 (9.6%) |
| 1 or 2 Children | 140 (81.4%) | 32 (18.6%) |
| 3 or 4 Children | 79 (73.2%) | 29 (26.9%) |
| 5 or more Children | 0 (0.0%) | 0 (0.0%) |
| Total | 632 (85.8%) | 105 (14.2%) |
Income Below Poverty Among Single-Parent Households in Grafton
According to the poverty data in Grafton, 29.9% or 61 single-father households and 14.0% or 36 single-mother households are living below the poverty line. Among single-father households, those with 3 or 4 children have the highest poverty rate, with 30 households (100.0%) experiencing poverty. Likewise, among single-mother households, those with 3 or 4 children have the highest poverty rate, with 13 households (100.0%) falling below the poverty line.
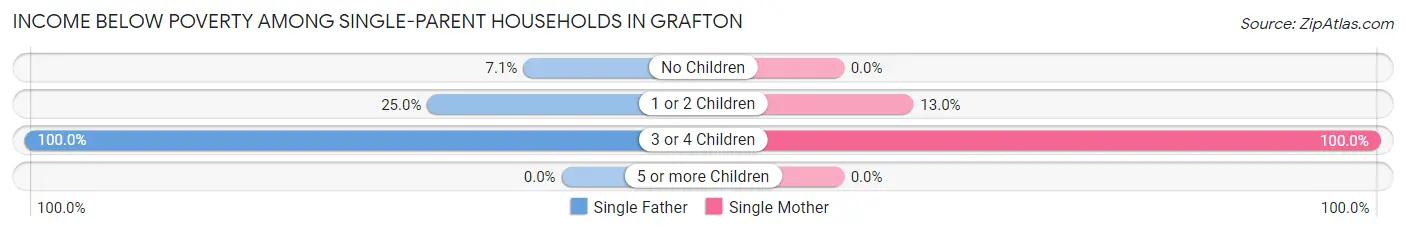
| Children | Single Father | Single Mother |
| No Children | 5 (7.1%) | 0 (0.0%) |
| 1 or 2 Children | 26 (25.0%) | 23 (13.0%) |
| 3 or 4 Children | 30 (100.0%) | 13 (100.0%) |
| 5 or more Children | 0 (0.0%) | 0 (0.0%) |
| Total | 61 (29.9%) | 36 (14.0%) |
Income Below Poverty Among Married-Couple vs Single-Parent Households in Grafton
The poverty data for Grafton shows that 105 of the married-couple family households (14.2%) and 97 of the single-parent households (21.0%) are living below the poverty level. Within the married-couple family households, those with 3 or 4 children have the highest poverty rate, with 29 households (26.9%) falling below the poverty line. Among the single-parent households, those with 3 or 4 children have the highest poverty rate, with 43 household (100.0%) living below poverty.
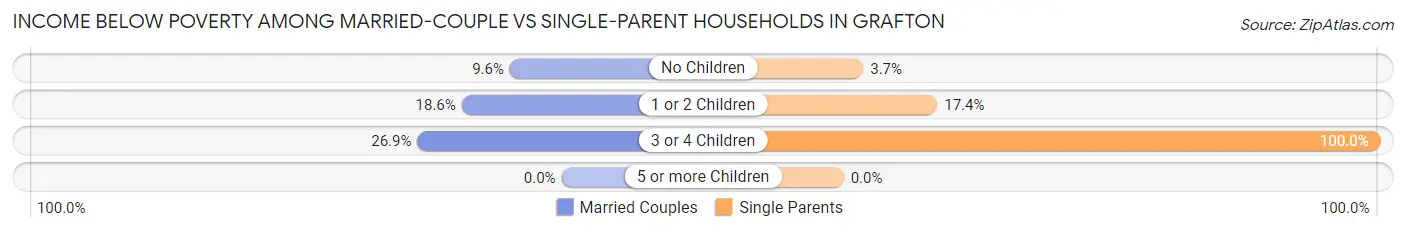
| Children | Married-Couple Families | Single-Parent Households |
| No Children | 44 (9.6%) | 5 (3.6%) |
| 1 or 2 Children | 32 (18.6%) | 49 (17.4%) |
| 3 or 4 Children | 29 (26.9%) | 43 (100.0%) |
| 5 or more Children | 0 (0.0%) | 0 (0.0%) |
| Total | 105 (14.2%) | 97 (21.0%) |
Race in Grafton
The most populous races in Grafton are White / Caucasian (4,526 | 96.1%), Two or more Races (171 | 3.6%), and Hispanic or Latino (33 | 0.7%).
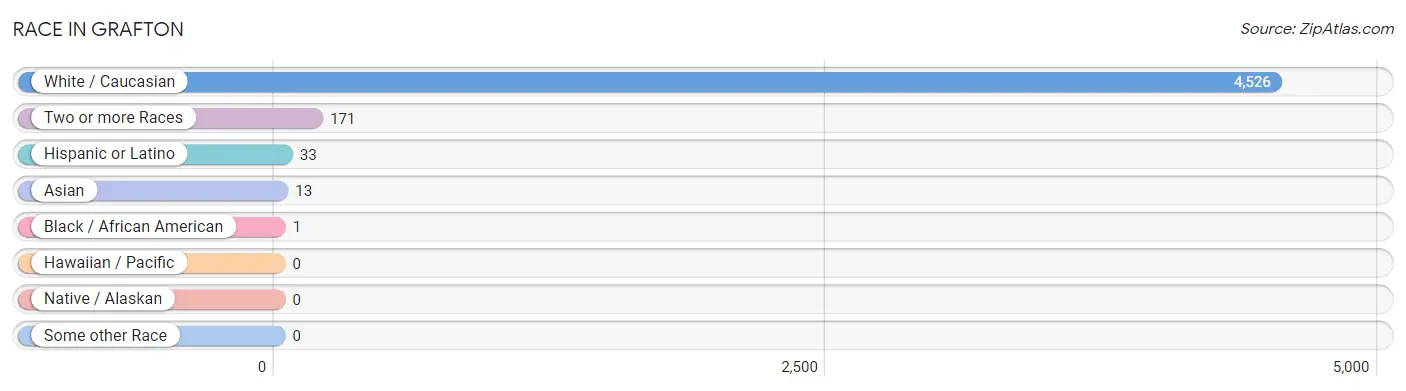
| Race | # Population | % Population |
| Asian | 13 | 0.3% |
| Black / African American | 1 | 0.0% |
| Hawaiian / Pacific | 0 | 0.0% |
| Hispanic or Latino | 33 | 0.7% |
| Native / Alaskan | 0 | 0.0% |
| White / Caucasian | 4,526 | 96.1% |
| Two or more Races | 171 | 3.6% |
| Some other Race | 0 | 0.0% |
| Total | 4,711 | 100.0% |
Ancestry in Grafton
The most populous ancestries reported in Grafton are American (1,051 | 22.3%), Irish (815 | 17.3%), German (795 | 16.9%), Italian (367 | 7.8%), and English (325 | 6.9%), together accounting for 71.2% of all Grafton residents.
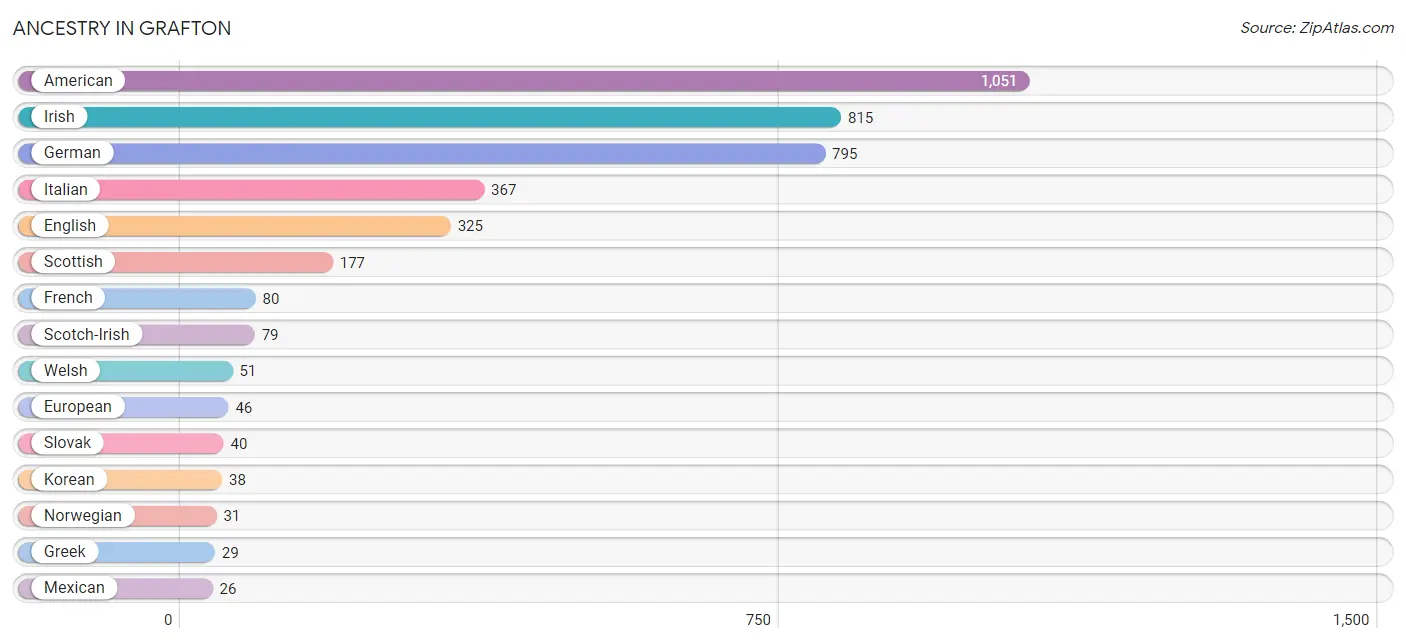
| Ancestry | # Population | % Population |
| American | 1,051 | 22.3% |
| Blackfeet | 3 | 0.1% |
| British | 7 | 0.2% |
| Choctaw | 7 | 0.2% |
| Dutch | 22 | 0.5% |
| English | 325 | 6.9% |
| Ethiopian | 8 | 0.2% |
| European | 46 | 1.0% |
| French | 80 | 1.7% |
| German | 795 | 16.9% |
| Greek | 29 | 0.6% |
| Hungarian | 19 | 0.4% |
| Indian (Asian) | 13 | 0.3% |
| Irish | 815 | 17.3% |
| Italian | 367 | 7.8% |
| Korean | 38 | 0.8% |
| Mexican | 26 | 0.5% |
| Northern European | 12 | 0.3% |
| Norwegian | 31 | 0.7% |
| Scotch-Irish | 79 | 1.7% |
| Scottish | 177 | 3.8% |
| Slovak | 40 | 0.9% |
| Spanish | 7 | 0.2% |
| Subsaharan African | 8 | 0.2% |
| Welsh | 51 | 1.1% | View All 25 Rows |
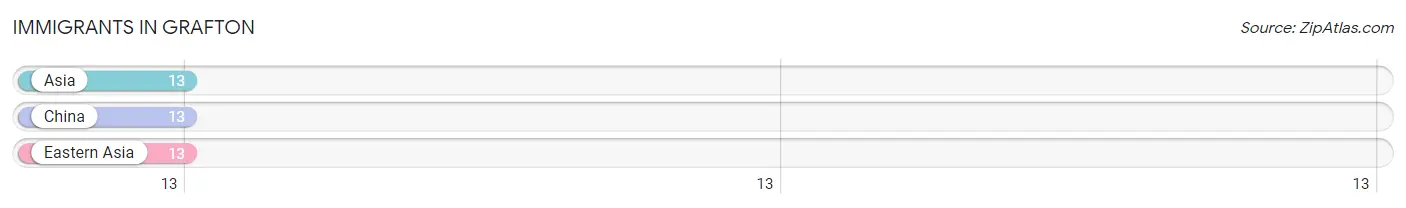
Immigrants in Grafton
The most numerous immigrant groups reported in Grafton came from Asia (13 | 0.3%), China (13 | 0.3%), and Eastern Asia (13 | 0.3%), together accounting for 0.8% of all Grafton residents.
| Immigration Origin | # Population | % Population |
| Asia | 13 | 0.3% |
| China | 13 | 0.3% |
| Eastern Asia | 13 | 0.3% | View All 3 Rows |
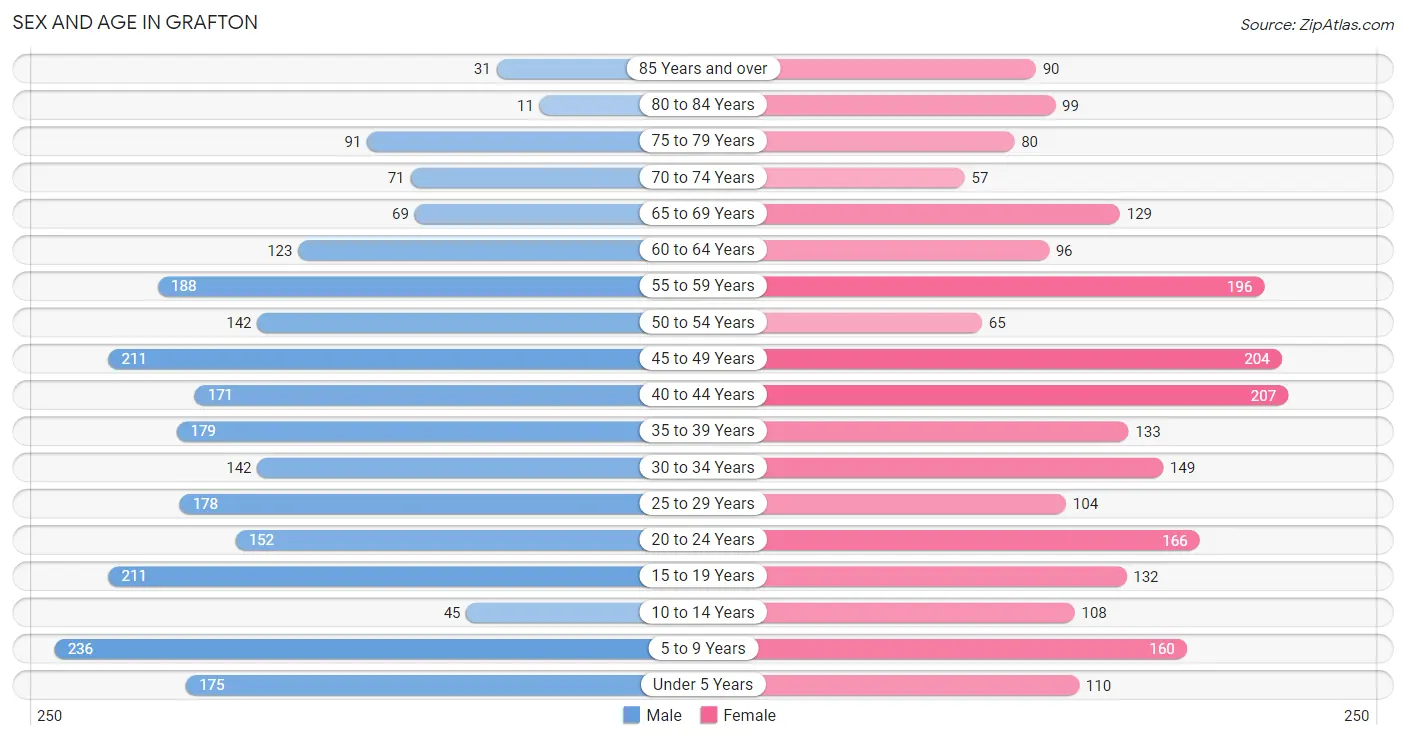
Sex and Age in Grafton
Sex and Age in Grafton
The most populous age groups in Grafton are 5 to 9 Years (236 | 9.7%) for men and 40 to 44 Years (207 | 9.1%) for women.
| Age Bracket | Male | Female |
| Under 5 Years | 175 (7.2%) | 110 (4.8%) |
| 5 to 9 Years | 236 (9.7%) | 160 (7.0%) |
| 10 to 14 Years | 45 (1.8%) | 108 (4.7%) |
| 15 to 19 Years | 211 (8.7%) | 132 (5.8%) |
| 20 to 24 Years | 152 (6.3%) | 166 (7.3%) |
| 25 to 29 Years | 178 (7.3%) | 104 (4.5%) |
| 30 to 34 Years | 142 (5.9%) | 149 (6.5%) |
| 35 to 39 Years | 179 (7.4%) | 133 (5.8%) |
| 40 to 44 Years | 171 (7.0%) | 207 (9.1%) |
| 45 to 49 Years | 211 (8.7%) | 204 (8.9%) |
| 50 to 54 Years | 142 (5.9%) | 65 (2.8%) |
| 55 to 59 Years | 188 (7.7%) | 196 (8.6%) |
| 60 to 64 Years | 123 (5.1%) | 96 (4.2%) |
| 65 to 69 Years | 69 (2.8%) | 129 (5.7%) |
| 70 to 74 Years | 71 (2.9%) | 57 (2.5%) |
| 75 to 79 Years | 91 (3.7%) | 80 (3.5%) |
| 80 to 84 Years | 11 (0.4%) | 99 (4.3%) |
| 85 Years and over | 31 (1.3%) | 90 (3.9%) |
| Total | 2,426 (100.0%) | 2,285 (100.0%) |
Families and Households in Grafton
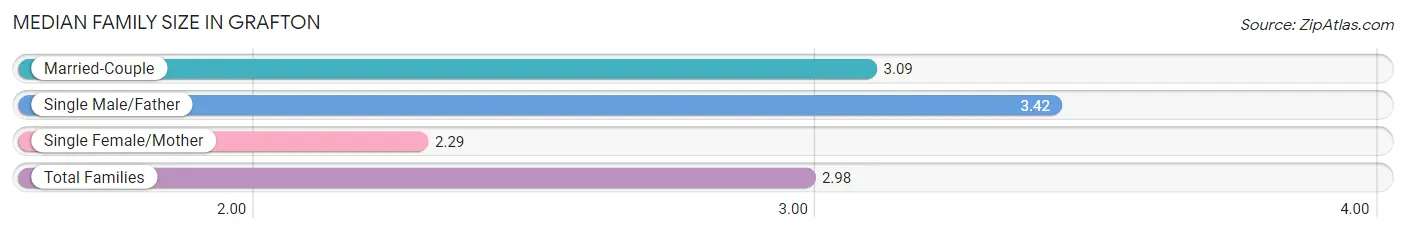
Median Family Size in Grafton
The median family size in Grafton is 2.98 persons per family, with single male/father families (204 | 17.0%) accounting for the largest median family size of 3.42 persons per family. On the other hand, single female/mother families (257 | 21.4%) represent the smallest median family size with 2.29 persons per family.
| Family Type | # Families | Family Size |
| Married-Couple | 737 (61.5%) | 3.09 |
| Single Male/Father | 204 (17.0%) | 3.42 |
| Single Female/Mother | 257 (21.4%) | 2.29 |
| Total Families | 1,198 (100.0%) | 2.98 |
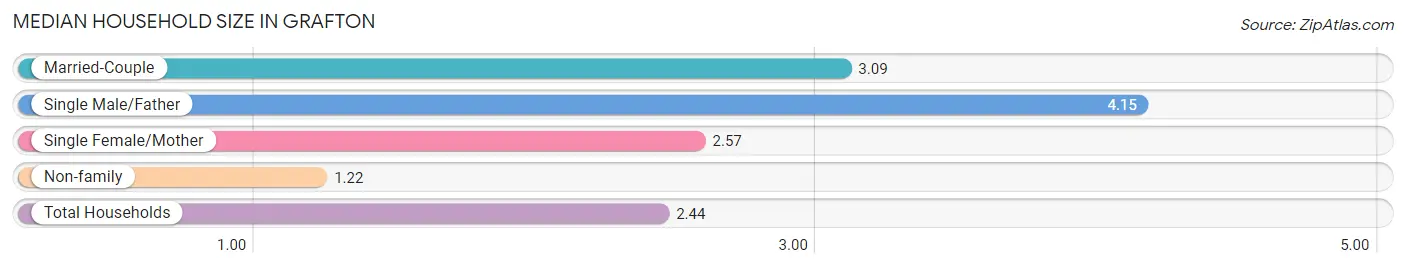
Median Household Size in Grafton
The median household size in Grafton is 2.44 persons per household, with single male/father households (204 | 10.7%) accounting for the largest median household size of 4.15 persons per household. non-family households (699 | 36.8%) represent the smallest median household size with 1.22 persons per household.
| Household Type | # Households | Household Size |
| Married-Couple | 737 (38.9%) | 3.09 |
| Single Male/Father | 204 (10.7%) | 4.15 |
| Single Female/Mother | 257 (13.6%) | 2.57 |
| Non-family | 699 (36.8%) | 1.22 |
| Total Households | 1,897 (100.0%) | 2.44 |
Household Size by Marriage Status in Grafton
Out of a total of 1,897 households in Grafton, 1,198 (63.1%) are family households, while 699 (36.8%) are nonfamily households. The most numerous type of family households are 2-person households, comprising 557, and the most common type of nonfamily households are 1-person households, comprising 552.
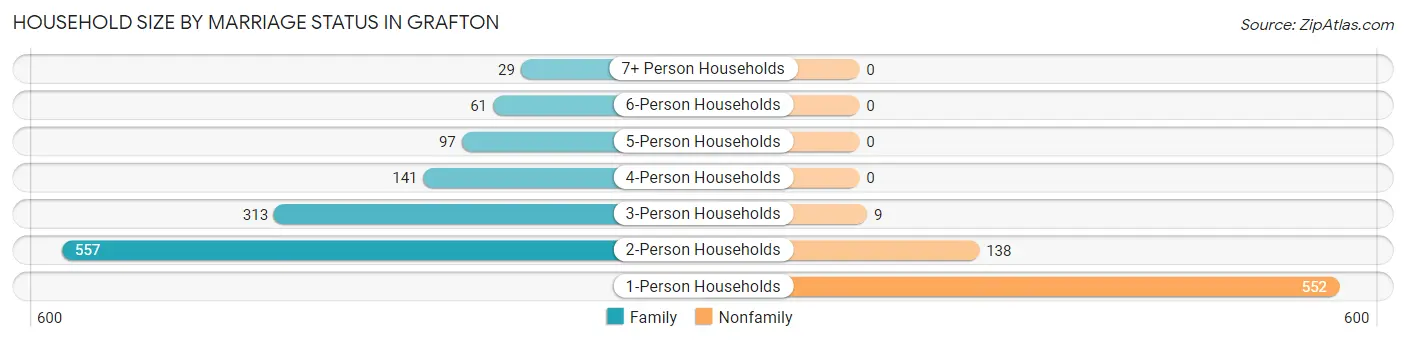
| Household Size | Family Households | Nonfamily Households |
| 1-Person Households | - | 552 (29.1%) |
| 2-Person Households | 557 (29.4%) | 138 (7.3%) |
| 3-Person Households | 313 (16.5%) | 9 (0.5%) |
| 4-Person Households | 141 (7.4%) | 0 (0.0%) |
| 5-Person Households | 97 (5.1%) | 0 (0.0%) |
| 6-Person Households | 61 (3.2%) | 0 (0.0%) |
| 7+ Person Households | 29 (1.5%) | 0 (0.0%) |
| Total | 1,198 (63.1%) | 699 (36.8%) |
Female Fertility in Grafton
Fertility by Age in Grafton
Average fertility rate in Grafton is 41.0 births per 1,000 women. Women in the age bracket of 20 to 34 years have the highest fertility rate with 107.0 births per 1,000 women. Women in the age bracket of 20 to 34 years acount for 100.0% of all women with births.
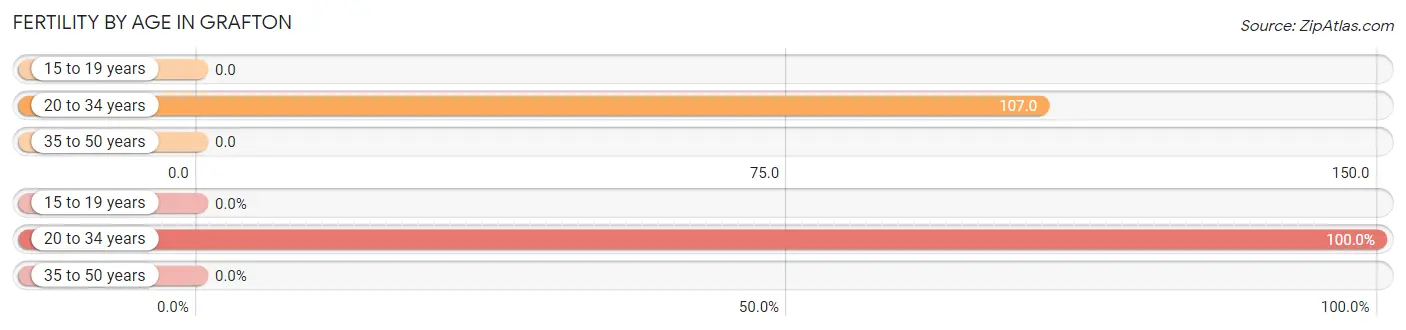
| Age Bracket | Women with Births | Births / 1,000 Women |
| 15 to 19 years | 0 (0.0%) | 0.0 |
| 20 to 34 years | 45 (100.0%) | 107.0 |
| 35 to 50 years | 0 (0.0%) | 0.0 |
| Total | 45 (100.0%) | 41.0 |
Fertility by Age by Marriage Status in Grafton
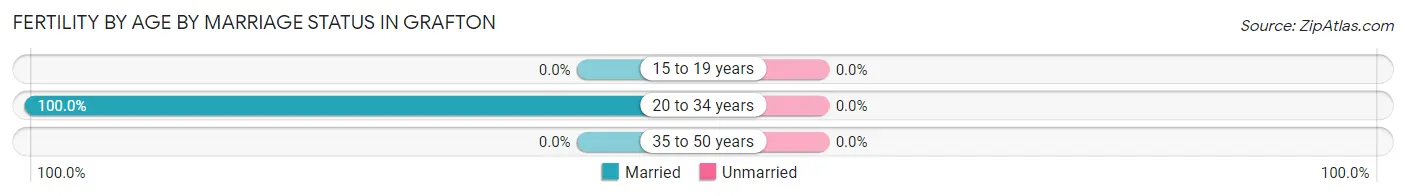
| Age Bracket | Married | Unmarried |
| 15 to 19 years | 0 (0.0%) | 0 (0.0%) |
| 20 to 34 years | 45 (100.0%) | 0 (0.0%) |
| 35 to 50 years | 0 (0.0%) | 0 (0.0%) |
| Total | 45 (100.0%) | 0 (0.0%) |
Fertility by Education in Grafton
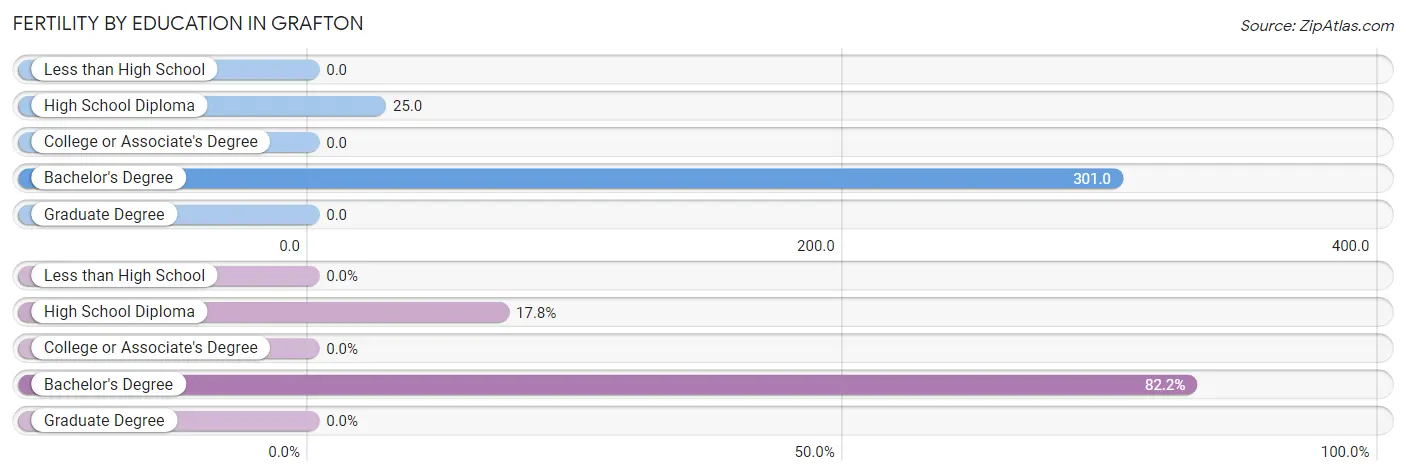
| Educational Attainment | Women with Births | Births / 1,000 Women |
| Less than High School | 0 (0.0%) | 0.0 |
| High School Diploma | 8 (17.8%) | 25.0 |
| College or Associate's Degree | 0 (0.0%) | 0.0 |
| Bachelor's Degree | 37 (82.2%) | 301.0 |
| Graduate Degree | 0 (0.0%) | 0.0 |
| Total | 45 (100.0%) | 41.0 |
Fertility by Education by Marriage Status in Grafton
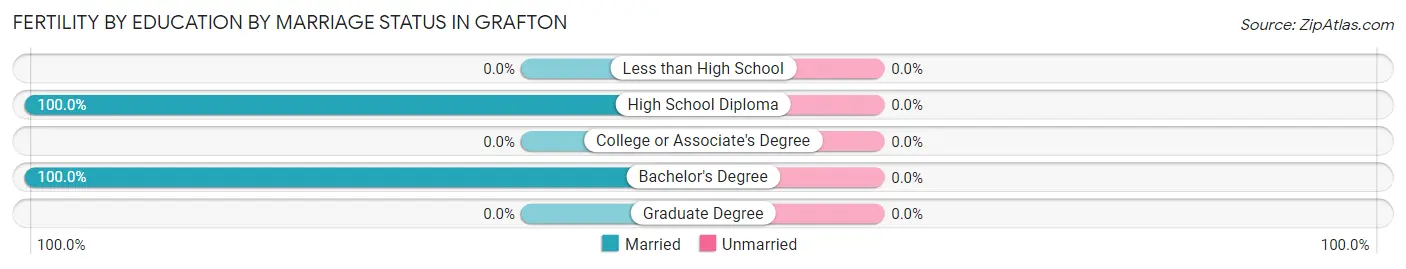
| Educational Attainment | Married | Unmarried |
| Less than High School | 0 (0.0%) | 0 (0.0%) |
| High School Diploma | 8 (100.0%) | 0 (0.0%) |
| College or Associate's Degree | 0 (0.0%) | 0 (0.0%) |
| Bachelor's Degree | 37 (100.0%) | 0 (0.0%) |
| Graduate Degree | 0 (0.0%) | 0 (0.0%) |
| Total | 45 (100.0%) | 0 (0.0%) |
Employment Characteristics in Grafton
Employment by Class of Employer in Grafton
Among the 1,817 employed individuals in Grafton, private company employees (1,325 | 72.9%), local government employees (168 | 9.2%), and federal government employees (116 | 6.4%) make up the most common classes of employment.
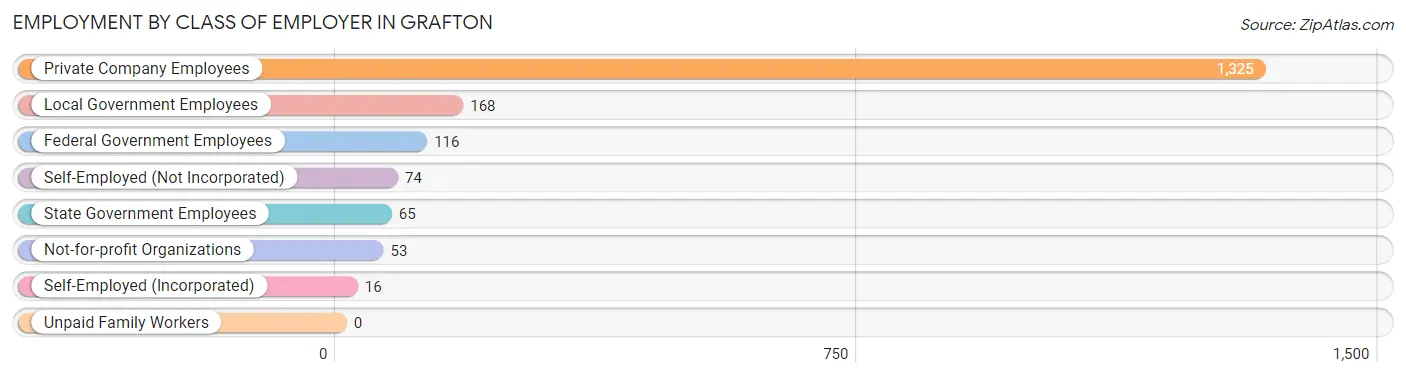
| Employer Class | # Employees | % Employees |
| Private Company Employees | 1,325 | 72.9% |
| Self-Employed (Incorporated) | 16 | 0.9% |
| Self-Employed (Not Incorporated) | 74 | 4.1% |
| Not-for-profit Organizations | 53 | 2.9% |
| Local Government Employees | 168 | 9.2% |
| State Government Employees | 65 | 3.6% |
| Federal Government Employees | 116 | 6.4% |
| Unpaid Family Workers | 0 | 0.0% |
| Total | 1,817 | 100.0% |
Employment Status by Age in Grafton
According to the labor force statistics for Grafton, out of the total population over 16 years of age (3,766), 56.6% or 2,132 individuals are in the labor force, with 11.3% or 241 of them unemployed. The age group with the highest labor force participation rate is 35 to 44 years, with 88.4% or 610 individuals in the labor force. Within the labor force, the 20 to 24 years age range has the highest percentage of unemployed individuals, with 56.1% or 96 of them being unemployed.
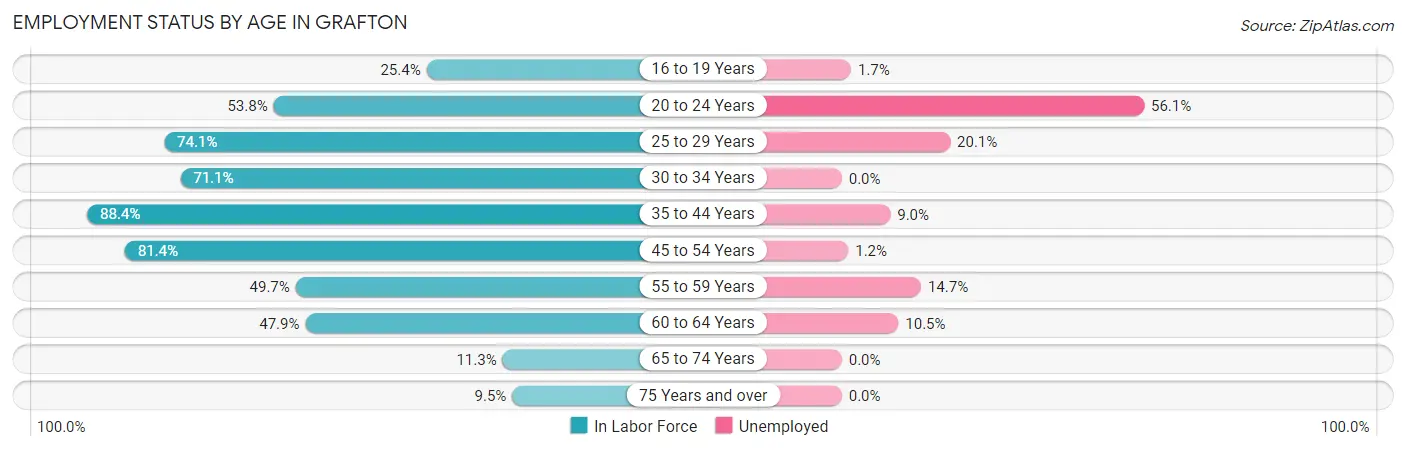
| Age Bracket | In Labor Force | Unemployed |
| 16 to 19 Years | 59 (25.4%) | 1 (1.7%) |
| 20 to 24 Years | 171 (53.8%) | 96 (56.1%) |
| 25 to 29 Years | 209 (74.1%) | 42 (20.1%) |
| 30 to 34 Years | 207 (71.1%) | 0 (0.0%) |
| 35 to 44 Years | 610 (88.4%) | 55 (9.0%) |
| 45 to 54 Years | 506 (81.4%) | 6 (1.2%) |
| 55 to 59 Years | 191 (49.7%) | 28 (14.7%) |
| 60 to 64 Years | 105 (47.9%) | 11 (10.5%) |
| 65 to 74 Years | 37 (11.3%) | 0 (0.0%) |
| 75 Years and over | 38 (9.5%) | 0 (0.0%) |
| Total | 2,132 (56.6%) | 241 (11.3%) |
Employment Status by Educational Attainment in Grafton
According to labor force statistics for Grafton, 73.5% of individuals (1,829) out of the total population between 25 and 64 years of age (2,488) are in the labor force, with 7.9% or 144 of them being unemployed. The group with the highest labor force participation rate are those with the educational attainment of college / associate degree, with 85.2% or 549 individuals in the labor force. Within the labor force, individuals with less than high school education have the highest percentage of unemployment, with 24.3% or 35 of them being unemployed.
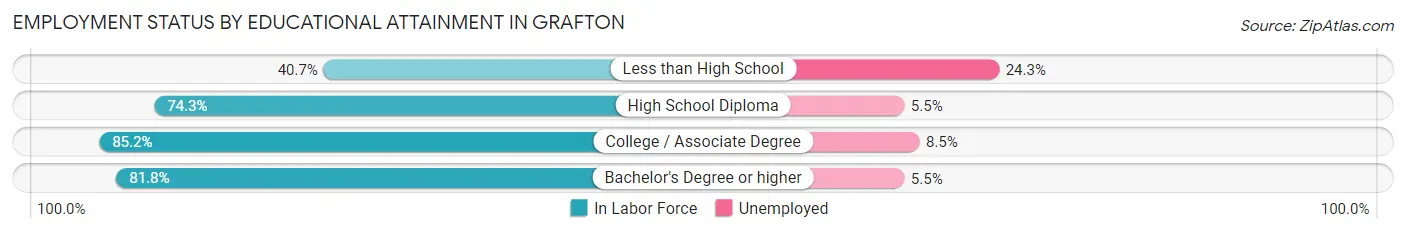
| Educational Attainment | In Labor Force | Unemployed |
| Less than High School | 144 (40.7%) | 86 (24.3%) |
| High School Diploma | 825 (74.3%) | 61 (5.5%) |
| College / Associate Degree | 549 (85.2%) | 55 (8.5%) |
| Bachelor's Degree or higher | 310 (81.8%) | 21 (5.5%) |
| Total | 1,829 (73.5%) | 197 (7.9%) |
Employment Occupations by Sex in Grafton
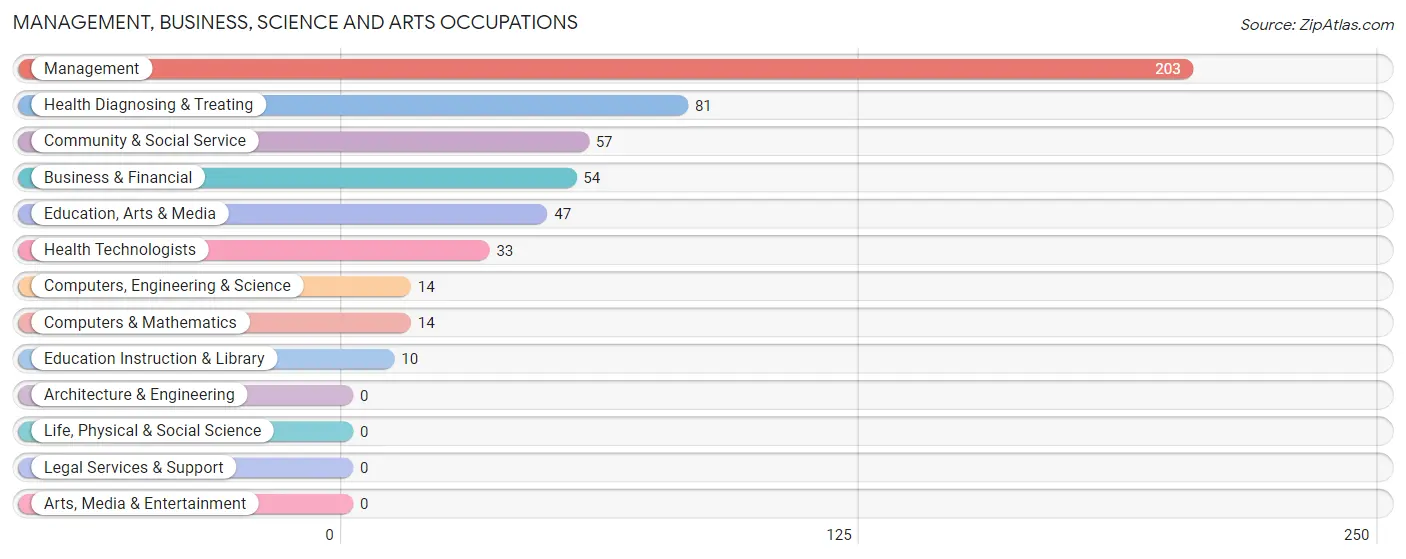
Management, Business, Science and Arts Occupations
The most common Management, Business, Science and Arts occupations in Grafton are Management (203 | 10.8%), Health Diagnosing & Treating (81 | 4.3%), Community & Social Service (57 | 3.0%), Business & Financial (54 | 2.9%), and Education, Arts & Media (47 | 2.5%).
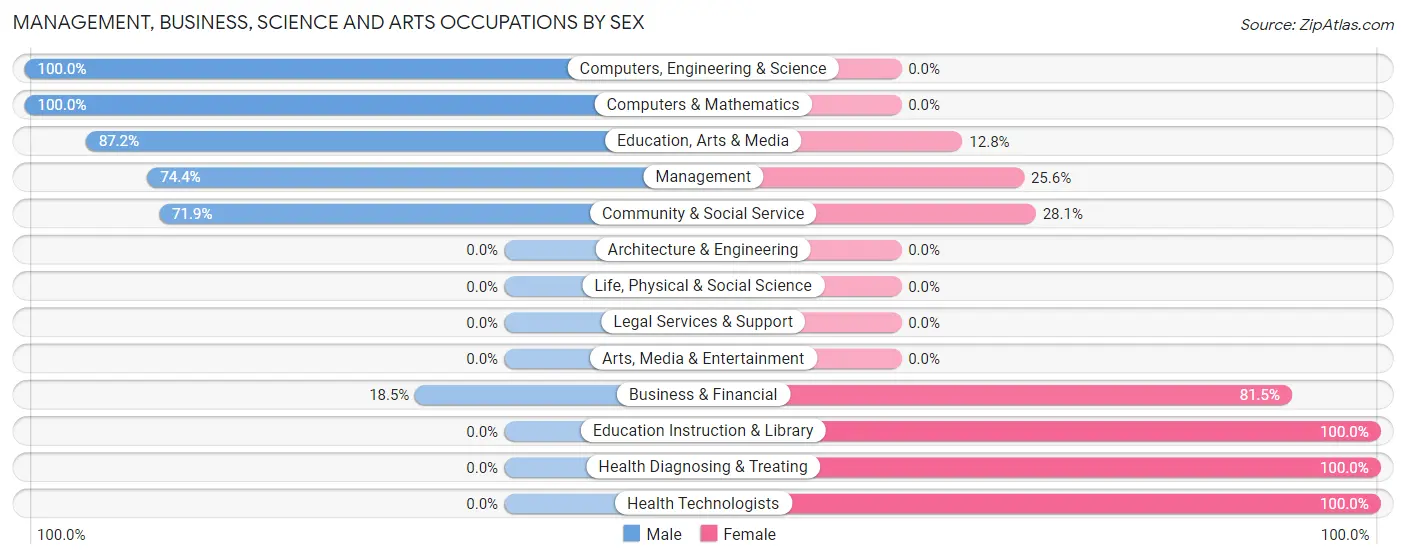
Management, Business, Science and Arts Occupations by Sex
Within the Management, Business, Science and Arts occupations in Grafton, the most male-oriented occupations are Computers, Engineering & Science (100.0%), Computers & Mathematics (100.0%), and Education, Arts & Media (87.2%), while the most female-oriented occupations are Education Instruction & Library (100.0%), Health Diagnosing & Treating (100.0%), and Health Technologists (100.0%).
| Occupation | Male | Female |
| Management | 151 (74.4%) | 52 (25.6%) |
| Business & Financial | 10 (18.5%) | 44 (81.5%) |
| Computers, Engineering & Science | 14 (100.0%) | 0 (0.0%) |
| Computers & Mathematics | 14 (100.0%) | 0 (0.0%) |
| Architecture & Engineering | 0 (0.0%) | 0 (0.0%) |
| Life, Physical & Social Science | 0 (0.0%) | 0 (0.0%) |
| Community & Social Service | 41 (71.9%) | 16 (28.1%) |
| Education, Arts & Media | 41 (87.2%) | 6 (12.8%) |
| Legal Services & Support | 0 (0.0%) | 0 (0.0%) |
| Education Instruction & Library | 0 (0.0%) | 10 (100.0%) |
| Arts, Media & Entertainment | 0 (0.0%) | 0 (0.0%) |
| Health Diagnosing & Treating | 0 (0.0%) | 81 (100.0%) |
| Health Technologists | 0 (0.0%) | 33 (100.0%) |
| Total (Category) | 216 (52.8%) | 193 (47.2%) |
| Total (Overall) | 817 (43.6%) | 1,055 (56.4%) |
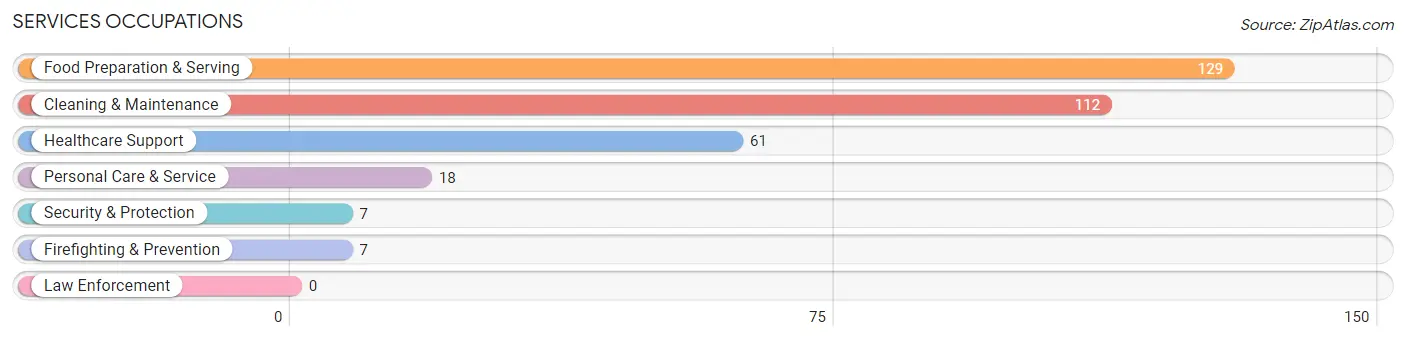
Services Occupations
The most common Services occupations in Grafton are Food Preparation & Serving (129 | 6.9%), Cleaning & Maintenance (112 | 6.0%), Healthcare Support (61 | 3.3%), Personal Care & Service (18 | 1.0%), and Security & Protection (7 | 0.4%).
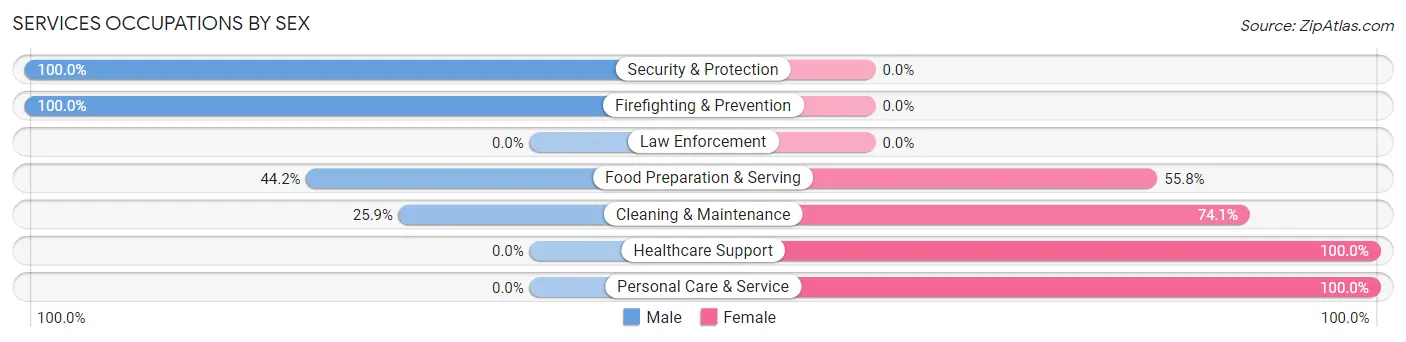
Services Occupations by Sex
Within the Services occupations in Grafton, the most male-oriented occupations are Security & Protection (100.0%), Firefighting & Prevention (100.0%), and Food Preparation & Serving (44.2%), while the most female-oriented occupations are Healthcare Support (100.0%), Personal Care & Service (100.0%), and Cleaning & Maintenance (74.1%).
| Occupation | Male | Female |
| Healthcare Support | 0 (0.0%) | 61 (100.0%) |
| Security & Protection | 7 (100.0%) | 0 (0.0%) |
| Firefighting & Prevention | 7 (100.0%) | 0 (0.0%) |
| Law Enforcement | 0 (0.0%) | 0 (0.0%) |
| Food Preparation & Serving | 57 (44.2%) | 72 (55.8%) |
| Cleaning & Maintenance | 29 (25.9%) | 83 (74.1%) |
| Personal Care & Service | 0 (0.0%) | 18 (100.0%) |
| Total (Category) | 93 (28.4%) | 234 (71.6%) |
| Total (Overall) | 817 (43.6%) | 1,055 (56.4%) |
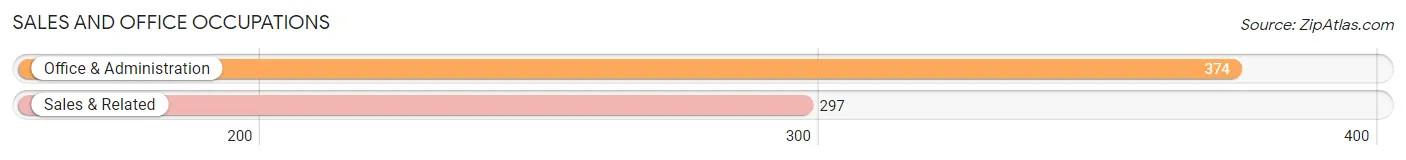
Sales and Office Occupations
The most common Sales and Office occupations in Grafton are Office & Administration (374 | 20.0%), and Sales & Related (297 | 15.9%).
Sales and Office Occupations by Sex
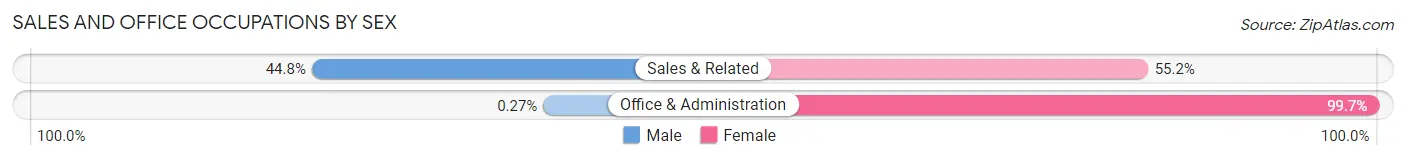
| Occupation | Male | Female |
| Sales & Related | 133 (44.8%) | 164 (55.2%) |
| Office & Administration | 1 (0.3%) | 373 (99.7%) |
| Total (Category) | 134 (20.0%) | 537 (80.0%) |
| Total (Overall) | 817 (43.6%) | 1,055 (56.4%) |
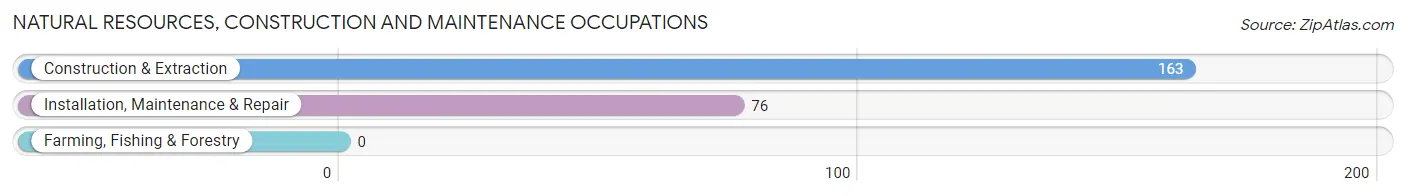
Natural Resources, Construction and Maintenance Occupations
The most common Natural Resources, Construction and Maintenance occupations in Grafton are Construction & Extraction (163 | 8.7%), and Installation, Maintenance & Repair (76 | 4.1%).
Natural Resources, Construction and Maintenance Occupations by Sex
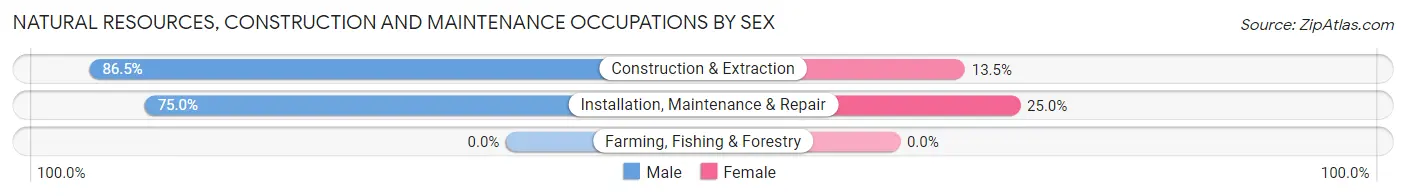
| Occupation | Male | Female |
| Farming, Fishing & Forestry | 0 (0.0%) | 0 (0.0%) |
| Construction & Extraction | 141 (86.5%) | 22 (13.5%) |
| Installation, Maintenance & Repair | 57 (75.0%) | 19 (25.0%) |
| Total (Category) | 198 (82.9%) | 41 (17.2%) |
| Total (Overall) | 817 (43.6%) | 1,055 (56.4%) |
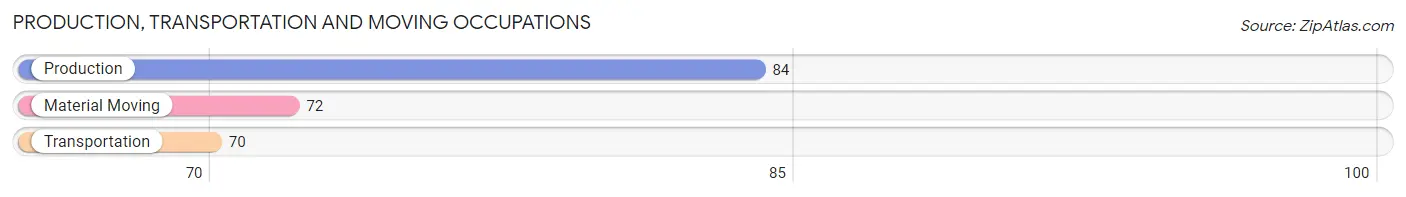
Production, Transportation and Moving Occupations
The most common Production, Transportation and Moving occupations in Grafton are Production (84 | 4.5%), Material Moving (72 | 3.8%), and Transportation (70 | 3.7%).
Production, Transportation and Moving Occupations by Sex
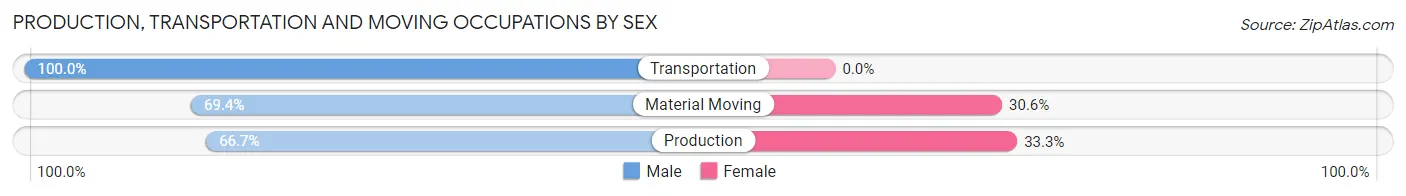
| Occupation | Male | Female |
| Production | 56 (66.7%) | 28 (33.3%) |
| Transportation | 70 (100.0%) | 0 (0.0%) |
| Material Moving | 50 (69.4%) | 22 (30.6%) |
| Total (Category) | 176 (77.9%) | 50 (22.1%) |
| Total (Overall) | 817 (43.6%) | 1,055 (56.4%) |
Employment Industries by Sex in Grafton
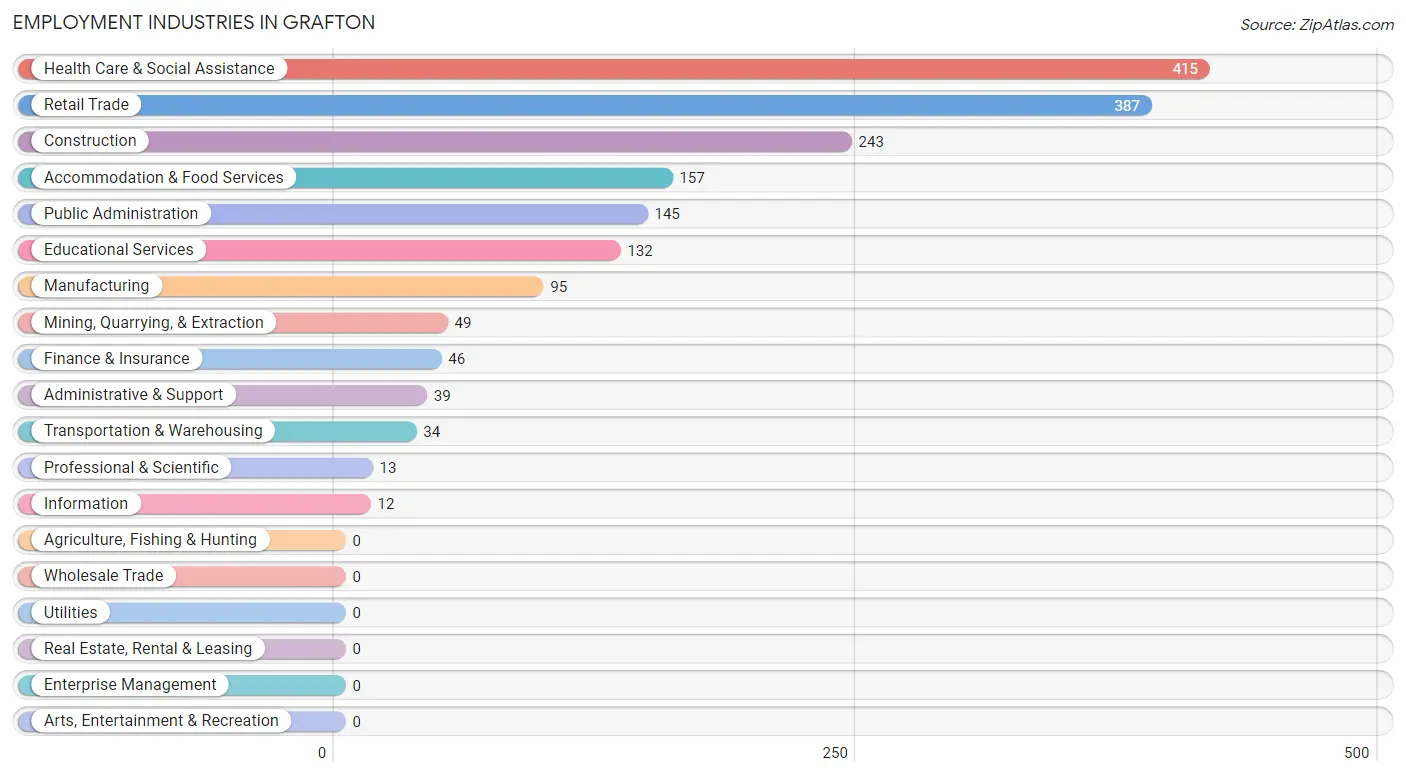
Employment Industries in Grafton
The major employment industries in Grafton include Health Care & Social Assistance (415 | 22.2%), Retail Trade (387 | 20.7%), Construction (243 | 13.0%), Accommodation & Food Services (157 | 8.4%), and Public Administration (145 | 7.7%).
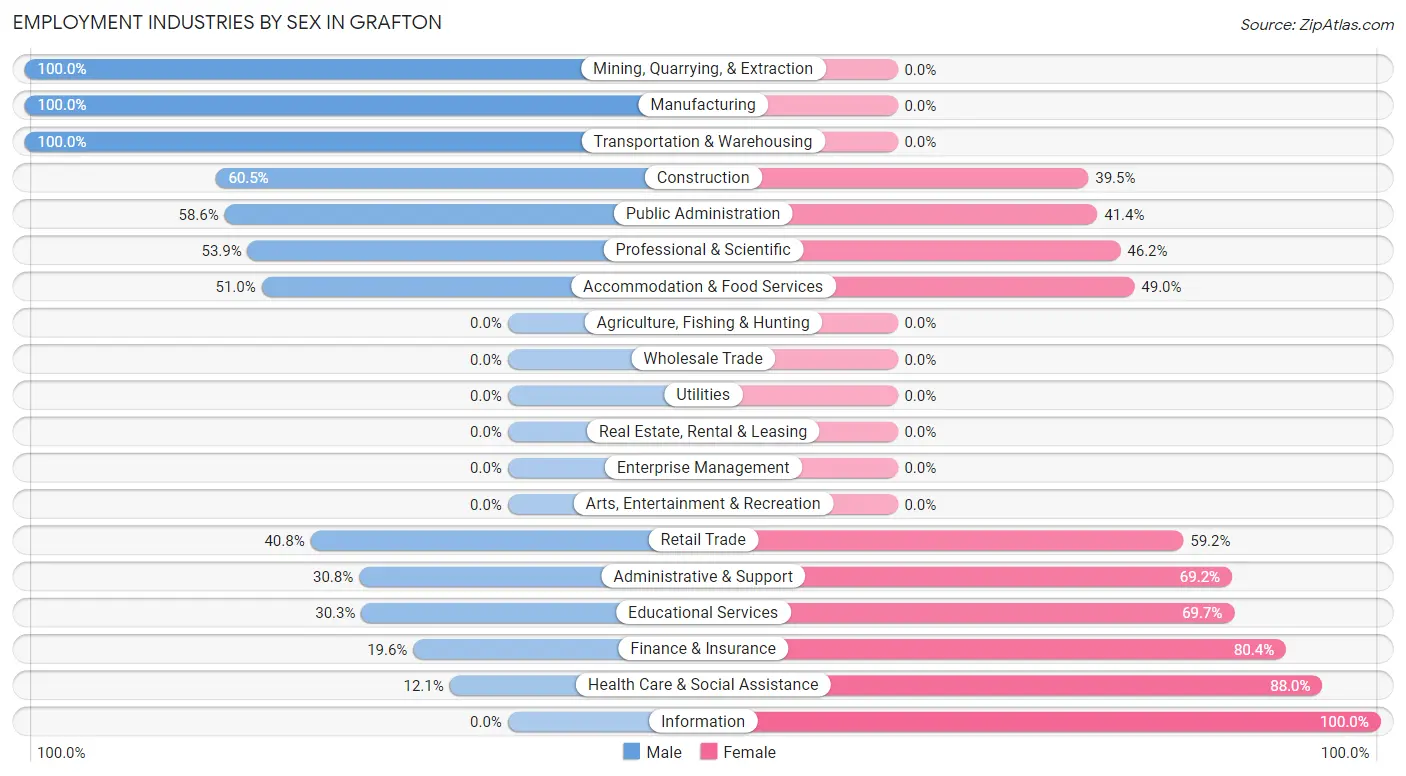
Employment Industries by Sex in Grafton
The Grafton industries that see more men than women are Mining, Quarrying, & Extraction (100.0%), Manufacturing (100.0%), and Transportation & Warehousing (100.0%), whereas the industries that tend to have a higher number of women are Information (100.0%), Health Care & Social Assistance (87.9%), and Finance & Insurance (80.4%).
| Industry | Male | Female |
| Agriculture, Fishing & Hunting | 0 (0.0%) | 0 (0.0%) |
| Mining, Quarrying, & Extraction | 49 (100.0%) | 0 (0.0%) |
| Construction | 147 (60.5%) | 96 (39.5%) |
| Manufacturing | 95 (100.0%) | 0 (0.0%) |
| Wholesale Trade | 0 (0.0%) | 0 (0.0%) |
| Retail Trade | 158 (40.8%) | 229 (59.2%) |
| Transportation & Warehousing | 34 (100.0%) | 0 (0.0%) |
| Utilities | 0 (0.0%) | 0 (0.0%) |
| Information | 0 (0.0%) | 12 (100.0%) |
| Finance & Insurance | 9 (19.6%) | 37 (80.4%) |
| Real Estate, Rental & Leasing | 0 (0.0%) | 0 (0.0%) |
| Professional & Scientific | 7 (53.8%) | 6 (46.2%) |
| Enterprise Management | 0 (0.0%) | 0 (0.0%) |
| Administrative & Support | 12 (30.8%) | 27 (69.2%) |
| Educational Services | 40 (30.3%) | 92 (69.7%) |
| Health Care & Social Assistance | 50 (12.0%) | 365 (87.9%) |
| Arts, Entertainment & Recreation | 0 (0.0%) | 0 (0.0%) |
| Accommodation & Food Services | 80 (51.0%) | 77 (49.0%) |
| Public Administration | 85 (58.6%) | 60 (41.4%) |
| Total | 817 (43.6%) | 1,055 (56.4%) |
Education in Grafton
School Enrollment in Grafton
The most common levels of schooling among the 832 students in Grafton are high school (315 | 37.9%), elementary school (186 | 22.4%), and middle school (153 | 18.4%).
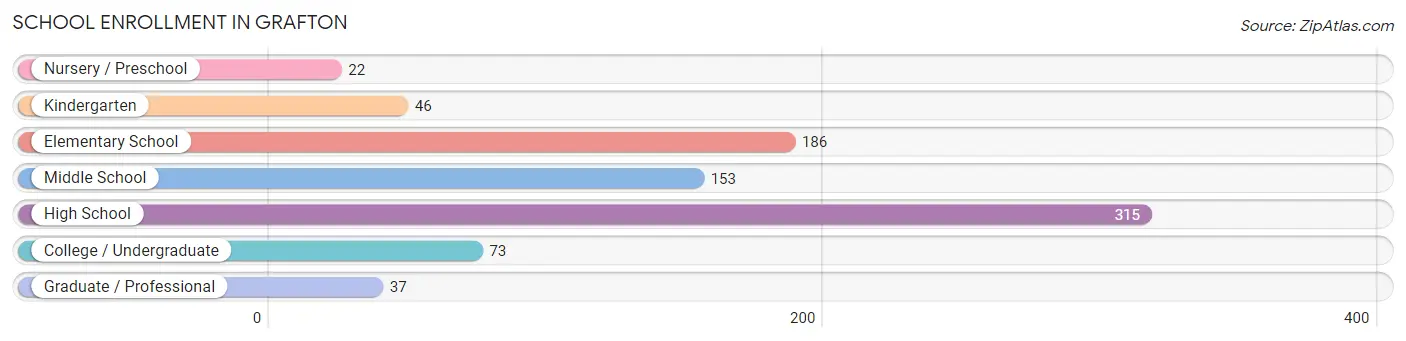
| School Level | # Students | % Students |
| Nursery / Preschool | 22 | 2.6% |
| Kindergarten | 46 | 5.5% |
| Elementary School | 186 | 22.4% |
| Middle School | 153 | 18.4% |
| High School | 315 | 37.9% |
| College / Undergraduate | 73 | 8.8% |
| Graduate / Professional | 37 | 4.4% |
| Total | 832 | 100.0% |
School Enrollment by Age by Funding Source in Grafton
Out of a total of 832 students who are enrolled in schools in Grafton, 227 (27.3%) attend a private institution, while the remaining 605 (72.7%) are enrolled in public schools. The age group of 15 to 17 year olds has the highest likelihood of being enrolled in private schools, with 138 (55.2% in the age bracket) enrolled. Conversely, the age group of 18 to 19 year olds has the lowest likelihood of being enrolled in a private school, with 31 (100.0% in the age bracket) attending a public institution.
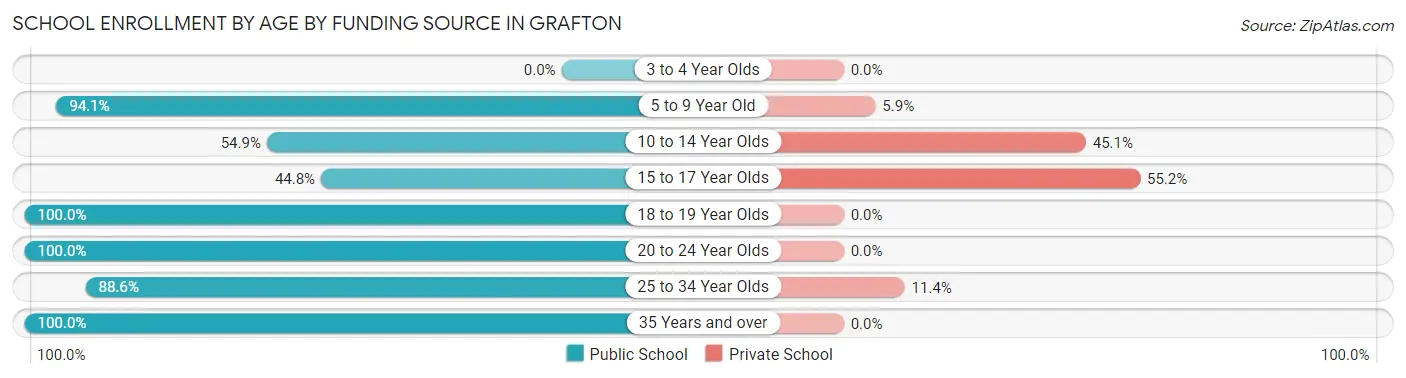
| Age Bracket | Public School | Private School |
| 3 to 4 Year Olds | 0 (0.0%) | 0 (0.0%) |
| 5 to 9 Year Old | 239 (94.1%) | 15 (5.9%) |
| 10 to 14 Year Olds | 84 (54.9%) | 69 (45.1%) |
| 15 to 17 Year Olds | 112 (44.8%) | 138 (55.2%) |
| 18 to 19 Year Olds | 31 (100.0%) | 0 (0.0%) |
| 20 to 24 Year Olds | 71 (100.0%) | 0 (0.0%) |
| 25 to 34 Year Olds | 39 (88.6%) | 5 (11.4%) |
| 35 Years and over | 29 (100.0%) | 0 (0.0%) |
| Total | 605 (72.7%) | 227 (27.3%) |
Educational Attainment by Field of Study in Grafton
Business (130 | 28.6%), arts & humanities (84 | 18.5%), social sciences (66 | 14.5%), liberal arts & history (50 | 11.0%), and psychology (49 | 10.8%) are the most common fields of study among 454 individuals in Grafton who have obtained a bachelor's degree or higher.
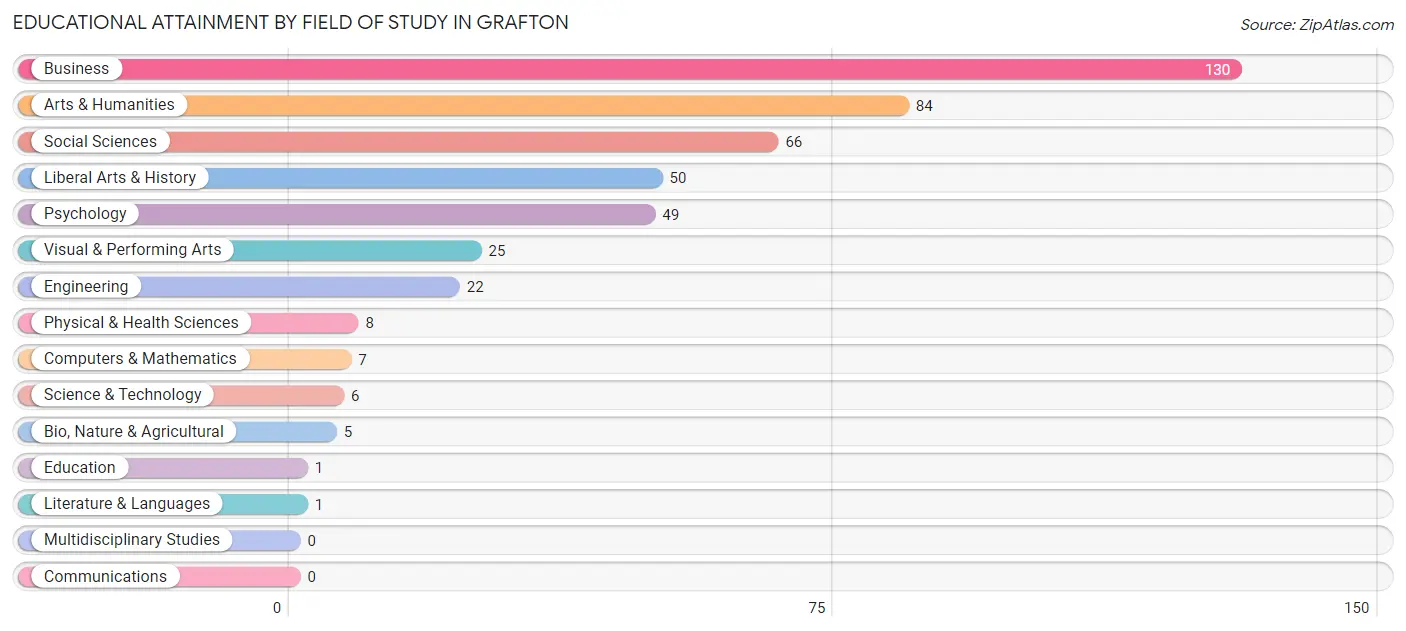
| Field of Study | # Graduates | % Graduates |
| Computers & Mathematics | 7 | 1.5% |
| Bio, Nature & Agricultural | 5 | 1.1% |
| Physical & Health Sciences | 8 | 1.8% |
| Psychology | 49 | 10.8% |
| Social Sciences | 66 | 14.5% |
| Engineering | 22 | 4.9% |
| Multidisciplinary Studies | 0 | 0.0% |
| Science & Technology | 6 | 1.3% |
| Business | 130 | 28.6% |
| Education | 1 | 0.2% |
| Literature & Languages | 1 | 0.2% |
| Liberal Arts & History | 50 | 11.0% |
| Visual & Performing Arts | 25 | 5.5% |
| Communications | 0 | 0.0% |
| Arts & Humanities | 84 | 18.5% |
| Total | 454 | 100.0% |
Transportation & Commute in Grafton
Vehicle Availability by Sex in Grafton
The most prevalent vehicle ownership categories in Grafton are males with 2 vehicles (342, accounting for 42.8%) and females with 2 vehicles (458, making up 33.6%).
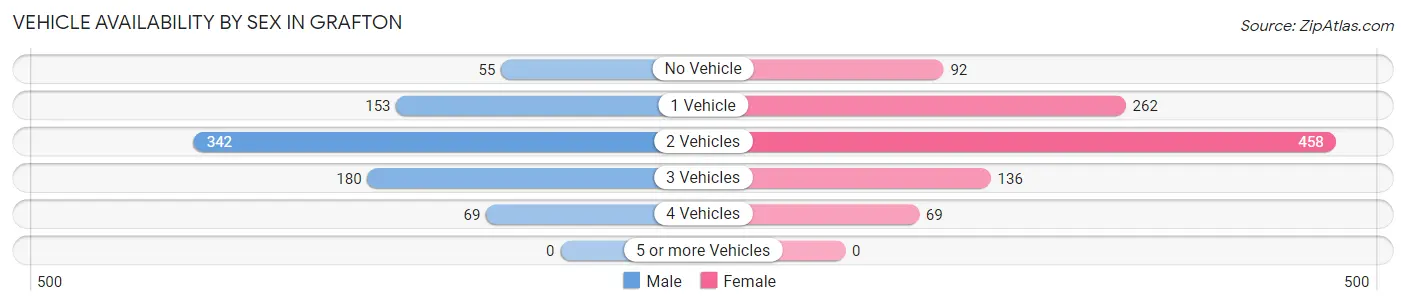
| Vehicles Available | Male | Female |
| No Vehicle | 55 (6.9%) | 92 (9.0%) |
| 1 Vehicle | 153 (19.2%) | 262 (25.8%) |
| 2 Vehicles | 342 (42.8%) | 458 (45.0%) |
| 3 Vehicles | 180 (22.5%) | 136 (13.4%) |
| 4 Vehicles | 69 (8.6%) | 69 (6.8%) |
| 5 or more Vehicles | 0 (0.0%) | 0 (0.0%) |
| Total | 799 (100.0%) | 1,017 (100.0%) |
Commute Time in Grafton
The most frequently occuring commute durations in Grafton are 5 to 9 minutes (388 commuters, 23.2%), 10 to 14 minutes (378 commuters, 22.6%), and 30 to 34 minutes (366 commuters, 21.9%).
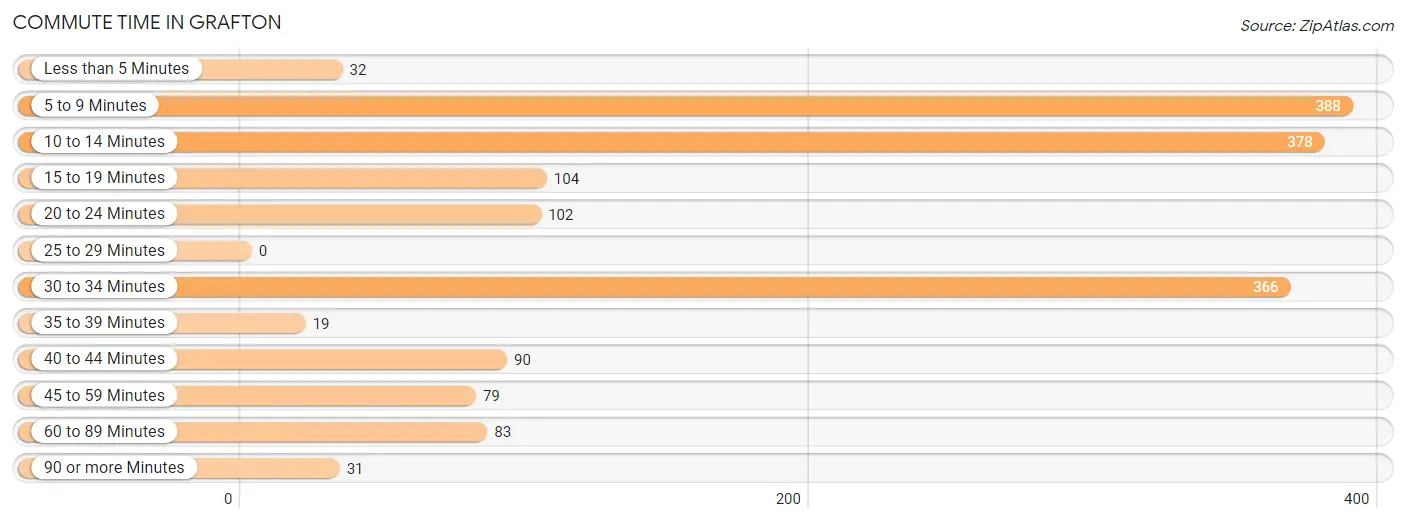
| Commute Time | # Commuters | % Commuters |
| Less than 5 Minutes | 32 | 1.9% |
| 5 to 9 Minutes | 388 | 23.2% |
| 10 to 14 Minutes | 378 | 22.6% |
| 15 to 19 Minutes | 104 | 6.2% |
| 20 to 24 Minutes | 102 | 6.1% |
| 25 to 29 Minutes | 0 | 0.0% |
| 30 to 34 Minutes | 366 | 21.9% |
| 35 to 39 Minutes | 19 | 1.1% |
| 40 to 44 Minutes | 90 | 5.4% |
| 45 to 59 Minutes | 79 | 4.7% |
| 60 to 89 Minutes | 83 | 5.0% |
| 90 or more Minutes | 31 | 1.8% |
Commute Time by Sex in Grafton
The most common commute times in Grafton are 5 to 9 minutes (226 commuters, 28.2%) for males and 10 to 14 minutes (235 commuters, 27.0%) for females.
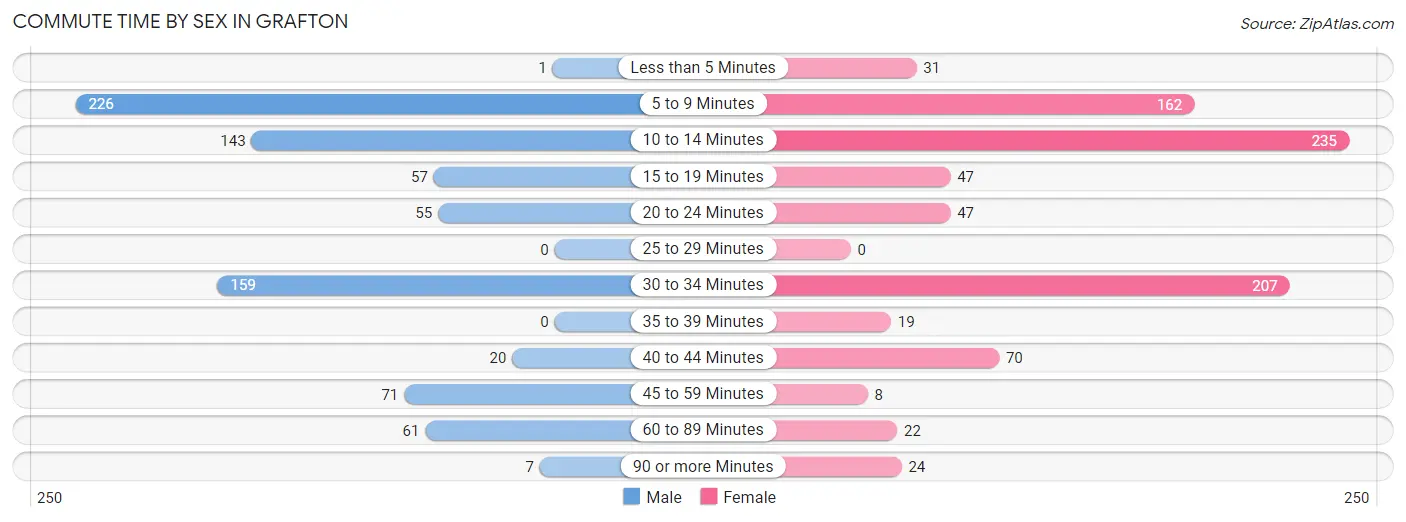
| Commute Time | Male | Female |
| Less than 5 Minutes | 1 (0.1%) | 31 (3.6%) |
| 5 to 9 Minutes | 226 (28.2%) | 162 (18.6%) |
| 10 to 14 Minutes | 143 (17.9%) | 235 (27.0%) |
| 15 to 19 Minutes | 57 (7.1%) | 47 (5.4%) |
| 20 to 24 Minutes | 55 (6.9%) | 47 (5.4%) |
| 25 to 29 Minutes | 0 (0.0%) | 0 (0.0%) |
| 30 to 34 Minutes | 159 (19.9%) | 207 (23.7%) |
| 35 to 39 Minutes | 0 (0.0%) | 19 (2.2%) |
| 40 to 44 Minutes | 20 (2.5%) | 70 (8.0%) |
| 45 to 59 Minutes | 71 (8.9%) | 8 (0.9%) |
| 60 to 89 Minutes | 61 (7.6%) | 22 (2.5%) |
| 90 or more Minutes | 7 (0.9%) | 24 (2.8%) |
Time of Departure to Work by Sex in Grafton
The most frequent times of departure to work in Grafton are 9:00 AM to 9:59 AM (175, 21.9%) for males and 5:30 AM to 5:59 AM (198, 22.7%) for females.
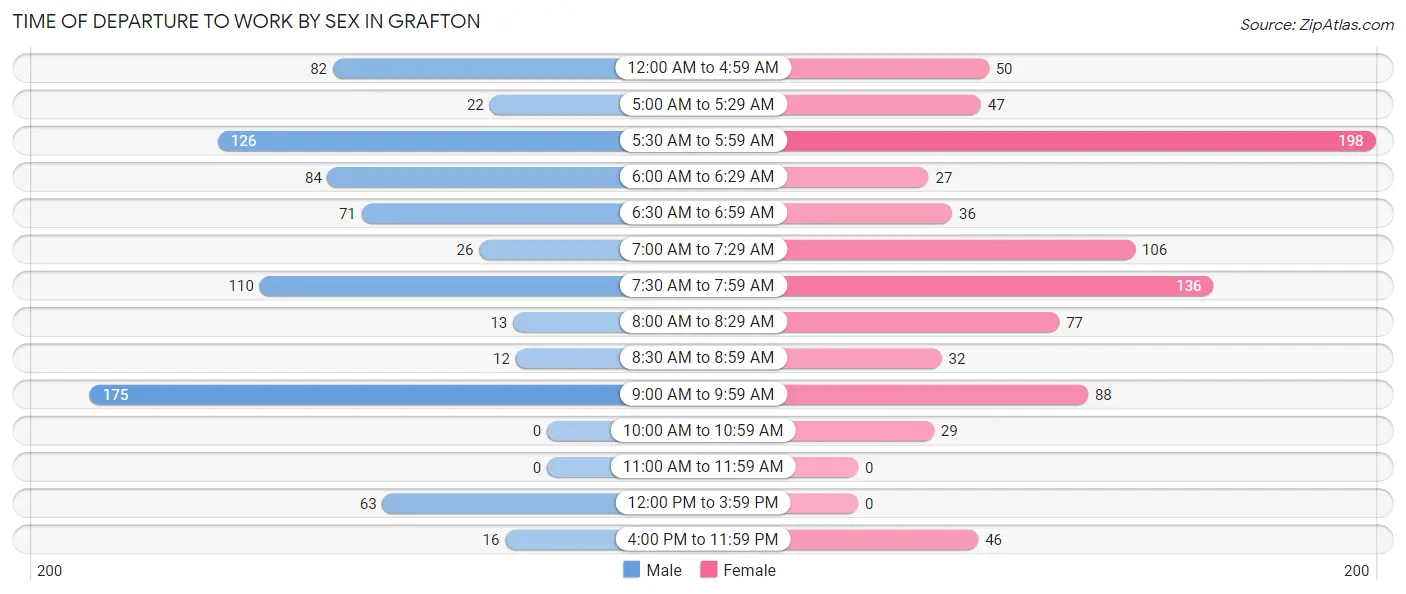
| Time of Departure | Male | Female |
| 12:00 AM to 4:59 AM | 82 (10.2%) | 50 (5.7%) |
| 5:00 AM to 5:29 AM | 22 (2.8%) | 47 (5.4%) |
| 5:30 AM to 5:59 AM | 126 (15.8%) | 198 (22.7%) |
| 6:00 AM to 6:29 AM | 84 (10.5%) | 27 (3.1%) |
| 6:30 AM to 6:59 AM | 71 (8.9%) | 36 (4.1%) |
| 7:00 AM to 7:29 AM | 26 (3.3%) | 106 (12.2%) |
| 7:30 AM to 7:59 AM | 110 (13.8%) | 136 (15.6%) |
| 8:00 AM to 8:29 AM | 13 (1.6%) | 77 (8.8%) |
| 8:30 AM to 8:59 AM | 12 (1.5%) | 32 (3.7%) |
| 9:00 AM to 9:59 AM | 175 (21.9%) | 88 (10.1%) |
| 10:00 AM to 10:59 AM | 0 (0.0%) | 29 (3.3%) |
| 11:00 AM to 11:59 AM | 0 (0.0%) | 0 (0.0%) |
| 12:00 PM to 3:59 PM | 63 (7.9%) | 0 (0.0%) |
| 4:00 PM to 11:59 PM | 16 (2.0%) | 46 (5.3%) |
| Total | 800 (100.0%) | 872 (100.0%) |
Housing Occupancy in Grafton
Occupancy by Ownership in Grafton
Of the total 1,897 dwellings in Grafton, owner-occupied units account for 1,486 (78.3%), while renter-occupied units make up 411 (21.7%).
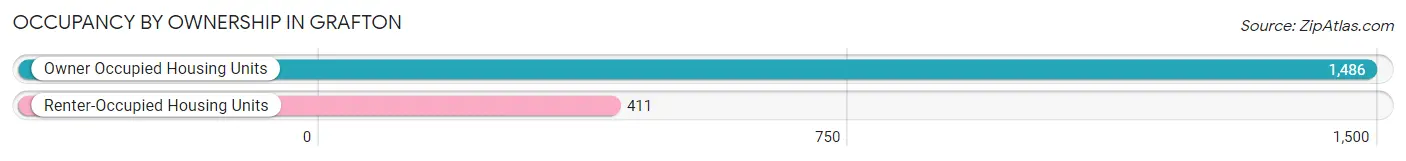
| Occupancy | # Housing Units | % Housing Units |
| Owner Occupied Housing Units | 1,486 | 78.3% |
| Renter-Occupied Housing Units | 411 | 21.7% |
| Total Occupied Housing Units | 1,897 | 100.0% |
Occupancy by Household Size in Grafton
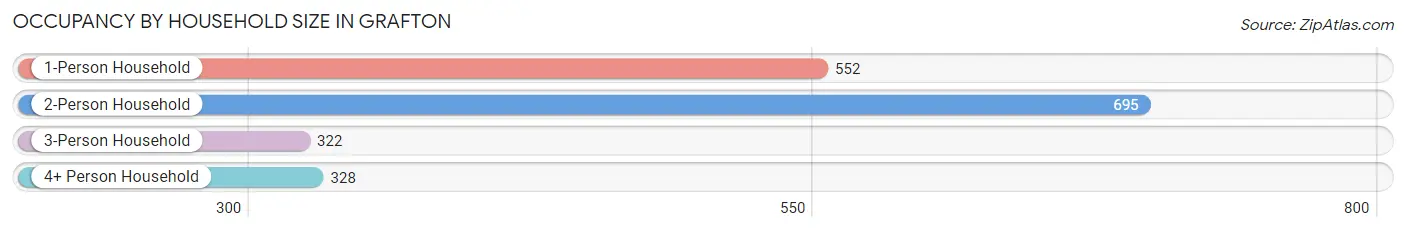
| Household Size | # Housing Units | % Housing Units |
| 1-Person Household | 552 | 29.1% |
| 2-Person Household | 695 | 36.6% |
| 3-Person Household | 322 | 17.0% |
| 4+ Person Household | 328 | 17.3% |
| Total Housing Units | 1,897 | 100.0% |
Occupancy by Ownership by Household Size in Grafton
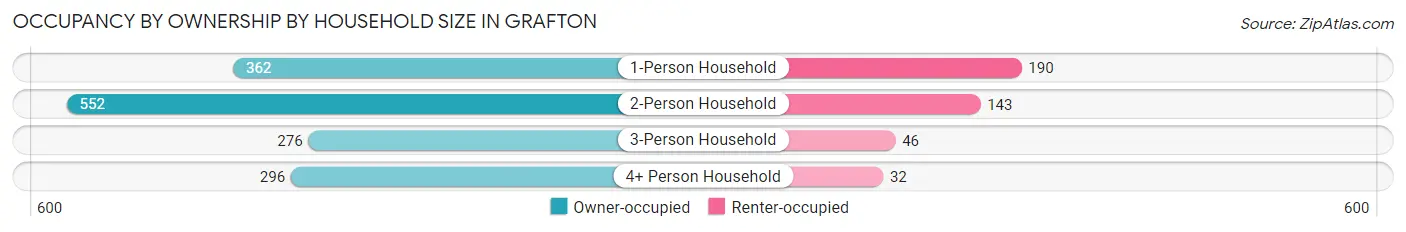
| Household Size | Owner-occupied | Renter-occupied |
| 1-Person Household | 362 (65.6%) | 190 (34.4%) |
| 2-Person Household | 552 (79.4%) | 143 (20.6%) |
| 3-Person Household | 276 (85.7%) | 46 (14.3%) |
| 4+ Person Household | 296 (90.2%) | 32 (9.8%) |
| Total Housing Units | 1,486 (78.3%) | 411 (21.7%) |
Occupancy by Educational Attainment in Grafton
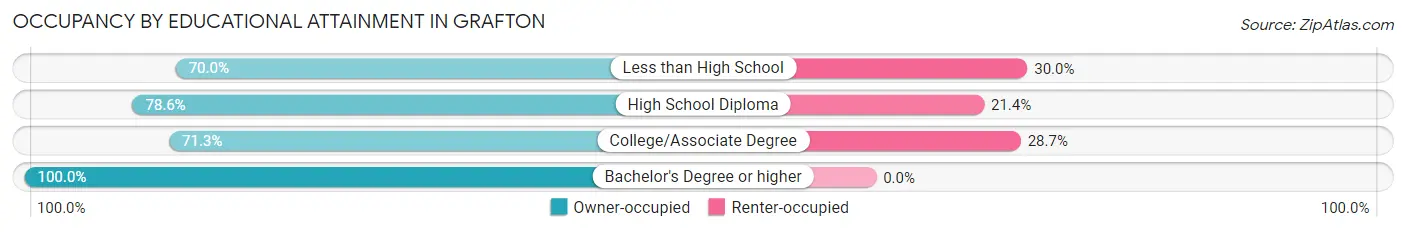
| Household Size | Owner-occupied | Renter-occupied |
| Less than High School | 222 (70.0%) | 95 (30.0%) |
| High School Diploma | 665 (78.6%) | 181 (21.4%) |
| College/Associate Degree | 336 (71.3%) | 135 (28.7%) |
| Bachelor's Degree or higher | 263 (100.0%) | 0 (0.0%) |
Occupancy by Age of Householder in Grafton
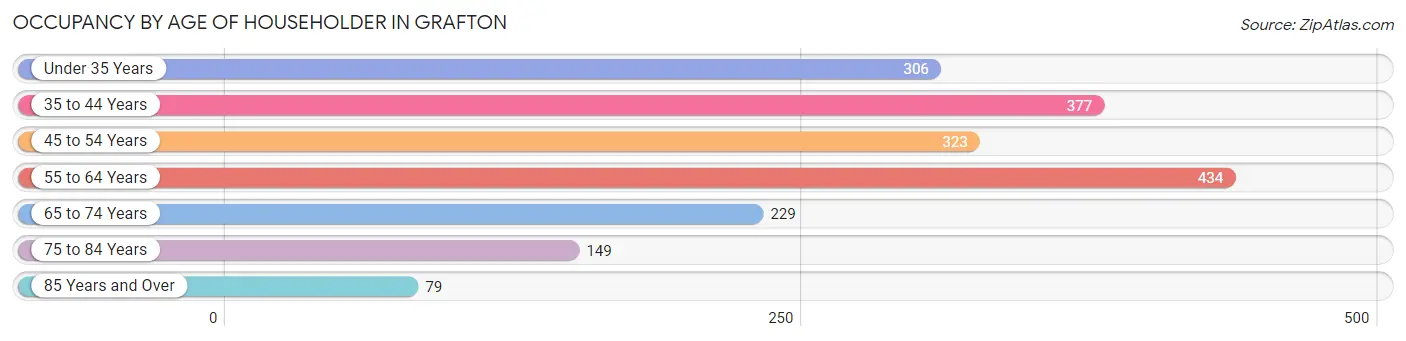
| Age Bracket | # Households | % Households |
| Under 35 Years | 306 | 16.1% |
| 35 to 44 Years | 377 | 19.9% |
| 45 to 54 Years | 323 | 17.0% |
| 55 to 64 Years | 434 | 22.9% |
| 65 to 74 Years | 229 | 12.1% |
| 75 to 84 Years | 149 | 7.9% |
| 85 Years and Over | 79 | 4.2% |
| Total | 1,897 | 100.0% |
Housing Finances in Grafton
Median Income by Occupancy in Grafton
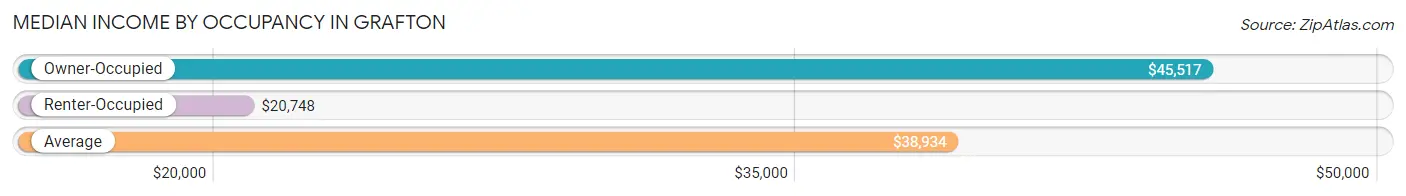
| Occupancy Type | # Households | Median Income |
| Owner-Occupied | 1,486 (78.3%) | $45,517 |
| Renter-Occupied | 411 (21.7%) | $20,748 |
| Average | 1,897 (100.0%) | $38,934 |
Occupancy by Householder Income Bracket in Grafton
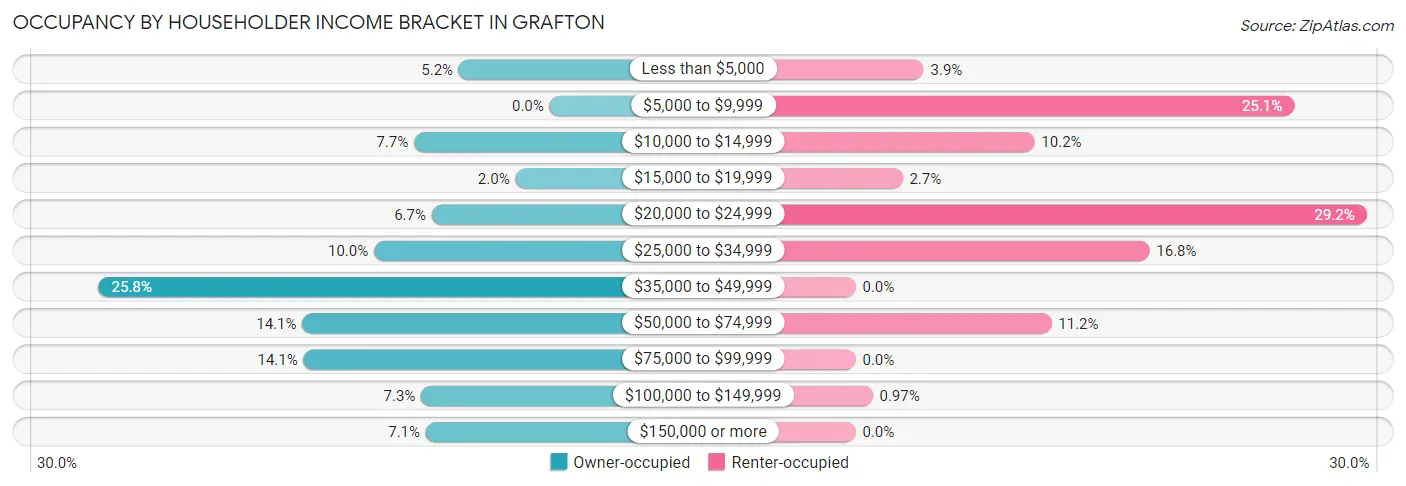
| Income Bracket | Owner-occupied | Renter-occupied |
| Less than $5,000 | 77 (5.2%) | 16 (3.9%) |
| $5,000 to $9,999 | 0 (0.0%) | 103 (25.1%) |
| $10,000 to $14,999 | 115 (7.7%) | 42 (10.2%) |
| $15,000 to $19,999 | 29 (1.9%) | 11 (2.7%) |
| $20,000 to $24,999 | 100 (6.7%) | 120 (29.2%) |
| $25,000 to $34,999 | 149 (10.0%) | 69 (16.8%) |
| $35,000 to $49,999 | 383 (25.8%) | 0 (0.0%) |
| $50,000 to $74,999 | 210 (14.1%) | 46 (11.2%) |
| $75,000 to $99,999 | 209 (14.1%) | 0 (0.0%) |
| $100,000 to $149,999 | 109 (7.3%) | 4 (1.0%) |
| $150,000 or more | 105 (7.1%) | 0 (0.0%) |
| Total | 1,486 (100.0%) | 411 (100.0%) |
Monthly Housing Cost Tiers in Grafton
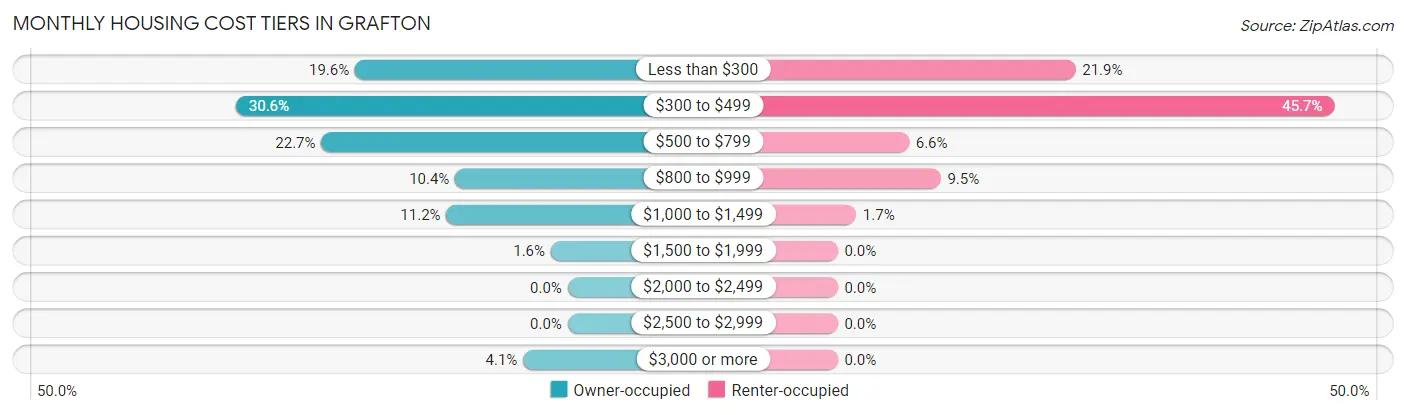
| Monthly Cost | Owner-occupied | Renter-occupied |
| Less than $300 | 291 (19.6%) | 90 (21.9%) |
| $300 to $499 | 454 (30.5%) | 188 (45.7%) |
| $500 to $799 | 337 (22.7%) | 27 (6.6%) |
| $800 to $999 | 154 (10.4%) | 39 (9.5%) |
| $1,000 to $1,499 | 166 (11.2%) | 7 (1.7%) |
| $1,500 to $1,999 | 23 (1.5%) | 0 (0.0%) |
| $2,000 to $2,499 | 0 (0.0%) | 0 (0.0%) |
| $2,500 to $2,999 | 0 (0.0%) | 0 (0.0%) |
| $3,000 or more | 61 (4.1%) | 0 (0.0%) |
| Total | 1,486 (100.0%) | 411 (100.0%) |
Physical Housing Characteristics in Grafton
Housing Structures in Grafton
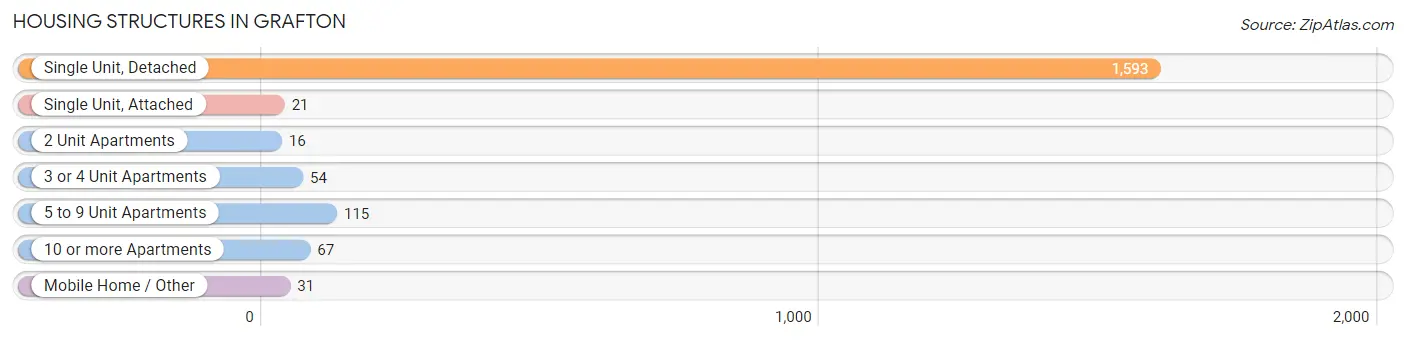
| Structure Type | # Housing Units | % Housing Units |
| Single Unit, Detached | 1,593 | 84.0% |
| Single Unit, Attached | 21 | 1.1% |
| 2 Unit Apartments | 16 | 0.8% |
| 3 or 4 Unit Apartments | 54 | 2.9% |
| 5 to 9 Unit Apartments | 115 | 6.1% |
| 10 or more Apartments | 67 | 3.5% |
| Mobile Home / Other | 31 | 1.6% |
| Total | 1,897 | 100.0% |
Housing Structures by Occupancy in Grafton
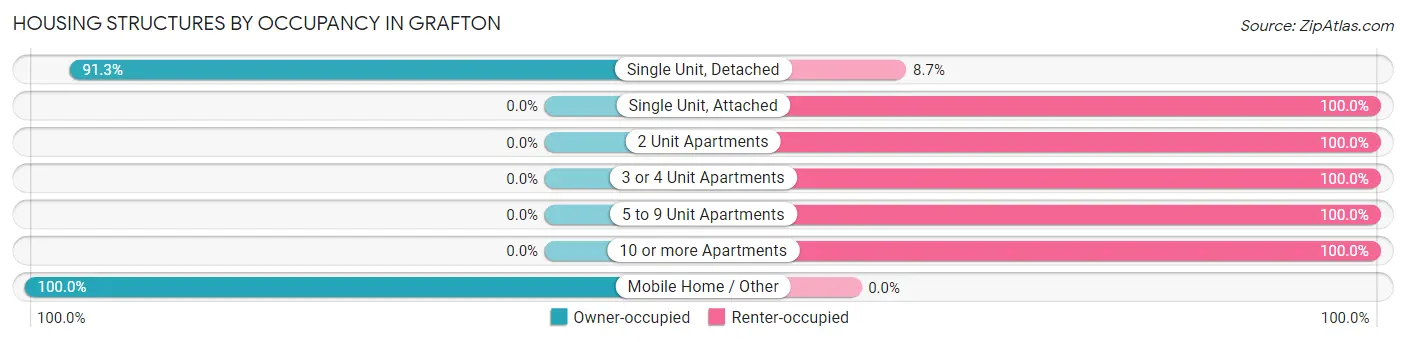
| Structure Type | Owner-occupied | Renter-occupied |
| Single Unit, Detached | 1,455 (91.3%) | 138 (8.7%) |
| Single Unit, Attached | 0 (0.0%) | 21 (100.0%) |
| 2 Unit Apartments | 0 (0.0%) | 16 (100.0%) |
| 3 or 4 Unit Apartments | 0 (0.0%) | 54 (100.0%) |
| 5 to 9 Unit Apartments | 0 (0.0%) | 115 (100.0%) |
| 10 or more Apartments | 0 (0.0%) | 67 (100.0%) |
| Mobile Home / Other | 31 (100.0%) | 0 (0.0%) |
| Total | 1,486 (78.3%) | 411 (21.7%) |
Housing Structures by Number of Rooms in Grafton
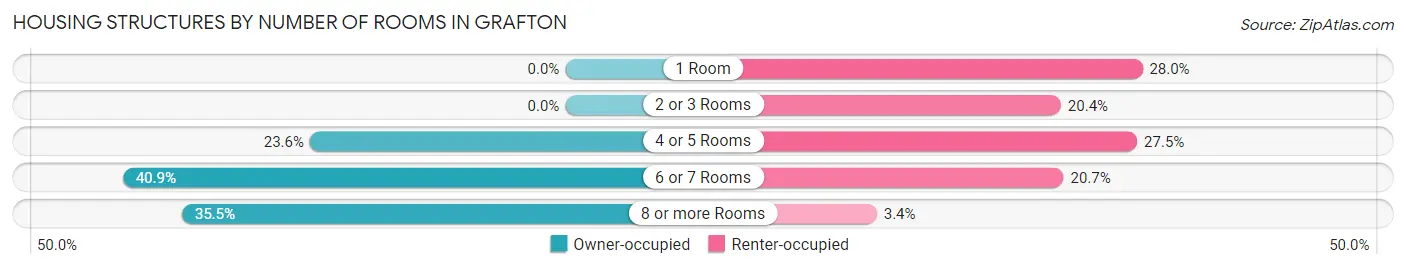
| Number of Rooms | Owner-occupied | Renter-occupied |
| 1 Room | 0 (0.0%) | 115 (28.0%) |
| 2 or 3 Rooms | 0 (0.0%) | 84 (20.4%) |
| 4 or 5 Rooms | 351 (23.6%) | 113 (27.5%) |
| 6 or 7 Rooms | 608 (40.9%) | 85 (20.7%) |
| 8 or more Rooms | 527 (35.5%) | 14 (3.4%) |
| Total | 1,486 (100.0%) | 411 (100.0%) |
Housing Structure by Heating Type in Grafton
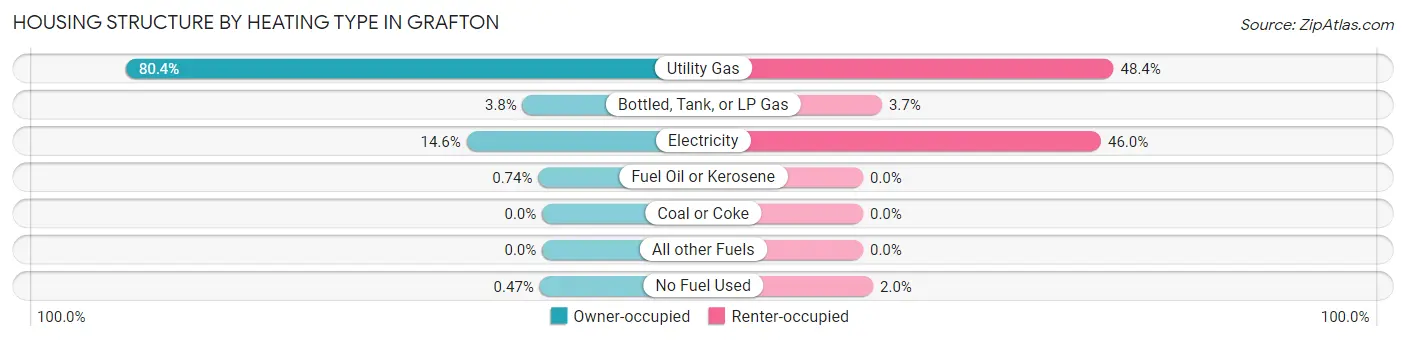
| Heating Type | Owner-occupied | Renter-occupied |
| Utility Gas | 1,195 (80.4%) | 199 (48.4%) |
| Bottled, Tank, or LP Gas | 56 (3.8%) | 15 (3.6%) |
| Electricity | 217 (14.6%) | 189 (46.0%) |
| Fuel Oil or Kerosene | 11 (0.7%) | 0 (0.0%) |
| Coal or Coke | 0 (0.0%) | 0 (0.0%) |
| All other Fuels | 0 (0.0%) | 0 (0.0%) |
| No Fuel Used | 7 (0.5%) | 8 (1.9%) |
| Total | 1,486 (100.0%) | 411 (100.0%) |
Household Vehicle Usage in Grafton
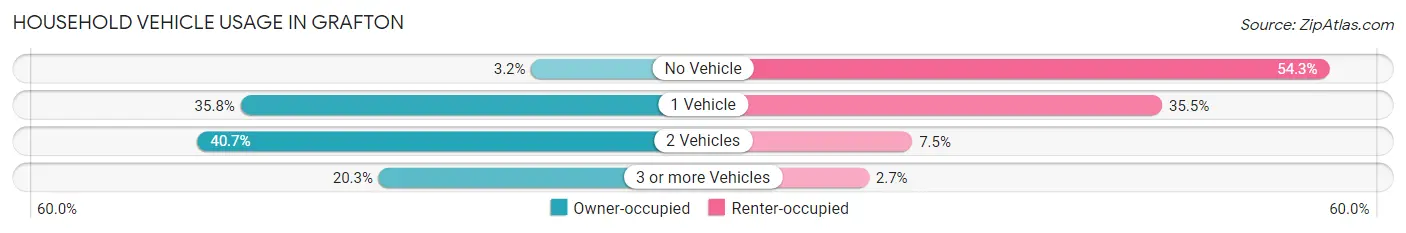
| Vehicles per Household | Owner-occupied | Renter-occupied |
| No Vehicle | 48 (3.2%) | 223 (54.3%) |
| 1 Vehicle | 532 (35.8%) | 146 (35.5%) |
| 2 Vehicles | 604 (40.6%) | 31 (7.5%) |
| 3 or more Vehicles | 302 (20.3%) | 11 (2.7%) |
| Total | 1,486 (100.0%) | 411 (100.0%) |
Real Estate & Mortgages in Grafton
Real Estate and Mortgage Overview in Grafton
| Characteristic | Without Mortgage | With Mortgage |
| Housing Units | 932 | 554 |
| Median Property Value | $58,700 | $101,500 |
| Median Household Income | $39,063 | $71 |
| Monthly Housing Costs | $359 | $53 |
| Real Estate Taxes | $488 | $5 |
Property Value by Mortgage Status in Grafton
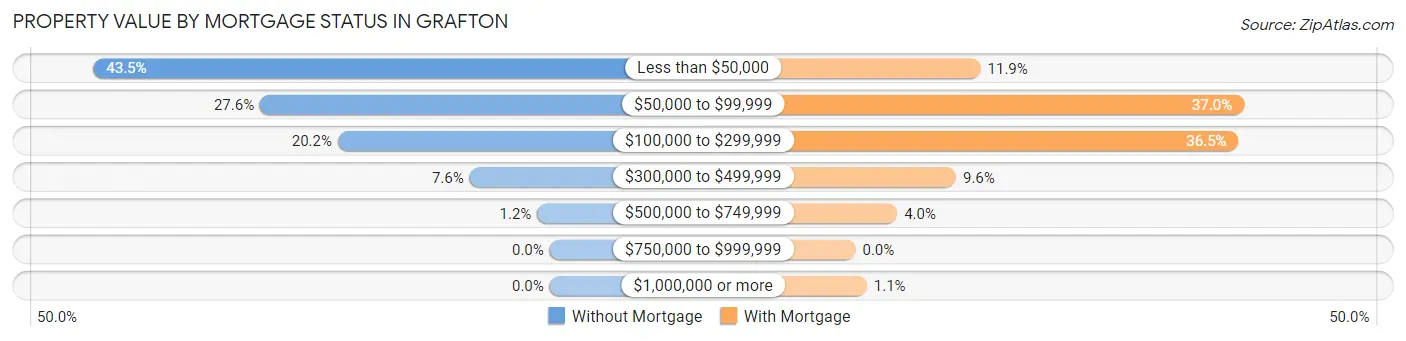
| Property Value | Without Mortgage | With Mortgage |
| Less than $50,000 | 405 (43.4%) | 66 (11.9%) |
| $50,000 to $99,999 | 257 (27.6%) | 205 (37.0%) |
| $100,000 to $299,999 | 188 (20.2%) | 202 (36.5%) |
| $300,000 to $499,999 | 71 (7.6%) | 53 (9.6%) |
| $500,000 to $749,999 | 11 (1.2%) | 22 (4.0%) |
| $750,000 to $999,999 | 0 (0.0%) | 0 (0.0%) |
| $1,000,000 or more | 0 (0.0%) | 6 (1.1%) |
| Total | 932 (100.0%) | 554 (100.0%) |
Household Income by Mortgage Status in Grafton
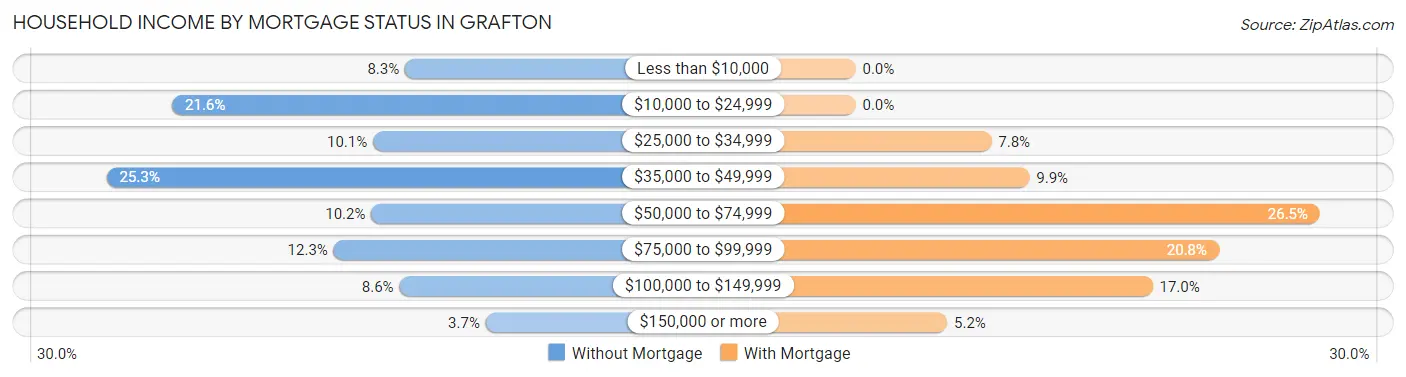
| Household Income | Without Mortgage | With Mortgage |
| Less than $10,000 | 77 (8.3%) | 0 (0.0%) |
| $10,000 to $24,999 | 201 (21.6%) | 0 (0.0%) |
| $25,000 to $34,999 | 94 (10.1%) | 43 (7.8%) |
| $35,000 to $49,999 | 236 (25.3%) | 55 (9.9%) |
| $50,000 to $74,999 | 95 (10.2%) | 147 (26.5%) |
| $75,000 to $99,999 | 115 (12.3%) | 115 (20.8%) |
| $100,000 to $149,999 | 80 (8.6%) | 94 (17.0%) |
| $150,000 or more | 34 (3.6%) | 29 (5.2%) |
| Total | 932 (100.0%) | 554 (100.0%) |
Property Value to Household Income Ratio in Grafton
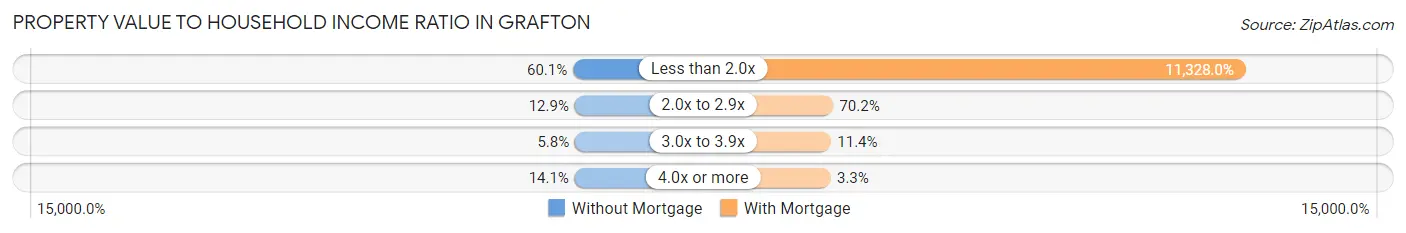
| Value-to-Income Ratio | Without Mortgage | With Mortgage |
| Less than 2.0x | 560 (60.1%) | 62,757 (11,328.0%) |
| 2.0x to 2.9x | 120 (12.9%) | 389 (70.2%) |
| 3.0x to 3.9x | 54 (5.8%) | 63 (11.4%) |
| 4.0x or more | 131 (14.1%) | 18 (3.3%) |
| Total | 932 (100.0%) | 554 (100.0%) |
Real Estate Taxes by Mortgage Status in Grafton
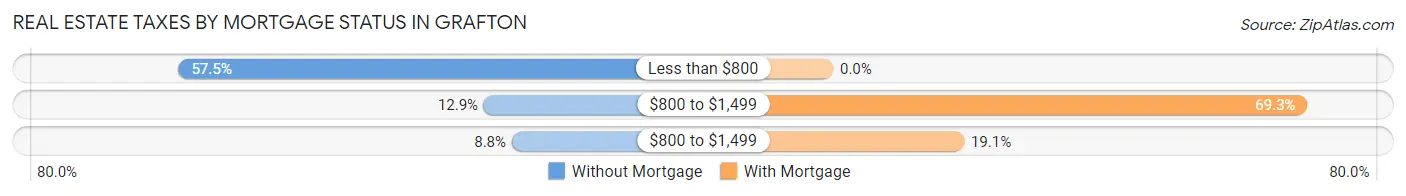
| Property Taxes | Without Mortgage | With Mortgage |
| Less than $800 | 536 (57.5%) | 0 (0.0%) |
| $800 to $1,499 | 120 (12.9%) | 384 (69.3%) |
| $800 to $1,499 | 82 (8.8%) | 106 (19.1%) |
| Total | 932 (100.0%) | 554 (100.0%) |
Health & Disability in Grafton
Health Insurance Coverage by Age in Grafton
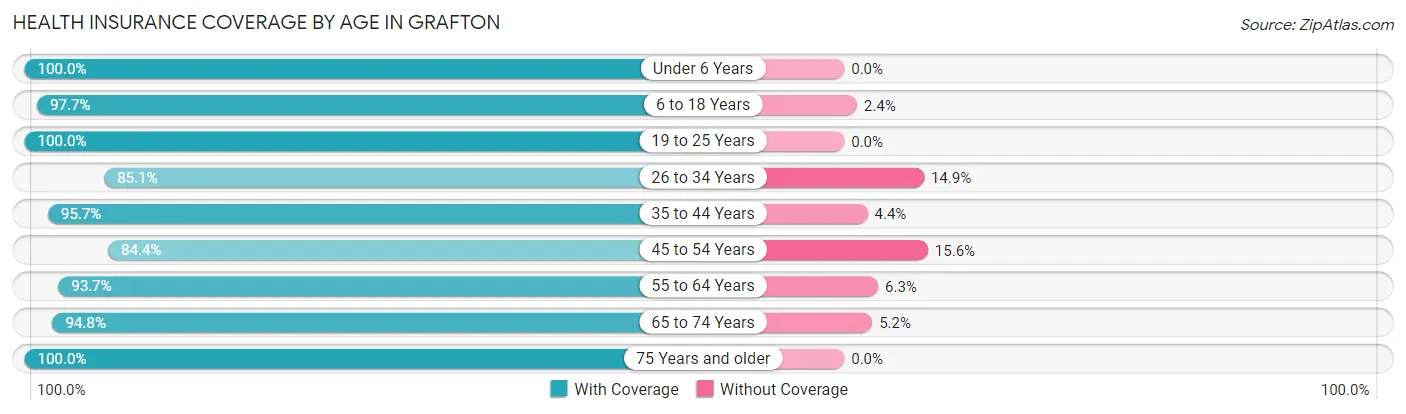
| Age Bracket | With Coverage | Without Coverage |
| Under 6 Years | 321 (100.0%) | 0 (0.0%) |
| 6 to 18 Years | 748 (97.7%) | 18 (2.4%) |
| 19 to 25 Years | 495 (100.0%) | 0 (0.0%) |
| 26 to 34 Years | 384 (85.1%) | 67 (14.9%) |
| 35 to 44 Years | 660 (95.7%) | 30 (4.3%) |
| 45 to 54 Years | 525 (84.4%) | 97 (15.6%) |
| 55 to 64 Years | 565 (93.7%) | 38 (6.3%) |
| 65 to 74 Years | 309 (94.8%) | 17 (5.2%) |
| 75 Years and older | 345 (100.0%) | 0 (0.0%) |
| Total | 4,352 (94.2%) | 267 (5.8%) |
Health Insurance Coverage by Citizenship Status in Grafton
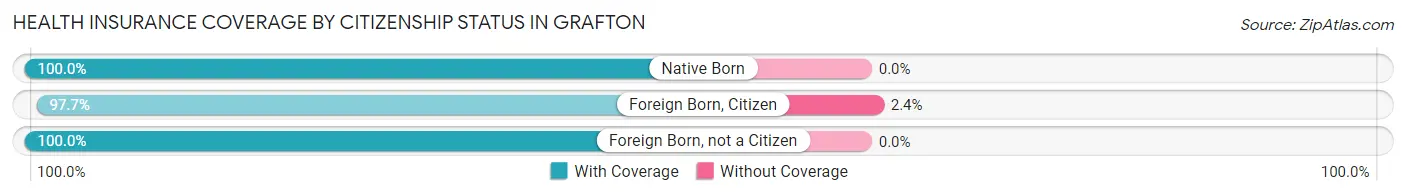
| Citizenship Status | With Coverage | Without Coverage |
| Native Born | 321 (100.0%) | 0 (0.0%) |
| Foreign Born, Citizen | 748 (97.7%) | 18 (2.4%) |
| Foreign Born, not a Citizen | 495 (100.0%) | 0 (0.0%) |
Health Insurance Coverage by Household Income in Grafton
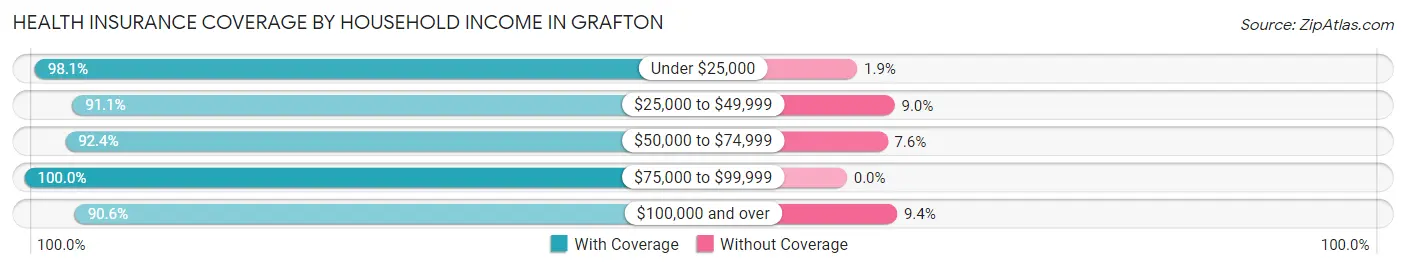
| Household Income | With Coverage | Without Coverage |
| Under $25,000 | 1,220 (98.1%) | 24 (1.9%) |
| $25,000 to $49,999 | 1,271 (91.0%) | 125 (8.9%) |
| $50,000 to $74,999 | 618 (92.4%) | 51 (7.6%) |
| $75,000 to $99,999 | 604 (100.0%) | 0 (0.0%) |
| $100,000 and over | 636 (90.6%) | 66 (9.4%) |
Public vs Private Health Insurance Coverage by Age in Grafton
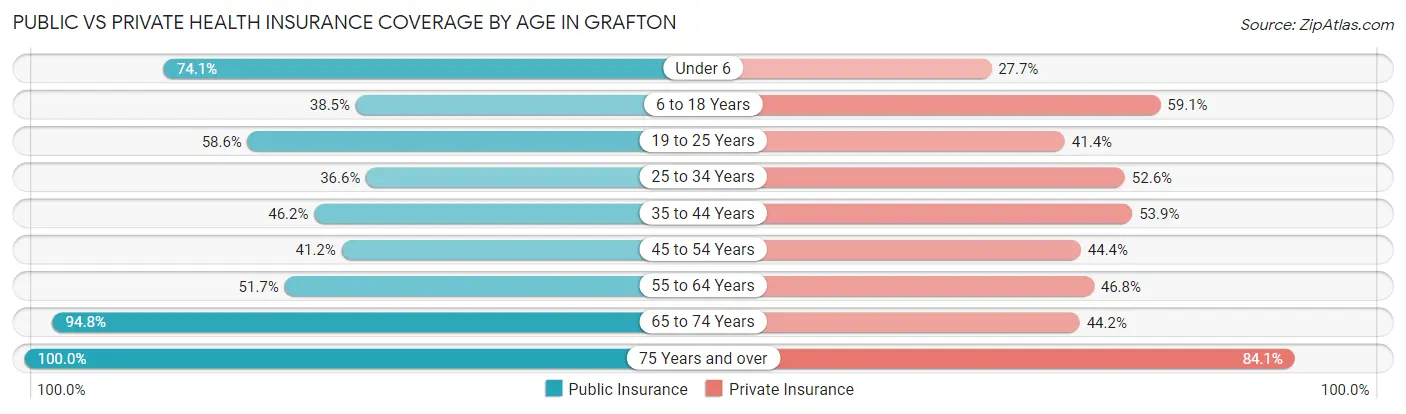
| Age Bracket | Public Insurance | Private Insurance |
| Under 6 | 238 (74.1%) | 89 (27.7%) |
| 6 to 18 Years | 295 (38.5%) | 453 (59.1%) |
| 19 to 25 Years | 290 (58.6%) | 205 (41.4%) |
| 25 to 34 Years | 165 (36.6%) | 237 (52.5%) |
| 35 to 44 Years | 319 (46.2%) | 372 (53.9%) |
| 45 to 54 Years | 256 (41.2%) | 276 (44.4%) |
| 55 to 64 Years | 312 (51.7%) | 282 (46.8%) |
| 65 to 74 Years | 309 (94.8%) | 144 (44.2%) |
| 75 Years and over | 345 (100.0%) | 290 (84.1%) |
| Total | 2,529 (54.7%) | 2,348 (50.8%) |
Disability Status by Sex by Age in Grafton
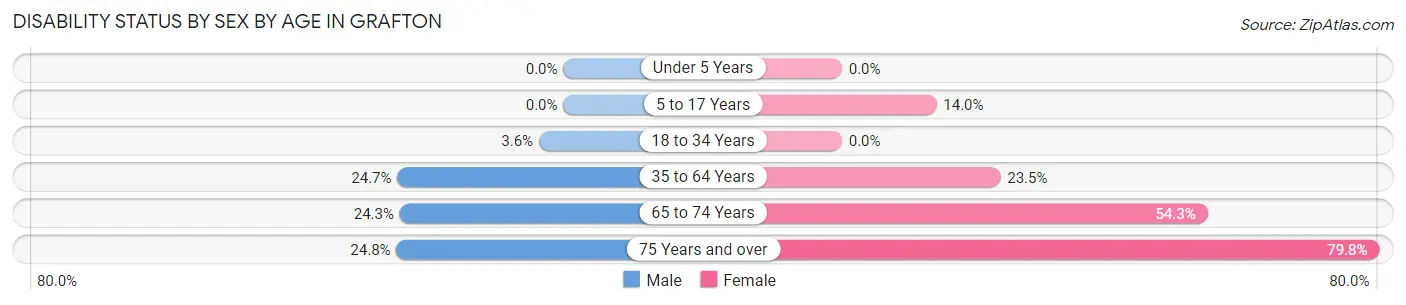
| Age Bracket | Male | Female |
| Under 5 Years | 0 (0.0%) | 0 (0.0%) |
| 5 to 17 Years | 0 (0.0%) | 48 (14.0%) |
| 18 to 34 Years | 17 (3.6%) | 0 (0.0%) |
| 35 to 64 Years | 250 (24.6%) | 212 (23.5%) |
| 65 to 74 Years | 34 (24.3%) | 101 (54.3%) |
| 75 Years and over | 29 (24.8%) | 182 (79.8%) |
Disability Class by Sex by Age in Grafton
Disability Class: Hearing Difficulty
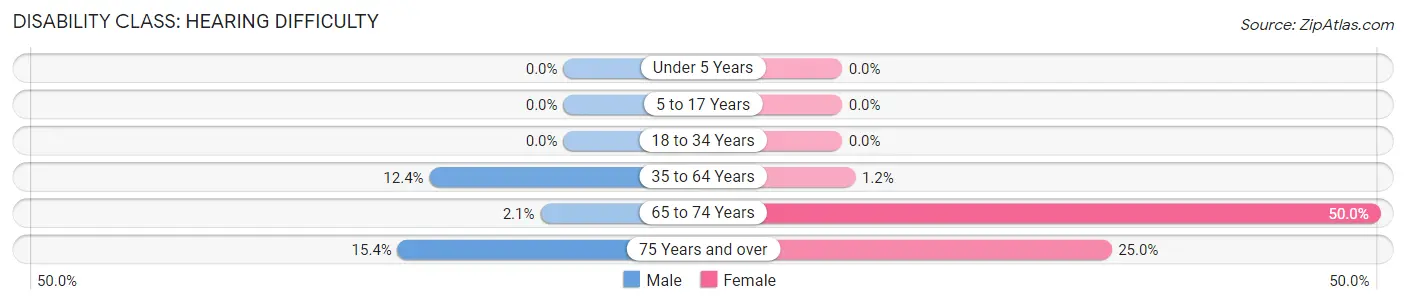
| Age Bracket | Male | Female |
| Under 5 Years | 0 (0.0%) | 0 (0.0%) |
| 5 to 17 Years | 0 (0.0%) | 0 (0.0%) |
| 18 to 34 Years | 0 (0.0%) | 0 (0.0%) |
| 35 to 64 Years | 126 (12.4%) | 11 (1.2%) |
| 65 to 74 Years | 3 (2.1%) | 93 (50.0%) |
| 75 Years and over | 18 (15.4%) | 57 (25.0%) |
Disability Class: Vision Difficulty
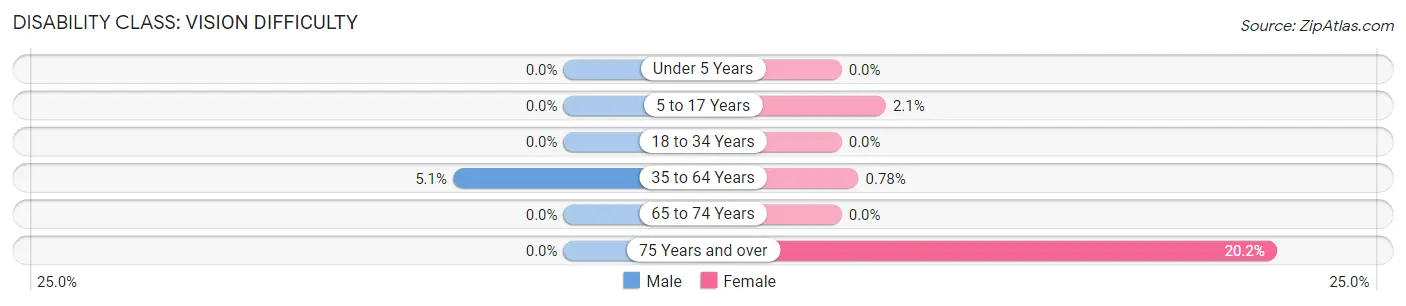
| Age Bracket | Male | Female |
| Under 5 Years | 0 (0.0%) | 0 (0.0%) |
| 5 to 17 Years | 0 (0.0%) | 7 (2.1%) |
| 18 to 34 Years | 0 (0.0%) | 0 (0.0%) |
| 35 to 64 Years | 52 (5.1%) | 7 (0.8%) |
| 65 to 74 Years | 0 (0.0%) | 0 (0.0%) |
| 75 Years and over | 0 (0.0%) | 46 (20.2%) |
Disability Class: Cognitive Difficulty
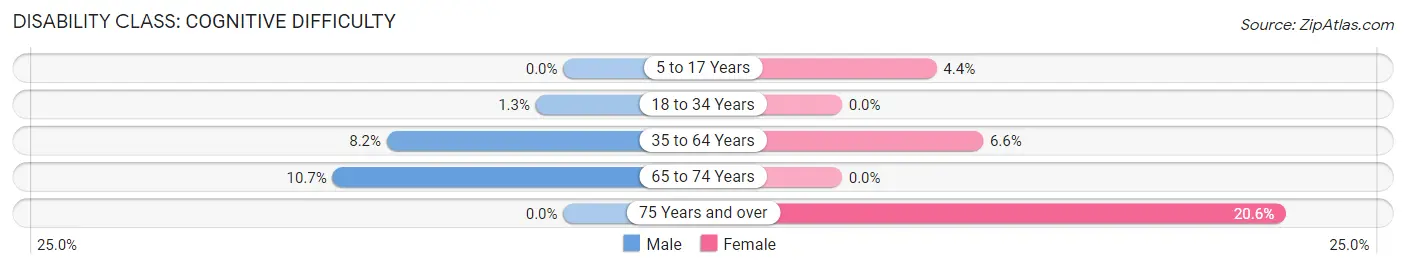
| Age Bracket | Male | Female |
| 5 to 17 Years | 0 (0.0%) | 15 (4.4%) |
| 18 to 34 Years | 6 (1.3%) | 0 (0.0%) |
| 35 to 64 Years | 83 (8.2%) | 59 (6.6%) |
| 65 to 74 Years | 15 (10.7%) | 0 (0.0%) |
| 75 Years and over | 0 (0.0%) | 47 (20.6%) |
Disability Class: Ambulatory Difficulty
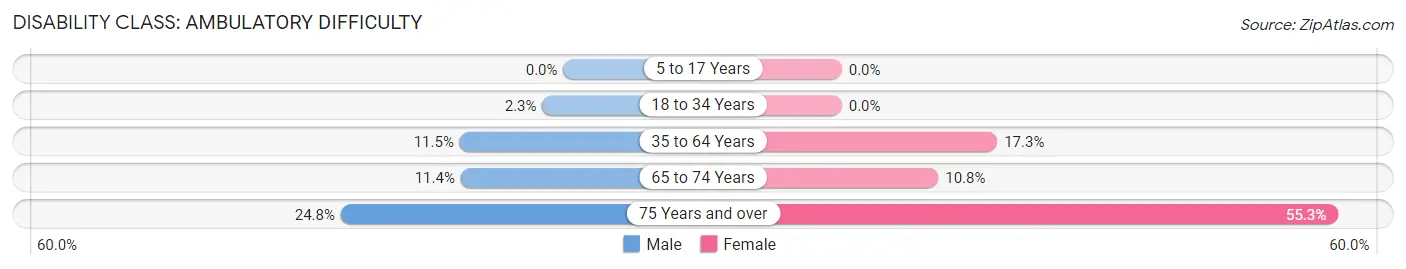
| Age Bracket | Male | Female |
| 5 to 17 Years | 0 (0.0%) | 0 (0.0%) |
| 18 to 34 Years | 11 (2.3%) | 0 (0.0%) |
| 35 to 64 Years | 117 (11.5%) | 156 (17.3%) |
| 65 to 74 Years | 16 (11.4%) | 20 (10.7%) |
| 75 Years and over | 29 (24.8%) | 126 (55.3%) |
Disability Class: Self-Care Difficulty
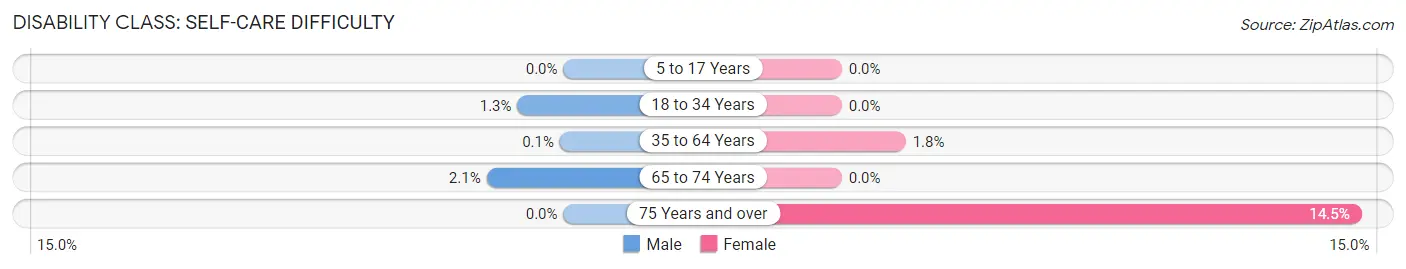
| Age Bracket | Male | Female |
| 5 to 17 Years | 0 (0.0%) | 0 (0.0%) |
| 18 to 34 Years | 6 (1.3%) | 0 (0.0%) |
| 35 to 64 Years | 1 (0.1%) | 16 (1.8%) |
| 65 to 74 Years | 3 (2.1%) | 0 (0.0%) |
| 75 Years and over | 0 (0.0%) | 33 (14.5%) |
Technology Access in Grafton
Computing Device Access in Grafton
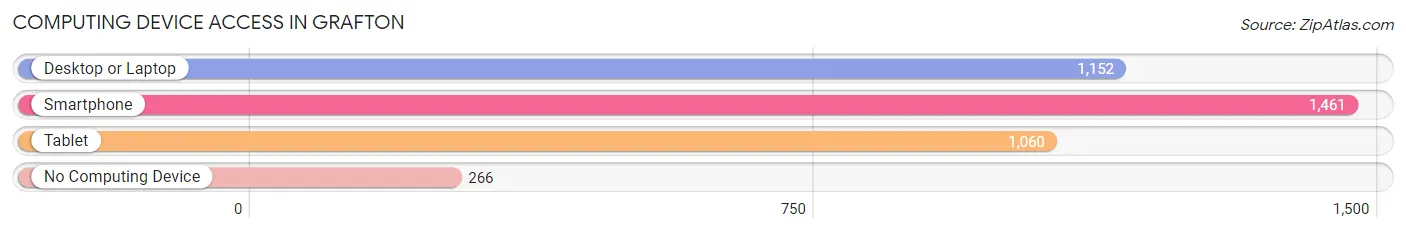
| Device Type | # Households | % Households |
| Desktop or Laptop | 1,152 | 60.7% |
| Smartphone | 1,461 | 77.0% |
| Tablet | 1,060 | 55.9% |
| No Computing Device | 266 | 14.0% |
| Total | 1,897 | 100.0% |
Internet Access in Grafton
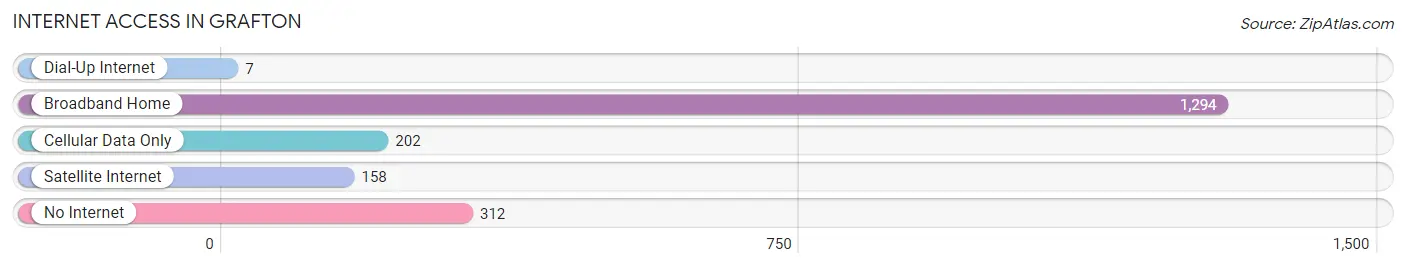
| Internet Type | # Households | % Households |
| Dial-Up Internet | 7 | 0.4% |
| Broadband Home | 1,294 | 68.2% |
| Cellular Data Only | 202 | 10.6% |
| Satellite Internet | 158 | 8.3% |
| No Internet | 312 | 16.5% |
| Total | 1,897 | 100.0% |
Grafton Summary
Grafton is a city located in Taylor County, West Virginia, United States. It is the county seat of Taylor County and is located along the Tygart Valley River. The population was 5,164 at the 2010 census.
History
Grafton was founded in 1856 by the Baltimore and Ohio Railroad. It was named after Grafton, Massachusetts, the hometown of one of the railroad's directors. The city was incorporated in 1871.
Grafton was the site of the first Mother's Day celebration in the United States. On May 10, 1908, Anna Jarvis held a memorial service at Andrews Methodist Episcopal Church in Grafton to honor her mother, Ann Reeves Jarvis.
Geography
Grafton is located at 39°17′N 79°43′W (39.28, -79.72). According to the United States Census Bureau, the city has a total area of 2.45 square miles (6.34 km2), all of it land.
Economy
Grafton is home to several businesses, including a Walmart Supercenter, a Lowe's Home Improvement store, and a variety of restaurants and other retail stores. The city is also home to several manufacturing companies, including Grafton Technologies, a manufacturer of plastic injection molded products, and Grafton Industries, a manufacturer of metal products.
Demographics
As of the census of 2010, there were 5,164 people, 2,093 households, and 1,323 families residing in the city. The population density was 2,098.6 people per square mile (808.7/km2). There were 2,309 housing units at an average density of 941.2 per square mile (362.9/km2). The racial makeup of the city was 97.2% White, 0.7% African American, 0.2% Native American, 0.3% Asian, 0.2% from other races, and 1.4% from two or more races. Hispanic or Latino of any race were 0.9% of the population.
There were 2,093 households, out of which 28.2% had children under the age of 18 living with them, 44.2% were married couples living together, 14.2% had a female householder with no husband present, and 36.7% were non-families. 32.2% of all households were made up of individuals, and 15.2% had someone living alone who was 65 years of age or older. The average household size was 2.30 and the average family size was 2.90.
In the city, the population was spread out, with 22.7% under the age of 18, 8.2% from 18 to 24, 25.7% from 25 to 44, 24.2% from 45 to 64, and 19.2% who were 65 years of age or older. The median age was 40 years. For every 100 females, there were 87.2 males. For every 100 females age 18 and over, there were 83.2 males.
The median income for a household in the city was $27,813, and the median income for a family was $35,938. Males had a median income of $30,917 versus $20,972 for females. The per capita income for the city was $15,945. About 14.2% of families and 17.7% of the population were below the poverty line, including 24.2% of those under age 18 and 11.2% of those age 65 or over.
Common Questions
What is Per Capita Income in Grafton?
Per Capita income in Grafton is $21,466.
What is the Median Family Income in Grafton?
Median Family Income in Grafton is $46,386.
What is the Median Household income in Grafton?
Median Household Income in Grafton is $38,934.
What is Income or Wage Gap in Grafton?
Income or Wage Gap in Grafton is 9.3%.
Women in Grafton earn 90.7 cents for every dollar earned by a man.
What is Family Income Deficit in Grafton?
Family Income Deficit in Grafton is $17,036.
Families that are below poverty line in Grafton earn $17,036 less on average than the poverty threshold level.
What is Inequality or Gini Index in Grafton?
Inequality or Gini Index in Grafton is 0.45.
What is the Total Population of Grafton?
Total Population of Grafton is 4,711.
What is the Total Male Population of Grafton?
Total Male Population of Grafton is 2,426.
What is the Total Female Population of Grafton?
Total Female Population of Grafton is 2,285.
What is the Ratio of Males per 100 Females in Grafton?
There are 106.17 Males per 100 Females in Grafton.
What is the Ratio of Females per 100 Males in Grafton?
There are 94.19 Females per 100 Males in Grafton.
What is the Median Population Age in Grafton?
Median Population Age in Grafton is 39.2 Years.
What is the Average Family Size in Grafton
Average Family Size in Grafton is 3.0 People.
What is the Average Household Size in Grafton
Average Household Size in Grafton is 2.4 People.
How Large is the Labor Force in Grafton?
There are 2,132 People in the Labor Forcein in Grafton.
What is the Percentage of People in the Labor Force in Grafton?
56.6% of People are in the Labor Force in Grafton.
What is the Unemployment Rate in Grafton?
Unemployment Rate in Grafton is 11.3%.