West Logan, WV Map & Demographics
West Logan Map
West Logan Overview
$19,379
PER CAPITA INCOME
$57,344
AVG FAMILY INCOME
$56,094
AVG HOUSEHOLD INCOME
1.4%
WAGE / INCOME GAP [ % ]
98.6¢/ $1
WAGE / INCOME GAP [ $ ]
0.35
INEQUALITY / GINI INDEX
349
TOTAL POPULATION
148
MALE POPULATION
201
FEMALE POPULATION
73.63
MALES / 100 FEMALES
135.81
FEMALES / 100 MALES
31.0
MEDIAN AGE
3.2
AVG FAMILY SIZE
2.8
AVG HOUSEHOLD SIZE
157
LABOR FORCE [ PEOPLE ]
57.5%
PERCENT IN LABOR FORCE
3.8%
UNEMPLOYMENT RATE
West Logan Area Codes
Income in West Logan
Income Overview in West Logan
Per Capita Income in West Logan is $19,379, while median incomes of families and households are $57,344 and $56,094 respectively.
| Characteristic | Number | Measure |
| Per Capita Income | 349 | $19,379 |
| Median Family Income | 93 | $57,344 |
| Mean Family Income | 93 | $53,440 |
| Median Household Income | 127 | $56,094 |
| Mean Household Income | 127 | $54,520 |
| Income Deficit | 93 | $0 |
| Wage / Income Gap (%) | 349 | 1.38% |
| Wage / Income Gap ($) | 349 | 98.62¢ per $1 |
| Gini / Inequality Index | 349 | 0.35 |
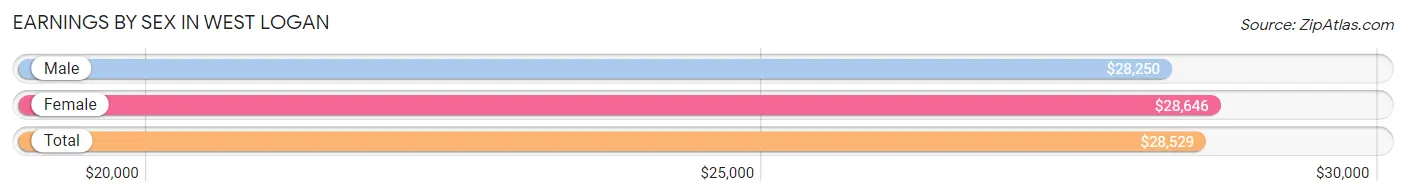
Earnings by Sex in West Logan
Average Earnings in West Logan are $28,529, $28,250 for men and $28,646 for women, a difference of 1.4%.
| Sex | Number | Average Earnings |
| Male | 87 (54.4%) | $28,250 |
| Female | 73 (45.6%) | $28,646 |
| Total | 160 (100.0%) | $28,529 |
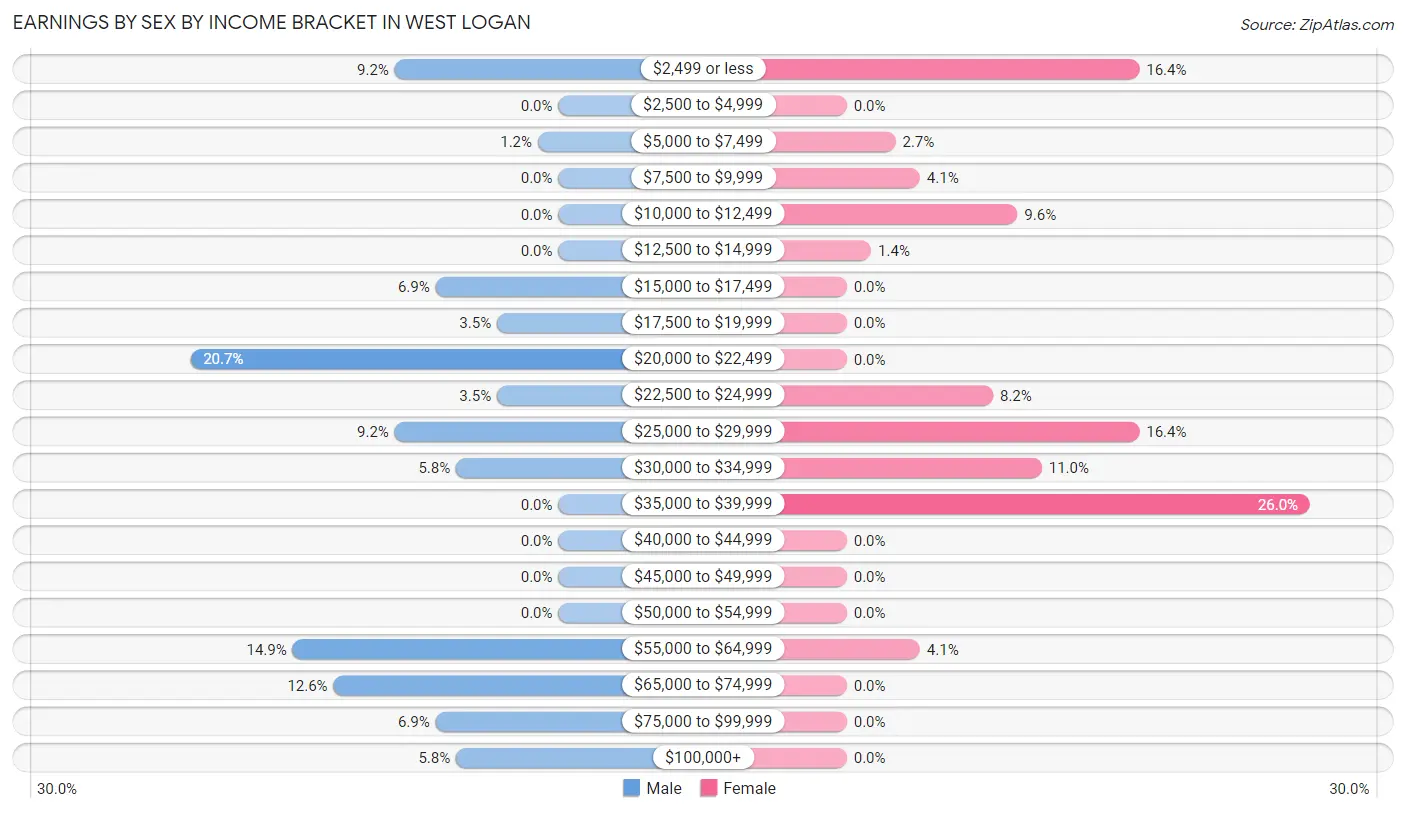
Earnings by Sex by Income Bracket in West Logan
The most common earnings brackets in West Logan are $20,000 to $22,499 for men (18 | 20.7%) and $35,000 to $39,999 for women (19 | 26.0%).
| Income | Male | Female |
| $2,499 or less | 8 (9.2%) | 12 (16.4%) |
| $2,500 to $4,999 | 0 (0.0%) | 0 (0.0%) |
| $5,000 to $7,499 | 1 (1.1%) | 2 (2.7%) |
| $7,500 to $9,999 | 0 (0.0%) | 3 (4.1%) |
| $10,000 to $12,499 | 0 (0.0%) | 7 (9.6%) |
| $12,500 to $14,999 | 0 (0.0%) | 1 (1.4%) |
| $15,000 to $17,499 | 6 (6.9%) | 0 (0.0%) |
| $17,500 to $19,999 | 3 (3.5%) | 0 (0.0%) |
| $20,000 to $22,499 | 18 (20.7%) | 0 (0.0%) |
| $22,500 to $24,999 | 3 (3.5%) | 6 (8.2%) |
| $25,000 to $29,999 | 8 (9.2%) | 12 (16.4%) |
| $30,000 to $34,999 | 5 (5.8%) | 8 (11.0%) |
| $35,000 to $39,999 | 0 (0.0%) | 19 (26.0%) |
| $40,000 to $44,999 | 0 (0.0%) | 0 (0.0%) |
| $45,000 to $49,999 | 0 (0.0%) | 0 (0.0%) |
| $50,000 to $54,999 | 0 (0.0%) | 0 (0.0%) |
| $55,000 to $64,999 | 13 (14.9%) | 3 (4.1%) |
| $65,000 to $74,999 | 11 (12.6%) | 0 (0.0%) |
| $75,000 to $99,999 | 6 (6.9%) | 0 (0.0%) |
| $100,000+ | 5 (5.8%) | 0 (0.0%) |
| Total | 87 (100.0%) | 73 (100.0%) |
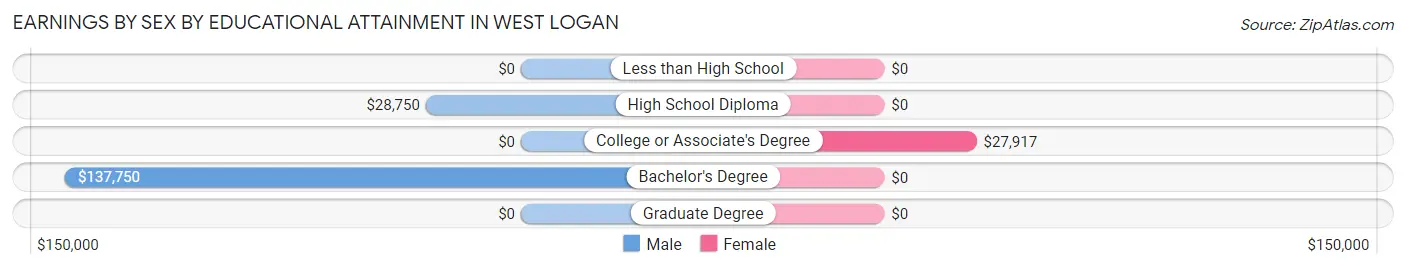
Earnings by Sex by Educational Attainment in West Logan
| Educational Attainment | Male Income | Female Income |
| Less than High School | - | - |
| High School Diploma | $28,750 | $0 |
| College or Associate's Degree | - | - |
| Bachelor's Degree | $137,750 | $0 |
| Graduate Degree | - | - |
| Total | - | - |
Family Income in West Logan
Family Income Brackets in West Logan
According to the West Logan family income data, there are 30 families falling into the $50,000 to $74,999 income range, which is the most common income bracket and makes up 32.3% of all families.
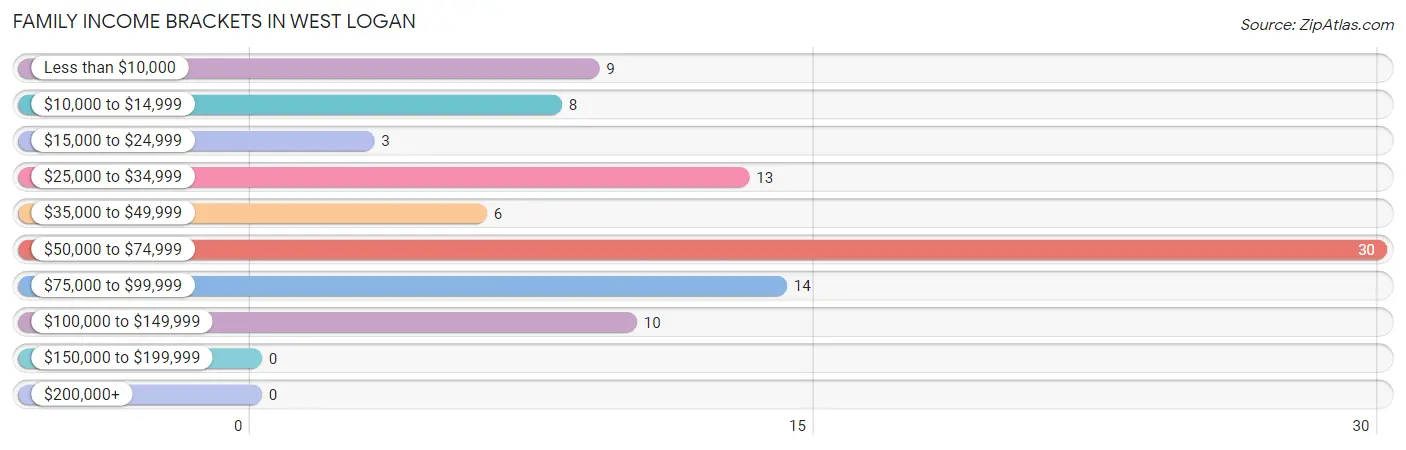
| Income Bracket | # Families | % Families |
| Less than $10,000 | 9 | 9.7% |
| $10,000 to $14,999 | 8 | 8.6% |
| $15,000 to $24,999 | 3 | 3.2% |
| $25,000 to $34,999 | 13 | 14.0% |
| $35,000 to $49,999 | 6 | 6.5% |
| $50,000 to $74,999 | 30 | 32.3% |
| $75,000 to $99,999 | 14 | 15.1% |
| $100,000 to $149,999 | 10 | 10.8% |
| $150,000 to $199,999 | 0 | 0.0% |
| $200,000+ | 0 | 0.0% |
Family Income by Famaliy Size in West Logan
4-person families (28 | 30.1%) account for the highest median family income in West Logan with $67,000 per family, while 2-person families (28 | 30.1%) have the highest median income of $28,750 per family member.
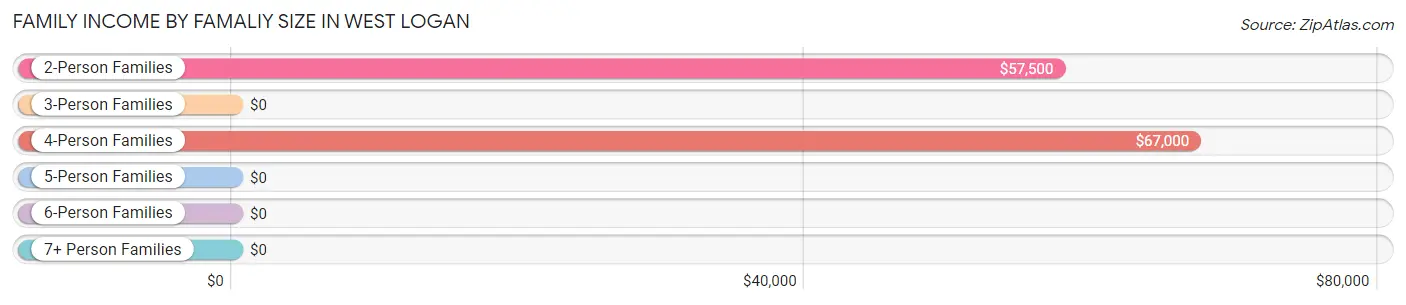
| Income Bracket | # Families | Median Income |
| 2-Person Families | 28 (30.1%) | $57,500 |
| 3-Person Families | 21 (22.6%) | $0 |
| 4-Person Families | 28 (30.1%) | $67,000 |
| 5-Person Families | 10 (10.7%) | $0 |
| 6-Person Families | 3 (3.2%) | $0 |
| 7+ Person Families | 3 (3.2%) | $0 |
| Total | 93 (100.0%) | $57,344 |
Family Income by Number of Earners in West Logan
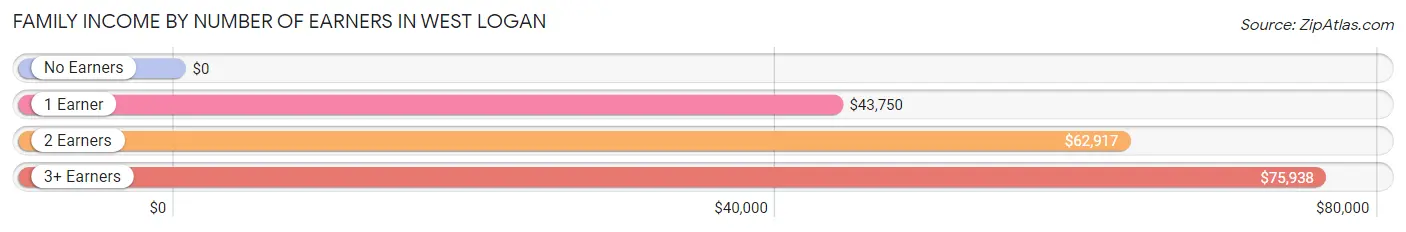
| Number of Earners | # Families | Median Income |
| No Earners | 15 (16.1%) | $0 |
| 1 Earner | 36 (38.7%) | $43,750 |
| 2 Earners | 19 (20.4%) | $62,917 |
| 3+ Earners | 23 (24.7%) | $75,938 |
| Total | 93 (100.0%) | $57,344 |
Household Income in West Logan
Household Income Brackets in West Logan
With 36 households falling in the category, the $50,000 to $74,999 income range is the most frequent in West Logan, accounting for 28.3% of all households.
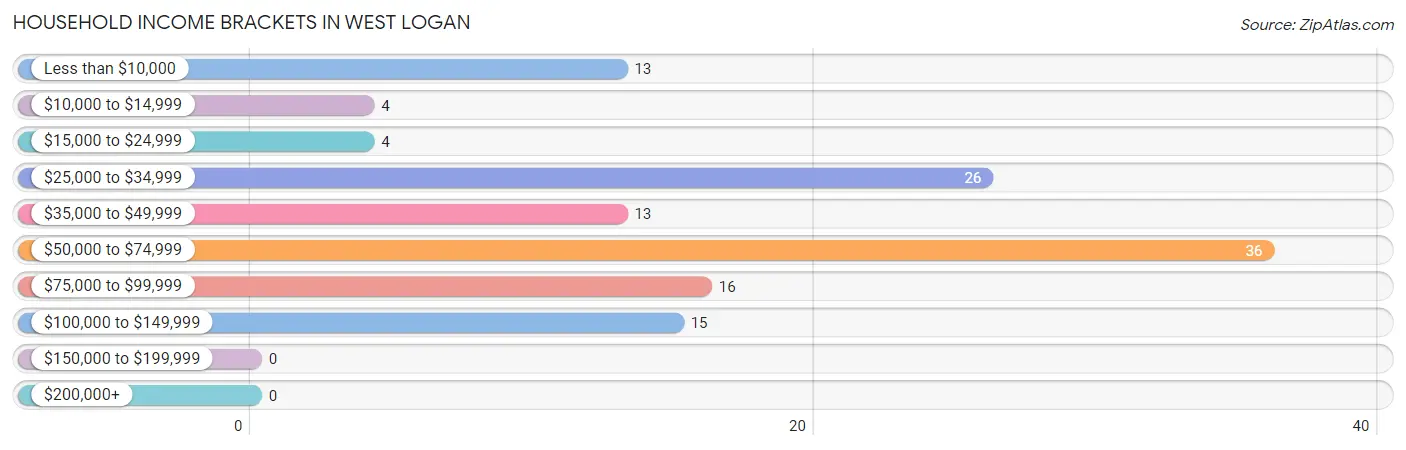
| Income Bracket | # Households | % Households |
| Less than $10,000 | 13 | 10.2% |
| $10,000 to $14,999 | 4 | 3.1% |
| $15,000 to $24,999 | 4 | 3.1% |
| $25,000 to $34,999 | 26 | 20.5% |
| $35,000 to $49,999 | 13 | 10.2% |
| $50,000 to $74,999 | 36 | 28.3% |
| $75,000 to $99,999 | 16 | 12.6% |
| $100,000 to $149,999 | 15 | 11.8% |
| $150,000 to $199,999 | 0 | 0.0% |
| $200,000+ | 0 | 0.0% |
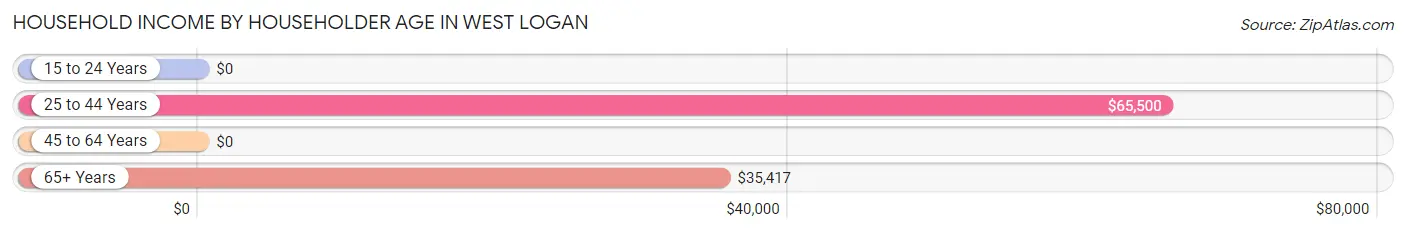
Household Income by Householder Age in West Logan
The median household income in West Logan is $56,094, with the highest median household income of $65,500 found in the 25 to 44 years age bracket for the primary householder. A total of 70 households (55.1%) fall into this category. Meanwhile, the 15 to 24 years age bracket for the primary householder has the lowest median household income of $0, with 1 households (0.8%) in this group.
| Income Bracket | # Households | Median Income |
| 15 to 24 Years | 1 (0.8%) | $0 |
| 25 to 44 Years | 70 (55.1%) | $65,500 |
| 45 to 64 Years | 31 (24.4%) | $0 |
| 65+ Years | 25 (19.7%) | $35,417 |
| Total | 127 (100.0%) | $56,094 |
Poverty in West Logan
Income Below Poverty by Sex and Age in West Logan
With 16.2% poverty level for males and 24.4% for females among the residents of West Logan, 18 to 24 year old males and 18 to 24 year old females are the most vulnerable to poverty, with 3 males (60.0%) and 10 females (90.9%) in their respective age groups living below the poverty level.
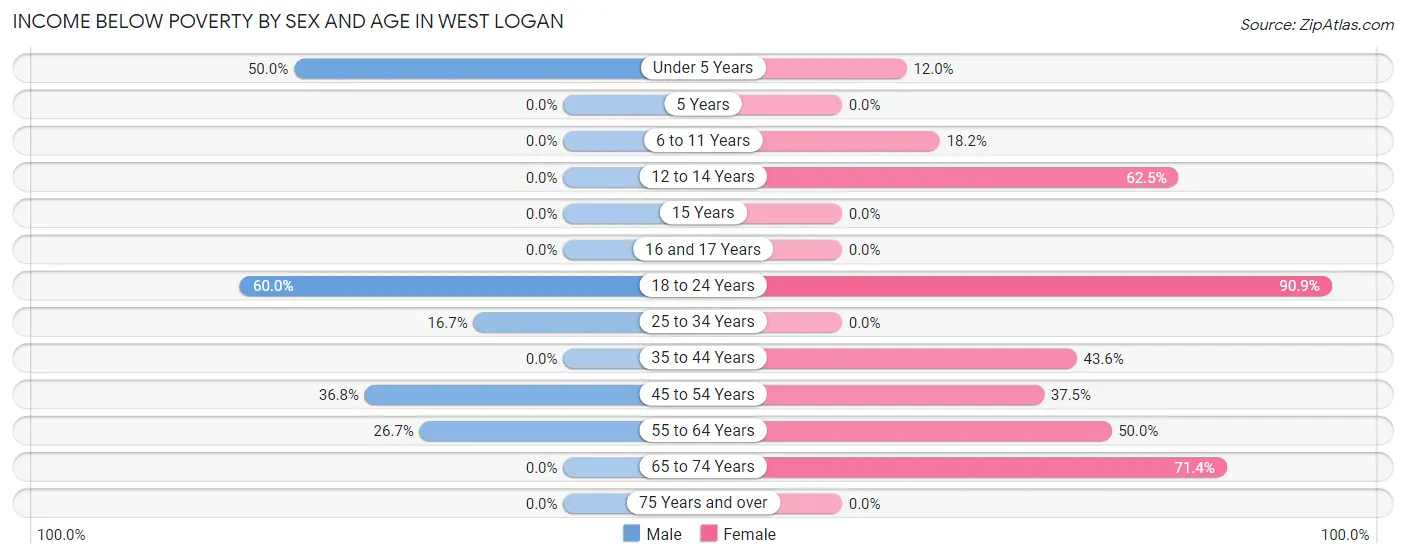
| Age Bracket | Male | Female |
| Under 5 Years | 4 (50.0%) | 3 (12.0%) |
| 5 Years | 0 (0.0%) | 0 (0.0%) |
| 6 to 11 Years | 0 (0.0%) | 2 (18.2%) |
| 12 to 14 Years | 0 (0.0%) | 5 (62.5%) |
| 15 Years | 0 (0.0%) | 0 (0.0%) |
| 16 and 17 Years | 0 (0.0%) | 0 (0.0%) |
| 18 to 24 Years | 3 (60.0%) | 10 (90.9%) |
| 25 to 34 Years | 6 (16.7%) | 0 (0.0%) |
| 35 to 44 Years | 0 (0.0%) | 17 (43.6%) |
| 45 to 54 Years | 7 (36.8%) | 3 (37.5%) |
| 55 to 64 Years | 4 (26.7%) | 4 (50.0%) |
| 65 to 74 Years | 0 (0.0%) | 5 (71.4%) |
| 75 Years and over | 0 (0.0%) | 0 (0.0%) |
| Total | 24 (16.2%) | 49 (24.4%) |
Income Above Poverty by Sex and Age in West Logan
According to the poverty statistics in West Logan, males aged 6 to 11 years and females aged 15 years are the age groups that are most secure financially, with 100.0% of males and 100.0% of females in these age groups living above the poverty line.
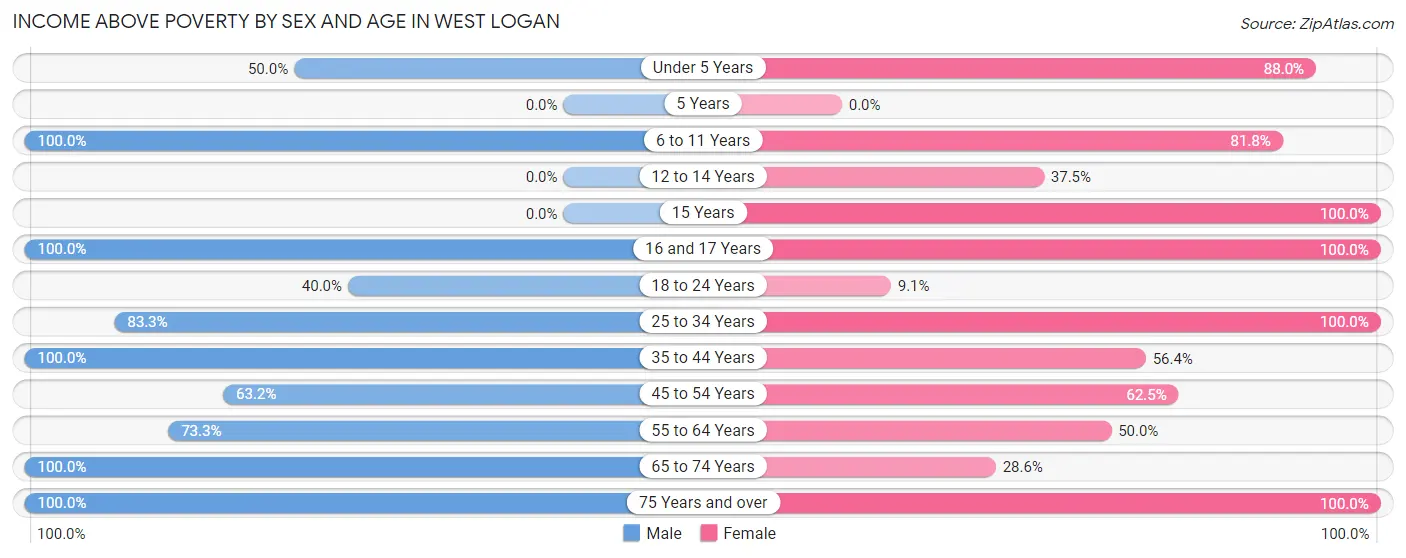
| Age Bracket | Male | Female |
| Under 5 Years | 4 (50.0%) | 22 (88.0%) |
| 5 Years | 0 (0.0%) | 0 (0.0%) |
| 6 to 11 Years | 15 (100.0%) | 9 (81.8%) |
| 12 to 14 Years | 0 (0.0%) | 3 (37.5%) |
| 15 Years | 0 (0.0%) | 9 (100.0%) |
| 16 and 17 Years | 11 (100.0%) | 6 (100.0%) |
| 18 to 24 Years | 2 (40.0%) | 1 (9.1%) |
| 25 to 34 Years | 30 (83.3%) | 59 (100.0%) |
| 35 to 44 Years | 27 (100.0%) | 22 (56.4%) |
| 45 to 54 Years | 12 (63.2%) | 5 (62.5%) |
| 55 to 64 Years | 11 (73.3%) | 4 (50.0%) |
| 65 to 74 Years | 9 (100.0%) | 2 (28.6%) |
| 75 Years and over | 3 (100.0%) | 10 (100.0%) |
| Total | 124 (83.8%) | 152 (75.6%) |
Income Below Poverty Among Married-Couple Families in West Logan
The poverty statistics for married-couple families in West Logan show that 17.8% or 13 of the total 73 families live below the poverty line. Families with no children have the highest poverty rate of 29.2%, comprising of 7 families. On the other hand, families with 3 or 4 children have the lowest poverty rate of 0.0%, which includes 0 families.
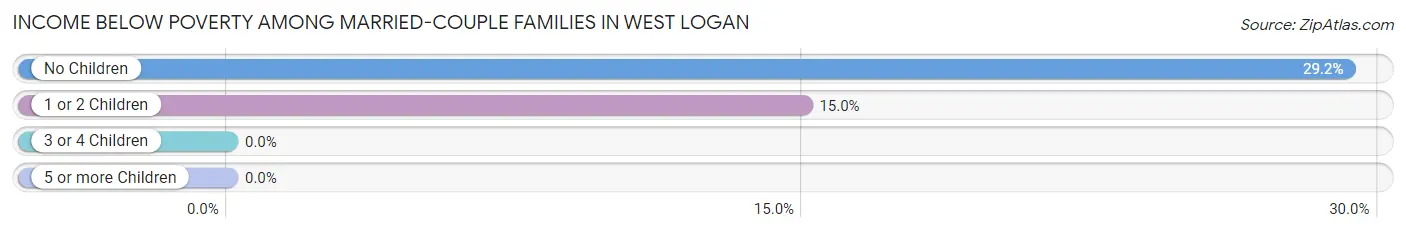
| Children | Above Poverty | Below Poverty |
| No Children | 17 (70.8%) | 7 (29.2%) |
| 1 or 2 Children | 34 (85.0%) | 6 (15.0%) |
| 3 or 4 Children | 9 (100.0%) | 0 (0.0%) |
| 5 or more Children | 0 (0.0%) | 0 (0.0%) |
| Total | 60 (82.2%) | 13 (17.8%) |
Income Below Poverty Among Single-Parent Households in West Logan
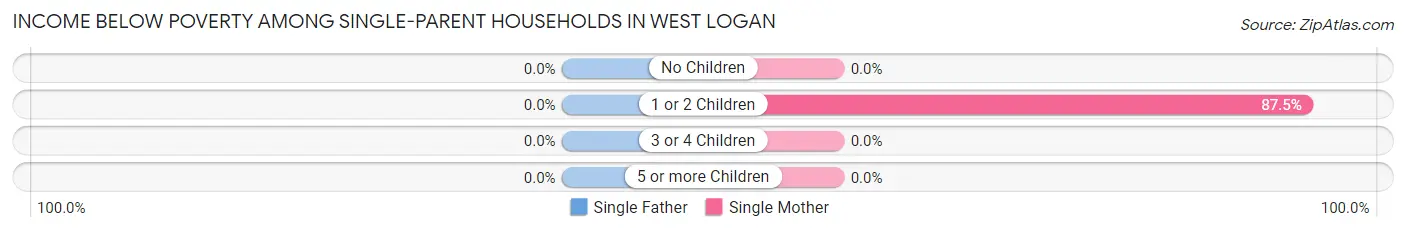
| Children | Single Father | Single Mother |
| No Children | 0 (0.0%) | 0 (0.0%) |
| 1 or 2 Children | 0 (0.0%) | 7 (87.5%) |
| 3 or 4 Children | 0 (0.0%) | 0 (0.0%) |
| 5 or more Children | 0 (0.0%) | 0 (0.0%) |
| Total | 0 (0.0%) | 7 (53.8%) |
Income Below Poverty Among Married-Couple vs Single-Parent Households in West Logan
The poverty data for West Logan shows that 13 of the married-couple family households (17.8%) and 7 of the single-parent households (35.0%) are living below the poverty level. Within the married-couple family households, those with no children have the highest poverty rate, with 7 households (29.2%) falling below the poverty line. Among the single-parent households, those with 1 or 2 children have the highest poverty rate, with 7 household (50.0%) living below poverty.
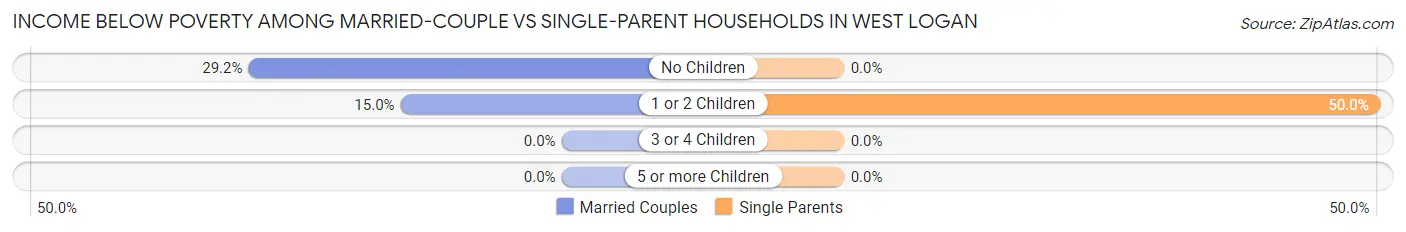
| Children | Married-Couple Families | Single-Parent Households |
| No Children | 7 (29.2%) | 0 (0.0%) |
| 1 or 2 Children | 6 (15.0%) | 7 (50.0%) |
| 3 or 4 Children | 0 (0.0%) | 0 (0.0%) |
| 5 or more Children | 0 (0.0%) | 0 (0.0%) |
| Total | 13 (17.8%) | 7 (35.0%) |
Race in West Logan
The most populous races in West Logan are White / Caucasian (303 | 86.8%), Two or more Races (36 | 10.3%), and Black / African American (10 | 2.9%).
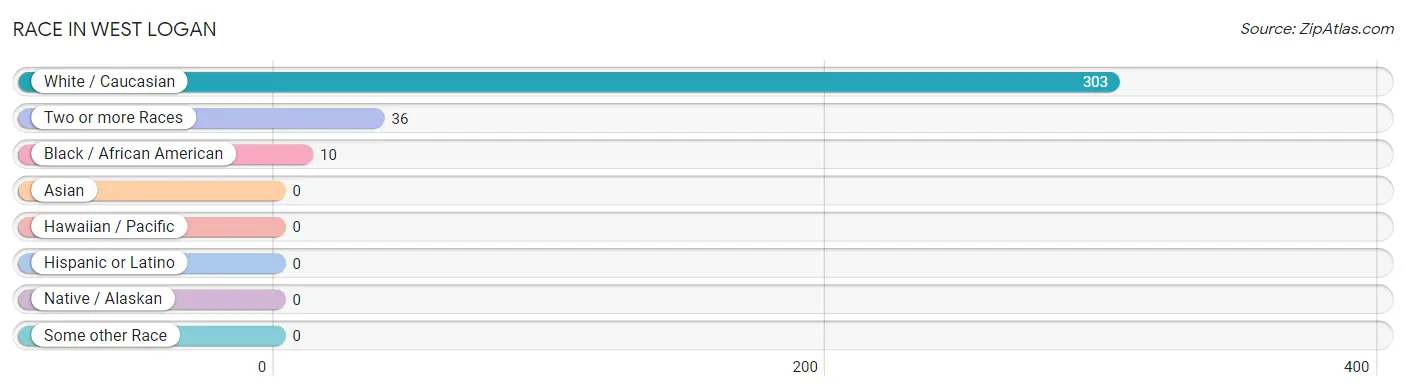
| Race | # Population | % Population |
| Asian | 0 | 0.0% |
| Black / African American | 10 | 2.9% |
| Hawaiian / Pacific | 0 | 0.0% |
| Hispanic or Latino | 0 | 0.0% |
| Native / Alaskan | 0 | 0.0% |
| White / Caucasian | 303 | 86.8% |
| Two or more Races | 36 | 10.3% |
| Some other Race | 0 | 0.0% |
| Total | 349 | 100.0% |
Ancestry in West Logan
The most populous ancestries reported in West Logan are Irish (67 | 19.2%), English (56 | 16.1%), German (50 | 14.3%), American (49 | 14.0%), and Italian (22 | 6.3%), together accounting for 69.9% of all West Logan residents.
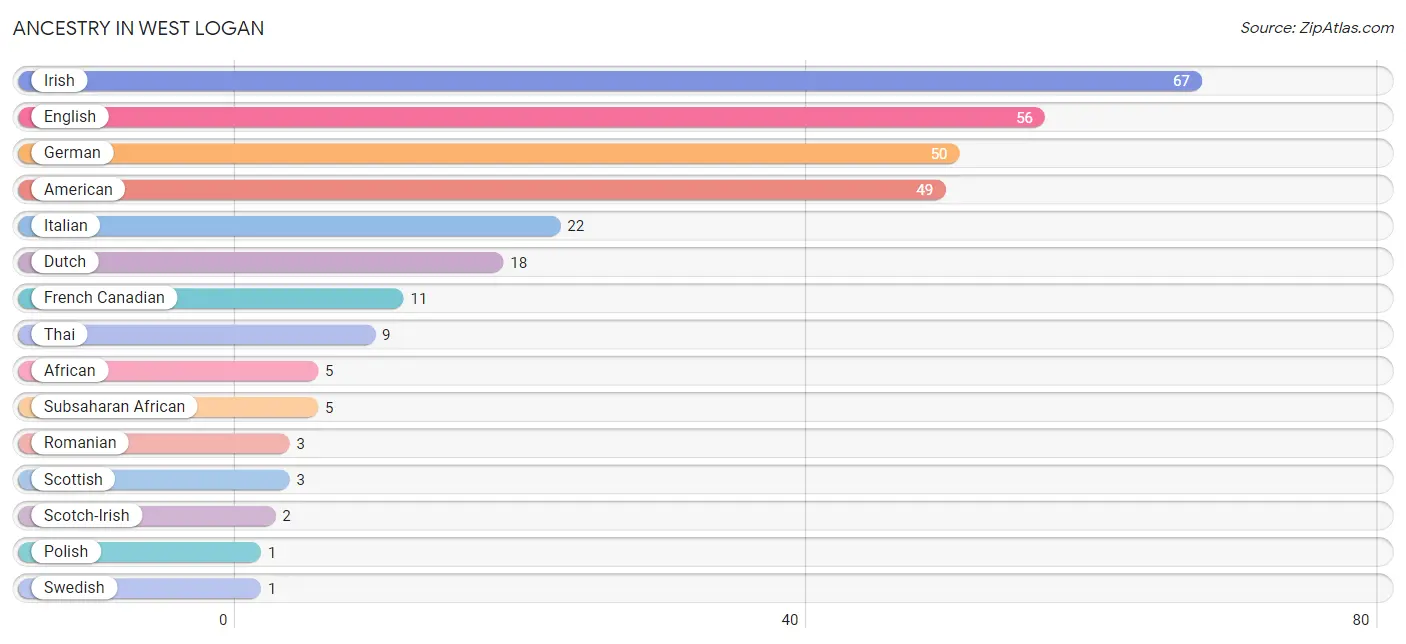
| Ancestry | # Population | % Population |
| African | 5 | 1.4% |
| American | 49 | 14.0% |
| Dutch | 18 | 5.2% |
| English | 56 | 16.1% |
| French Canadian | 11 | 3.2% |
| German | 50 | 14.3% |
| Irish | 67 | 19.2% |
| Italian | 22 | 6.3% |
| Polish | 1 | 0.3% |
| Romanian | 3 | 0.9% |
| Scotch-Irish | 2 | 0.6% |
| Scottish | 3 | 0.9% |
| Subsaharan African | 5 | 1.4% |
| Swedish | 1 | 0.3% |
| Thai | 9 | 2.6% | View All 15 Rows |
Immigrants in West Logan

| Immigration Origin | # Population | % Population | View All 0 Rows |
Sex and Age in West Logan
Sex and Age in West Logan
The most populous age groups in West Logan are 25 to 29 Years (22 | 14.9%) for men and 25 to 29 Years (41 | 20.4%) for women.
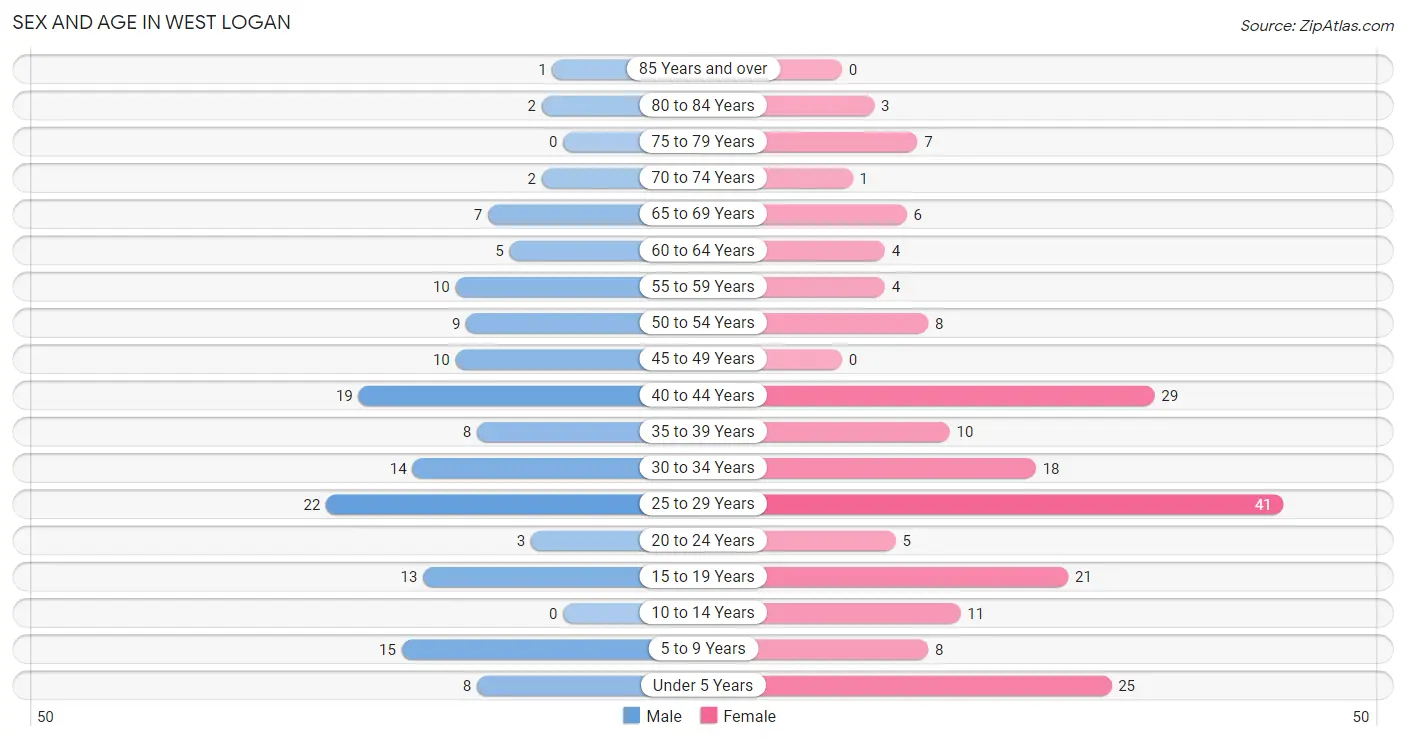
| Age Bracket | Male | Female |
| Under 5 Years | 8 (5.4%) | 25 (12.4%) |
| 5 to 9 Years | 15 (10.1%) | 8 (4.0%) |
| 10 to 14 Years | 0 (0.0%) | 11 (5.5%) |
| 15 to 19 Years | 13 (8.8%) | 21 (10.4%) |
| 20 to 24 Years | 3 (2.0%) | 5 (2.5%) |
| 25 to 29 Years | 22 (14.9%) | 41 (20.4%) |
| 30 to 34 Years | 14 (9.5%) | 18 (9.0%) |
| 35 to 39 Years | 8 (5.4%) | 10 (5.0%) |
| 40 to 44 Years | 19 (12.8%) | 29 (14.4%) |
| 45 to 49 Years | 10 (6.8%) | 0 (0.0%) |
| 50 to 54 Years | 9 (6.1%) | 8 (4.0%) |
| 55 to 59 Years | 10 (6.8%) | 4 (2.0%) |
| 60 to 64 Years | 5 (3.4%) | 4 (2.0%) |
| 65 to 69 Years | 7 (4.7%) | 6 (3.0%) |
| 70 to 74 Years | 2 (1.3%) | 1 (0.5%) |
| 75 to 79 Years | 0 (0.0%) | 7 (3.5%) |
| 80 to 84 Years | 2 (1.3%) | 3 (1.5%) |
| 85 Years and over | 1 (0.7%) | 0 (0.0%) |
| Total | 148 (100.0%) | 201 (100.0%) |
Families and Households in West Logan
Median Family Size in West Logan
The median family size in West Logan is 3.22 persons per family, with single male/father families (7 | 7.5%) accounting for the largest median family size of 4.29 persons per family. On the other hand, single female/mother families (13 | 14.0%) represent the smallest median family size with 1.85 persons per family.
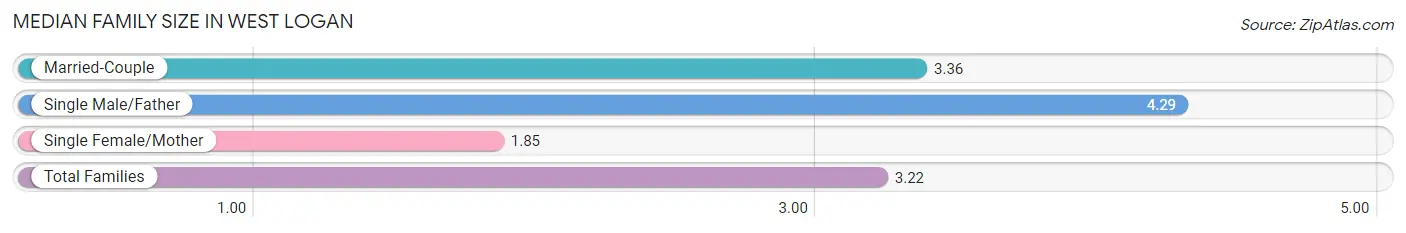
| Family Type | # Families | Family Size |
| Married-Couple | 73 (78.5%) | 3.36 |
| Single Male/Father | 7 (7.5%) | 4.29 |
| Single Female/Mother | 13 (14.0%) | 1.85 |
| Total Families | 93 (100.0%) | 3.22 |
Median Household Size in West Logan
The median household size in West Logan is 2.75 persons per household, with single male/father households (7 | 5.5%) accounting for the largest median household size of 4.29 persons per household. non-family households (34 | 26.8%) represent the smallest median household size with 1.18 persons per household.
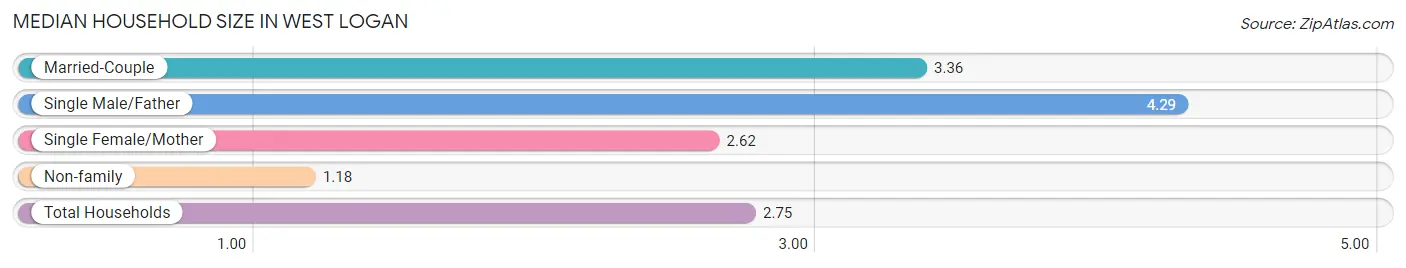
| Household Type | # Households | Household Size |
| Married-Couple | 73 (57.5%) | 3.36 |
| Single Male/Father | 7 (5.5%) | 4.29 |
| Single Female/Mother | 13 (10.2%) | 2.62 |
| Non-family | 34 (26.8%) | 1.18 |
| Total Households | 127 (100.0%) | 2.75 |
Household Size by Marriage Status in West Logan
Out of a total of 127 households in West Logan, 93 (73.2%) are family households, while 34 (26.8%) are nonfamily households. The most numerous type of family households are 3-person households, comprising 28, and the most common type of nonfamily households are 1-person households, comprising 28.
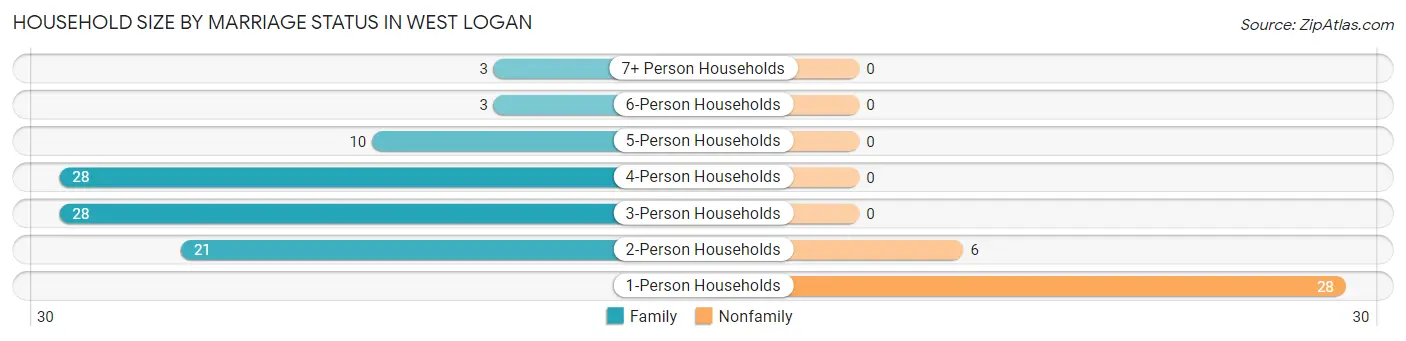
| Household Size | Family Households | Nonfamily Households |
| 1-Person Households | - | 28 (22.1%) |
| 2-Person Households | 21 (16.5%) | 6 (4.7%) |
| 3-Person Households | 28 (22.1%) | 0 (0.0%) |
| 4-Person Households | 28 (22.1%) | 0 (0.0%) |
| 5-Person Households | 10 (7.9%) | 0 (0.0%) |
| 6-Person Households | 3 (2.4%) | 0 (0.0%) |
| 7+ Person Households | 3 (2.4%) | 0 (0.0%) |
| Total | 93 (73.2%) | 34 (26.8%) |
Female Fertility in West Logan
Fertility by Age in West Logan
| Age Bracket | Women with Births | Births / 1,000 Women |
| 15 to 19 years | 0 (0.0%) | 0.0 |
| 20 to 34 years | 0 (0.0%) | 0.0 |
| 35 to 50 years | 0 (0.0%) | 0.0 |
| Total | 0 (0.0%) | 0.0 |
Fertility by Age by Marriage Status in West Logan
| Age Bracket | Married | Unmarried |
| 15 to 19 years | 0 (0.0%) | 0 (0.0%) |
| 20 to 34 years | 0 (0.0%) | 0 (0.0%) |
| 35 to 50 years | 0 (0.0%) | 0 (0.0%) |
| Total | 0 (0.0%) | 0 (0.0%) |
Fertility by Education in West Logan
| Educational Attainment | Women with Births | Births / 1,000 Women |
| Less than High School | 0 (0.0%) | 0.0 |
| High School Diploma | 0 (0.0%) | 0.0 |
| College or Associate's Degree | 0 (0.0%) | 0.0 |
| Bachelor's Degree | 0 (0.0%) | 0.0 |
| Graduate Degree | 0 (0.0%) | 0.0 |
| Total | 0 (0.0%) | 0.0 |
Fertility by Education by Marriage Status in West Logan
| Educational Attainment | Married | Unmarried |
| Less than High School | 0 (0.0%) | 0 (0.0%) |
| High School Diploma | 0 (0.0%) | 0 (0.0%) |
| College or Associate's Degree | 0 (0.0%) | 0 (0.0%) |
| Bachelor's Degree | 0 (0.0%) | 0 (0.0%) |
| Graduate Degree | 0 (0.0%) | 0 (0.0%) |
| Total | 0 (0.0%) | 0 (0.0%) |
Employment Characteristics in West Logan
Employment by Class of Employer in West Logan
Among the 149 employed individuals in West Logan, private company employees (107 | 71.8%), not-for-profit organizations (21 | 14.1%), and federal government employees (11 | 7.4%) make up the most common classes of employment.
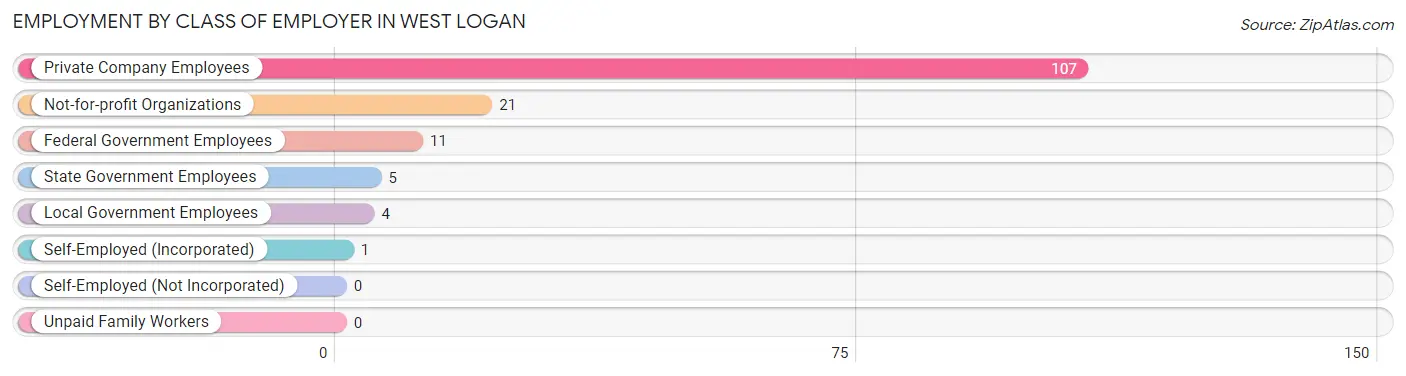
| Employer Class | # Employees | % Employees |
| Private Company Employees | 107 | 71.8% |
| Self-Employed (Incorporated) | 1 | 0.7% |
| Self-Employed (Not Incorporated) | 0 | 0.0% |
| Not-for-profit Organizations | 21 | 14.1% |
| Local Government Employees | 4 | 2.7% |
| State Government Employees | 5 | 3.4% |
| Federal Government Employees | 11 | 7.4% |
| Unpaid Family Workers | 0 | 0.0% |
| Total | 149 | 100.0% |
Employment Status by Age in West Logan
According to the labor force statistics for West Logan, out of the total population over 16 years of age (273), 57.5% or 157 individuals are in the labor force, with 3.8% or 6 of them unemployed. The age group with the highest labor force participation rate is 25 to 29 years, with 76.2% or 48 individuals in the labor force. Within the labor force, the 55 to 59 years age range has the highest percentage of unemployed individuals, with 25.0% or 1 of them being unemployed.
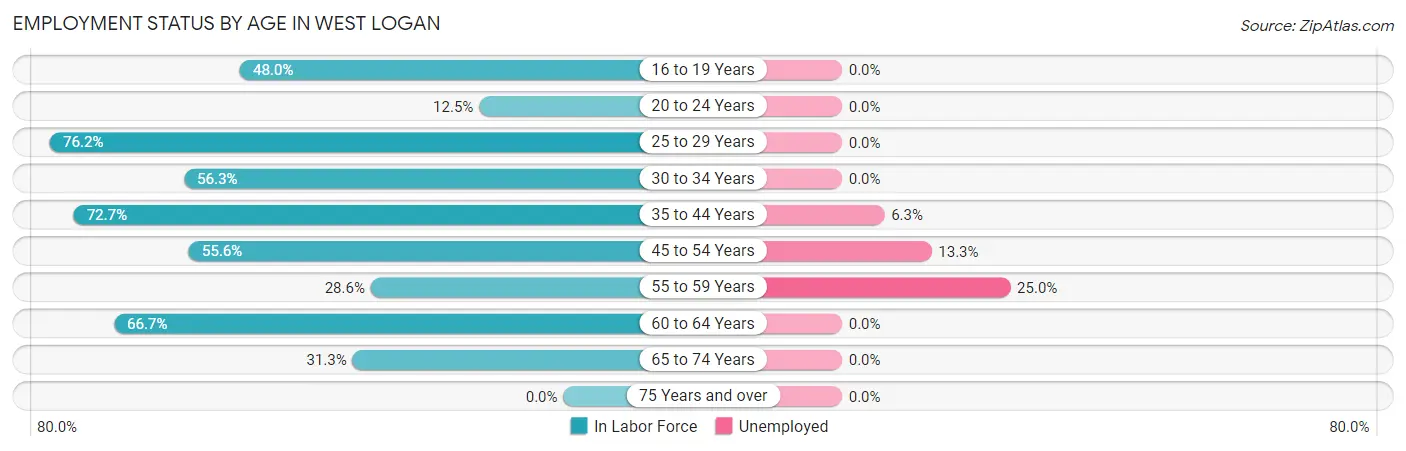
| Age Bracket | In Labor Force | Unemployed |
| 16 to 19 Years | 12 (48.0%) | 0 (0.0%) |
| 20 to 24 Years | 1 (12.5%) | 0 (0.0%) |
| 25 to 29 Years | 48 (76.2%) | 0 (0.0%) |
| 30 to 34 Years | 18 (56.3%) | 0 (0.0%) |
| 35 to 44 Years | 48 (72.7%) | 3 (6.3%) |
| 45 to 54 Years | 15 (55.6%) | 2 (13.3%) |
| 55 to 59 Years | 4 (28.6%) | 1 (25.0%) |
| 60 to 64 Years | 6 (66.7%) | 0 (0.0%) |
| 65 to 74 Years | 5 (31.3%) | 0 (0.0%) |
| 75 Years and over | 0 (0.0%) | 0 (0.0%) |
| Total | 157 (57.5%) | 6 (3.8%) |
Employment Status by Educational Attainment in West Logan
According to labor force statistics for West Logan, 65.9% of individuals (139) out of the total population between 25 and 64 years of age (211) are in the labor force, with 4.3% or 6 of them being unemployed. The group with the highest labor force participation rate are those with the educational attainment of bachelor's degree or higher, with 100.0% or 15 individuals in the labor force. Within the labor force, individuals with bachelor's degree or higher education have the highest percentage of unemployment, with 20.0% or 3 of them being unemployed.
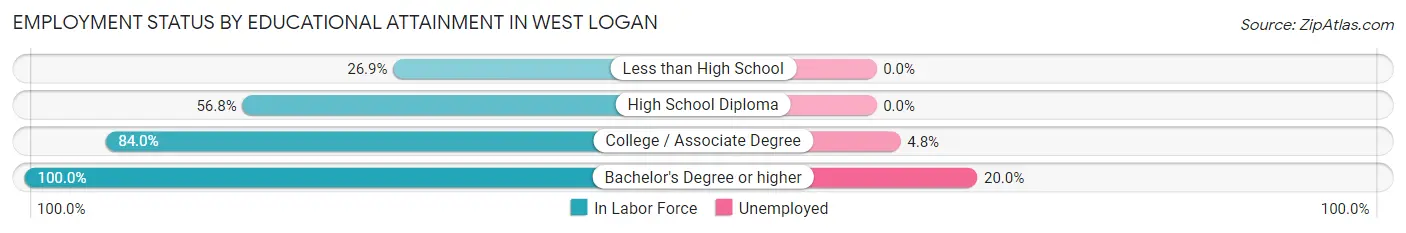
| Educational Attainment | In Labor Force | Unemployed |
| Less than High School | 7 (26.9%) | 0 (0.0%) |
| High School Diploma | 54 (56.8%) | 0 (0.0%) |
| College / Associate Degree | 63 (84.0%) | 4 (4.8%) |
| Bachelor's Degree or higher | 15 (100.0%) | 3 (20.0%) |
| Total | 139 (65.9%) | 9 (4.3%) |
Employment Occupations by Sex in West Logan
Management, Business, Science and Arts Occupations
The most common Management, Business, Science and Arts occupations in West Logan are Community & Social Service (14 | 9.3%), Education, Arts & Media (8 | 5.3%), Computers, Engineering & Science (6 | 4.0%), Architecture & Engineering (6 | 4.0%), and Health Diagnosing & Treating (5 | 3.3%).
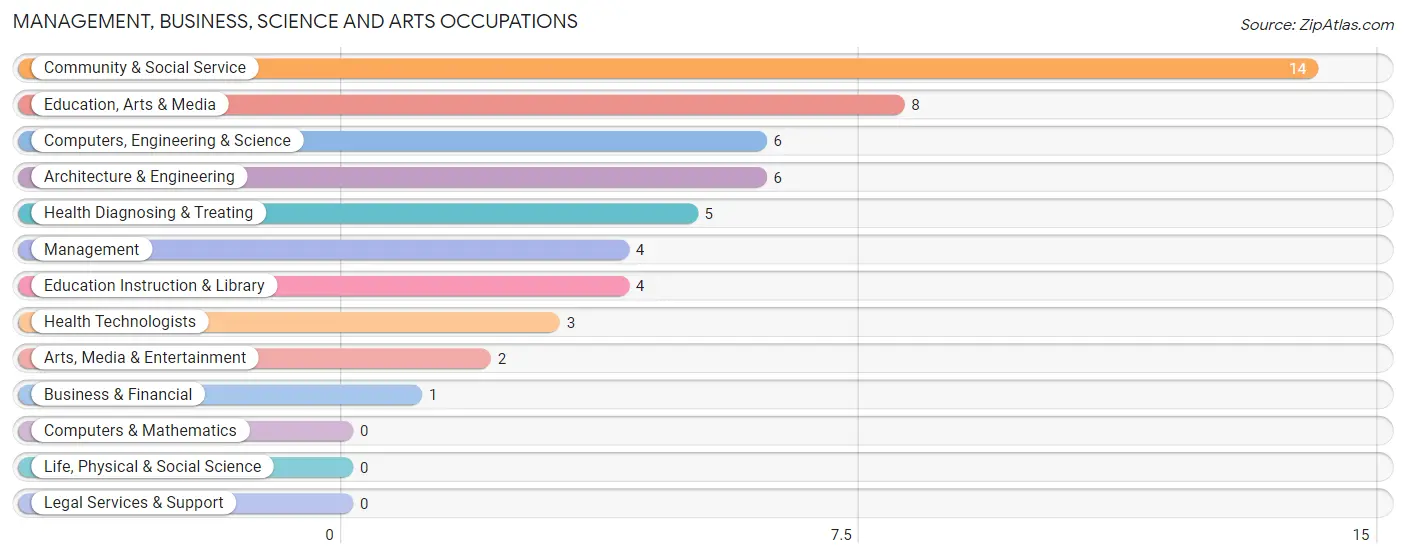
Management, Business, Science and Arts Occupations by Sex
Within the Management, Business, Science and Arts occupations in West Logan, the most male-oriented occupations are Management (100.0%), Business & Financial (100.0%), and Computers, Engineering & Science (100.0%), while the most female-oriented occupations are Education Instruction & Library (100.0%), Health Diagnosing & Treating (100.0%), and Health Technologists (100.0%).
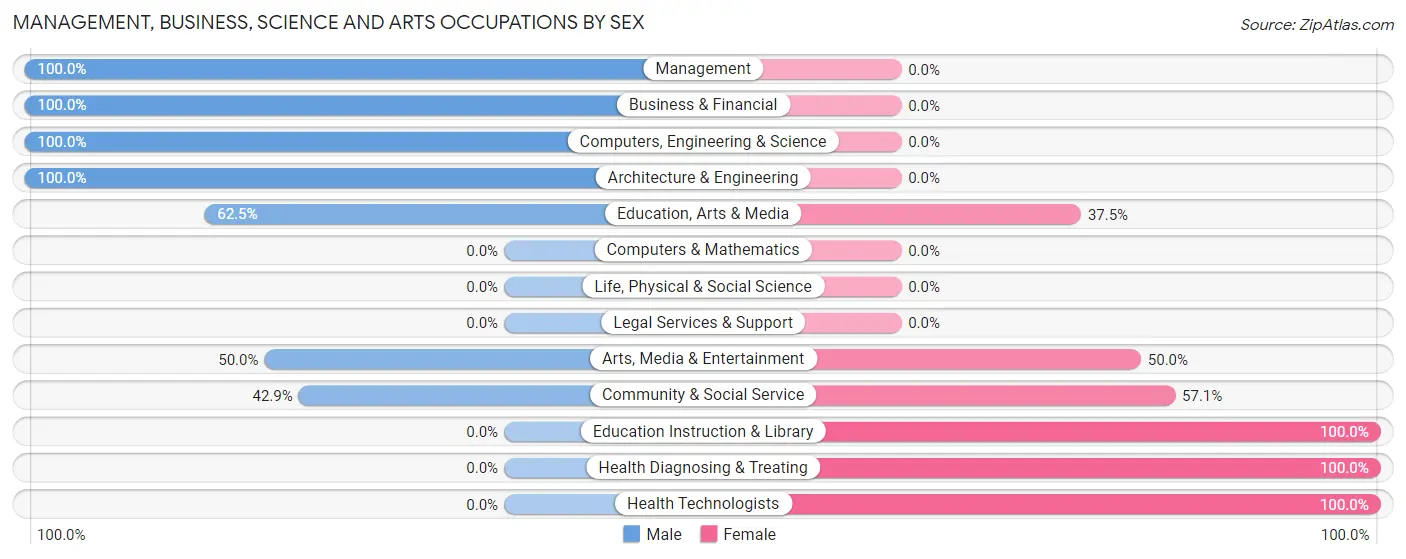
| Occupation | Male | Female |
| Management | 4 (100.0%) | 0 (0.0%) |
| Business & Financial | 1 (100.0%) | 0 (0.0%) |
| Computers, Engineering & Science | 6 (100.0%) | 0 (0.0%) |
| Computers & Mathematics | 0 (0.0%) | 0 (0.0%) |
| Architecture & Engineering | 6 (100.0%) | 0 (0.0%) |
| Life, Physical & Social Science | 0 (0.0%) | 0 (0.0%) |
| Community & Social Service | 6 (42.9%) | 8 (57.1%) |
| Education, Arts & Media | 5 (62.5%) | 3 (37.5%) |
| Legal Services & Support | 0 (0.0%) | 0 (0.0%) |
| Education Instruction & Library | 0 (0.0%) | 4 (100.0%) |
| Arts, Media & Entertainment | 1 (50.0%) | 1 (50.0%) |
| Health Diagnosing & Treating | 0 (0.0%) | 5 (100.0%) |
| Health Technologists | 0 (0.0%) | 3 (100.0%) |
| Total (Category) | 17 (56.7%) | 13 (43.3%) |
| Total (Overall) | 79 (52.3%) | 72 (47.7%) |
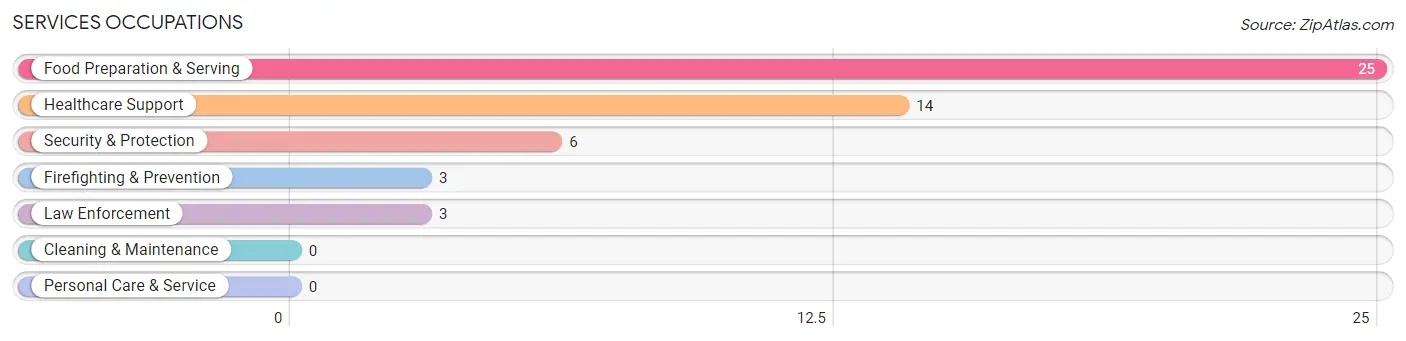
Services Occupations
The most common Services occupations in West Logan are Food Preparation & Serving (25 | 16.6%), Healthcare Support (14 | 9.3%), Security & Protection (6 | 4.0%), Firefighting & Prevention (3 | 2.0%), and Law Enforcement (3 | 2.0%).
Services Occupations by Sex
Within the Services occupations in West Logan, the most male-oriented occupations are Security & Protection (100.0%), Firefighting & Prevention (100.0%), and Law Enforcement (100.0%), while the most female-oriented occupations are Healthcare Support (100.0%), and Food Preparation & Serving (60.0%).
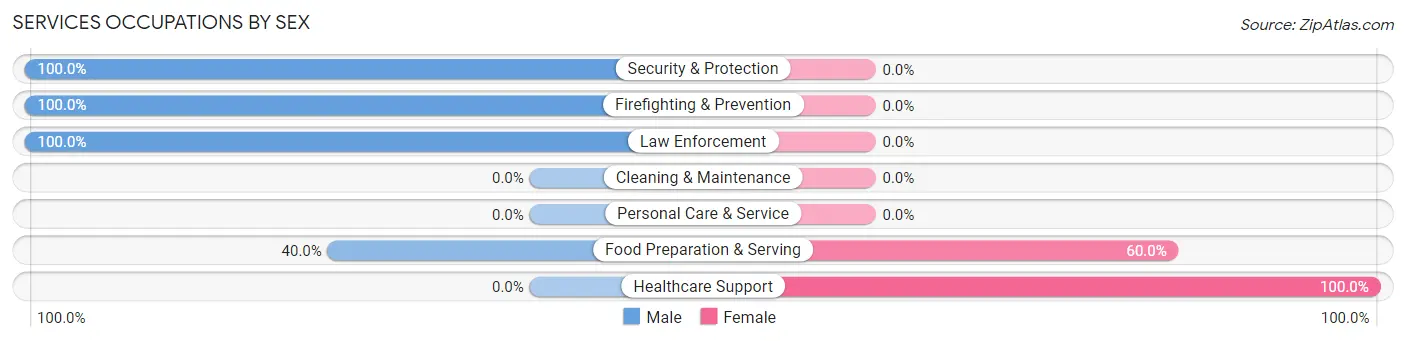
| Occupation | Male | Female |
| Healthcare Support | 0 (0.0%) | 14 (100.0%) |
| Security & Protection | 6 (100.0%) | 0 (0.0%) |
| Firefighting & Prevention | 3 (100.0%) | 0 (0.0%) |
| Law Enforcement | 3 (100.0%) | 0 (0.0%) |
| Food Preparation & Serving | 10 (40.0%) | 15 (60.0%) |
| Cleaning & Maintenance | 0 (0.0%) | 0 (0.0%) |
| Personal Care & Service | 0 (0.0%) | 0 (0.0%) |
| Total (Category) | 16 (35.6%) | 29 (64.4%) |
| Total (Overall) | 79 (52.3%) | 72 (47.7%) |
Sales and Office Occupations
The most common Sales and Office occupations in West Logan are Office & Administration (23 | 15.2%), and Sales & Related (7 | 4.6%).
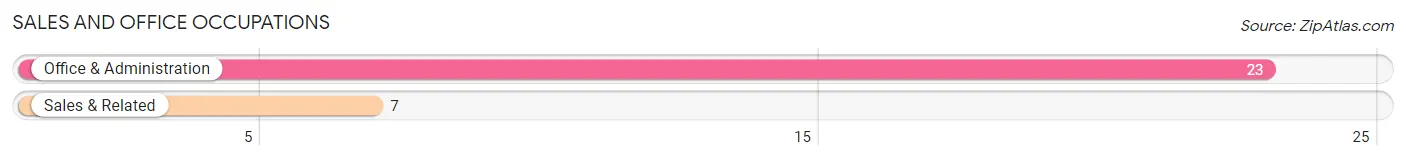
Sales and Office Occupations by Sex
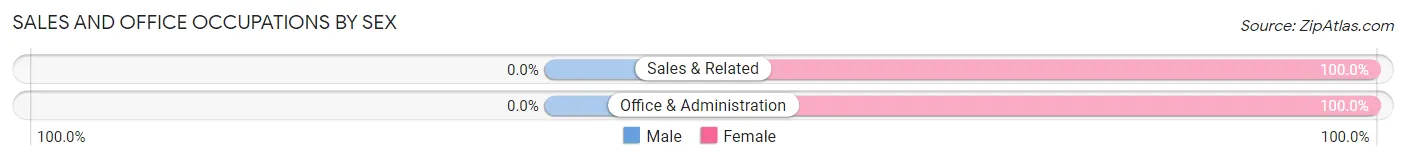
| Occupation | Male | Female |
| Sales & Related | 0 (0.0%) | 7 (100.0%) |
| Office & Administration | 0 (0.0%) | 23 (100.0%) |
| Total (Category) | 0 (0.0%) | 30 (100.0%) |
| Total (Overall) | 79 (52.3%) | 72 (47.7%) |
Natural Resources, Construction and Maintenance Occupations
The most common Natural Resources, Construction and Maintenance occupations in West Logan are , and Construction & Extraction (13 | 8.6%).
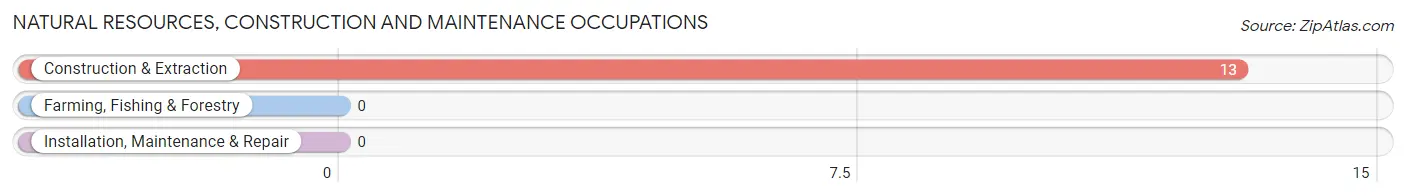
Natural Resources, Construction and Maintenance Occupations by Sex
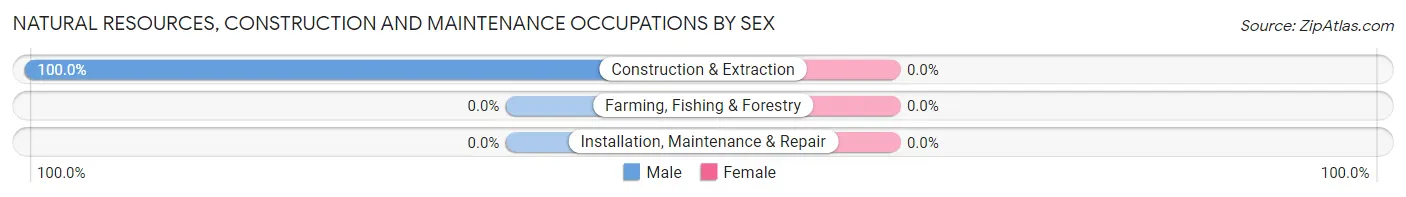
| Occupation | Male | Female |
| Farming, Fishing & Forestry | 0 (0.0%) | 0 (0.0%) |
| Construction & Extraction | 13 (100.0%) | 0 (0.0%) |
| Installation, Maintenance & Repair | 0 (0.0%) | 0 (0.0%) |
| Total (Category) | 13 (100.0%) | 0 (0.0%) |
| Total (Overall) | 79 (52.3%) | 72 (47.7%) |
Production, Transportation and Moving Occupations
The most common Production, Transportation and Moving occupations in West Logan are Material Moving (16 | 10.6%), Transportation (14 | 9.3%), and Production (3 | 2.0%).
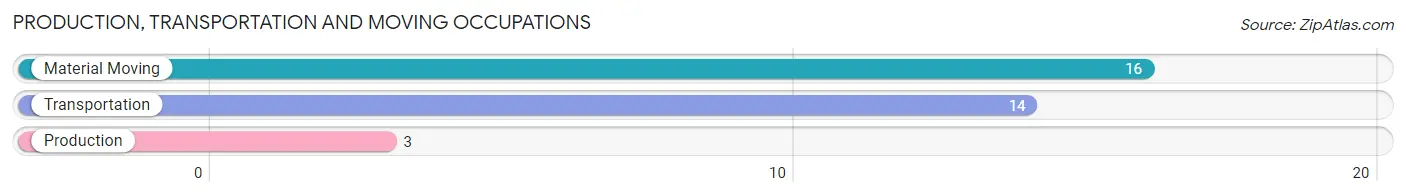
Production, Transportation and Moving Occupations by Sex
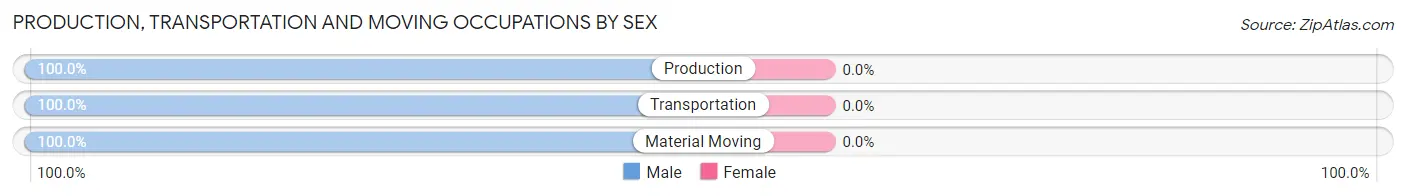
| Occupation | Male | Female |
| Production | 3 (100.0%) | 0 (0.0%) |
| Transportation | 14 (100.0%) | 0 (0.0%) |
| Material Moving | 16 (100.0%) | 0 (0.0%) |
| Total (Category) | 33 (100.0%) | 0 (0.0%) |
| Total (Overall) | 79 (52.3%) | 72 (47.7%) |
Employment Industries by Sex in West Logan
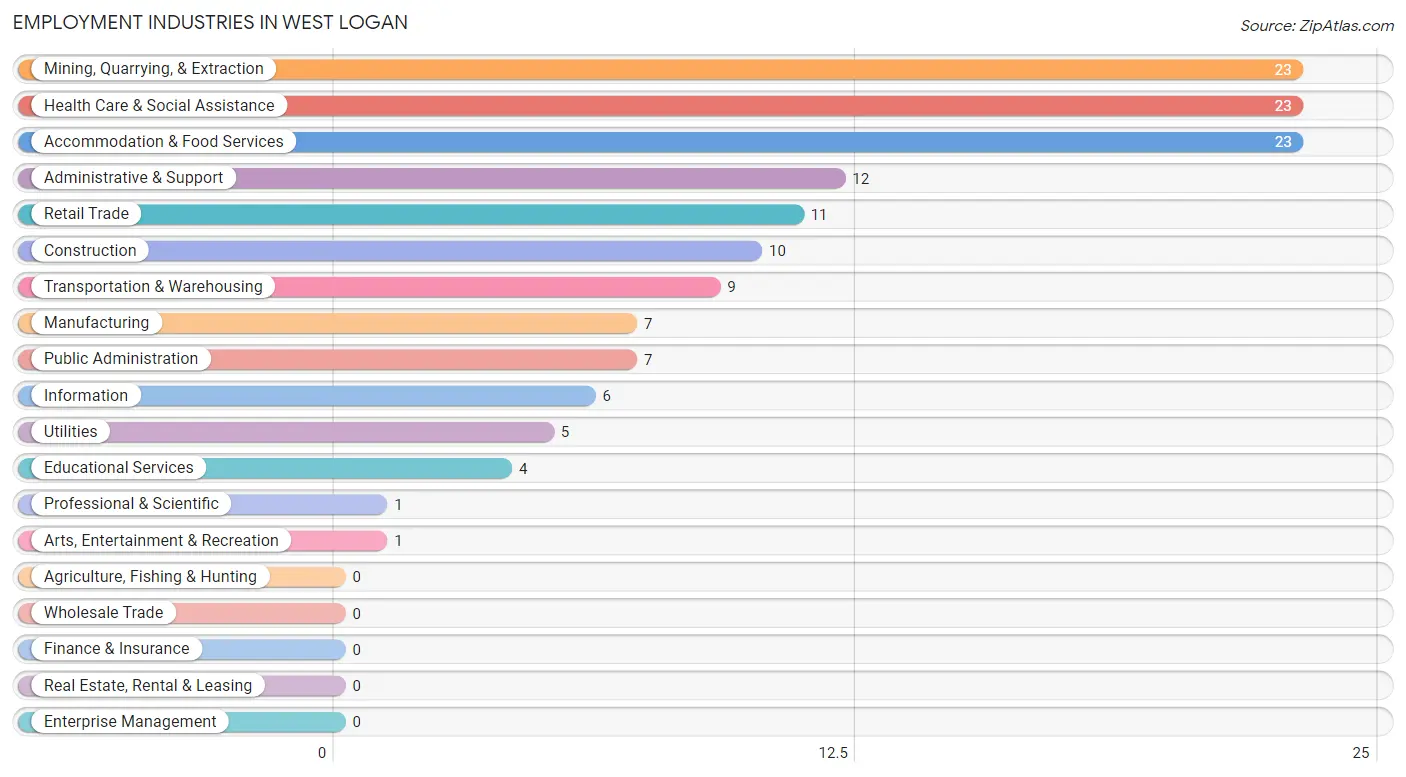
Employment Industries in West Logan
The major employment industries in West Logan include Mining, Quarrying, & Extraction (23 | 15.2%), Health Care & Social Assistance (23 | 15.2%), Accommodation & Food Services (23 | 15.2%), Administrative & Support (12 | 8.0%), and Retail Trade (11 | 7.3%).
Employment Industries by Sex in West Logan
The West Logan industries that see more men than women are Mining, Quarrying, & Extraction (100.0%), Construction (100.0%), and Manufacturing (100.0%), whereas the industries that tend to have a higher number of women are Transportation & Warehousing (100.0%), Educational Services (100.0%), and Arts, Entertainment & Recreation (100.0%).
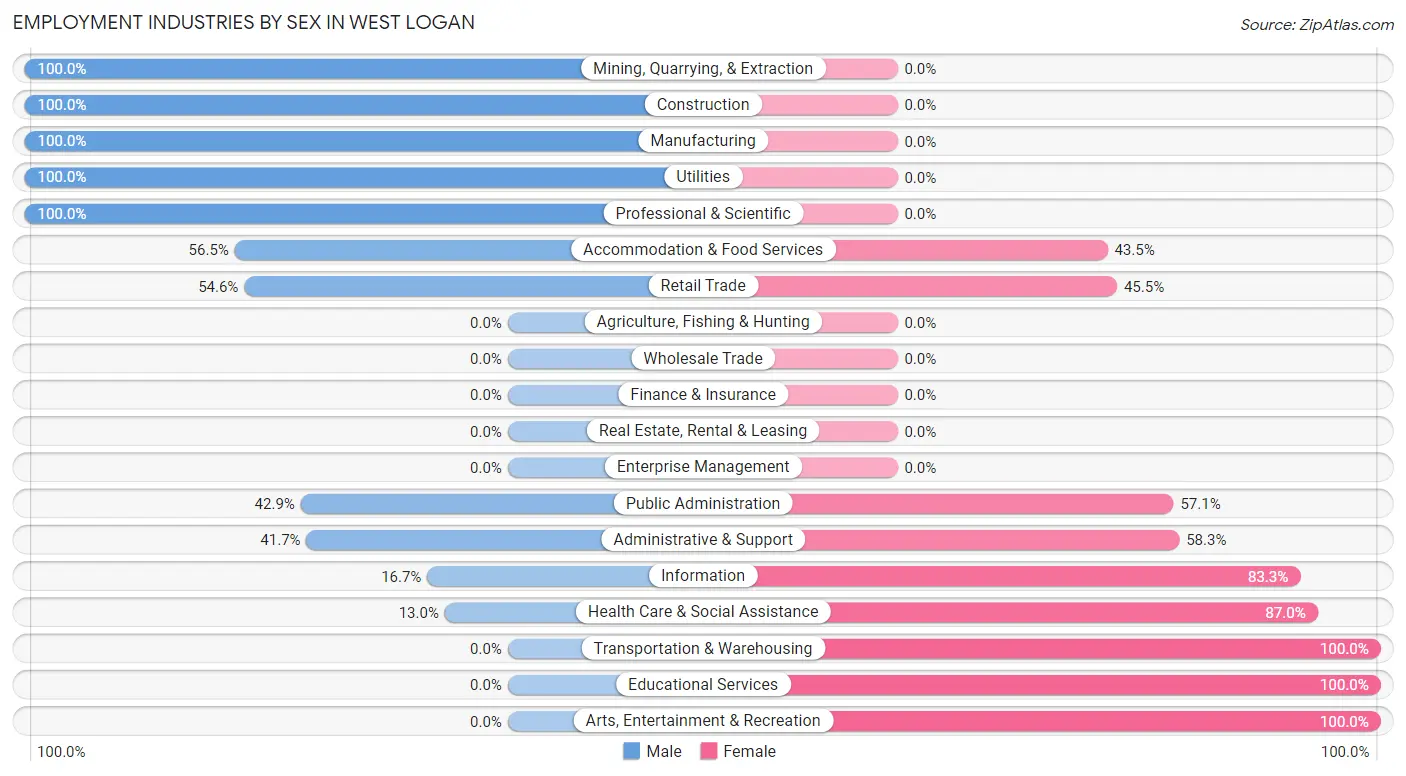
| Industry | Male | Female |
| Agriculture, Fishing & Hunting | 0 (0.0%) | 0 (0.0%) |
| Mining, Quarrying, & Extraction | 23 (100.0%) | 0 (0.0%) |
| Construction | 10 (100.0%) | 0 (0.0%) |
| Manufacturing | 7 (100.0%) | 0 (0.0%) |
| Wholesale Trade | 0 (0.0%) | 0 (0.0%) |
| Retail Trade | 6 (54.5%) | 5 (45.5%) |
| Transportation & Warehousing | 0 (0.0%) | 9 (100.0%) |
| Utilities | 5 (100.0%) | 0 (0.0%) |
| Information | 1 (16.7%) | 5 (83.3%) |
| Finance & Insurance | 0 (0.0%) | 0 (0.0%) |
| Real Estate, Rental & Leasing | 0 (0.0%) | 0 (0.0%) |
| Professional & Scientific | 1 (100.0%) | 0 (0.0%) |
| Enterprise Management | 0 (0.0%) | 0 (0.0%) |
| Administrative & Support | 5 (41.7%) | 7 (58.3%) |
| Educational Services | 0 (0.0%) | 4 (100.0%) |
| Health Care & Social Assistance | 3 (13.0%) | 20 (87.0%) |
| Arts, Entertainment & Recreation | 0 (0.0%) | 1 (100.0%) |
| Accommodation & Food Services | 13 (56.5%) | 10 (43.5%) |
| Public Administration | 3 (42.9%) | 4 (57.1%) |
| Total | 79 (52.3%) | 72 (47.7%) |
Education in West Logan
School Enrollment in West Logan
The most common levels of schooling among the 84 students in West Logan are high school (40 | 47.6%), elementary school (14 | 16.7%), and kindergarten (9 | 10.7%).
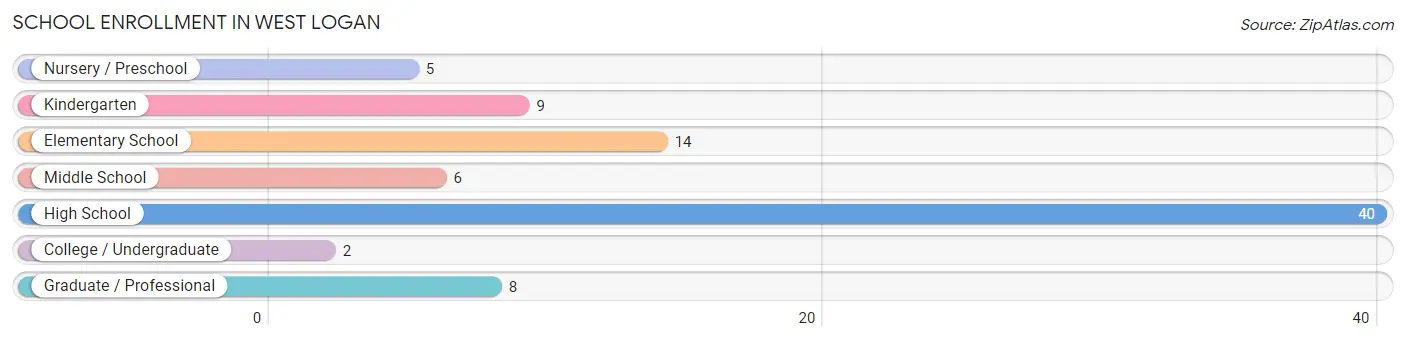
| School Level | # Students | % Students |
| Nursery / Preschool | 5 | 5.9% |
| Kindergarten | 9 | 10.7% |
| Elementary School | 14 | 16.7% |
| Middle School | 6 | 7.1% |
| High School | 40 | 47.6% |
| College / Undergraduate | 2 | 2.4% |
| Graduate / Professional | 8 | 9.5% |
| Total | 84 | 100.0% |
School Enrollment by Age by Funding Source in West Logan
Out of a total of 84 students who are enrolled in schools in West Logan, 5 (6.0%) attend a private institution, while the remaining 79 (94.0%) are enrolled in public schools. The age group of 18 to 19 year olds has the highest likelihood of being enrolled in private schools, with 2 (100.0% in the age bracket) enrolled. Conversely, the age group of 10 to 14 year olds has the lowest likelihood of being enrolled in a private school, with 11 (100.0% in the age bracket) attending a public institution.

| Age Bracket | Public School | Private School |
| 3 to 4 Year Olds | 4 (80.0%) | 1 (20.0%) |
| 5 to 9 Year Old | 21 (91.3%) | 2 (8.7%) |
| 10 to 14 Year Olds | 11 (100.0%) | 0 (0.0%) |
| 15 to 17 Year Olds | 26 (100.0%) | 0 (0.0%) |
| 18 to 19 Year Olds | 0 (0.0%) | 2 (100.0%) |
| 20 to 24 Year Olds | 0 (0.0%) | 0 (0.0%) |
| 25 to 34 Year Olds | 10 (100.0%) | 0 (0.0%) |
| 35 Years and over | 7 (100.0%) | 0 (0.0%) |
| Total | 79 (94.0%) | 5 (6.0%) |
Educational Attainment by Field of Study in West Logan
Psychology (7 | 25.9%), engineering (6 | 22.2%), education (4 | 14.8%), liberal arts & history (4 | 14.8%), and arts & humanities (3 | 11.1%) are the most common fields of study among 27 individuals in West Logan who have obtained a bachelor's degree or higher.
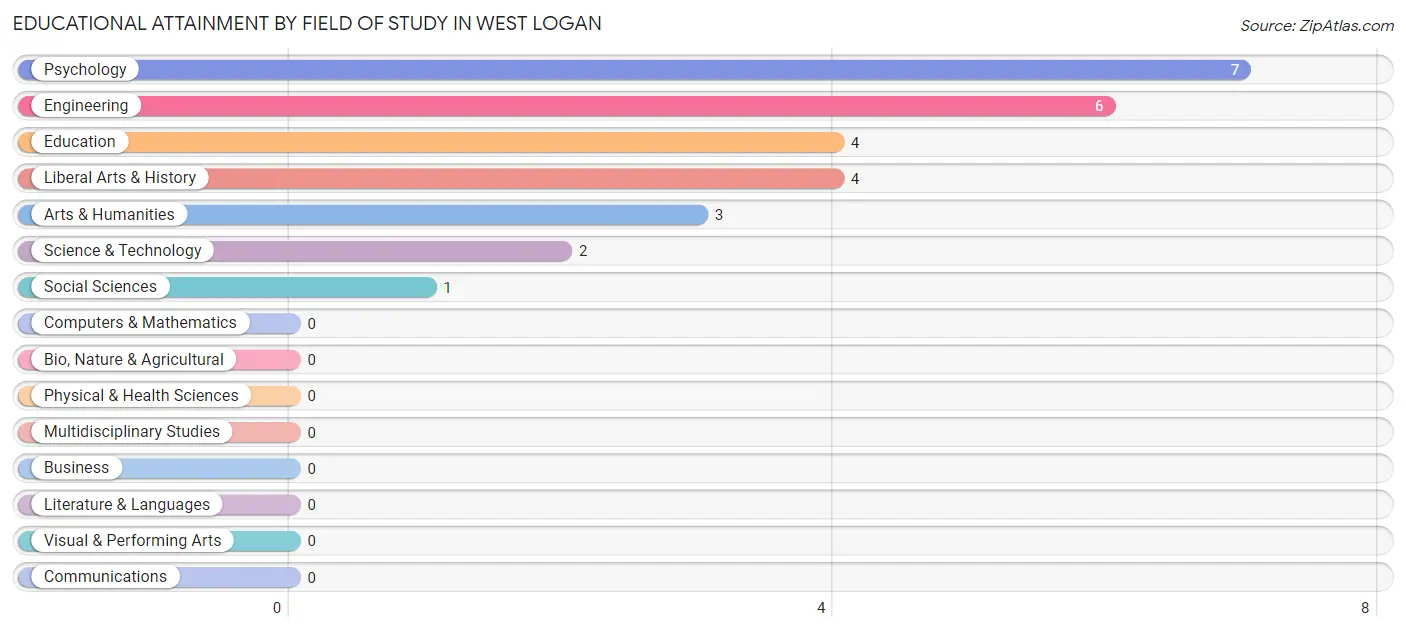
| Field of Study | # Graduates | % Graduates |
| Computers & Mathematics | 0 | 0.0% |
| Bio, Nature & Agricultural | 0 | 0.0% |
| Physical & Health Sciences | 0 | 0.0% |
| Psychology | 7 | 25.9% |
| Social Sciences | 1 | 3.7% |
| Engineering | 6 | 22.2% |
| Multidisciplinary Studies | 0 | 0.0% |
| Science & Technology | 2 | 7.4% |
| Business | 0 | 0.0% |
| Education | 4 | 14.8% |
| Literature & Languages | 0 | 0.0% |
| Liberal Arts & History | 4 | 14.8% |
| Visual & Performing Arts | 0 | 0.0% |
| Communications | 0 | 0.0% |
| Arts & Humanities | 3 | 11.1% |
| Total | 27 | 100.0% |
Transportation & Commute in West Logan
Vehicle Availability by Sex in West Logan
The most prevalent vehicle ownership categories in West Logan are males with 2 vehicles (44, accounting for 55.7%) and females with 2 vehicles (28, making up 62.9%).
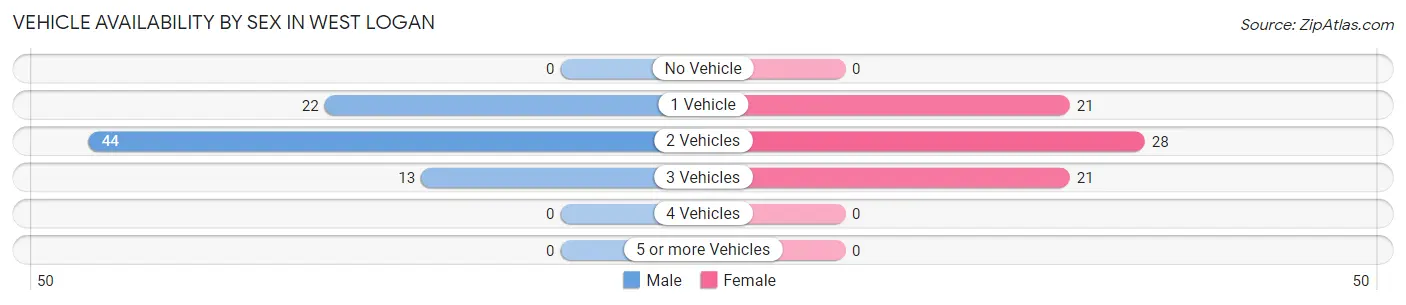
| Vehicles Available | Male | Female |
| No Vehicle | 0 (0.0%) | 0 (0.0%) |
| 1 Vehicle | 22 (27.9%) | 21 (30.0%) |
| 2 Vehicles | 44 (55.7%) | 28 (40.0%) |
| 3 Vehicles | 13 (16.5%) | 21 (30.0%) |
| 4 Vehicles | 0 (0.0%) | 0 (0.0%) |
| 5 or more Vehicles | 0 (0.0%) | 0 (0.0%) |
| Total | 79 (100.0%) | 70 (100.0%) |
Commute Time in West Logan
The most frequently occuring commute durations in West Logan are 15 to 19 minutes (25 commuters, 16.8%), 10 to 14 minutes (24 commuters, 16.1%), and 90 or more minutes (22 commuters, 14.8%).
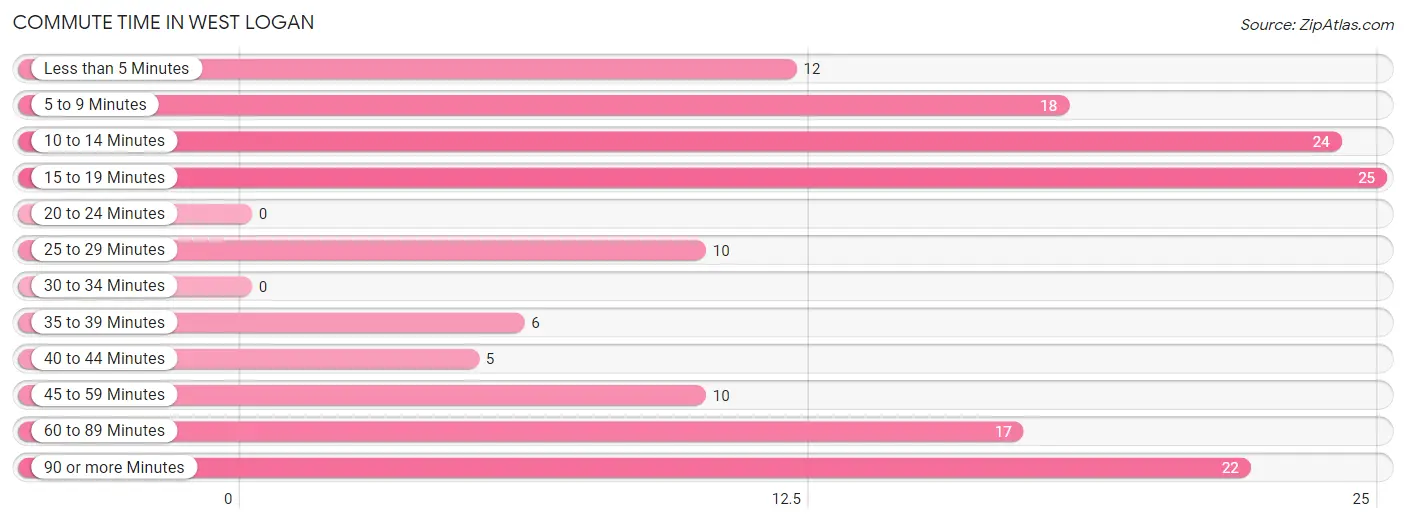
| Commute Time | # Commuters | % Commuters |
| Less than 5 Minutes | 12 | 8.1% |
| 5 to 9 Minutes | 18 | 12.1% |
| 10 to 14 Minutes | 24 | 16.1% |
| 15 to 19 Minutes | 25 | 16.8% |
| 20 to 24 Minutes | 0 | 0.0% |
| 25 to 29 Minutes | 10 | 6.7% |
| 30 to 34 Minutes | 0 | 0.0% |
| 35 to 39 Minutes | 6 | 4.0% |
| 40 to 44 Minutes | 5 | 3.4% |
| 45 to 59 Minutes | 10 | 6.7% |
| 60 to 89 Minutes | 17 | 11.4% |
| 90 or more Minutes | 22 | 14.8% |
Commute Time by Sex in West Logan
The most common commute times in West Logan are 15 to 19 minutes (19 commuters, 24.0%) for males and 10 to 14 minutes (18 commuters, 25.7%) for females.
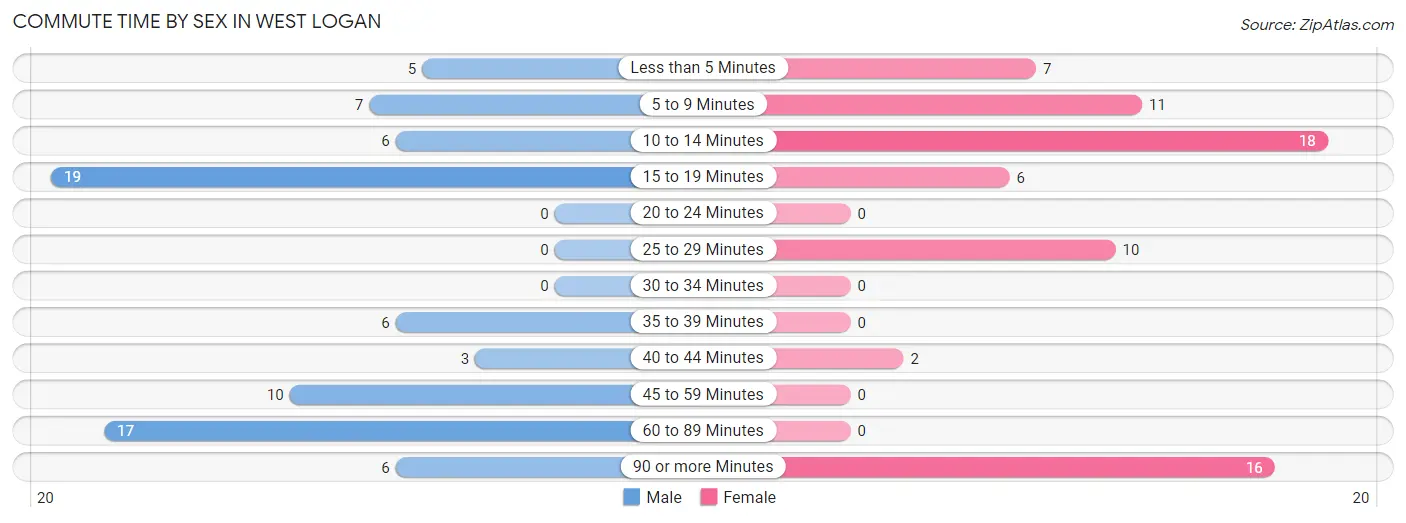
| Commute Time | Male | Female |
| Less than 5 Minutes | 5 (6.3%) | 7 (10.0%) |
| 5 to 9 Minutes | 7 (8.9%) | 11 (15.7%) |
| 10 to 14 Minutes | 6 (7.6%) | 18 (25.7%) |
| 15 to 19 Minutes | 19 (24.0%) | 6 (8.6%) |
| 20 to 24 Minutes | 0 (0.0%) | 0 (0.0%) |
| 25 to 29 Minutes | 0 (0.0%) | 10 (14.3%) |
| 30 to 34 Minutes | 0 (0.0%) | 0 (0.0%) |
| 35 to 39 Minutes | 6 (7.6%) | 0 (0.0%) |
| 40 to 44 Minutes | 3 (3.8%) | 2 (2.9%) |
| 45 to 59 Minutes | 10 (12.7%) | 0 (0.0%) |
| 60 to 89 Minutes | 17 (21.5%) | 0 (0.0%) |
| 90 or more Minutes | 6 (7.6%) | 16 (22.9%) |
Time of Departure to Work by Sex in West Logan
The most frequent times of departure to work in West Logan are 7:00 AM to 7:29 AM (17, 21.5%) for males and 10:00 AM to 10:59 AM (14, 20.0%) for females.
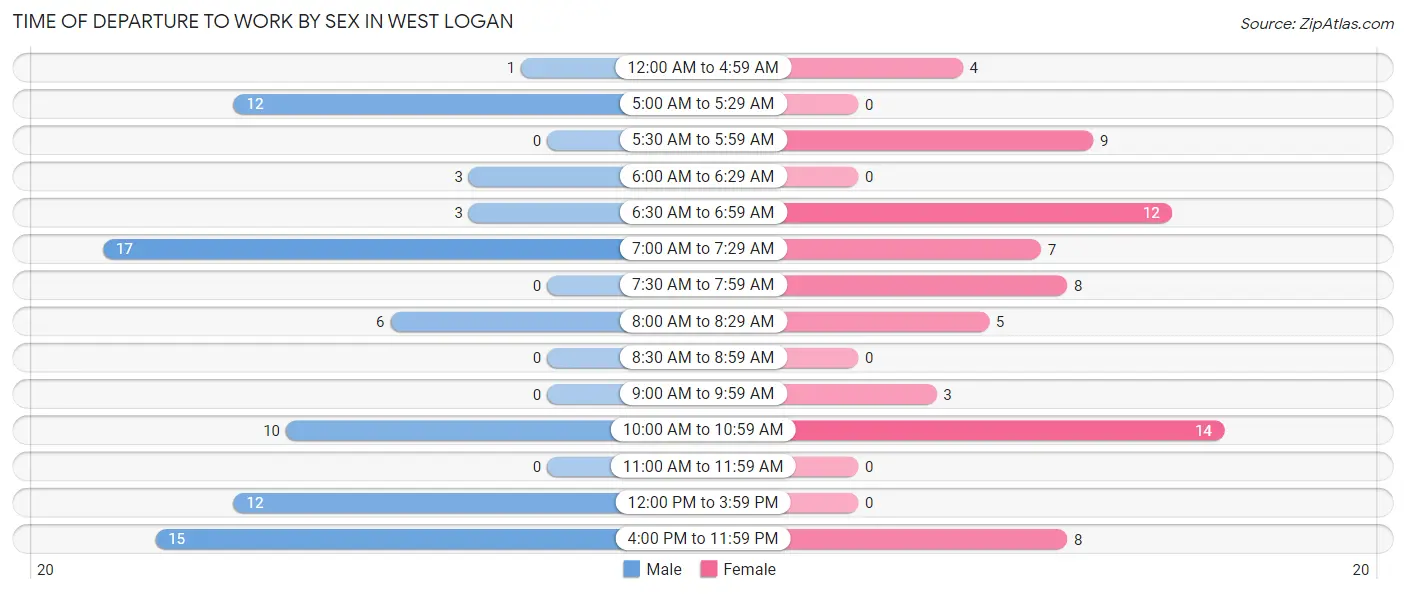
| Time of Departure | Male | Female |
| 12:00 AM to 4:59 AM | 1 (1.3%) | 4 (5.7%) |
| 5:00 AM to 5:29 AM | 12 (15.2%) | 0 (0.0%) |
| 5:30 AM to 5:59 AM | 0 (0.0%) | 9 (12.9%) |
| 6:00 AM to 6:29 AM | 3 (3.8%) | 0 (0.0%) |
| 6:30 AM to 6:59 AM | 3 (3.8%) | 12 (17.1%) |
| 7:00 AM to 7:29 AM | 17 (21.5%) | 7 (10.0%) |
| 7:30 AM to 7:59 AM | 0 (0.0%) | 8 (11.4%) |
| 8:00 AM to 8:29 AM | 6 (7.6%) | 5 (7.1%) |
| 8:30 AM to 8:59 AM | 0 (0.0%) | 0 (0.0%) |
| 9:00 AM to 9:59 AM | 0 (0.0%) | 3 (4.3%) |
| 10:00 AM to 10:59 AM | 10 (12.7%) | 14 (20.0%) |
| 11:00 AM to 11:59 AM | 0 (0.0%) | 0 (0.0%) |
| 12:00 PM to 3:59 PM | 12 (15.2%) | 0 (0.0%) |
| 4:00 PM to 11:59 PM | 15 (19.0%) | 8 (11.4%) |
| Total | 79 (100.0%) | 70 (100.0%) |
Housing Occupancy in West Logan
Occupancy by Ownership in West Logan
Of the total 127 dwellings in West Logan, owner-occupied units account for 88 (69.3%), while renter-occupied units make up 39 (30.7%).
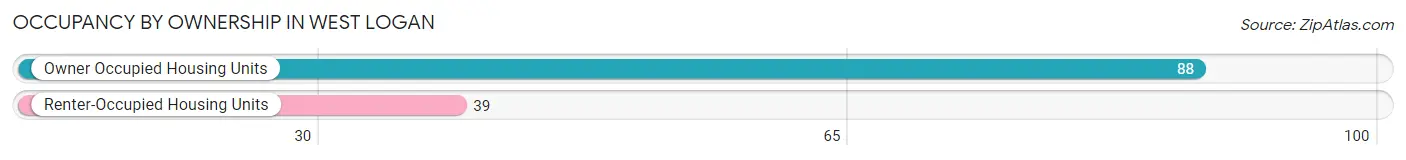
| Occupancy | # Housing Units | % Housing Units |
| Owner Occupied Housing Units | 88 | 69.3% |
| Renter-Occupied Housing Units | 39 | 30.7% |
| Total Occupied Housing Units | 127 | 100.0% |
Occupancy by Household Size in West Logan
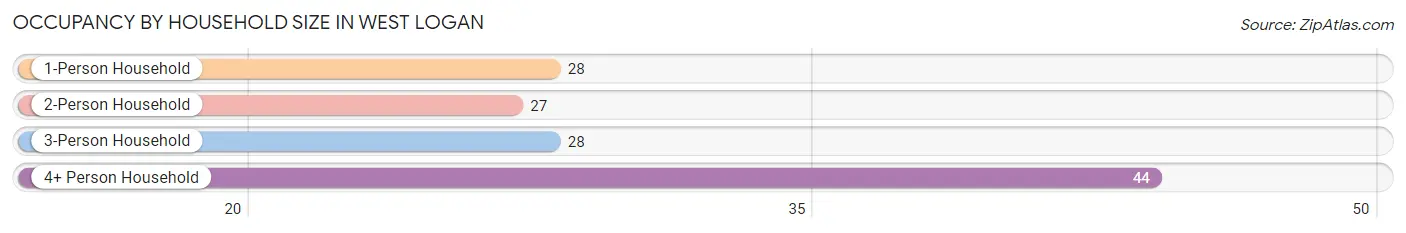
| Household Size | # Housing Units | % Housing Units |
| 1-Person Household | 28 | 22.1% |
| 2-Person Household | 27 | 21.3% |
| 3-Person Household | 28 | 22.1% |
| 4+ Person Household | 44 | 34.6% |
| Total Housing Units | 127 | 100.0% |
Occupancy by Ownership by Household Size in West Logan
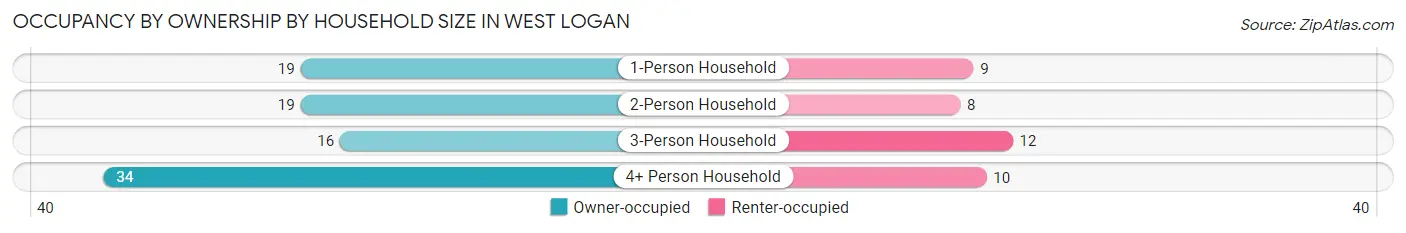
| Household Size | Owner-occupied | Renter-occupied |
| 1-Person Household | 19 (67.9%) | 9 (32.1%) |
| 2-Person Household | 19 (70.4%) | 8 (29.6%) |
| 3-Person Household | 16 (57.1%) | 12 (42.9%) |
| 4+ Person Household | 34 (77.3%) | 10 (22.7%) |
| Total Housing Units | 88 (69.3%) | 39 (30.7%) |
Occupancy by Educational Attainment in West Logan
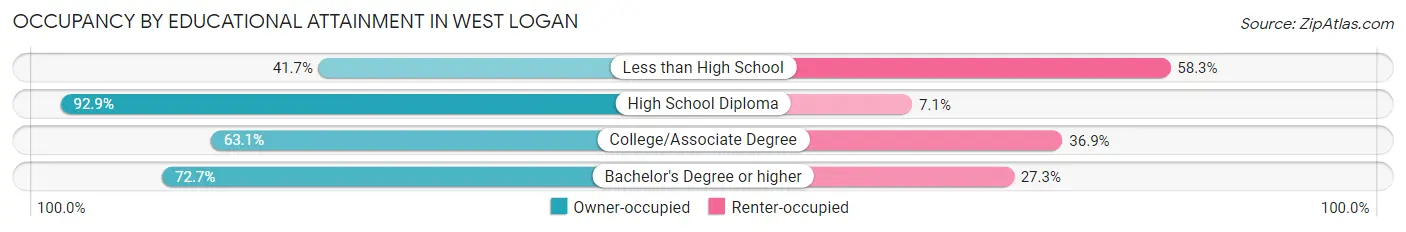
| Household Size | Owner-occupied | Renter-occupied |
| Less than High School | 5 (41.7%) | 7 (58.3%) |
| High School Diploma | 26 (92.9%) | 2 (7.1%) |
| College/Associate Degree | 41 (63.1%) | 24 (36.9%) |
| Bachelor's Degree or higher | 16 (72.7%) | 6 (27.3%) |
Occupancy by Age of Householder in West Logan
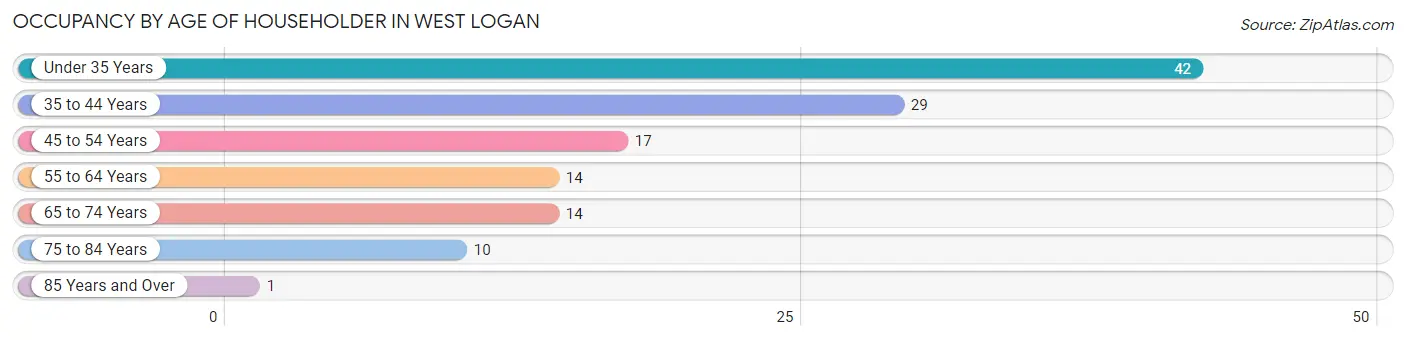
| Age Bracket | # Households | % Households |
| Under 35 Years | 42 | 33.1% |
| 35 to 44 Years | 29 | 22.8% |
| 45 to 54 Years | 17 | 13.4% |
| 55 to 64 Years | 14 | 11.0% |
| 65 to 74 Years | 14 | 11.0% |
| 75 to 84 Years | 10 | 7.9% |
| 85 Years and Over | 1 | 0.8% |
| Total | 127 | 100.0% |
Housing Finances in West Logan
Median Income by Occupancy in West Logan
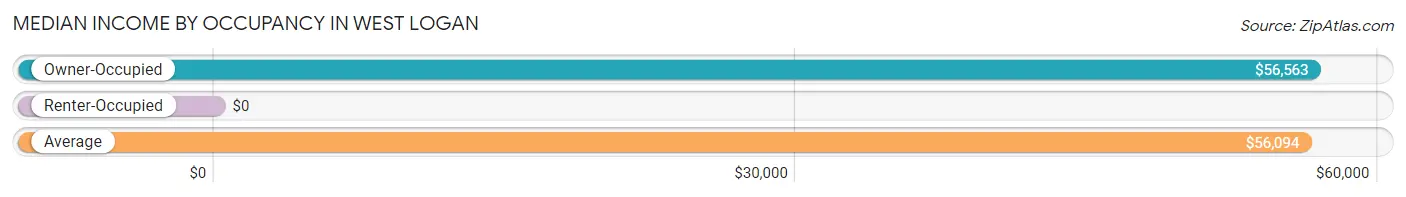
| Occupancy Type | # Households | Median Income |
| Owner-Occupied | 88 (69.3%) | $56,563 |
| Renter-Occupied | 39 (30.7%) | $0 |
| Average | 127 (100.0%) | $56,094 |
Occupancy by Householder Income Bracket in West Logan
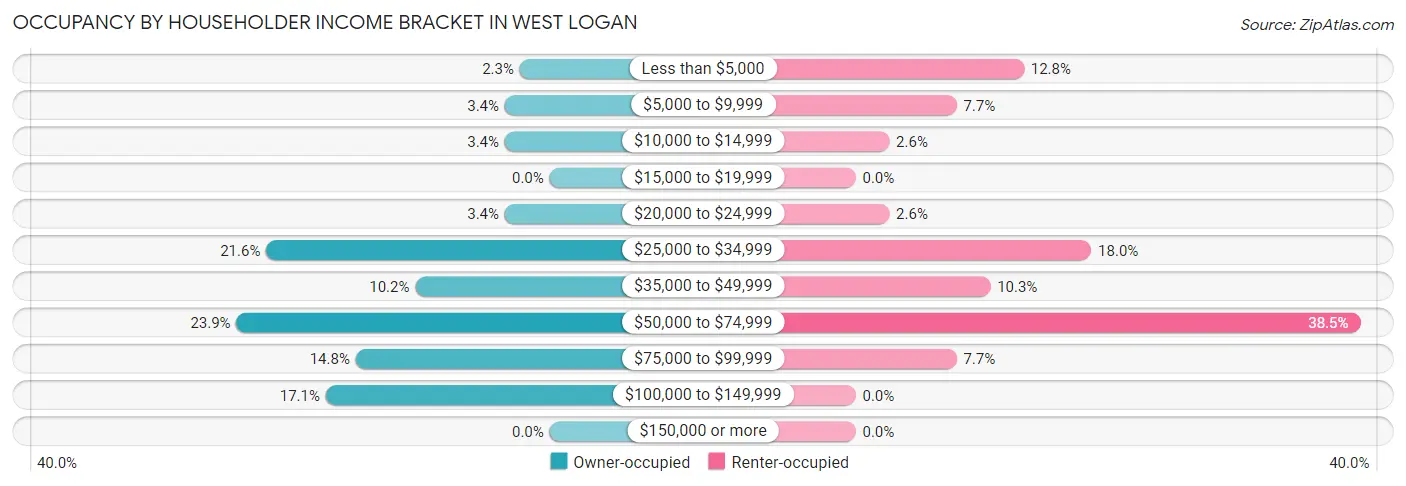
| Income Bracket | Owner-occupied | Renter-occupied |
| Less than $5,000 | 2 (2.3%) | 5 (12.8%) |
| $5,000 to $9,999 | 3 (3.4%) | 3 (7.7%) |
| $10,000 to $14,999 | 3 (3.4%) | 1 (2.6%) |
| $15,000 to $19,999 | 0 (0.0%) | 0 (0.0%) |
| $20,000 to $24,999 | 3 (3.4%) | 1 (2.6%) |
| $25,000 to $34,999 | 19 (21.6%) | 7 (17.9%) |
| $35,000 to $49,999 | 9 (10.2%) | 4 (10.3%) |
| $50,000 to $74,999 | 21 (23.9%) | 15 (38.5%) |
| $75,000 to $99,999 | 13 (14.8%) | 3 (7.7%) |
| $100,000 to $149,999 | 15 (17.1%) | 0 (0.0%) |
| $150,000 or more | 0 (0.0%) | 0 (0.0%) |
| Total | 88 (100.0%) | 39 (100.0%) |
Monthly Housing Cost Tiers in West Logan
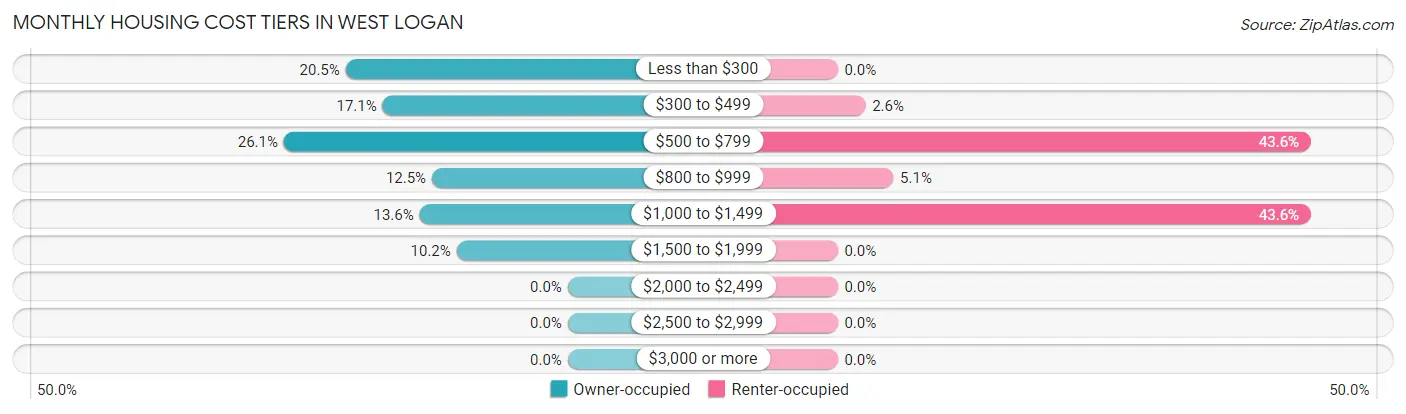
| Monthly Cost | Owner-occupied | Renter-occupied |
| Less than $300 | 18 (20.4%) | 0 (0.0%) |
| $300 to $499 | 15 (17.1%) | 1 (2.6%) |
| $500 to $799 | 23 (26.1%) | 17 (43.6%) |
| $800 to $999 | 11 (12.5%) | 2 (5.1%) |
| $1,000 to $1,499 | 12 (13.6%) | 17 (43.6%) |
| $1,500 to $1,999 | 9 (10.2%) | 0 (0.0%) |
| $2,000 to $2,499 | 0 (0.0%) | 0 (0.0%) |
| $2,500 to $2,999 | 0 (0.0%) | 0 (0.0%) |
| $3,000 or more | 0 (0.0%) | 0 (0.0%) |
| Total | 88 (100.0%) | 39 (100.0%) |
Physical Housing Characteristics in West Logan
Housing Structures in West Logan
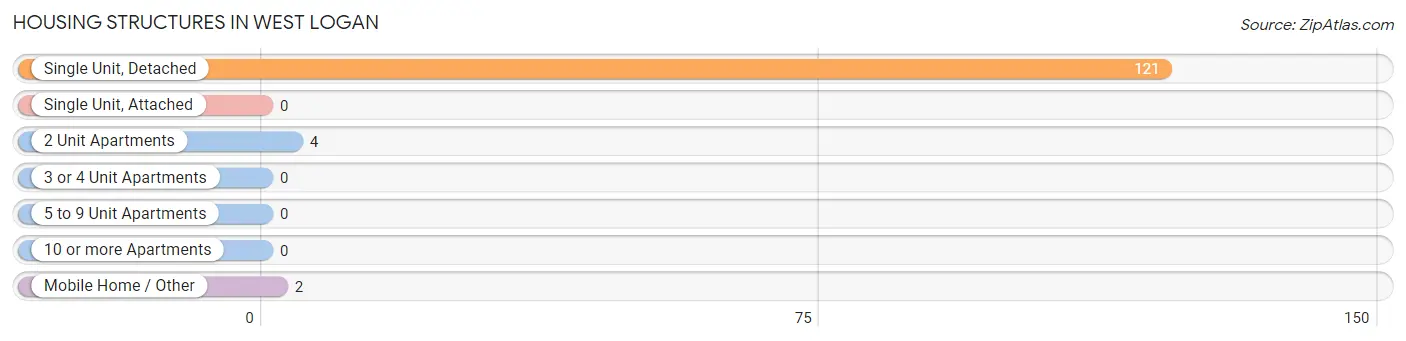
| Structure Type | # Housing Units | % Housing Units |
| Single Unit, Detached | 121 | 95.3% |
| Single Unit, Attached | 0 | 0.0% |
| 2 Unit Apartments | 4 | 3.2% |
| 3 or 4 Unit Apartments | 0 | 0.0% |
| 5 to 9 Unit Apartments | 0 | 0.0% |
| 10 or more Apartments | 0 | 0.0% |
| Mobile Home / Other | 2 | 1.6% |
| Total | 127 | 100.0% |
Housing Structures by Occupancy in West Logan
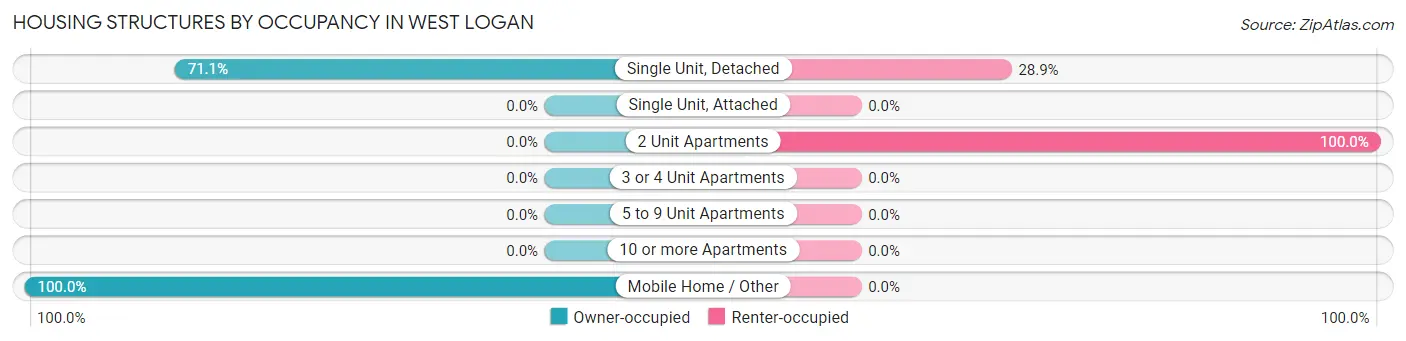
| Structure Type | Owner-occupied | Renter-occupied |
| Single Unit, Detached | 86 (71.1%) | 35 (28.9%) |
| Single Unit, Attached | 0 (0.0%) | 0 (0.0%) |
| 2 Unit Apartments | 0 (0.0%) | 4 (100.0%) |
| 3 or 4 Unit Apartments | 0 (0.0%) | 0 (0.0%) |
| 5 to 9 Unit Apartments | 0 (0.0%) | 0 (0.0%) |
| 10 or more Apartments | 0 (0.0%) | 0 (0.0%) |
| Mobile Home / Other | 2 (100.0%) | 0 (0.0%) |
| Total | 88 (69.3%) | 39 (30.7%) |
Housing Structures by Number of Rooms in West Logan
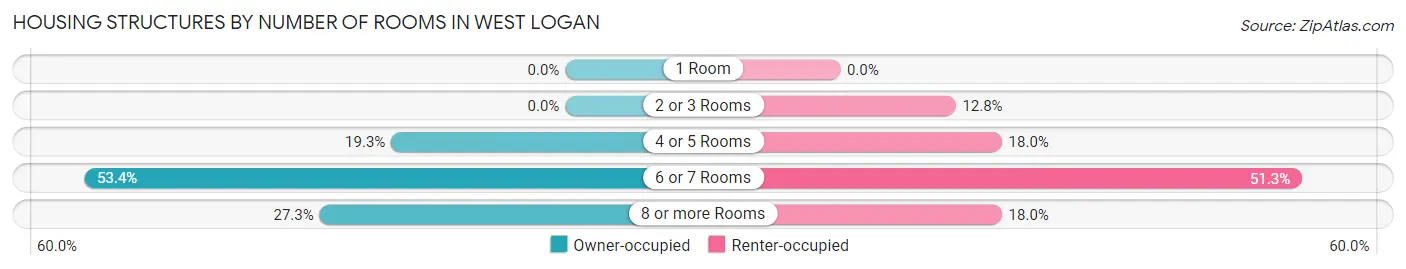
| Number of Rooms | Owner-occupied | Renter-occupied |
| 1 Room | 0 (0.0%) | 0 (0.0%) |
| 2 or 3 Rooms | 0 (0.0%) | 5 (12.8%) |
| 4 or 5 Rooms | 17 (19.3%) | 7 (17.9%) |
| 6 or 7 Rooms | 47 (53.4%) | 20 (51.3%) |
| 8 or more Rooms | 24 (27.3%) | 7 (17.9%) |
| Total | 88 (100.0%) | 39 (100.0%) |
Housing Structure by Heating Type in West Logan
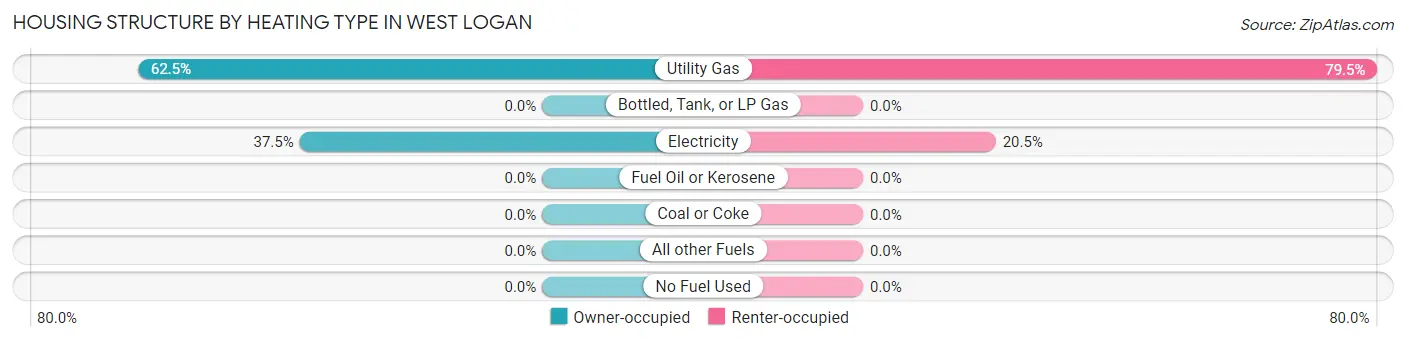
| Heating Type | Owner-occupied | Renter-occupied |
| Utility Gas | 55 (62.5%) | 31 (79.5%) |
| Bottled, Tank, or LP Gas | 0 (0.0%) | 0 (0.0%) |
| Electricity | 33 (37.5%) | 8 (20.5%) |
| Fuel Oil or Kerosene | 0 (0.0%) | 0 (0.0%) |
| Coal or Coke | 0 (0.0%) | 0 (0.0%) |
| All other Fuels | 0 (0.0%) | 0 (0.0%) |
| No Fuel Used | 0 (0.0%) | 0 (0.0%) |
| Total | 88 (100.0%) | 39 (100.0%) |
Household Vehicle Usage in West Logan
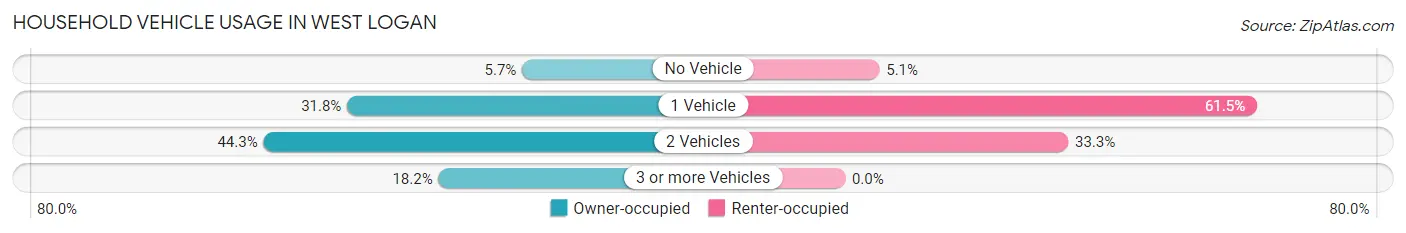
| Vehicles per Household | Owner-occupied | Renter-occupied |
| No Vehicle | 5 (5.7%) | 2 (5.1%) |
| 1 Vehicle | 28 (31.8%) | 24 (61.5%) |
| 2 Vehicles | 39 (44.3%) | 13 (33.3%) |
| 3 or more Vehicles | 16 (18.2%) | 0 (0.0%) |
| Total | 88 (100.0%) | 39 (100.0%) |
Real Estate & Mortgages in West Logan
Real Estate and Mortgage Overview in West Logan
| Characteristic | Without Mortgage | With Mortgage |
| Housing Units | 44 | 44 |
| Median Property Value | $70,800 | $67,900 |
| Median Household Income | $55,417 | $0 |
| Monthly Housing Costs | $350 | $0 |
| Real Estate Taxes | $565 | $0 |
Property Value by Mortgage Status in West Logan
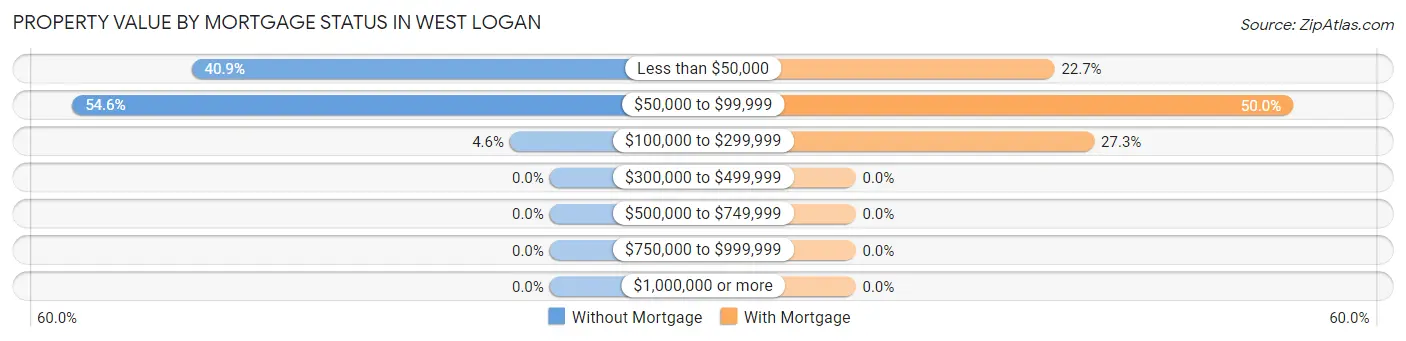
| Property Value | Without Mortgage | With Mortgage |
| Less than $50,000 | 18 (40.9%) | 10 (22.7%) |
| $50,000 to $99,999 | 24 (54.5%) | 22 (50.0%) |
| $100,000 to $299,999 | 2 (4.5%) | 12 (27.3%) |
| $300,000 to $499,999 | 0 (0.0%) | 0 (0.0%) |
| $500,000 to $749,999 | 0 (0.0%) | 0 (0.0%) |
| $750,000 to $999,999 | 0 (0.0%) | 0 (0.0%) |
| $1,000,000 or more | 0 (0.0%) | 0 (0.0%) |
| Total | 44 (100.0%) | 44 (100.0%) |
Household Income by Mortgage Status in West Logan
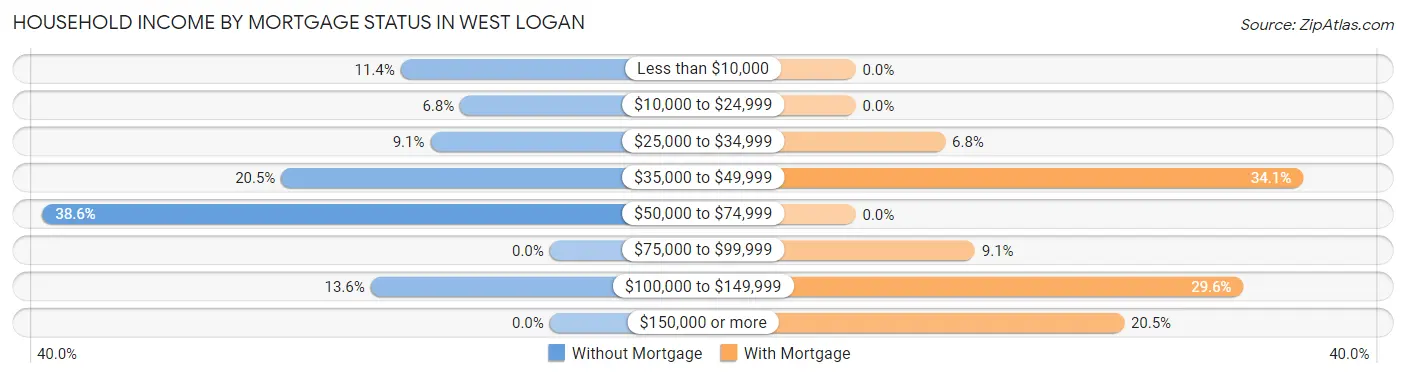
| Household Income | Without Mortgage | With Mortgage |
| Less than $10,000 | 5 (11.4%) | 0 (0.0%) |
| $10,000 to $24,999 | 3 (6.8%) | 0 (0.0%) |
| $25,000 to $34,999 | 4 (9.1%) | 3 (6.8%) |
| $35,000 to $49,999 | 9 (20.4%) | 15 (34.1%) |
| $50,000 to $74,999 | 17 (38.6%) | 0 (0.0%) |
| $75,000 to $99,999 | 0 (0.0%) | 4 (9.1%) |
| $100,000 to $149,999 | 6 (13.6%) | 13 (29.5%) |
| $150,000 or more | 0 (0.0%) | 9 (20.4%) |
| Total | 44 (100.0%) | 44 (100.0%) |
Property Value to Household Income Ratio in West Logan
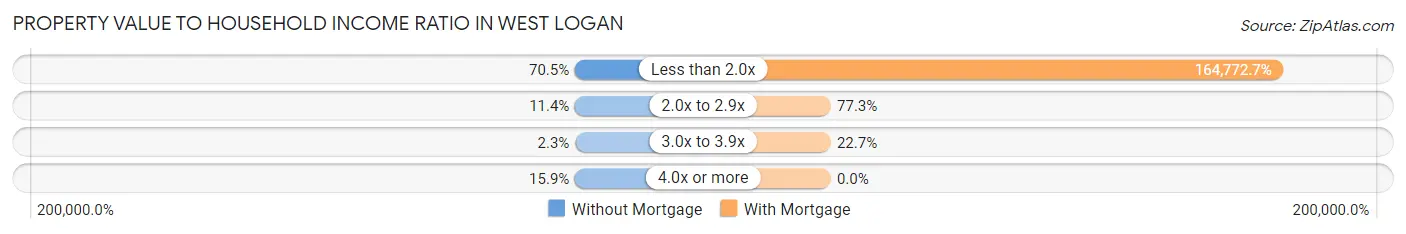
| Value-to-Income Ratio | Without Mortgage | With Mortgage |
| Less than 2.0x | 31 (70.5%) | 72,500 (164,772.7%) |
| 2.0x to 2.9x | 5 (11.4%) | 34 (77.3%) |
| 3.0x to 3.9x | 1 (2.3%) | 10 (22.7%) |
| 4.0x or more | 7 (15.9%) | 0 (0.0%) |
| Total | 44 (100.0%) | 44 (100.0%) |
Real Estate Taxes by Mortgage Status in West Logan
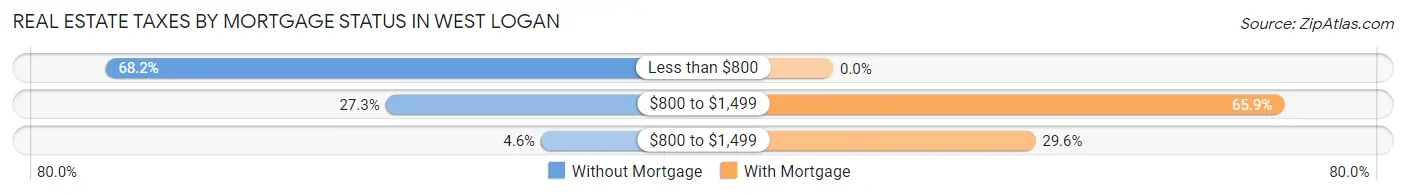
| Property Taxes | Without Mortgage | With Mortgage |
| Less than $800 | 30 (68.2%) | 0 (0.0%) |
| $800 to $1,499 | 12 (27.3%) | 29 (65.9%) |
| $800 to $1,499 | 2 (4.5%) | 13 (29.5%) |
| Total | 44 (100.0%) | 44 (100.0%) |
Health & Disability in West Logan
Health Insurance Coverage by Age in West Logan
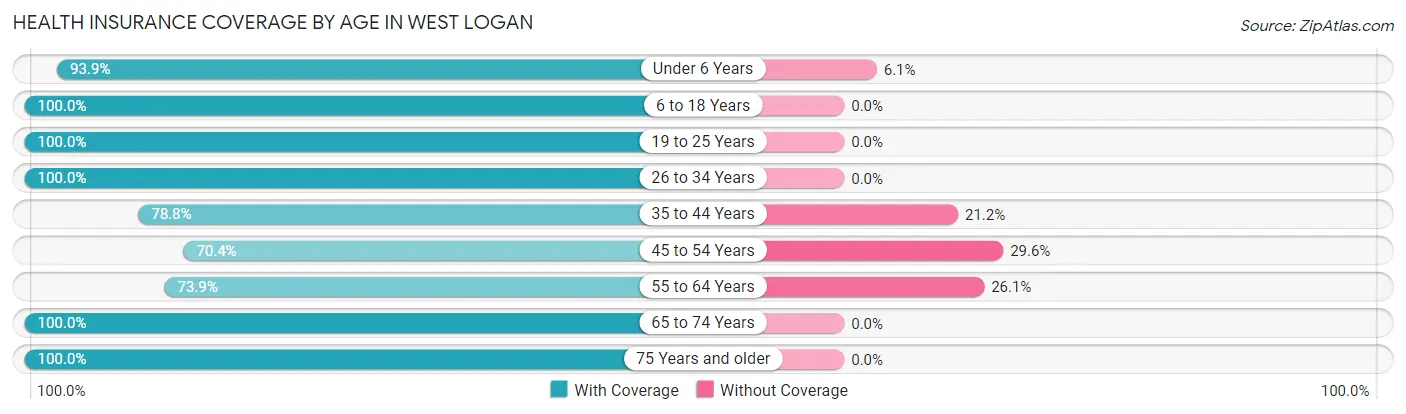
| Age Bracket | With Coverage | Without Coverage |
| Under 6 Years | 31 (93.9%) | 2 (6.1%) |
| 6 to 18 Years | 65 (100.0%) | 0 (0.0%) |
| 19 to 25 Years | 11 (100.0%) | 0 (0.0%) |
| 26 to 34 Years | 95 (100.0%) | 0 (0.0%) |
| 35 to 44 Years | 52 (78.8%) | 14 (21.2%) |
| 45 to 54 Years | 19 (70.4%) | 8 (29.6%) |
| 55 to 64 Years | 17 (73.9%) | 6 (26.1%) |
| 65 to 74 Years | 16 (100.0%) | 0 (0.0%) |
| 75 Years and older | 13 (100.0%) | 0 (0.0%) |
| Total | 319 (91.4%) | 30 (8.6%) |
Health Insurance Coverage by Citizenship Status in West Logan
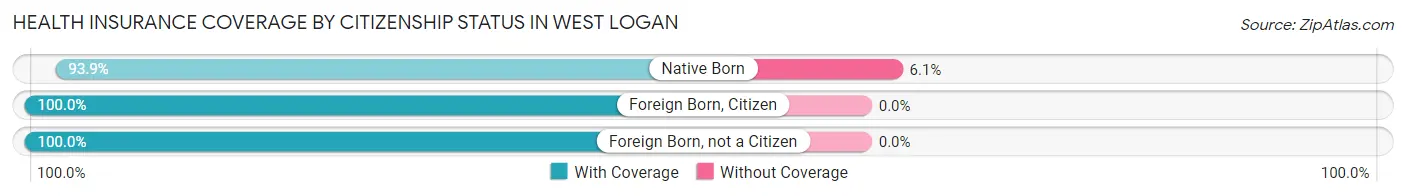
| Citizenship Status | With Coverage | Without Coverage |
| Native Born | 31 (93.9%) | 2 (6.1%) |
| Foreign Born, Citizen | 65 (100.0%) | 0 (0.0%) |
| Foreign Born, not a Citizen | 11 (100.0%) | 0 (0.0%) |
Health Insurance Coverage by Household Income in West Logan
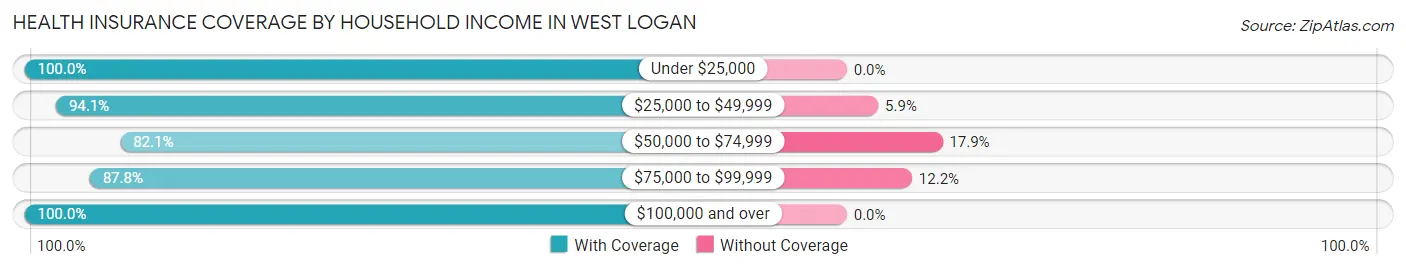
| Household Income | With Coverage | Without Coverage |
| Under $25,000 | 62 (100.0%) | 0 (0.0%) |
| $25,000 to $49,999 | 96 (94.1%) | 6 (5.9%) |
| $50,000 to $74,999 | 87 (82.1%) | 19 (17.9%) |
| $75,000 to $99,999 | 36 (87.8%) | 5 (12.2%) |
| $100,000 and over | 38 (100.0%) | 0 (0.0%) |
Public vs Private Health Insurance Coverage by Age in West Logan
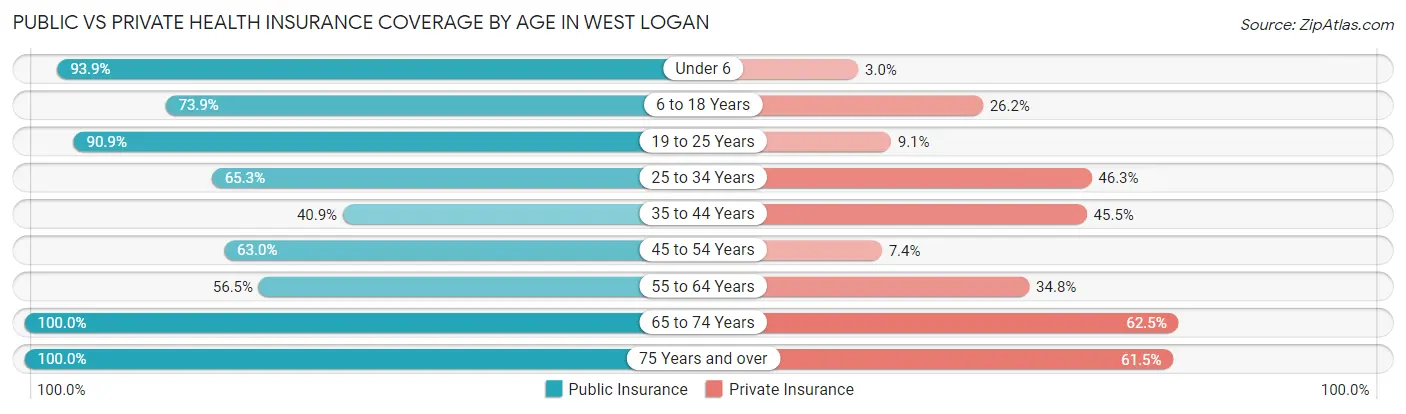
| Age Bracket | Public Insurance | Private Insurance |
| Under 6 | 31 (93.9%) | 1 (3.0%) |
| 6 to 18 Years | 48 (73.9%) | 17 (26.2%) |
| 19 to 25 Years | 10 (90.9%) | 1 (9.1%) |
| 25 to 34 Years | 62 (65.3%) | 44 (46.3%) |
| 35 to 44 Years | 27 (40.9%) | 30 (45.5%) |
| 45 to 54 Years | 17 (63.0%) | 2 (7.4%) |
| 55 to 64 Years | 13 (56.5%) | 8 (34.8%) |
| 65 to 74 Years | 16 (100.0%) | 10 (62.5%) |
| 75 Years and over | 13 (100.0%) | 8 (61.5%) |
| Total | 237 (67.9%) | 121 (34.7%) |
Disability Status by Sex by Age in West Logan
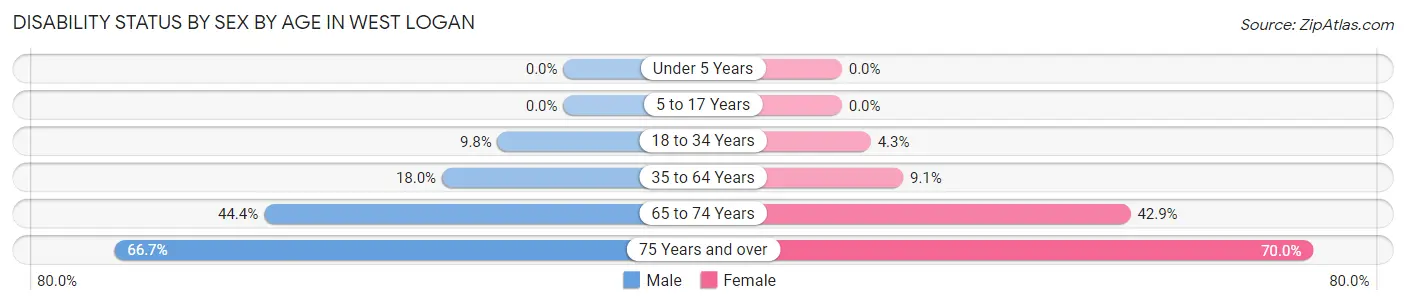
| Age Bracket | Male | Female |
| Under 5 Years | 0 (0.0%) | 0 (0.0%) |
| 5 to 17 Years | 0 (0.0%) | 0 (0.0%) |
| 18 to 34 Years | 4 (9.8%) | 3 (4.3%) |
| 35 to 64 Years | 11 (18.0%) | 5 (9.1%) |
| 65 to 74 Years | 4 (44.4%) | 3 (42.9%) |
| 75 Years and over | 2 (66.7%) | 7 (70.0%) |
Disability Class by Sex by Age in West Logan
Disability Class: Hearing Difficulty
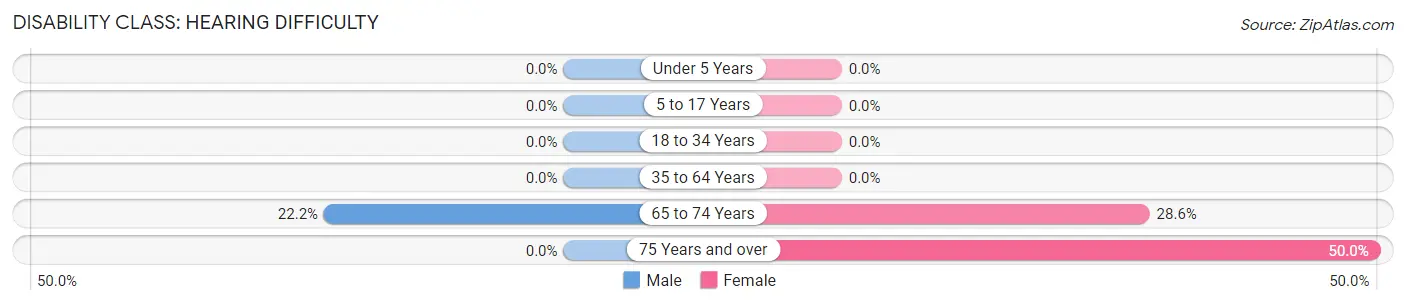
| Age Bracket | Male | Female |
| Under 5 Years | 0 (0.0%) | 0 (0.0%) |
| 5 to 17 Years | 0 (0.0%) | 0 (0.0%) |
| 18 to 34 Years | 0 (0.0%) | 0 (0.0%) |
| 35 to 64 Years | 0 (0.0%) | 0 (0.0%) |
| 65 to 74 Years | 2 (22.2%) | 2 (28.6%) |
| 75 Years and over | 0 (0.0%) | 5 (50.0%) |
Disability Class: Vision Difficulty
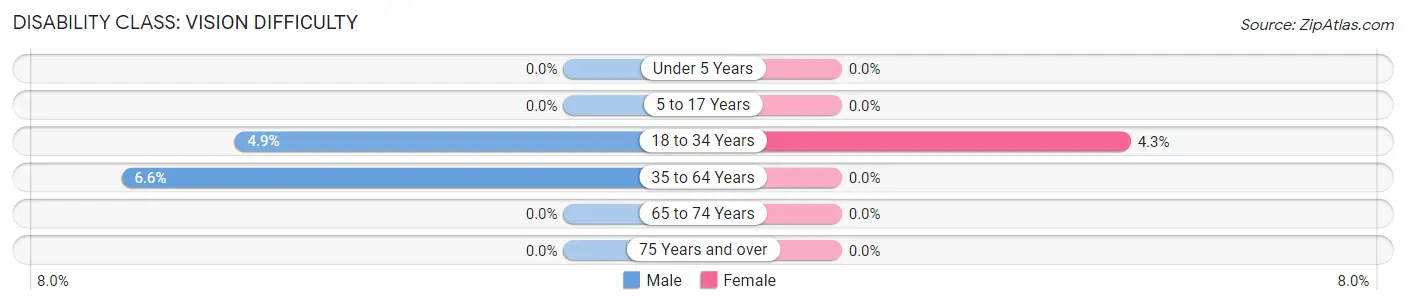
| Age Bracket | Male | Female |
| Under 5 Years | 0 (0.0%) | 0 (0.0%) |
| 5 to 17 Years | 0 (0.0%) | 0 (0.0%) |
| 18 to 34 Years | 2 (4.9%) | 3 (4.3%) |
| 35 to 64 Years | 4 (6.6%) | 0 (0.0%) |
| 65 to 74 Years | 0 (0.0%) | 0 (0.0%) |
| 75 Years and over | 0 (0.0%) | 0 (0.0%) |
Disability Class: Cognitive Difficulty
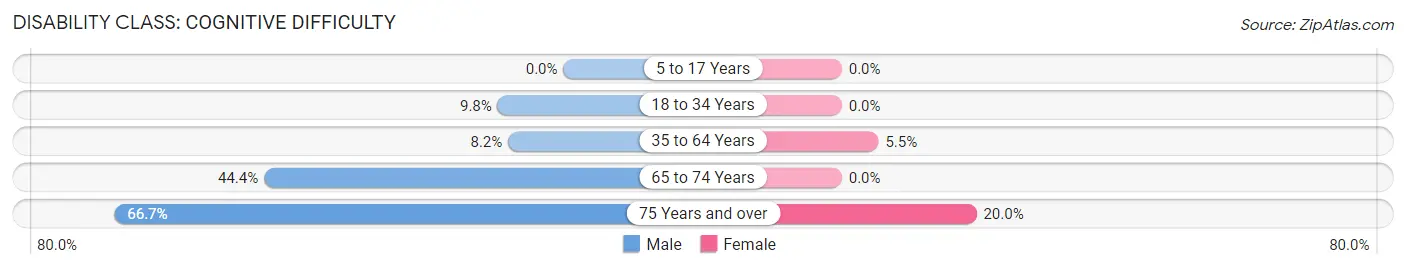
| Age Bracket | Male | Female |
| 5 to 17 Years | 0 (0.0%) | 0 (0.0%) |
| 18 to 34 Years | 4 (9.8%) | 0 (0.0%) |
| 35 to 64 Years | 5 (8.2%) | 3 (5.4%) |
| 65 to 74 Years | 4 (44.4%) | 0 (0.0%) |
| 75 Years and over | 2 (66.7%) | 2 (20.0%) |
Disability Class: Ambulatory Difficulty
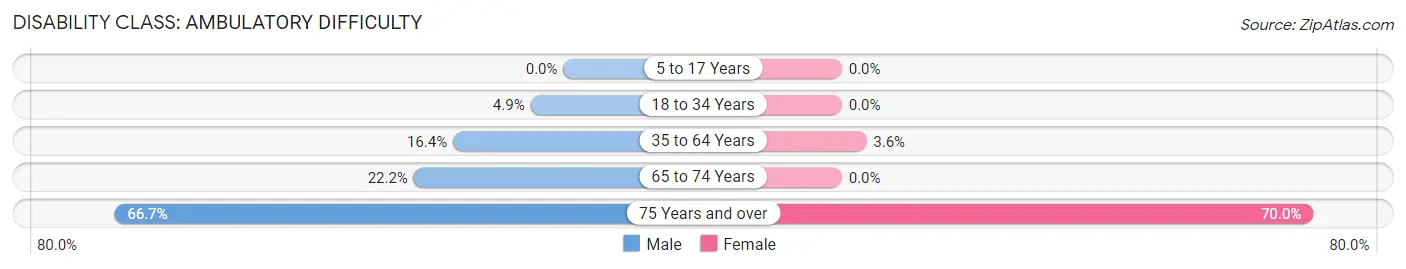
| Age Bracket | Male | Female |
| 5 to 17 Years | 0 (0.0%) | 0 (0.0%) |
| 18 to 34 Years | 2 (4.9%) | 0 (0.0%) |
| 35 to 64 Years | 10 (16.4%) | 2 (3.6%) |
| 65 to 74 Years | 2 (22.2%) | 0 (0.0%) |
| 75 Years and over | 2 (66.7%) | 7 (70.0%) |
Disability Class: Self-Care Difficulty
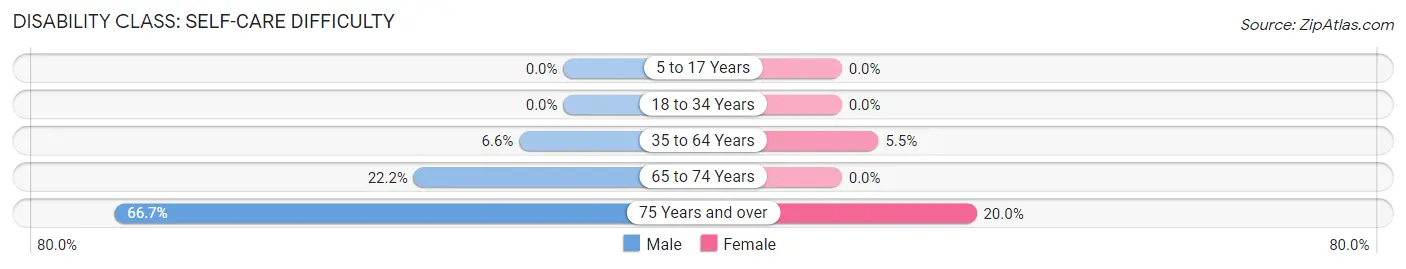
| Age Bracket | Male | Female |
| 5 to 17 Years | 0 (0.0%) | 0 (0.0%) |
| 18 to 34 Years | 0 (0.0%) | 0 (0.0%) |
| 35 to 64 Years | 4 (6.6%) | 3 (5.4%) |
| 65 to 74 Years | 2 (22.2%) | 0 (0.0%) |
| 75 Years and over | 2 (66.7%) | 2 (20.0%) |
Technology Access in West Logan
Computing Device Access in West Logan
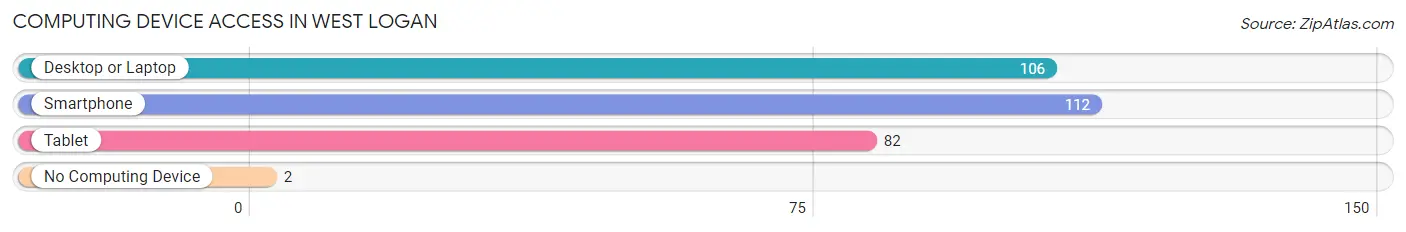
| Device Type | # Households | % Households |
| Desktop or Laptop | 106 | 83.5% |
| Smartphone | 112 | 88.2% |
| Tablet | 82 | 64.6% |
| No Computing Device | 2 | 1.6% |
| Total | 127 | 100.0% |
Internet Access in West Logan
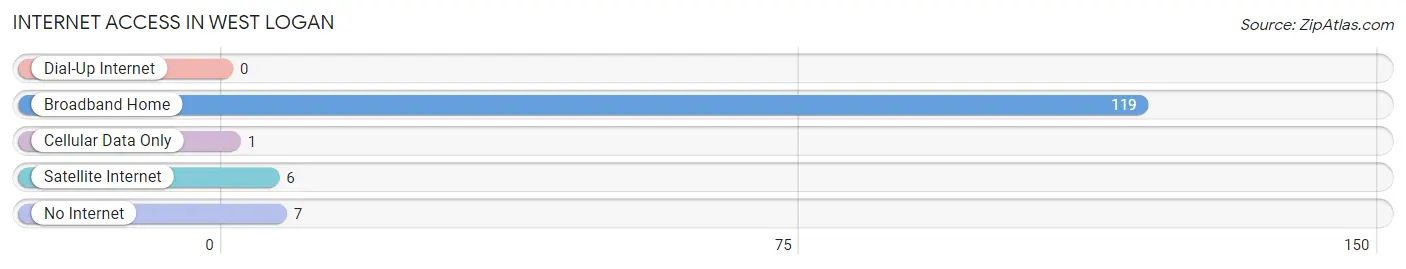
| Internet Type | # Households | % Households |
| Dial-Up Internet | 0 | 0.0% |
| Broadband Home | 119 | 93.7% |
| Cellular Data Only | 1 | 0.8% |
| Satellite Internet | 6 | 4.7% |
| No Internet | 7 | 5.5% |
| Total | 127 | 100.0% |
West Logan Summary
History
West Logan is a town located in Logan County, West Virginia. It is situated on the Guyandotte River, and is the county seat of Logan County. The town was founded in 1824 and was originally known as Aracoma, named after the daughter of a local Native American chief. The town was later renamed West Logan in 1837.
West Logan has a rich history that dates back to the early 1800s. The town was a major hub for the coal industry, and was home to several coal mines. The town was also home to the first railroad in the state of West Virginia, which was built in 1873.
The town was also home to the first public school in the state, which was established in 1876. The school was later renamed West Logan High School, and is still in operation today.
West Logan was also home to the first hospital in the state, which was established in 1881. The hospital was later renamed Logan Regional Medical Center, and is still in operation today.
West Logan was also home to the first bank in the state, which was established in 1883. The bank was later renamed First National Bank of West Logan, and is still in operation today.
Geography
West Logan is located in the Appalachian Mountains of West Virginia. The town is situated on the Guyandotte River, and is the county seat of Logan County. The town is located at an elevation of 1,845 feet above sea level.
The town is located in a valley surrounded by mountains, and is home to several parks and recreational areas. The town is also home to several historic sites, including the West Logan Historic District, which is listed on the National Register of Historic Places.
The climate in West Logan is humid continental, with hot summers and cold winters. The average annual temperature is around 54 degrees Fahrenheit, and the average annual precipitation is around 43 inches.
Economy
West Logan is a small town with a population of around 1,500 people. The town is home to several businesses, including restaurants, retail stores, and medical facilities. The town is also home to several manufacturing companies, including a paper mill and a furniture factory.
The town is also home to several coal mines, which are the main source of employment in the area. The coal industry is the main source of income for the town, and is responsible for the majority of the town's economic activity.
Demographics
As of the 2010 census, West Logan had a population of 1,521 people. The racial makeup of the town was 97.3% White, 0.7% African American, 0.2% Native American, 0.2% Asian, 0.2% from other races, and 1.6% from two or more races. Hispanic or Latino of any race were 0.7% of the population.
The median income for a household in the town was $30,938, and the median income for a family was $37,500. The per capita income for the town was $15,945. About 17.2% of families and 20.2% of the population were below the poverty line, including 28.3% of those under age 18 and 11.2% of those age 65 or over.
Common Questions
What is Per Capita Income in West Logan?
Per Capita income in West Logan is $19,379.
What is the Median Family Income in West Logan?
Median Family Income in West Logan is $57,344.
What is the Median Household income in West Logan?
Median Household Income in West Logan is $56,094.
What is Income or Wage Gap in West Logan?
Income or Wage Gap in West Logan is 1.4%.
Women in West Logan earn 98.6 cents for every dollar earned by a man.
What is Inequality or Gini Index in West Logan?
Inequality or Gini Index in West Logan is 0.35.
What is the Total Population of West Logan?
Total Population of West Logan is 349.
What is the Total Male Population of West Logan?
Total Male Population of West Logan is 148.
What is the Total Female Population of West Logan?
Total Female Population of West Logan is 201.
What is the Ratio of Males per 100 Females in West Logan?
There are 73.63 Males per 100 Females in West Logan.
What is the Ratio of Females per 100 Males in West Logan?
There are 135.81 Females per 100 Males in West Logan.
What is the Median Population Age in West Logan?
Median Population Age in West Logan is 31.0 Years.
What is the Average Family Size in West Logan
Average Family Size in West Logan is 3.2 People.
What is the Average Household Size in West Logan
Average Household Size in West Logan is 2.8 People.
How Large is the Labor Force in West Logan?
There are 157 People in the Labor Forcein in West Logan.
What is the Percentage of People in the Labor Force in West Logan?
57.5% of People are in the Labor Force in West Logan.
What is the Unemployment Rate in West Logan?
Unemployment Rate in West Logan is 3.8%.