Anmoore, WV Map & Demographics
Anmoore Map
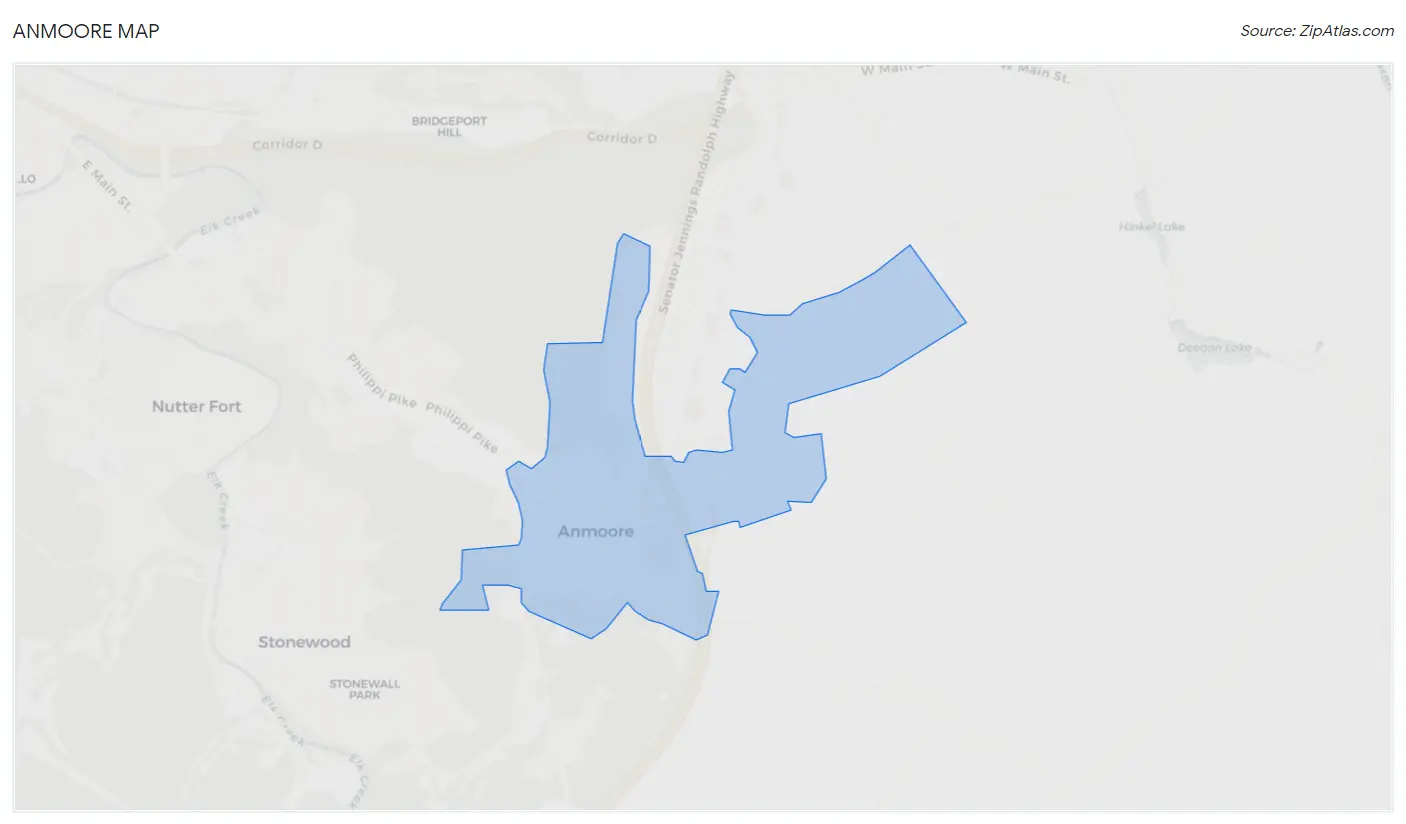
Anmoore Overview
$18,852
PER CAPITA INCOME
$29,712
AVG FAMILY INCOME
$26,471
AVG HOUSEHOLD INCOME
12.2%
WAGE / INCOME GAP [ % ]
87.8¢/ $1
WAGE / INCOME GAP [ $ ]
0.44
INEQUALITY / GINI INDEX
562
TOTAL POPULATION
213
MALE POPULATION
349
FEMALE POPULATION
61.03
MALES / 100 FEMALES
163.85
FEMALES / 100 MALES
40.4
MEDIAN AGE
2.8
AVG FAMILY SIZE
1.9
AVG HOUSEHOLD SIZE
232
LABOR FORCE [ PEOPLE ]
47.0%
PERCENT IN LABOR FORCE
6.5%
UNEMPLOYMENT RATE
Anmoore Zip Codes
Anmoore Area Codes
Income in Anmoore
Income Overview in Anmoore
Per Capita Income in Anmoore is $18,852, while median incomes of families and households are $29,712 and $26,471 respectively.
| Characteristic | Number | Measure |
| Per Capita Income | 562 | $18,852 |
| Median Family Income | 134 | $29,712 |
| Mean Family Income | 134 | $46,201 |
| Median Household Income | 300 | $26,471 |
| Mean Household Income | 300 | $33,167 |
| Income Deficit | 134 | $0 |
| Wage / Income Gap (%) | 562 | 12.22% |
| Wage / Income Gap ($) | 562 | 87.78¢ per $1 |
| Gini / Inequality Index | 562 | 0.44 |
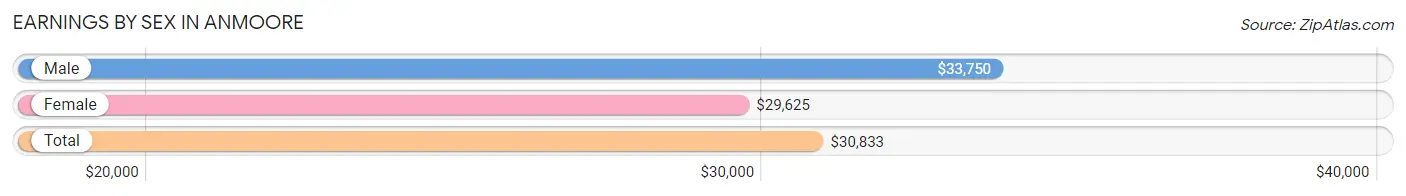
Earnings by Sex in Anmoore
Average Earnings in Anmoore are $30,833, $33,750 for men and $29,625 for women, a difference of 12.2%.
| Sex | Number | Average Earnings |
| Male | 107 (47.3%) | $33,750 |
| Female | 119 (52.6%) | $29,625 |
| Total | 226 (100.0%) | $30,833 |
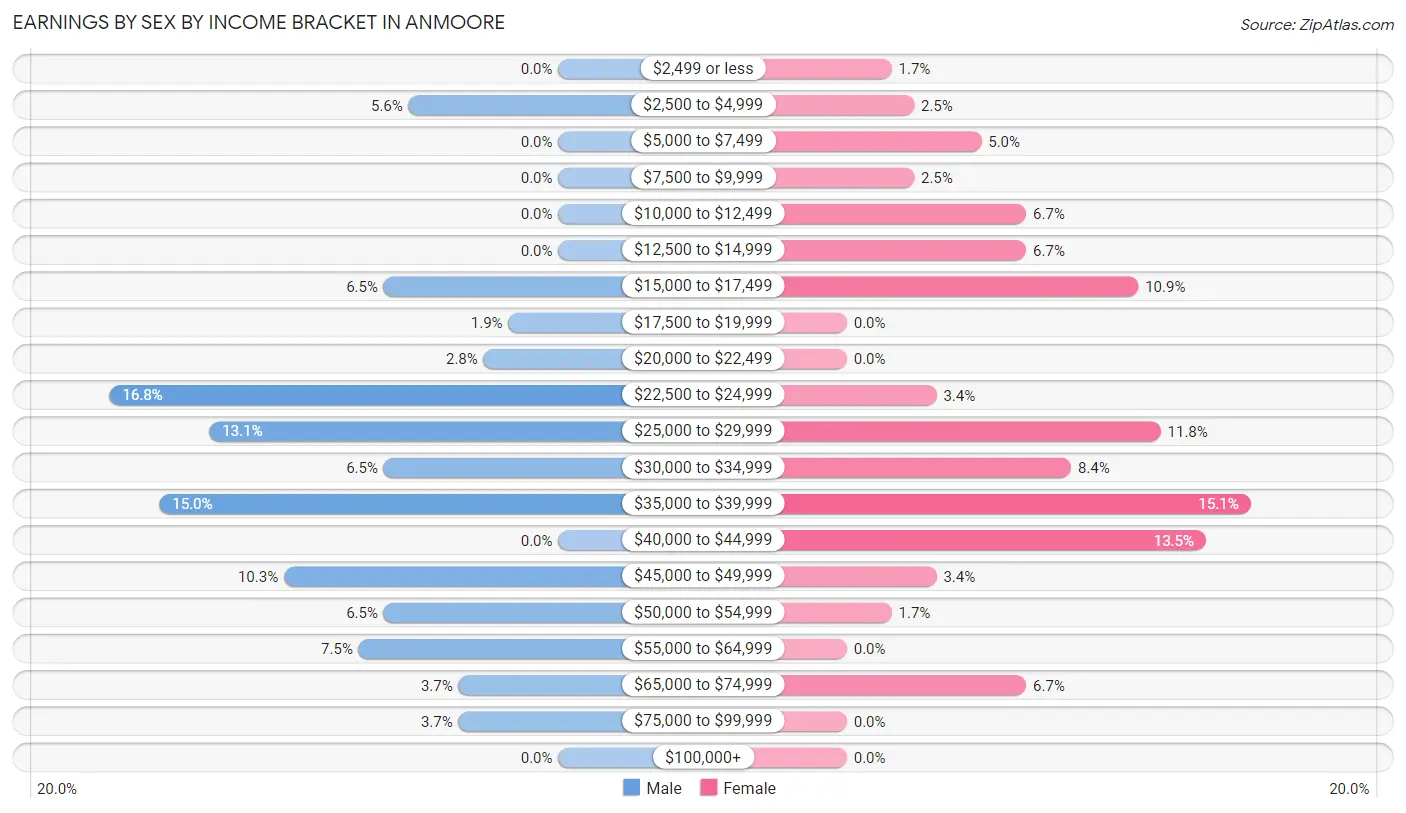
Earnings by Sex by Income Bracket in Anmoore
The most common earnings brackets in Anmoore are $22,500 to $24,999 for men (18 | 16.8%) and $35,000 to $39,999 for women (18 | 15.1%).
| Income | Male | Female |
| $2,499 or less | 0 (0.0%) | 2 (1.7%) |
| $2,500 to $4,999 | 6 (5.6%) | 3 (2.5%) |
| $5,000 to $7,499 | 0 (0.0%) | 6 (5.0%) |
| $7,500 to $9,999 | 0 (0.0%) | 3 (2.5%) |
| $10,000 to $12,499 | 0 (0.0%) | 8 (6.7%) |
| $12,500 to $14,999 | 0 (0.0%) | 8 (6.7%) |
| $15,000 to $17,499 | 7 (6.5%) | 13 (10.9%) |
| $17,500 to $19,999 | 2 (1.9%) | 0 (0.0%) |
| $20,000 to $22,499 | 3 (2.8%) | 0 (0.0%) |
| $22,500 to $24,999 | 18 (16.8%) | 4 (3.4%) |
| $25,000 to $29,999 | 14 (13.1%) | 14 (11.8%) |
| $30,000 to $34,999 | 7 (6.5%) | 10 (8.4%) |
| $35,000 to $39,999 | 16 (14.9%) | 18 (15.1%) |
| $40,000 to $44,999 | 0 (0.0%) | 16 (13.5%) |
| $45,000 to $49,999 | 11 (10.3%) | 4 (3.4%) |
| $50,000 to $54,999 | 7 (6.5%) | 2 (1.7%) |
| $55,000 to $64,999 | 8 (7.5%) | 0 (0.0%) |
| $65,000 to $74,999 | 4 (3.7%) | 8 (6.7%) |
| $75,000 to $99,999 | 4 (3.7%) | 0 (0.0%) |
| $100,000+ | 0 (0.0%) | 0 (0.0%) |
| Total | 107 (100.0%) | 119 (100.0%) |
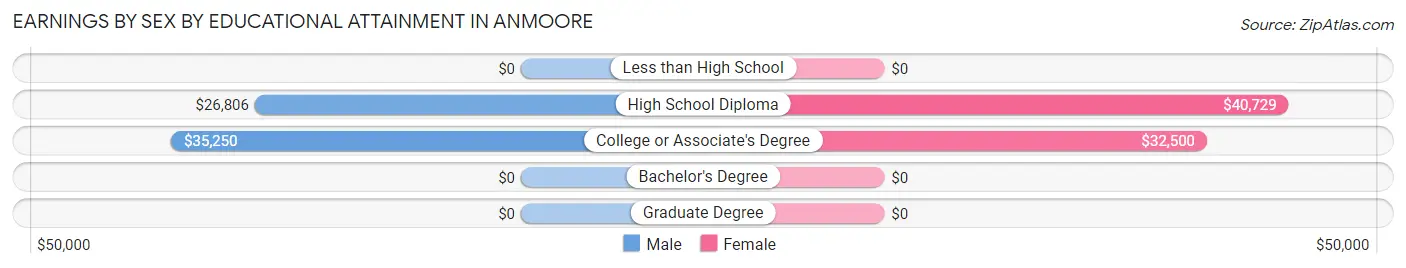
Earnings by Sex by Educational Attainment in Anmoore
Average earnings in Anmoore are $33,929 for men and $34,063 for women, a difference of 0.4%. Men with an educational attainment of college or associate's degree enjoy the highest average annual earnings of $35,250, while those with high school diploma education earn the least with $26,806. Women with an educational attainment of high school diploma earn the most with the average annual earnings of $40,729, while those with college or associate's degree education have the smallest earnings of $32,500.
| Educational Attainment | Male Income | Female Income |
| Less than High School | - | - |
| High School Diploma | $26,806 | $40,729 |
| College or Associate's Degree | $35,250 | $32,500 |
| Bachelor's Degree | - | - |
| Graduate Degree | - | - |
| Total | $33,929 | $34,063 |
Family Income in Anmoore
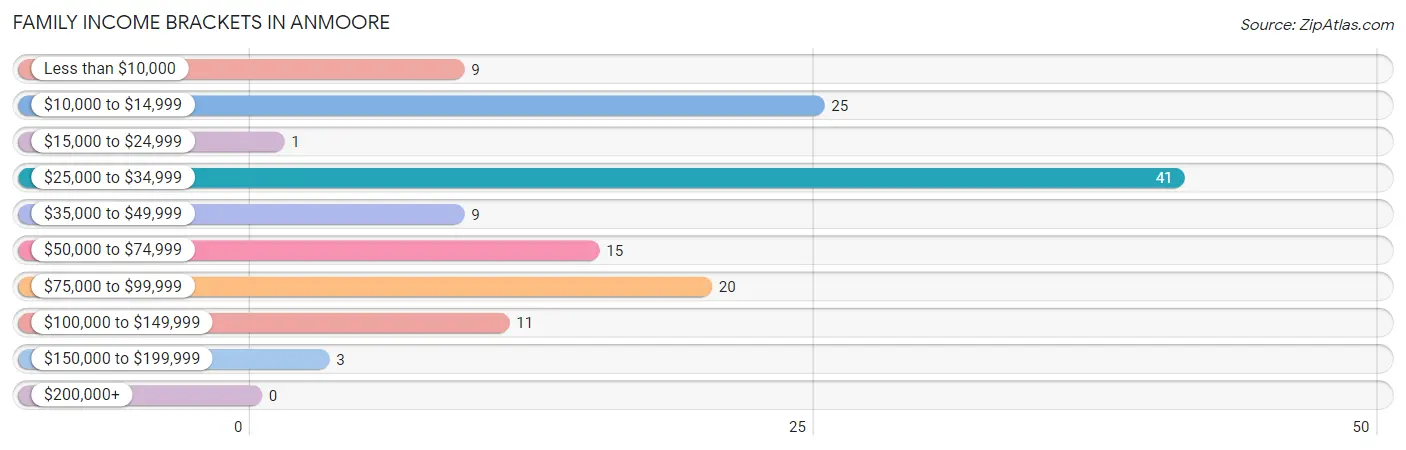
Family Income Brackets in Anmoore
According to the Anmoore family income data, there are 41 families falling into the $25,000 to $34,999 income range, which is the most common income bracket and makes up 30.6% of all families.
| Income Bracket | # Families | % Families |
| Less than $10,000 | 9 | 6.7% |
| $10,000 to $14,999 | 25 | 18.7% |
| $15,000 to $24,999 | 1 | 0.7% |
| $25,000 to $34,999 | 41 | 30.6% |
| $35,000 to $49,999 | 9 | 6.7% |
| $50,000 to $74,999 | 15 | 11.2% |
| $75,000 to $99,999 | 20 | 14.9% |
| $100,000 to $149,999 | 11 | 8.2% |
| $150,000 to $199,999 | 3 | 2.2% |
| $200,000+ | 0 | 0.0% |
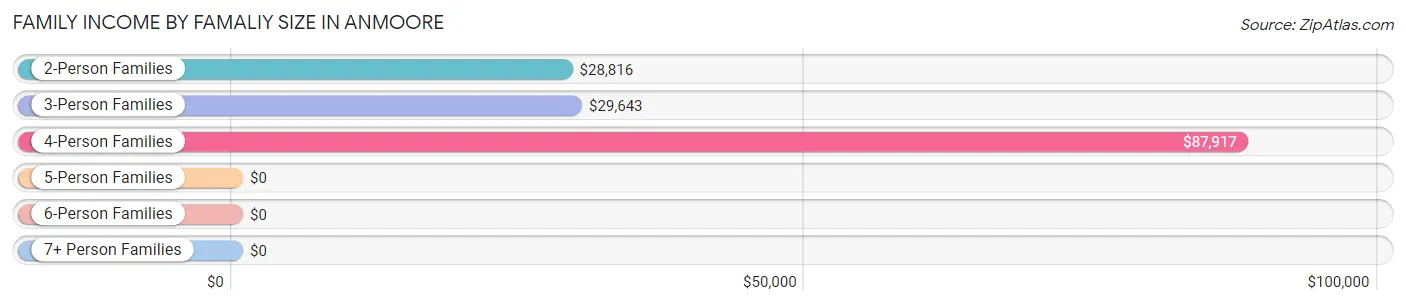
Family Income by Famaliy Size in Anmoore
4-person families (19 | 14.2%) account for the highest median family income in Anmoore with $87,917 per family, while 4-person families (19 | 14.2%) have the highest median income of $21,979 per family member.
| Income Bracket | # Families | Median Income |
| 2-Person Families | 96 (71.6%) | $28,816 |
| 3-Person Families | 14 (10.4%) | $29,643 |
| 4-Person Families | 19 (14.2%) | $87,917 |
| 5-Person Families | 0 (0.0%) | $0 |
| 6-Person Families | 2 (1.5%) | $0 |
| 7+ Person Families | 3 (2.2%) | $0 |
| Total | 134 (100.0%) | $29,712 |
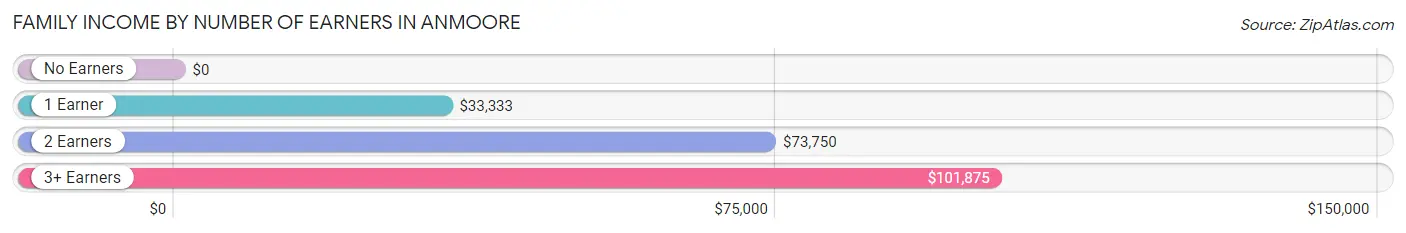
Family Income by Number of Earners in Anmoore
| Number of Earners | # Families | Median Income |
| No Earners | 57 (42.5%) | $0 |
| 1 Earner | 26 (19.4%) | $33,333 |
| 2 Earners | 42 (31.3%) | $73,750 |
| 3+ Earners | 9 (6.7%) | $101,875 |
| Total | 134 (100.0%) | $29,712 |
Household Income in Anmoore
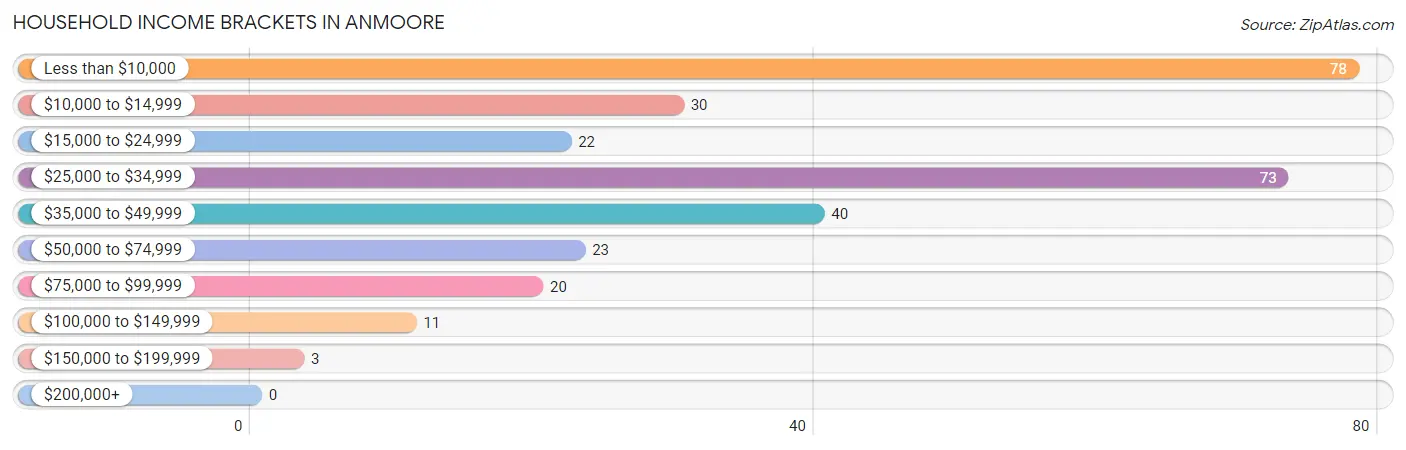
Household Income Brackets in Anmoore
With 78 households falling in the category, the less than $10,000 income range is the most frequent in Anmoore, accounting for 26.0% of all households.
| Income Bracket | # Households | % Households |
| Less than $10,000 | 78 | 26.0% |
| $10,000 to $14,999 | 30 | 10.0% |
| $15,000 to $24,999 | 22 | 7.3% |
| $25,000 to $34,999 | 73 | 24.3% |
| $35,000 to $49,999 | 40 | 13.3% |
| $50,000 to $74,999 | 23 | 7.7% |
| $75,000 to $99,999 | 20 | 6.7% |
| $100,000 to $149,999 | 11 | 3.7% |
| $150,000 to $199,999 | 3 | 1.0% |
| $200,000+ | 0 | 0.0% |
Household Income by Householder Age in Anmoore
The median household income in Anmoore is $26,471, with the highest median household income of $36,953 found in the 45 to 64 years age bracket for the primary householder. A total of 95 households (31.7%) fall into this category.
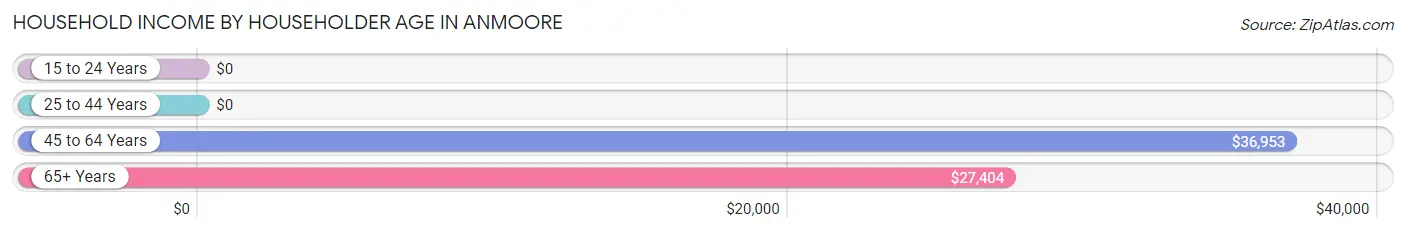
| Income Bracket | # Households | Median Income |
| 15 to 24 Years | 0 (0.0%) | $0 |
| 25 to 44 Years | 133 (44.3%) | $0 |
| 45 to 64 Years | 95 (31.7%) | $36,953 |
| 65+ Years | 72 (24.0%) | $27,404 |
| Total | 300 (100.0%) | $26,471 |
Poverty in Anmoore
Income Below Poverty by Sex and Age in Anmoore
With 24.4% poverty level for males and 36.7% for females among the residents of Anmoore, 6 to 11 year old males and 25 to 34 year old females are the most vulnerable to poverty, with 19 males (82.6%) and 73 females (90.1%) in their respective age groups living below the poverty level.
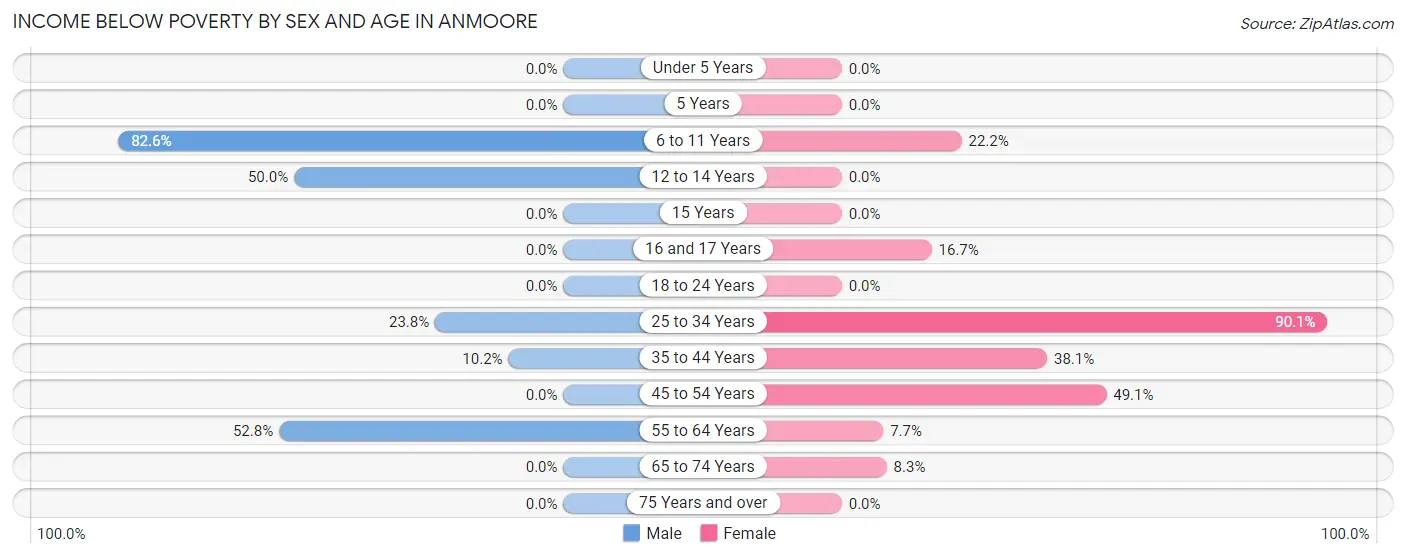
| Age Bracket | Male | Female |
| Under 5 Years | 0 (0.0%) | 0 (0.0%) |
| 5 Years | 0 (0.0%) | 0 (0.0%) |
| 6 to 11 Years | 19 (82.6%) | 4 (22.2%) |
| 12 to 14 Years | 4 (50.0%) | 0 (0.0%) |
| 15 Years | 0 (0.0%) | 0 (0.0%) |
| 16 and 17 Years | 0 (0.0%) | 2 (16.7%) |
| 18 to 24 Years | 0 (0.0%) | 0 (0.0%) |
| 25 to 34 Years | 5 (23.8%) | 73 (90.1%) |
| 35 to 44 Years | 5 (10.2%) | 16 (38.1%) |
| 45 to 54 Years | 0 (0.0%) | 27 (49.1%) |
| 55 to 64 Years | 19 (52.8%) | 3 (7.7%) |
| 65 to 74 Years | 0 (0.0%) | 3 (8.3%) |
| 75 Years and over | 0 (0.0%) | 0 (0.0%) |
| Total | 52 (24.4%) | 128 (36.7%) |
Income Above Poverty by Sex and Age in Anmoore
According to the poverty statistics in Anmoore, males aged 16 and 17 years and females aged under 5 years are the age groups that are most secure financially, with 100.0% of males and 100.0% of females in these age groups living above the poverty line.
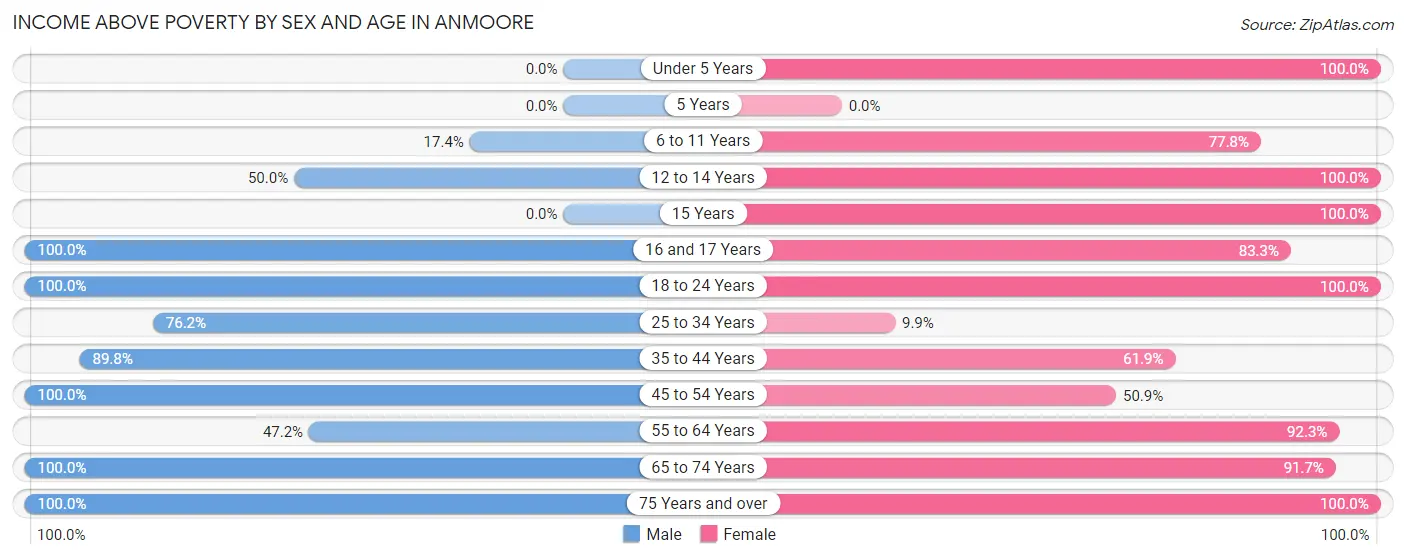
| Age Bracket | Male | Female |
| Under 5 Years | 0 (0.0%) | 11 (100.0%) |
| 5 Years | 0 (0.0%) | 0 (0.0%) |
| 6 to 11 Years | 4 (17.4%) | 14 (77.8%) |
| 12 to 14 Years | 4 (50.0%) | 5 (100.0%) |
| 15 Years | 0 (0.0%) | 3 (100.0%) |
| 16 and 17 Years | 9 (100.0%) | 10 (83.3%) |
| 18 to 24 Years | 11 (100.0%) | 13 (100.0%) |
| 25 to 34 Years | 16 (76.2%) | 8 (9.9%) |
| 35 to 44 Years | 44 (89.8%) | 26 (61.9%) |
| 45 to 54 Years | 27 (100.0%) | 28 (50.9%) |
| 55 to 64 Years | 17 (47.2%) | 36 (92.3%) |
| 65 to 74 Years | 26 (100.0%) | 33 (91.7%) |
| 75 Years and over | 3 (100.0%) | 34 (100.0%) |
| Total | 161 (75.6%) | 221 (63.3%) |
Income Below Poverty Among Married-Couple Families in Anmoore
The poverty statistics for married-couple families in Anmoore show that 22.4% or 24 of the total 107 families live below the poverty line. Families with no children have the highest poverty rate of 22.9%, comprising of 19 families. On the other hand, families with 1 or 2 children have the lowest poverty rate of 20.8%, which includes 5 families.
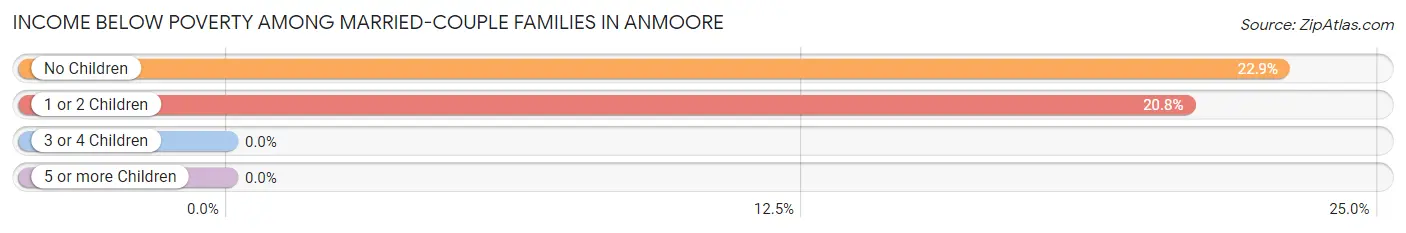
| Children | Above Poverty | Below Poverty |
| No Children | 64 (77.1%) | 19 (22.9%) |
| 1 or 2 Children | 19 (79.2%) | 5 (20.8%) |
| 3 or 4 Children | 0 (0.0%) | 0 (0.0%) |
| 5 or more Children | 0 (0.0%) | 0 (0.0%) |
| Total | 83 (77.6%) | 24 (22.4%) |
Income Below Poverty Among Single-Parent Households in Anmoore
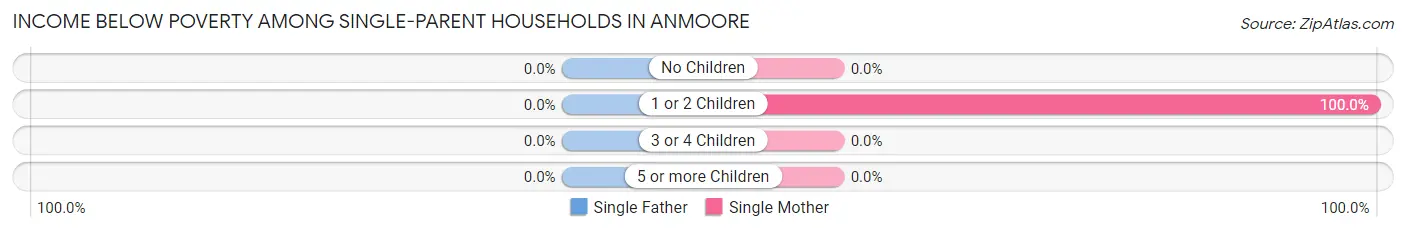
| Children | Single Father | Single Mother |
| No Children | 0 (0.0%) | 0 (0.0%) |
| 1 or 2 Children | 0 (0.0%) | 16 (100.0%) |
| 3 or 4 Children | 0 (0.0%) | 0 (0.0%) |
| 5 or more Children | 0 (0.0%) | 0 (0.0%) |
| Total | 0 (0.0%) | 16 (66.7%) |
Income Below Poverty Among Married-Couple vs Single-Parent Households in Anmoore
The poverty data for Anmoore shows that 24 of the married-couple family households (22.4%) and 16 of the single-parent households (59.3%) are living below the poverty level. Within the married-couple family households, those with no children have the highest poverty rate, with 19 households (22.9%) falling below the poverty line. Among the single-parent households, those with 1 or 2 children have the highest poverty rate, with 16 household (100.0%) living below poverty.
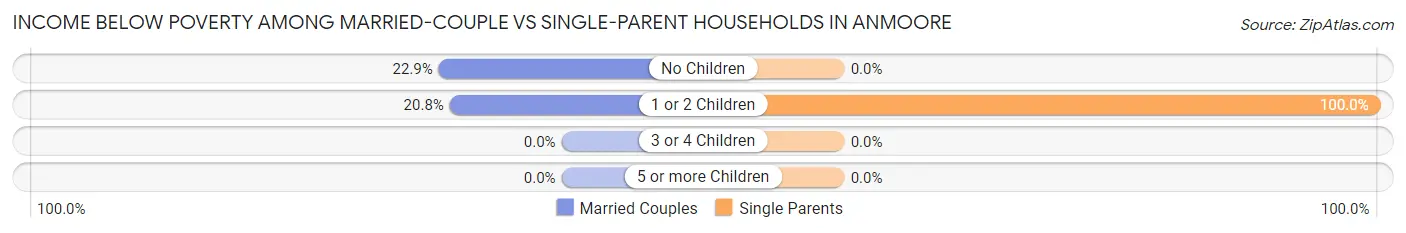
| Children | Married-Couple Families | Single-Parent Households |
| No Children | 19 (22.9%) | 0 (0.0%) |
| 1 or 2 Children | 5 (20.8%) | 16 (100.0%) |
| 3 or 4 Children | 0 (0.0%) | 0 (0.0%) |
| 5 or more Children | 0 (0.0%) | 0 (0.0%) |
| Total | 24 (22.4%) | 16 (59.3%) |
Race in Anmoore
The most populous races in Anmoore are White / Caucasian (553 | 98.4%), Two or more Races (9 | 1.6%), and Hispanic or Latino (2 | 0.4%).
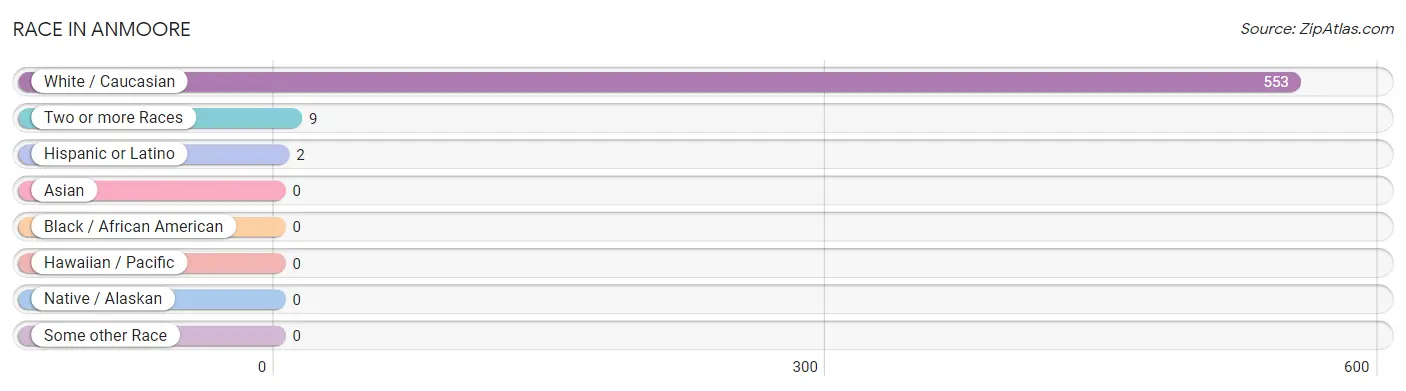
| Race | # Population | % Population |
| Asian | 0 | 0.0% |
| Black / African American | 0 | 0.0% |
| Hawaiian / Pacific | 0 | 0.0% |
| Hispanic or Latino | 2 | 0.4% |
| Native / Alaskan | 0 | 0.0% |
| White / Caucasian | 553 | 98.4% |
| Two or more Races | 9 | 1.6% |
| Some other Race | 0 | 0.0% |
| Total | 562 | 100.0% |
Ancestry in Anmoore
The most populous ancestries reported in Anmoore are Irish (110 | 19.6%), Italian (59 | 10.5%), German (51 | 9.1%), English (36 | 6.4%), and Scottish (33 | 5.9%), together accounting for 51.4% of all Anmoore residents.
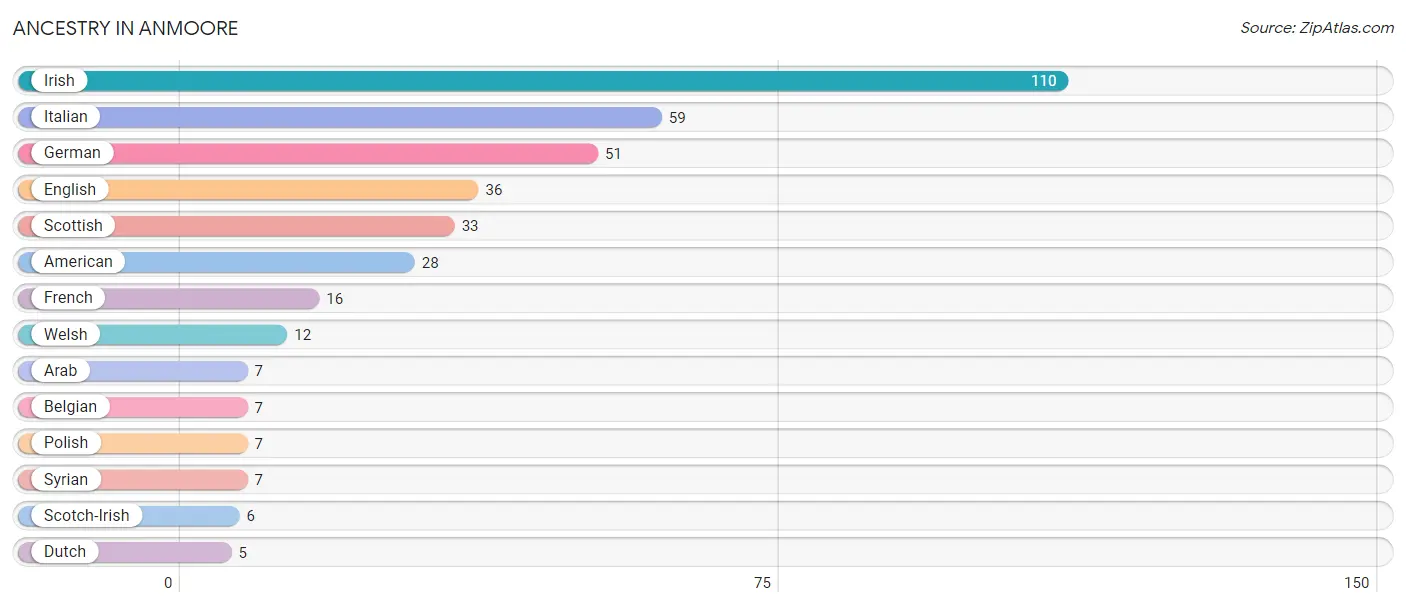
| Ancestry | # Population | % Population |
| American | 28 | 5.0% |
| Arab | 7 | 1.3% |
| Belgian | 7 | 1.3% |
| Dutch | 5 | 0.9% |
| English | 36 | 6.4% |
| French | 16 | 2.9% |
| German | 51 | 9.1% |
| Irish | 110 | 19.6% |
| Italian | 59 | 10.5% |
| Polish | 7 | 1.3% |
| Scotch-Irish | 6 | 1.1% |
| Scottish | 33 | 5.9% |
| Syrian | 7 | 1.3% |
| Welsh | 12 | 2.1% | View All 14 Rows |
Immigrants in Anmoore

| Immigration Origin | # Population | % Population | View All 0 Rows |
Sex and Age in Anmoore
Sex and Age in Anmoore
The most populous age groups in Anmoore are 35 to 39 Years (36 | 16.9%) for men and 25 to 29 Years (77 | 22.1%) for women.
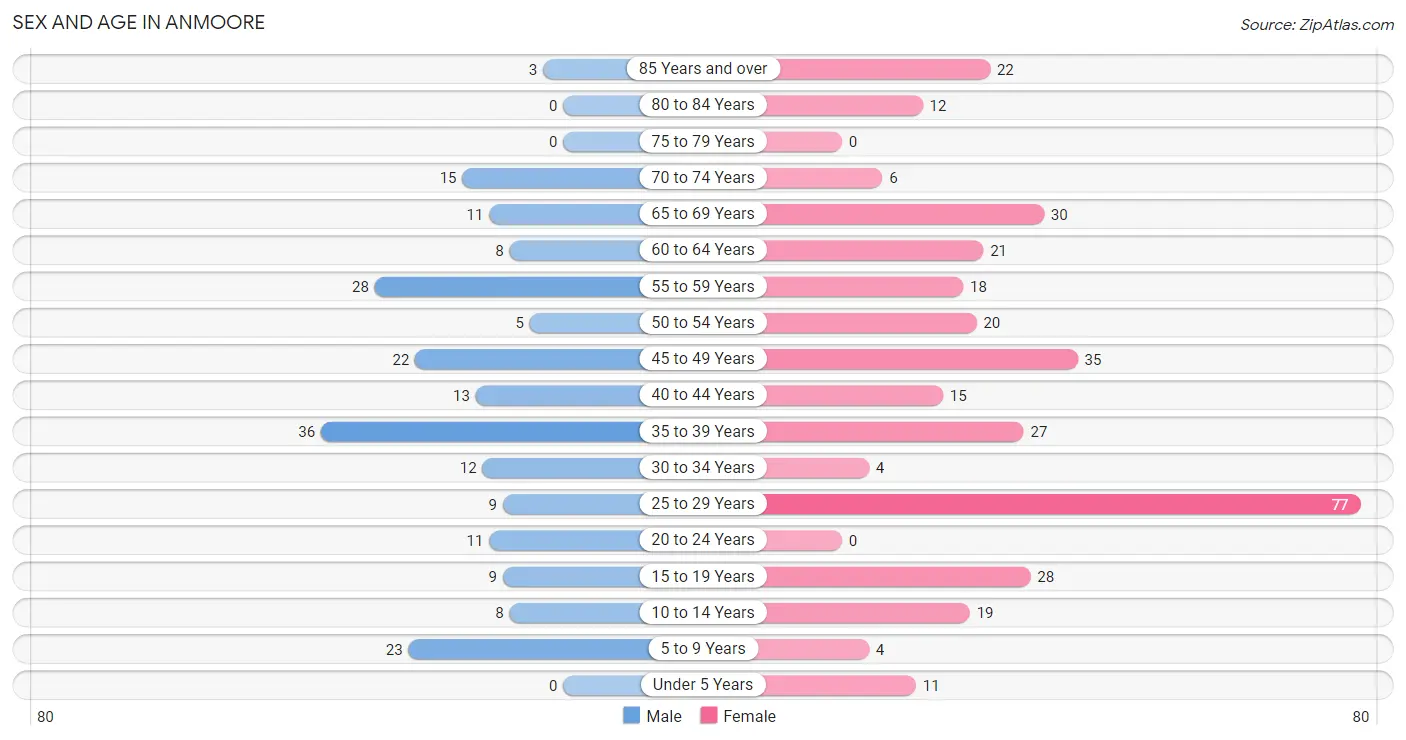
| Age Bracket | Male | Female |
| Under 5 Years | 0 (0.0%) | 11 (3.2%) |
| 5 to 9 Years | 23 (10.8%) | 4 (1.1%) |
| 10 to 14 Years | 8 (3.8%) | 19 (5.4%) |
| 15 to 19 Years | 9 (4.2%) | 28 (8.0%) |
| 20 to 24 Years | 11 (5.2%) | 0 (0.0%) |
| 25 to 29 Years | 9 (4.2%) | 77 (22.1%) |
| 30 to 34 Years | 12 (5.6%) | 4 (1.1%) |
| 35 to 39 Years | 36 (16.9%) | 27 (7.7%) |
| 40 to 44 Years | 13 (6.1%) | 15 (4.3%) |
| 45 to 49 Years | 22 (10.3%) | 35 (10.0%) |
| 50 to 54 Years | 5 (2.4%) | 20 (5.7%) |
| 55 to 59 Years | 28 (13.2%) | 18 (5.2%) |
| 60 to 64 Years | 8 (3.8%) | 21 (6.0%) |
| 65 to 69 Years | 11 (5.2%) | 30 (8.6%) |
| 70 to 74 Years | 15 (7.0%) | 6 (1.7%) |
| 75 to 79 Years | 0 (0.0%) | 0 (0.0%) |
| 80 to 84 Years | 0 (0.0%) | 12 (3.4%) |
| 85 Years and over | 3 (1.4%) | 22 (6.3%) |
| Total | 213 (100.0%) | 349 (100.0%) |
Families and Households in Anmoore
Median Family Size in Anmoore
The median family size in Anmoore is 2.84 persons per family, with single male/father families (3 | 2.2%) accounting for the largest median family size of 9.33 persons per family. On the other hand, single female/mother families (24 | 17.9%) represent the smallest median family size with 2.33 persons per family.
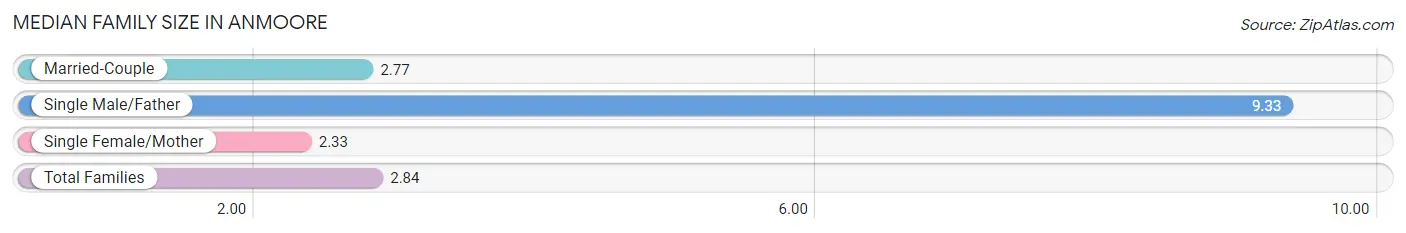
| Family Type | # Families | Family Size |
| Married-Couple | 107 (79.8%) | 2.77 |
| Single Male/Father | 3 (2.2%) | 9.33 |
| Single Female/Mother | 24 (17.9%) | 2.33 |
| Total Families | 134 (100.0%) | 2.84 |
Median Household Size in Anmoore
The median household size in Anmoore is 1.87 persons per household, with single male/father households (3 | 1.0%) accounting for the largest median household size of 10.67 persons per household. non-family households (166 | 55.3%) represent the smallest median household size with 1.05 persons per household.
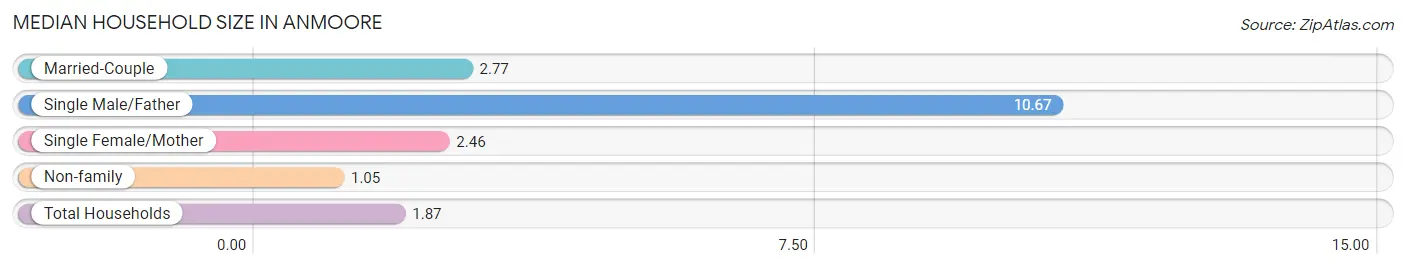
| Household Type | # Households | Household Size |
| Married-Couple | 107 (35.7%) | 2.77 |
| Single Male/Father | 3 (1.0%) | 10.67 |
| Single Female/Mother | 24 (8.0%) | 2.46 |
| Non-family | 166 (55.3%) | 1.05 |
| Total Households | 300 (100.0%) | 1.87 |
Household Size by Marriage Status in Anmoore
Out of a total of 300 households in Anmoore, 134 (44.7%) are family households, while 166 (55.3%) are nonfamily households. The most numerous type of family households are 2-person households, comprising 93, and the most common type of nonfamily households are 1-person households, comprising 162.
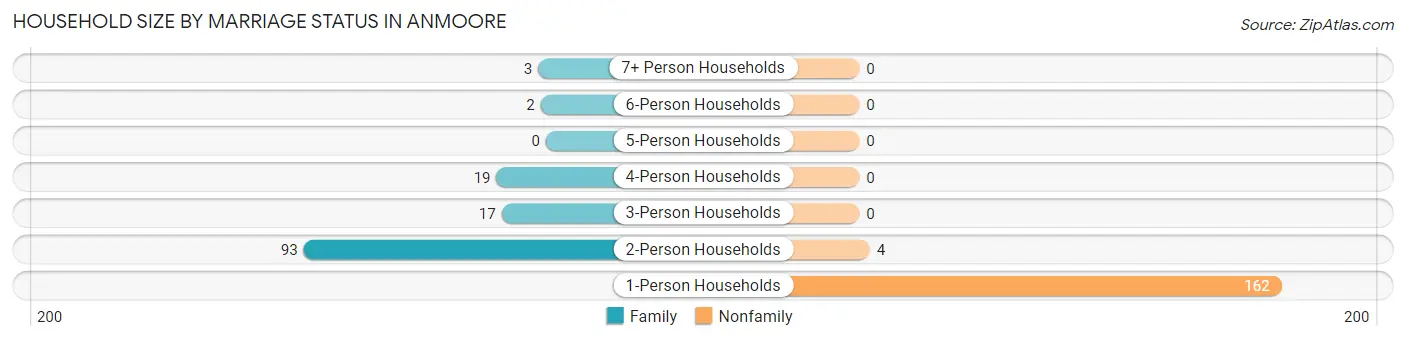
| Household Size | Family Households | Nonfamily Households |
| 1-Person Households | - | 162 (54.0%) |
| 2-Person Households | 93 (31.0%) | 4 (1.3%) |
| 3-Person Households | 17 (5.7%) | 0 (0.0%) |
| 4-Person Households | 19 (6.3%) | 0 (0.0%) |
| 5-Person Households | 0 (0.0%) | 0 (0.0%) |
| 6-Person Households | 2 (0.7%) | 0 (0.0%) |
| 7+ Person Households | 3 (1.0%) | 0 (0.0%) |
| Total | 134 (44.7%) | 166 (55.3%) |
Female Fertility in Anmoore
Fertility by Age in Anmoore
| Age Bracket | Women with Births | Births / 1,000 Women |
| 15 to 19 years | 0 (0.0%) | 0.0 |
| 20 to 34 years | 0 (0.0%) | 0.0 |
| 35 to 50 years | 0 (0.0%) | 0.0 |
| Total | 0 (0.0%) | 0.0 |
Fertility by Age by Marriage Status in Anmoore
| Age Bracket | Married | Unmarried |
| 15 to 19 years | 0 (0.0%) | 0 (0.0%) |
| 20 to 34 years | 0 (0.0%) | 0 (0.0%) |
| 35 to 50 years | 0 (0.0%) | 0 (0.0%) |
| Total | 0 (0.0%) | 0 (0.0%) |
Fertility by Education in Anmoore
| Educational Attainment | Women with Births | Births / 1,000 Women |
| Less than High School | 0 (0.0%) | 0.0 |
| High School Diploma | 0 (0.0%) | 0.0 |
| College or Associate's Degree | 0 (0.0%) | 0.0 |
| Bachelor's Degree | 0 (0.0%) | 0.0 |
| Graduate Degree | 0 (0.0%) | 0.0 |
| Total | 0 (0.0%) | 0.0 |
Fertility by Education by Marriage Status in Anmoore
| Educational Attainment | Married | Unmarried |
| Less than High School | 0 (0.0%) | 0 (0.0%) |
| High School Diploma | 0 (0.0%) | 0 (0.0%) |
| College or Associate's Degree | 0 (0.0%) | 0 (0.0%) |
| Bachelor's Degree | 0 (0.0%) | 0 (0.0%) |
| Graduate Degree | 0 (0.0%) | 0 (0.0%) |
| Total | 0 (0.0%) | 0 (0.0%) |
Employment Characteristics in Anmoore
Employment by Class of Employer in Anmoore
Among the 215 employed individuals in Anmoore, private company employees (125 | 58.1%), not-for-profit organizations (25 | 11.6%), and federal government employees (18 | 8.4%) make up the most common classes of employment.
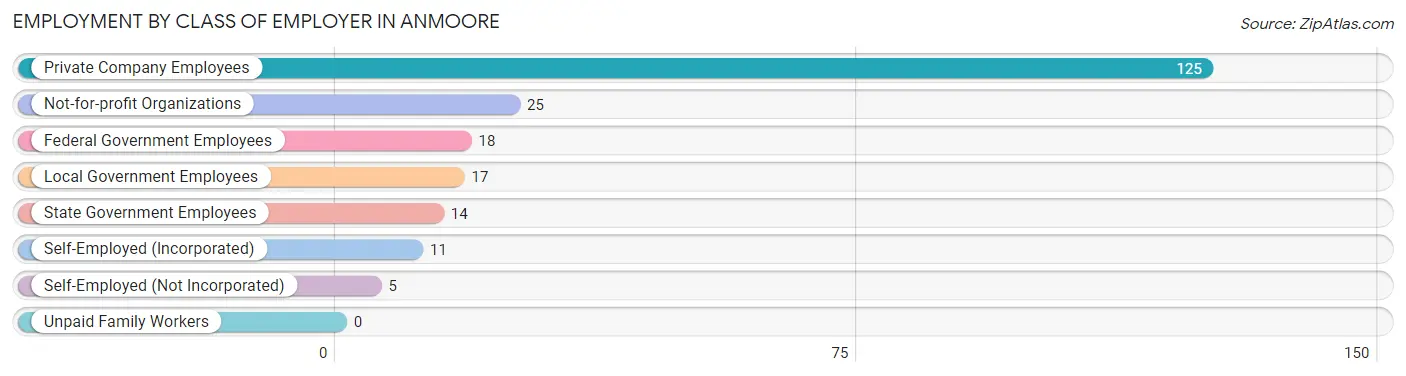
| Employer Class | # Employees | % Employees |
| Private Company Employees | 125 | 58.1% |
| Self-Employed (Incorporated) | 11 | 5.1% |
| Self-Employed (Not Incorporated) | 5 | 2.3% |
| Not-for-profit Organizations | 25 | 11.6% |
| Local Government Employees | 17 | 7.9% |
| State Government Employees | 14 | 6.5% |
| Federal Government Employees | 18 | 8.4% |
| Unpaid Family Workers | 0 | 0.0% |
| Total | 215 | 100.0% |
Employment Status by Age in Anmoore
According to the labor force statistics for Anmoore, out of the total population over 16 years of age (494), 47.0% or 232 individuals are in the labor force, with 6.5% or 15 of them unemployed. The age group with the highest labor force participation rate is 20 to 24 years, with 100.0% or 11 individuals in the labor force. Within the labor force, the 65 to 74 years age range has the highest percentage of unemployed individuals, with 33.3% or 3 of them being unemployed.
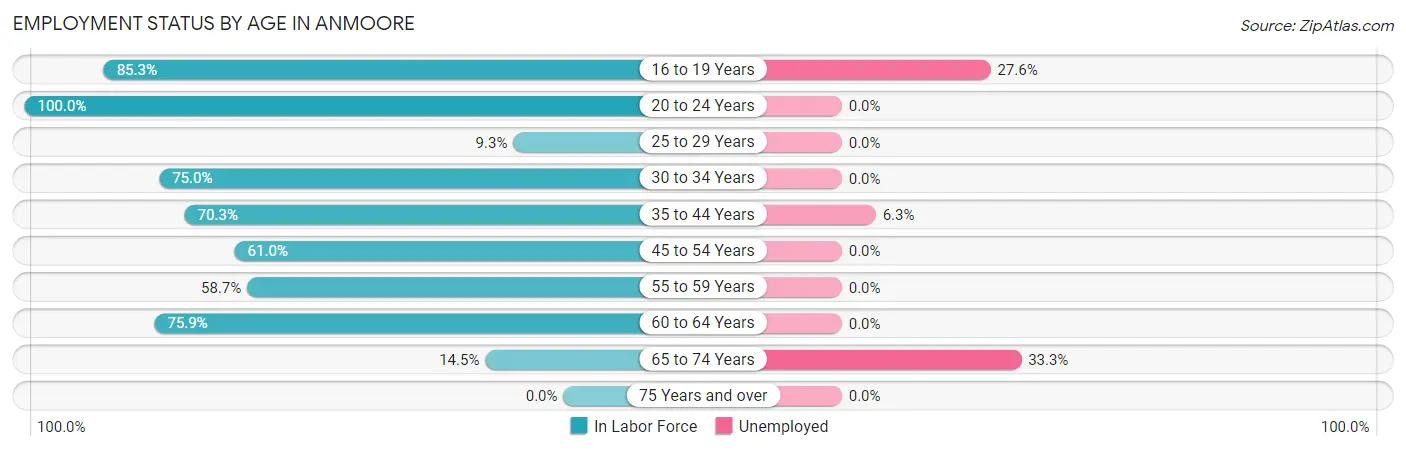
| Age Bracket | In Labor Force | Unemployed |
| 16 to 19 Years | 29 (85.3%) | 8 (27.6%) |
| 20 to 24 Years | 11 (100.0%) | 0 (0.0%) |
| 25 to 29 Years | 8 (9.3%) | 0 (0.0%) |
| 30 to 34 Years | 12 (75.0%) | 0 (0.0%) |
| 35 to 44 Years | 64 (70.3%) | 4 (6.3%) |
| 45 to 54 Years | 50 (61.0%) | 0 (0.0%) |
| 55 to 59 Years | 27 (58.7%) | 0 (0.0%) |
| 60 to 64 Years | 22 (75.9%) | 0 (0.0%) |
| 65 to 74 Years | 9 (14.5%) | 3 (33.3%) |
| 75 Years and over | 0 (0.0%) | 0 (0.0%) |
| Total | 232 (47.0%) | 15 (6.5%) |
Employment Status by Educational Attainment in Anmoore
According to labor force statistics for Anmoore, 52.3% of individuals (183) out of the total population between 25 and 64 years of age (350) are in the labor force, with 2.2% or 4 of them being unemployed. The group with the highest labor force participation rate are those with the educational attainment of bachelor's degree or higher, with 100.0% or 13 individuals in the labor force. Within the labor force, individuals with high school diploma education have the highest percentage of unemployment, with 4.3% or 4 of them being unemployed.
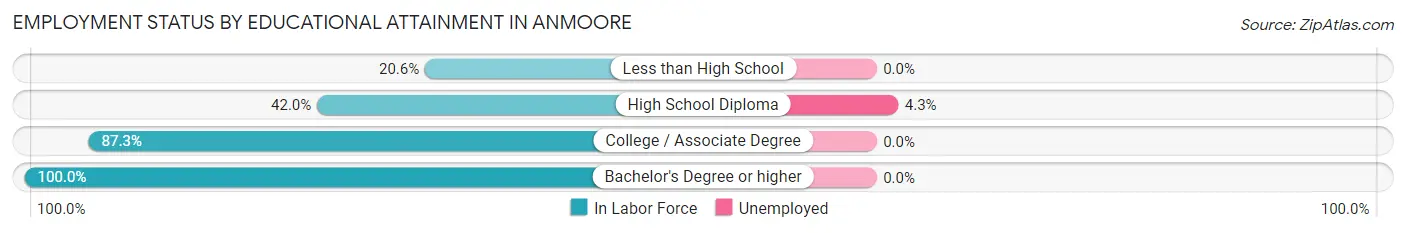
| Educational Attainment | In Labor Force | Unemployed |
| Less than High School | 7 (20.6%) | 0 (0.0%) |
| High School Diploma | 94 (42.0%) | 10 (4.3%) |
| College / Associate Degree | 69 (87.3%) | 0 (0.0%) |
| Bachelor's Degree or higher | 13 (100.0%) | 0 (0.0%) |
| Total | 183 (52.3%) | 8 (2.2%) |
Employment Occupations by Sex in Anmoore
Management, Business, Science and Arts Occupations
The most common Management, Business, Science and Arts occupations in Anmoore are Community & Social Service (19 | 8.8%), Education Instruction & Library (15 | 6.9%), Management (12 | 5.5%), Computers, Engineering & Science (5 | 2.3%), and Computers & Mathematics (5 | 2.3%).
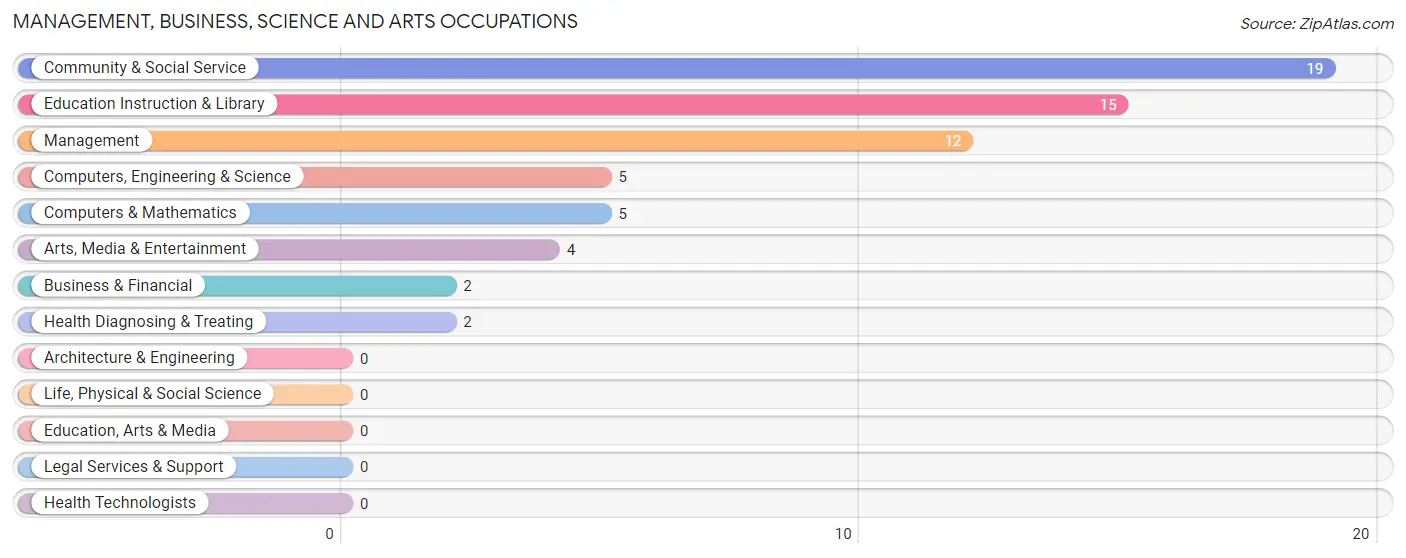
Management, Business, Science and Arts Occupations by Sex
Within the Management, Business, Science and Arts occupations in Anmoore, the most male-oriented occupations are Computers, Engineering & Science (100.0%), and Computers & Mathematics (100.0%), while the most female-oriented occupations are Management (100.0%), Business & Financial (100.0%), and Community & Social Service (100.0%).
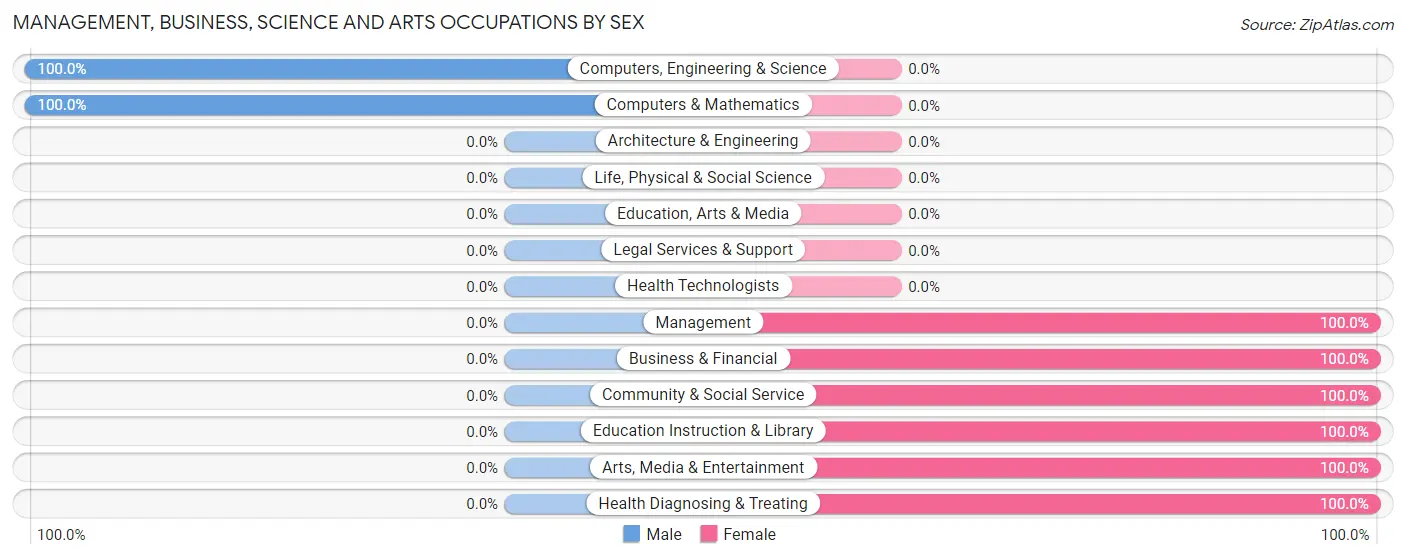
| Occupation | Male | Female |
| Management | 0 (0.0%) | 12 (100.0%) |
| Business & Financial | 0 (0.0%) | 2 (100.0%) |
| Computers, Engineering & Science | 5 (100.0%) | 0 (0.0%) |
| Computers & Mathematics | 5 (100.0%) | 0 (0.0%) |
| Architecture & Engineering | 0 (0.0%) | 0 (0.0%) |
| Life, Physical & Social Science | 0 (0.0%) | 0 (0.0%) |
| Community & Social Service | 0 (0.0%) | 19 (100.0%) |
| Education, Arts & Media | 0 (0.0%) | 0 (0.0%) |
| Legal Services & Support | 0 (0.0%) | 0 (0.0%) |
| Education Instruction & Library | 0 (0.0%) | 15 (100.0%) |
| Arts, Media & Entertainment | 0 (0.0%) | 4 (100.0%) |
| Health Diagnosing & Treating | 0 (0.0%) | 2 (100.0%) |
| Health Technologists | 0 (0.0%) | 0 (0.0%) |
| Total (Category) | 5 (12.5%) | 35 (87.5%) |
| Total (Overall) | 107 (49.3%) | 110 (50.7%) |
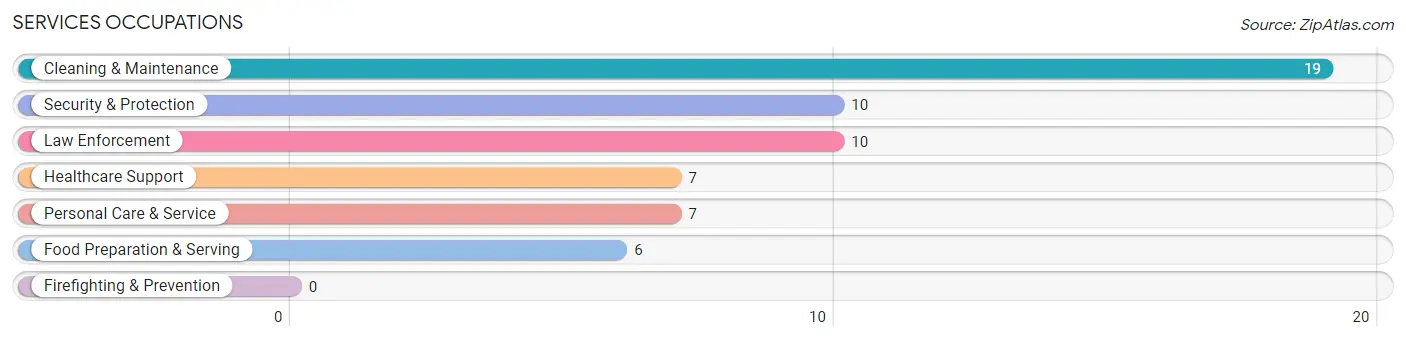
Services Occupations
The most common Services occupations in Anmoore are Cleaning & Maintenance (19 | 8.8%), Security & Protection (10 | 4.6%), Law Enforcement (10 | 4.6%), Healthcare Support (7 | 3.2%), and Personal Care & Service (7 | 3.2%).
Services Occupations by Sex
Within the Services occupations in Anmoore, the most male-oriented occupations are Security & Protection (100.0%), Law Enforcement (100.0%), and Cleaning & Maintenance (78.9%), while the most female-oriented occupations are Healthcare Support (100.0%), Personal Care & Service (100.0%), and Food Preparation & Serving (33.3%).
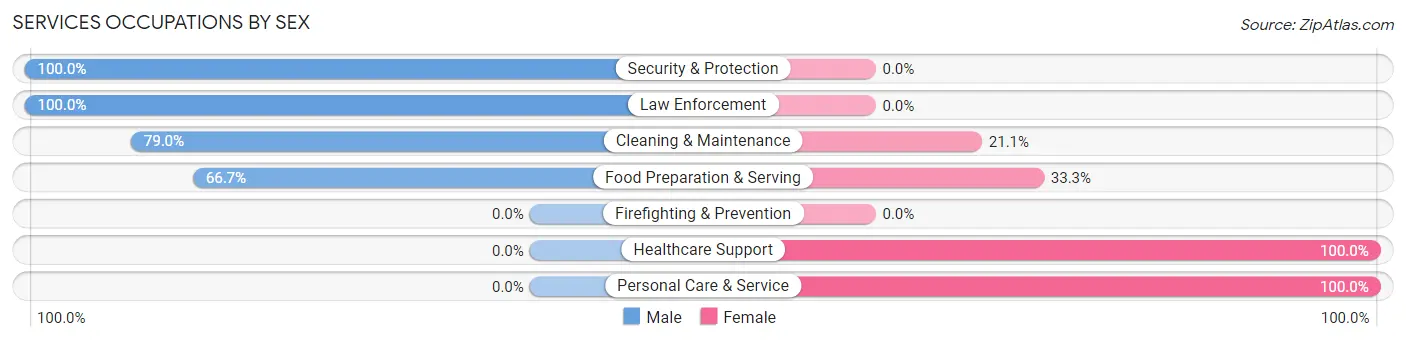
| Occupation | Male | Female |
| Healthcare Support | 0 (0.0%) | 7 (100.0%) |
| Security & Protection | 10 (100.0%) | 0 (0.0%) |
| Firefighting & Prevention | 0 (0.0%) | 0 (0.0%) |
| Law Enforcement | 10 (100.0%) | 0 (0.0%) |
| Food Preparation & Serving | 4 (66.7%) | 2 (33.3%) |
| Cleaning & Maintenance | 15 (78.9%) | 4 (21.0%) |
| Personal Care & Service | 0 (0.0%) | 7 (100.0%) |
| Total (Category) | 29 (59.2%) | 20 (40.8%) |
| Total (Overall) | 107 (49.3%) | 110 (50.7%) |
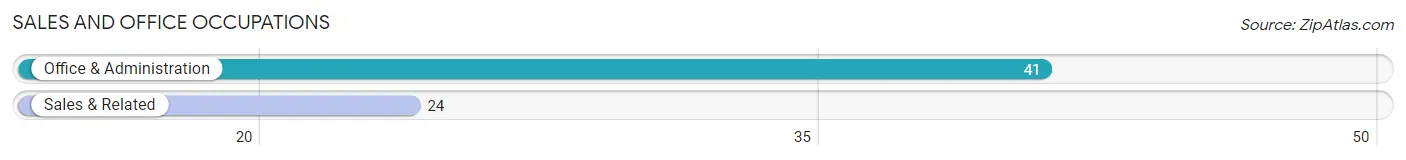
Sales and Office Occupations
The most common Sales and Office occupations in Anmoore are Office & Administration (41 | 18.9%), and Sales & Related (24 | 11.1%).
Sales and Office Occupations by Sex
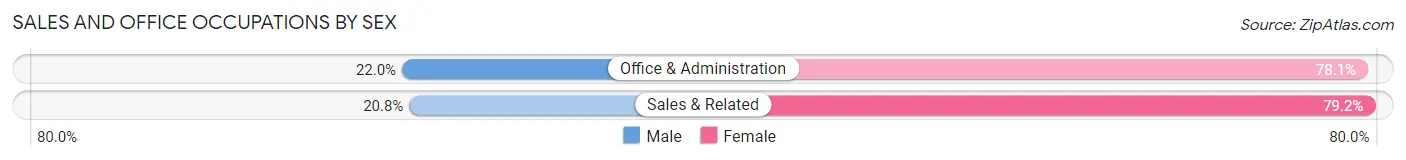
| Occupation | Male | Female |
| Sales & Related | 5 (20.8%) | 19 (79.2%) |
| Office & Administration | 9 (22.0%) | 32 (78.0%) |
| Total (Category) | 14 (21.5%) | 51 (78.5%) |
| Total (Overall) | 107 (49.3%) | 110 (50.7%) |
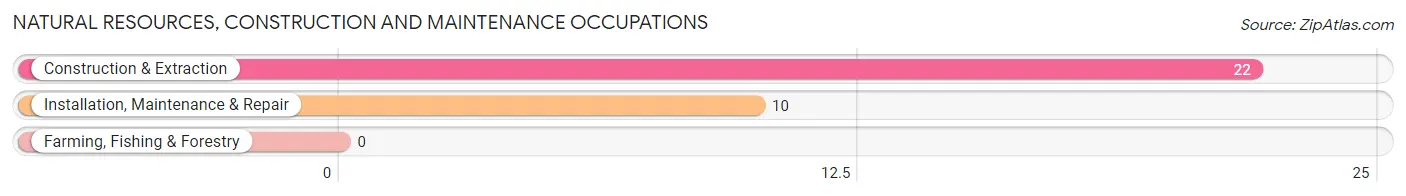
Natural Resources, Construction and Maintenance Occupations
The most common Natural Resources, Construction and Maintenance occupations in Anmoore are Construction & Extraction (22 | 10.1%), and Installation, Maintenance & Repair (10 | 4.6%).
Natural Resources, Construction and Maintenance Occupations by Sex
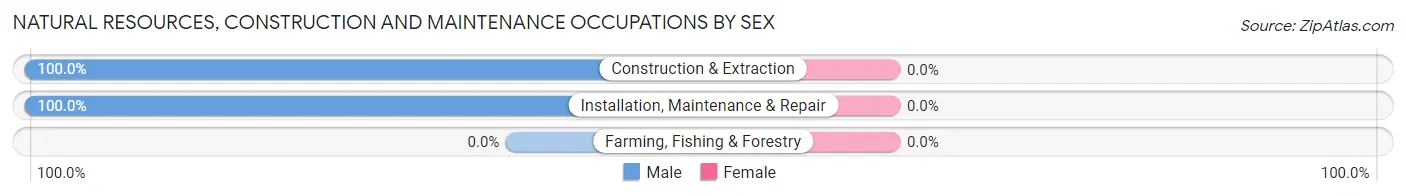
| Occupation | Male | Female |
| Farming, Fishing & Forestry | 0 (0.0%) | 0 (0.0%) |
| Construction & Extraction | 22 (100.0%) | 0 (0.0%) |
| Installation, Maintenance & Repair | 10 (100.0%) | 0 (0.0%) |
| Total (Category) | 32 (100.0%) | 0 (0.0%) |
| Total (Overall) | 107 (49.3%) | 110 (50.7%) |
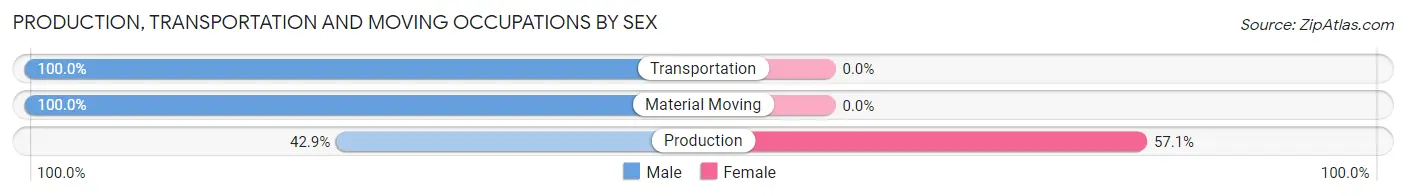
Production, Transportation and Moving Occupations
The most common Production, Transportation and Moving occupations in Anmoore are Transportation (18 | 8.3%), Production (7 | 3.2%), and Material Moving (6 | 2.8%).
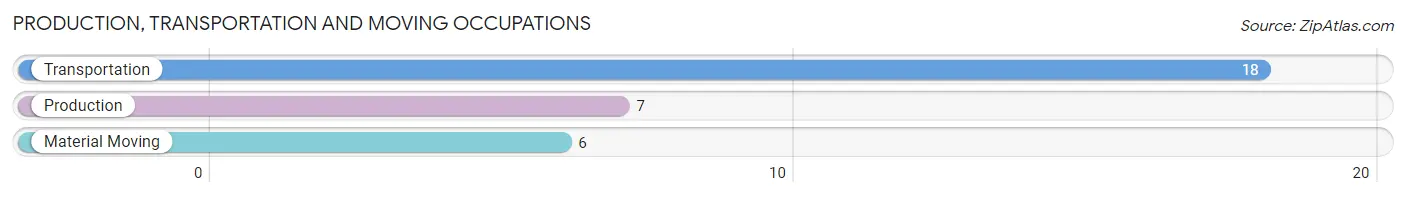
Production, Transportation and Moving Occupations by Sex
| Occupation | Male | Female |
| Production | 3 (42.9%) | 4 (57.1%) |
| Transportation | 18 (100.0%) | 0 (0.0%) |
| Material Moving | 6 (100.0%) | 0 (0.0%) |
| Total (Category) | 27 (87.1%) | 4 (12.9%) |
| Total (Overall) | 107 (49.3%) | 110 (50.7%) |
Employment Industries by Sex in Anmoore
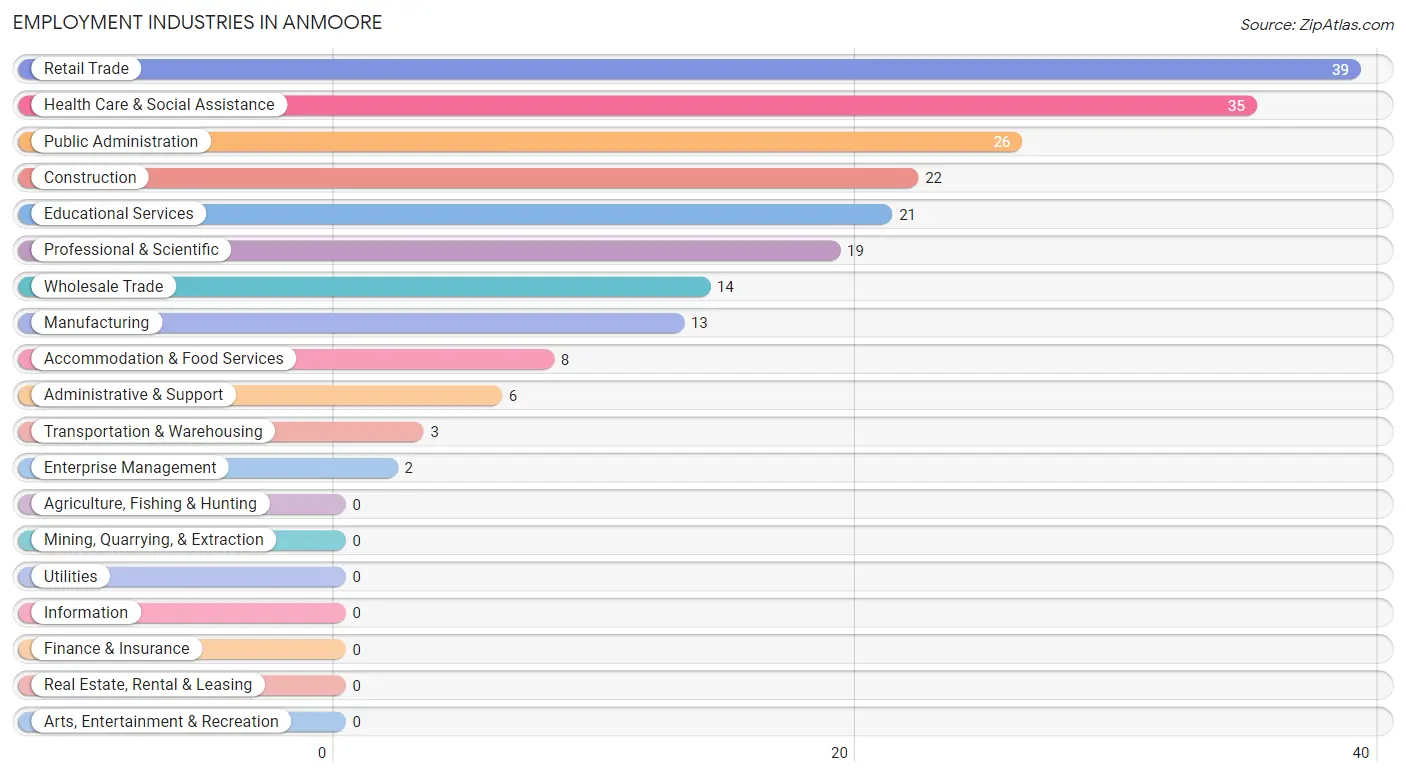
Employment Industries in Anmoore
The major employment industries in Anmoore include Retail Trade (39 | 18.0%), Health Care & Social Assistance (35 | 16.1%), Public Administration (26 | 12.0%), Construction (22 | 10.1%), and Educational Services (21 | 9.7%).
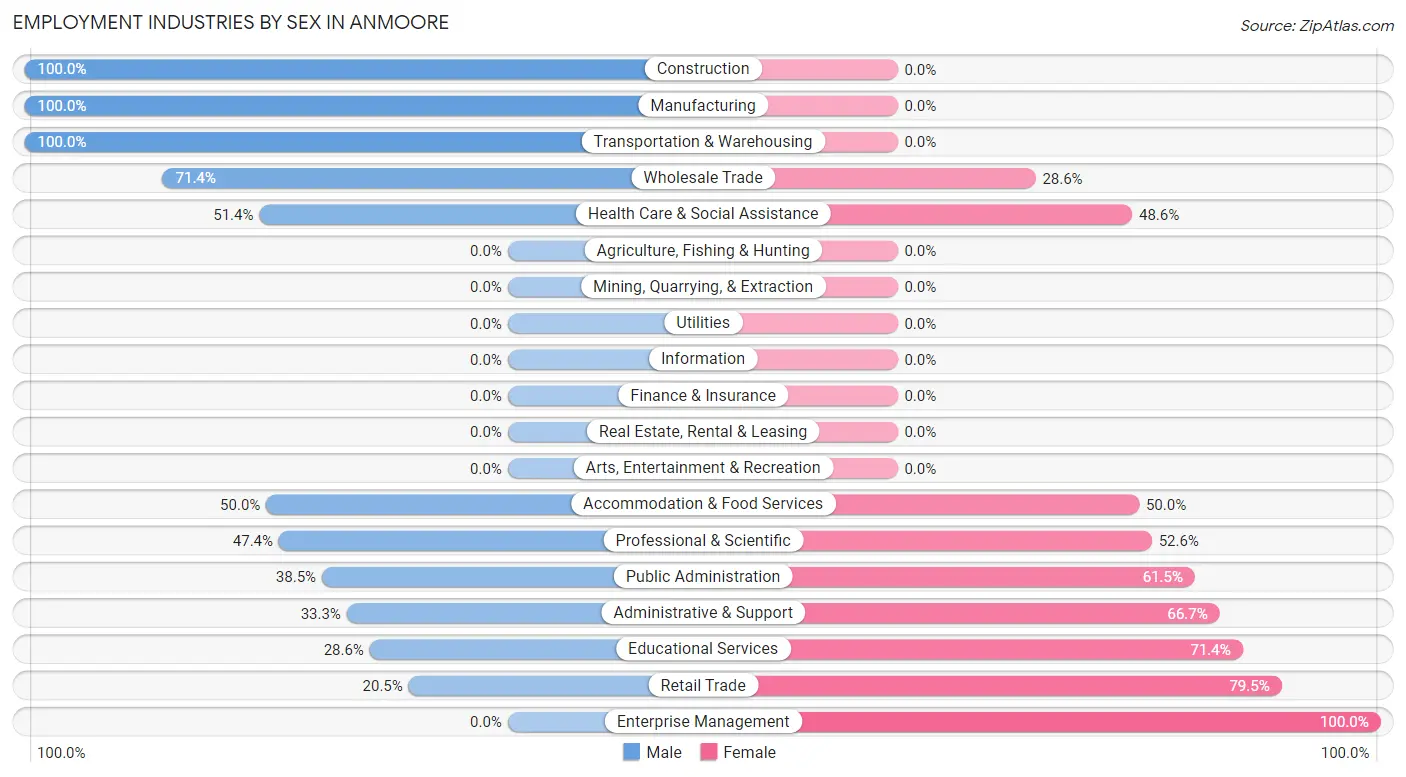
Employment Industries by Sex in Anmoore
The Anmoore industries that see more men than women are Construction (100.0%), Manufacturing (100.0%), and Transportation & Warehousing (100.0%), whereas the industries that tend to have a higher number of women are Enterprise Management (100.0%), Retail Trade (79.5%), and Educational Services (71.4%).
| Industry | Male | Female |
| Agriculture, Fishing & Hunting | 0 (0.0%) | 0 (0.0%) |
| Mining, Quarrying, & Extraction | 0 (0.0%) | 0 (0.0%) |
| Construction | 22 (100.0%) | 0 (0.0%) |
| Manufacturing | 13 (100.0%) | 0 (0.0%) |
| Wholesale Trade | 10 (71.4%) | 4 (28.6%) |
| Retail Trade | 8 (20.5%) | 31 (79.5%) |
| Transportation & Warehousing | 3 (100.0%) | 0 (0.0%) |
| Utilities | 0 (0.0%) | 0 (0.0%) |
| Information | 0 (0.0%) | 0 (0.0%) |
| Finance & Insurance | 0 (0.0%) | 0 (0.0%) |
| Real Estate, Rental & Leasing | 0 (0.0%) | 0 (0.0%) |
| Professional & Scientific | 9 (47.4%) | 10 (52.6%) |
| Enterprise Management | 0 (0.0%) | 2 (100.0%) |
| Administrative & Support | 2 (33.3%) | 4 (66.7%) |
| Educational Services | 6 (28.6%) | 15 (71.4%) |
| Health Care & Social Assistance | 18 (51.4%) | 17 (48.6%) |
| Arts, Entertainment & Recreation | 0 (0.0%) | 0 (0.0%) |
| Accommodation & Food Services | 4 (50.0%) | 4 (50.0%) |
| Public Administration | 10 (38.5%) | 16 (61.5%) |
| Total | 107 (49.3%) | 110 (50.7%) |
Education in Anmoore
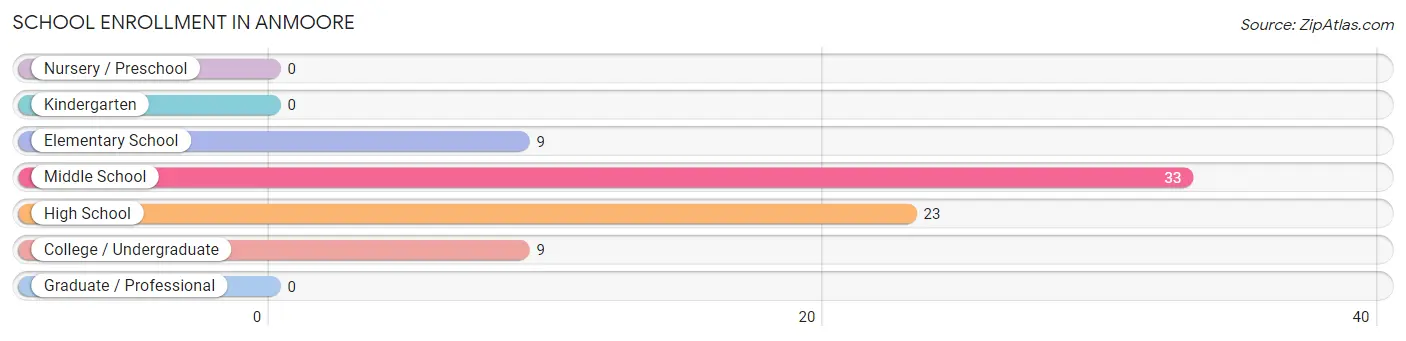
School Enrollment in Anmoore
The most common levels of schooling among the 74 students in Anmoore are middle school (33 | 44.6%), high school (23 | 31.1%), and elementary school (9 | 12.2%).
| School Level | # Students | % Students |
| Nursery / Preschool | 0 | 0.0% |
| Kindergarten | 0 | 0.0% |
| Elementary School | 9 | 12.2% |
| Middle School | 33 | 44.6% |
| High School | 23 | 31.1% |
| College / Undergraduate | 9 | 12.2% |
| Graduate / Professional | 0 | 0.0% |
| Total | 74 | 100.0% |
School Enrollment by Age by Funding Source in Anmoore
Out of a total of 74 students who are enrolled in schools in Anmoore, 5 (6.8%) attend a private institution, while the remaining 69 (93.2%) are enrolled in public schools. The age group of 10 to 14 year olds has the highest likelihood of being enrolled in private schools, with 5 (18.5% in the age bracket) enrolled. Conversely, the age group of 5 to 9 year old has the lowest likelihood of being enrolled in a private school, with 19 (100.0% in the age bracket) attending a public institution.
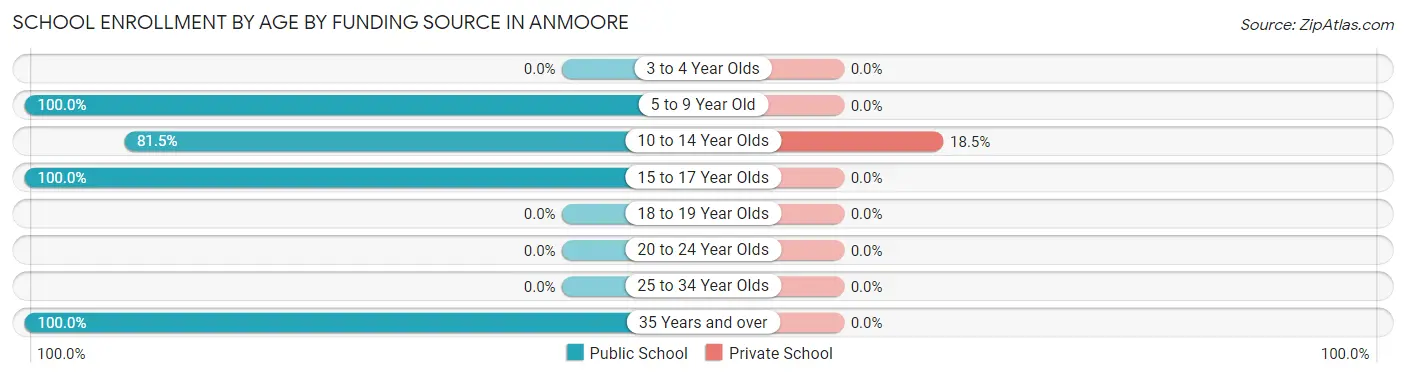
| Age Bracket | Public School | Private School |
| 3 to 4 Year Olds | 0 (0.0%) | 0 (0.0%) |
| 5 to 9 Year Old | 19 (100.0%) | 0 (0.0%) |
| 10 to 14 Year Olds | 22 (81.5%) | 5 (18.5%) |
| 15 to 17 Year Olds | 24 (100.0%) | 0 (0.0%) |
| 18 to 19 Year Olds | 0 (0.0%) | 0 (0.0%) |
| 20 to 24 Year Olds | 0 (0.0%) | 0 (0.0%) |
| 25 to 34 Year Olds | 0 (0.0%) | 0 (0.0%) |
| 35 Years and over | 4 (100.0%) | 0 (0.0%) |
| Total | 69 (93.2%) | 5 (6.8%) |
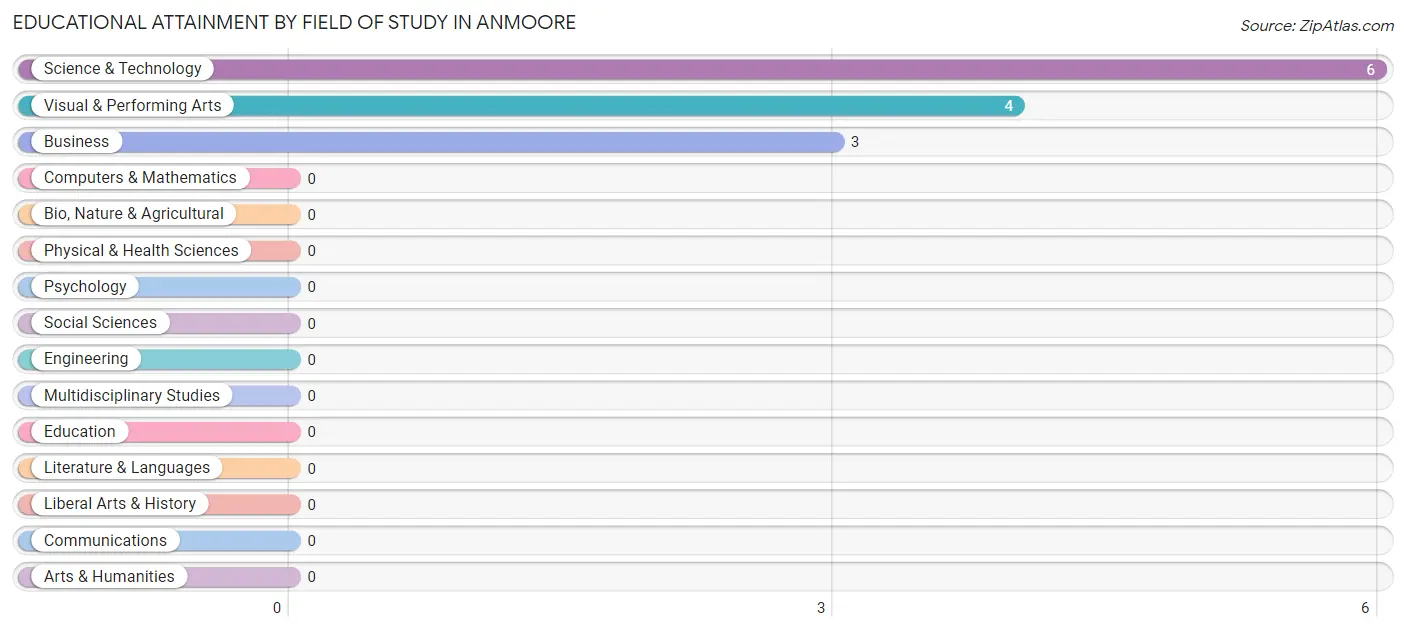
Educational Attainment by Field of Study in Anmoore
Science & technology (6 | 46.2%), visual & performing arts (4 | 30.8%), and business (3 | 23.1%) are the most common fields of study among 13 individuals in Anmoore who have obtained a bachelor's degree or higher.
| Field of Study | # Graduates | % Graduates |
| Computers & Mathematics | 0 | 0.0% |
| Bio, Nature & Agricultural | 0 | 0.0% |
| Physical & Health Sciences | 0 | 0.0% |
| Psychology | 0 | 0.0% |
| Social Sciences | 0 | 0.0% |
| Engineering | 0 | 0.0% |
| Multidisciplinary Studies | 0 | 0.0% |
| Science & Technology | 6 | 46.2% |
| Business | 3 | 23.1% |
| Education | 0 | 0.0% |
| Literature & Languages | 0 | 0.0% |
| Liberal Arts & History | 0 | 0.0% |
| Visual & Performing Arts | 4 | 30.8% |
| Communications | 0 | 0.0% |
| Arts & Humanities | 0 | 0.0% |
| Total | 13 | 100.0% |
Transportation & Commute in Anmoore
Vehicle Availability by Sex in Anmoore
The most prevalent vehicle ownership categories in Anmoore are males with 1 vehicle (40, accounting for 38.1%) and females with 1 vehicle (42, making up 36.4%).
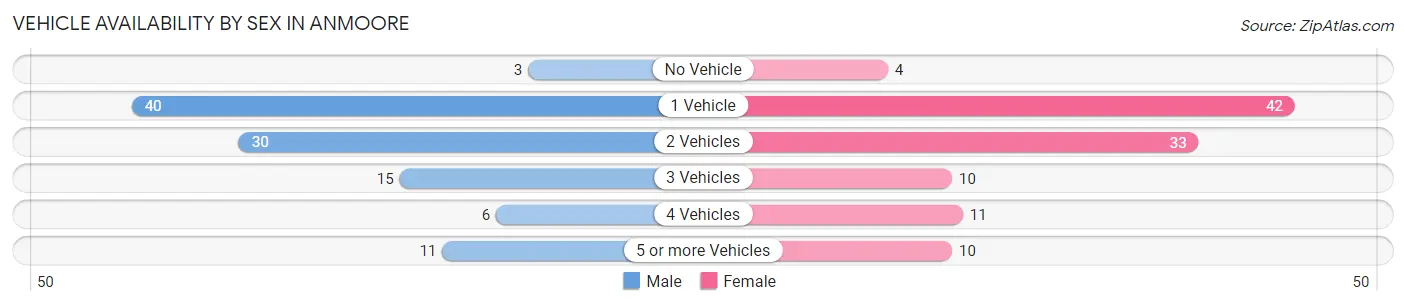
| Vehicles Available | Male | Female |
| No Vehicle | 3 (2.9%) | 4 (3.6%) |
| 1 Vehicle | 40 (38.1%) | 42 (38.2%) |
| 2 Vehicles | 30 (28.6%) | 33 (30.0%) |
| 3 Vehicles | 15 (14.3%) | 10 (9.1%) |
| 4 Vehicles | 6 (5.7%) | 11 (10.0%) |
| 5 or more Vehicles | 11 (10.5%) | 10 (9.1%) |
| Total | 105 (100.0%) | 110 (100.0%) |
Commute Time in Anmoore
The most frequently occuring commute durations in Anmoore are 15 to 19 minutes (76 commuters, 41.5%), 10 to 14 minutes (56 commuters, 30.6%), and 5 to 9 minutes (16 commuters, 8.7%).
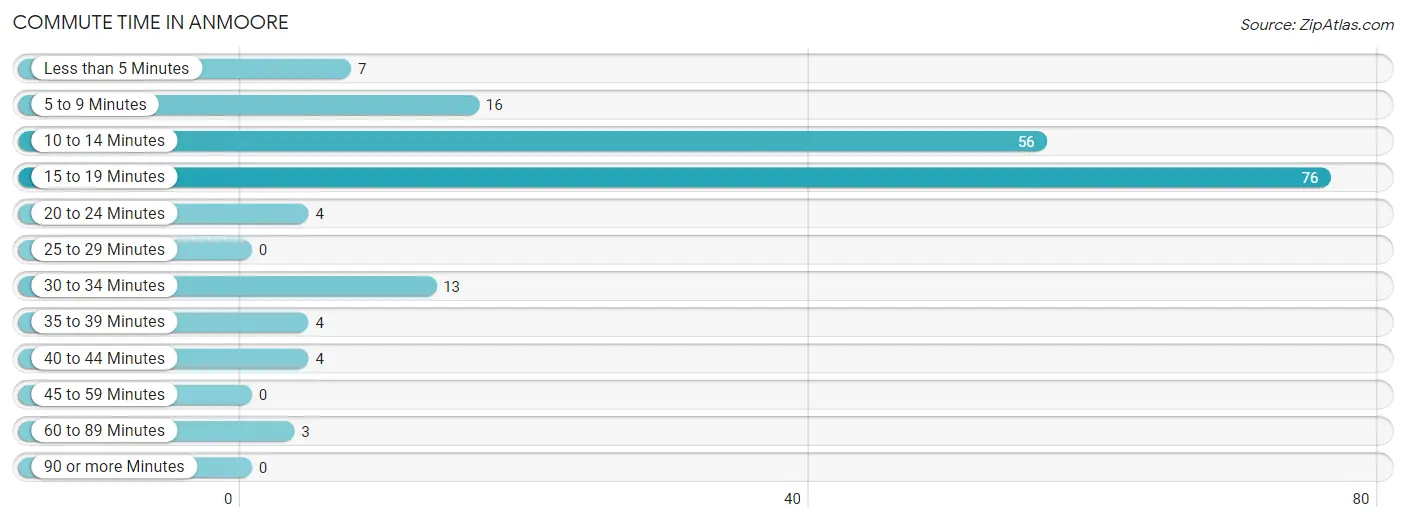
| Commute Time | # Commuters | % Commuters |
| Less than 5 Minutes | 7 | 3.8% |
| 5 to 9 Minutes | 16 | 8.7% |
| 10 to 14 Minutes | 56 | 30.6% |
| 15 to 19 Minutes | 76 | 41.5% |
| 20 to 24 Minutes | 4 | 2.2% |
| 25 to 29 Minutes | 0 | 0.0% |
| 30 to 34 Minutes | 13 | 7.1% |
| 35 to 39 Minutes | 4 | 2.2% |
| 40 to 44 Minutes | 4 | 2.2% |
| 45 to 59 Minutes | 0 | 0.0% |
| 60 to 89 Minutes | 3 | 1.6% |
| 90 or more Minutes | 0 | 0.0% |
Commute Time by Sex in Anmoore
The most common commute times in Anmoore are 10 to 14 minutes (35 commuters, 35.0%) for males and 15 to 19 minutes (47 commuters, 56.6%) for females.
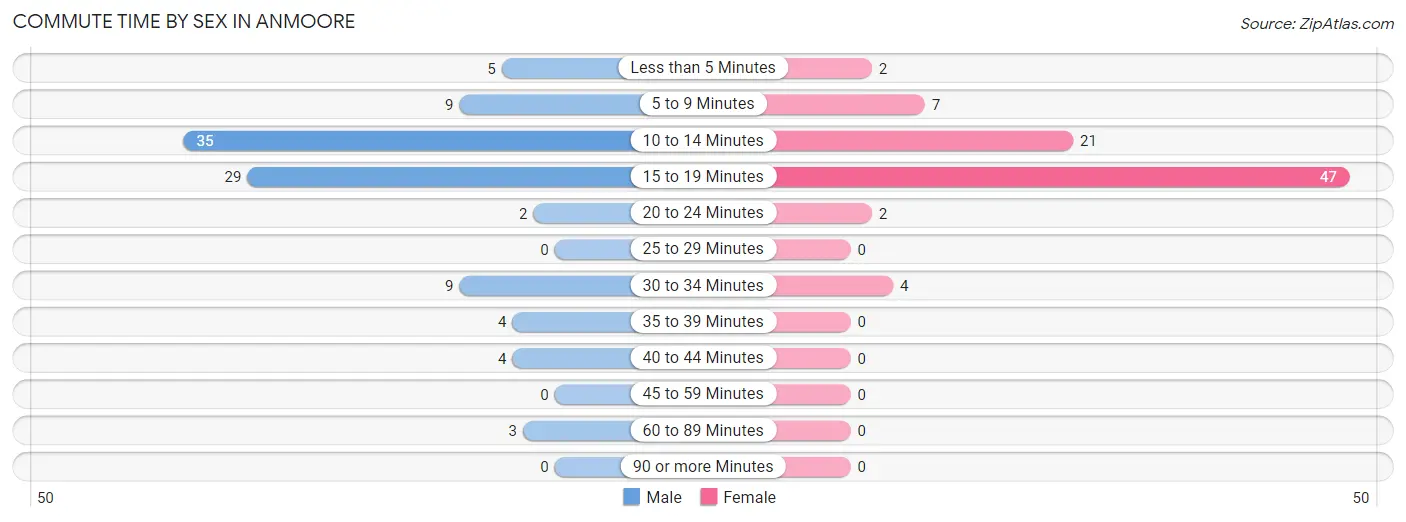
| Commute Time | Male | Female |
| Less than 5 Minutes | 5 (5.0%) | 2 (2.4%) |
| 5 to 9 Minutes | 9 (9.0%) | 7 (8.4%) |
| 10 to 14 Minutes | 35 (35.0%) | 21 (25.3%) |
| 15 to 19 Minutes | 29 (29.0%) | 47 (56.6%) |
| 20 to 24 Minutes | 2 (2.0%) | 2 (2.4%) |
| 25 to 29 Minutes | 0 (0.0%) | 0 (0.0%) |
| 30 to 34 Minutes | 9 (9.0%) | 4 (4.8%) |
| 35 to 39 Minutes | 4 (4.0%) | 0 (0.0%) |
| 40 to 44 Minutes | 4 (4.0%) | 0 (0.0%) |
| 45 to 59 Minutes | 0 (0.0%) | 0 (0.0%) |
| 60 to 89 Minutes | 3 (3.0%) | 0 (0.0%) |
| 90 or more Minutes | 0 (0.0%) | 0 (0.0%) |
Time of Departure to Work by Sex in Anmoore
The most frequent times of departure to work in Anmoore are 6:30 AM to 6:59 AM (40, 40.0%) for males and 7:00 AM to 7:29 AM (21, 25.3%) for females.
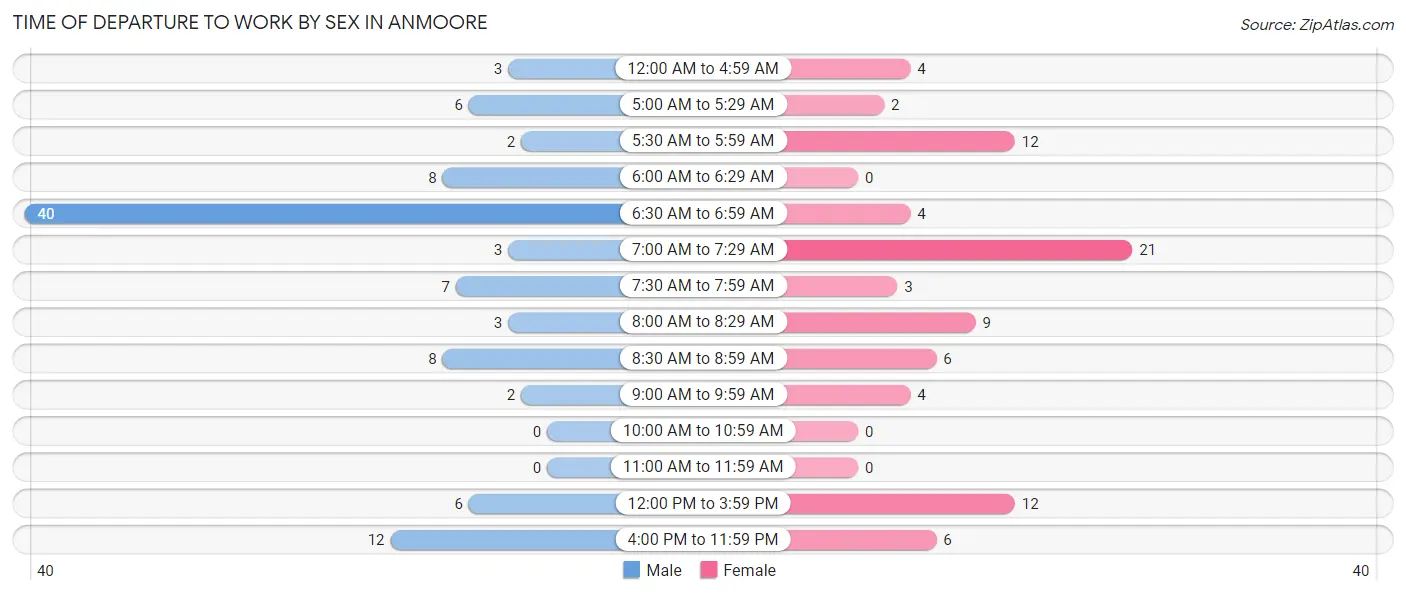
| Time of Departure | Male | Female |
| 12:00 AM to 4:59 AM | 3 (3.0%) | 4 (4.8%) |
| 5:00 AM to 5:29 AM | 6 (6.0%) | 2 (2.4%) |
| 5:30 AM to 5:59 AM | 2 (2.0%) | 12 (14.5%) |
| 6:00 AM to 6:29 AM | 8 (8.0%) | 0 (0.0%) |
| 6:30 AM to 6:59 AM | 40 (40.0%) | 4 (4.8%) |
| 7:00 AM to 7:29 AM | 3 (3.0%) | 21 (25.3%) |
| 7:30 AM to 7:59 AM | 7 (7.0%) | 3 (3.6%) |
| 8:00 AM to 8:29 AM | 3 (3.0%) | 9 (10.8%) |
| 8:30 AM to 8:59 AM | 8 (8.0%) | 6 (7.2%) |
| 9:00 AM to 9:59 AM | 2 (2.0%) | 4 (4.8%) |
| 10:00 AM to 10:59 AM | 0 (0.0%) | 0 (0.0%) |
| 11:00 AM to 11:59 AM | 0 (0.0%) | 0 (0.0%) |
| 12:00 PM to 3:59 PM | 6 (6.0%) | 12 (14.5%) |
| 4:00 PM to 11:59 PM | 12 (12.0%) | 6 (7.2%) |
| Total | 100 (100.0%) | 83 (100.0%) |
Housing Occupancy in Anmoore
Occupancy by Ownership in Anmoore
Of the total 300 dwellings in Anmoore, owner-occupied units account for 142 (47.3%), while renter-occupied units make up 158 (52.7%).
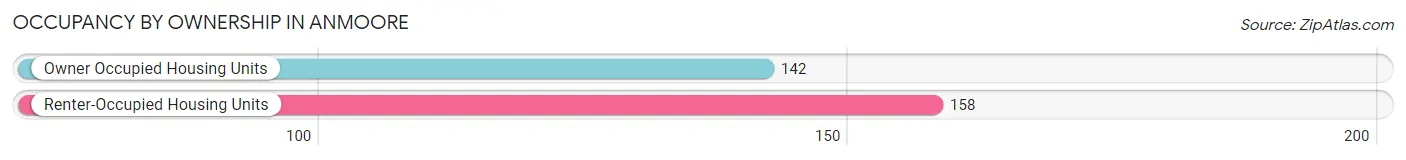
| Occupancy | # Housing Units | % Housing Units |
| Owner Occupied Housing Units | 142 | 47.3% |
| Renter-Occupied Housing Units | 158 | 52.7% |
| Total Occupied Housing Units | 300 | 100.0% |
Occupancy by Household Size in Anmoore
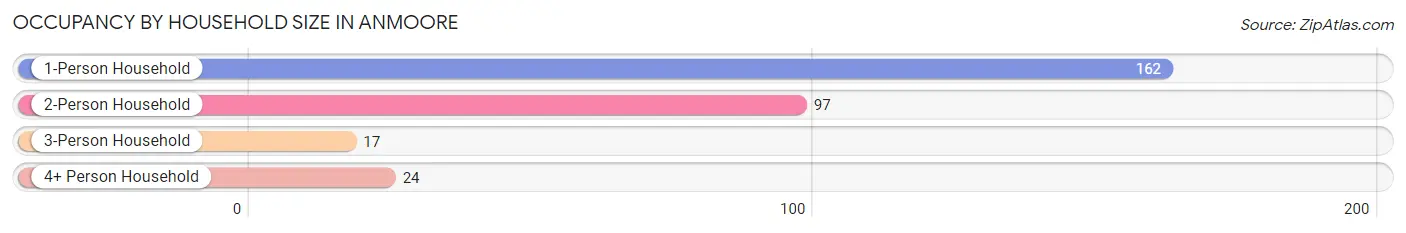
| Household Size | # Housing Units | % Housing Units |
| 1-Person Household | 162 | 54.0% |
| 2-Person Household | 97 | 32.3% |
| 3-Person Household | 17 | 5.7% |
| 4+ Person Household | 24 | 8.0% |
| Total Housing Units | 300 | 100.0% |
Occupancy by Ownership by Household Size in Anmoore
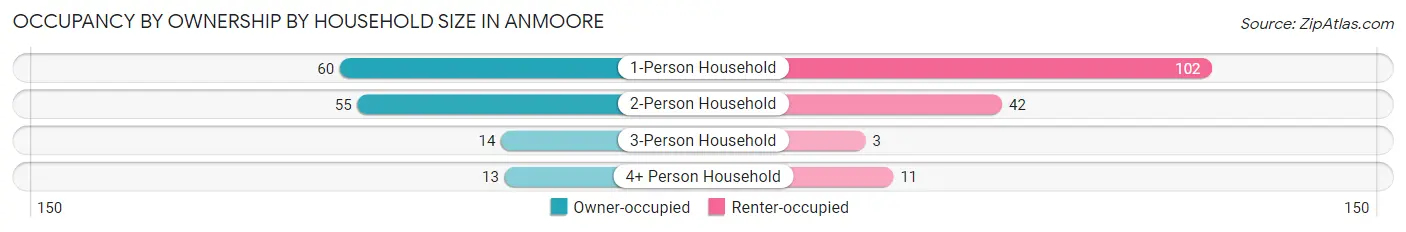
| Household Size | Owner-occupied | Renter-occupied |
| 1-Person Household | 60 (37.0%) | 102 (63.0%) |
| 2-Person Household | 55 (56.7%) | 42 (43.3%) |
| 3-Person Household | 14 (82.4%) | 3 (17.6%) |
| 4+ Person Household | 13 (54.2%) | 11 (45.8%) |
| Total Housing Units | 142 (47.3%) | 158 (52.7%) |
Occupancy by Educational Attainment in Anmoore
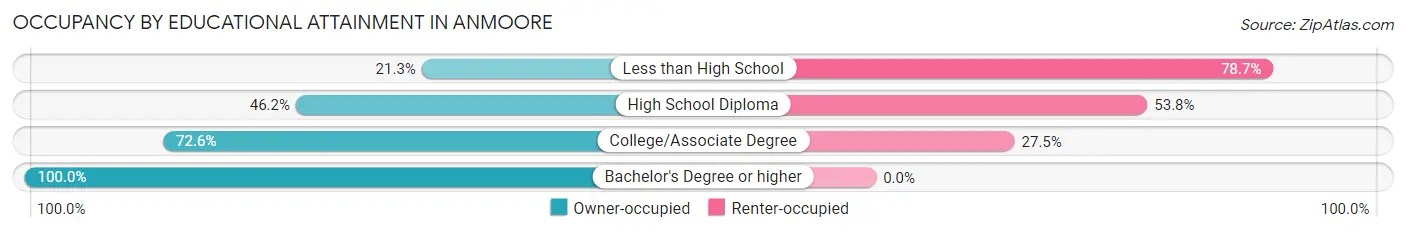
| Household Size | Owner-occupied | Renter-occupied |
| Less than High School | 10 (21.3%) | 37 (78.7%) |
| High School Diploma | 92 (46.2%) | 107 (53.8%) |
| College/Associate Degree | 37 (72.6%) | 14 (27.5%) |
| Bachelor's Degree or higher | 3 (100.0%) | 0 (0.0%) |
Occupancy by Age of Householder in Anmoore
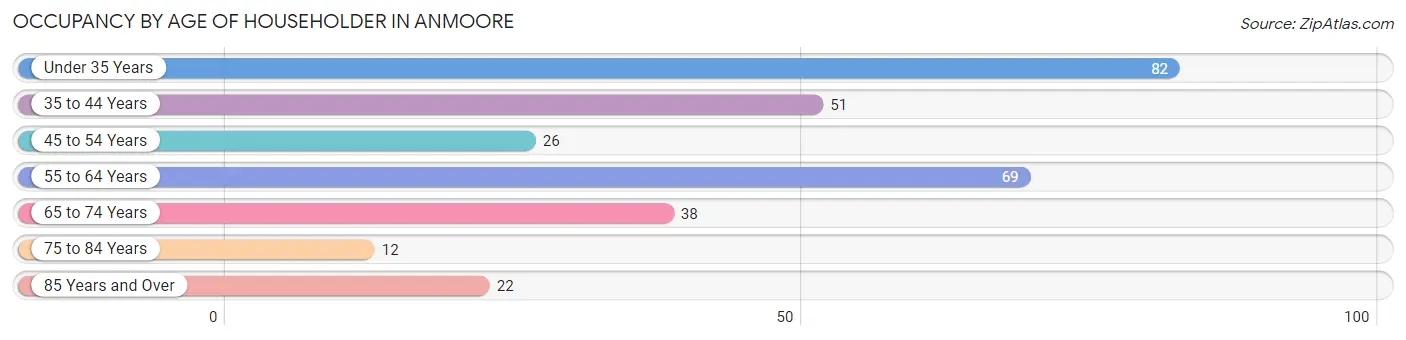
| Age Bracket | # Households | % Households |
| Under 35 Years | 82 | 27.3% |
| 35 to 44 Years | 51 | 17.0% |
| 45 to 54 Years | 26 | 8.7% |
| 55 to 64 Years | 69 | 23.0% |
| 65 to 74 Years | 38 | 12.7% |
| 75 to 84 Years | 12 | 4.0% |
| 85 Years and Over | 22 | 7.3% |
| Total | 300 | 100.0% |
Housing Finances in Anmoore
Median Income by Occupancy in Anmoore
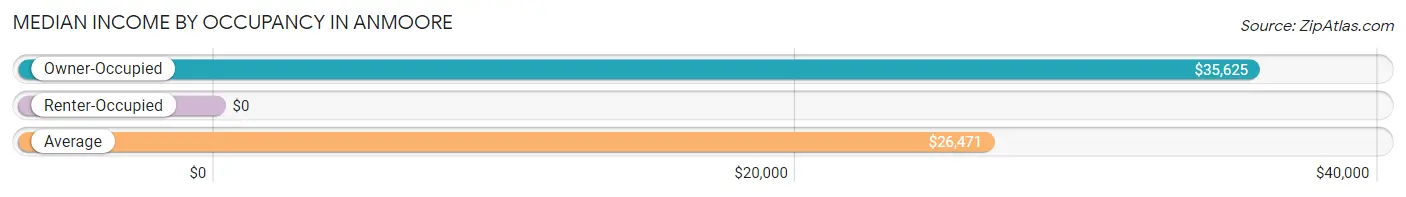
| Occupancy Type | # Households | Median Income |
| Owner-Occupied | 142 (47.3%) | $35,625 |
| Renter-Occupied | 158 (52.7%) | $0 |
| Average | 300 (100.0%) | $26,471 |
Occupancy by Householder Income Bracket in Anmoore
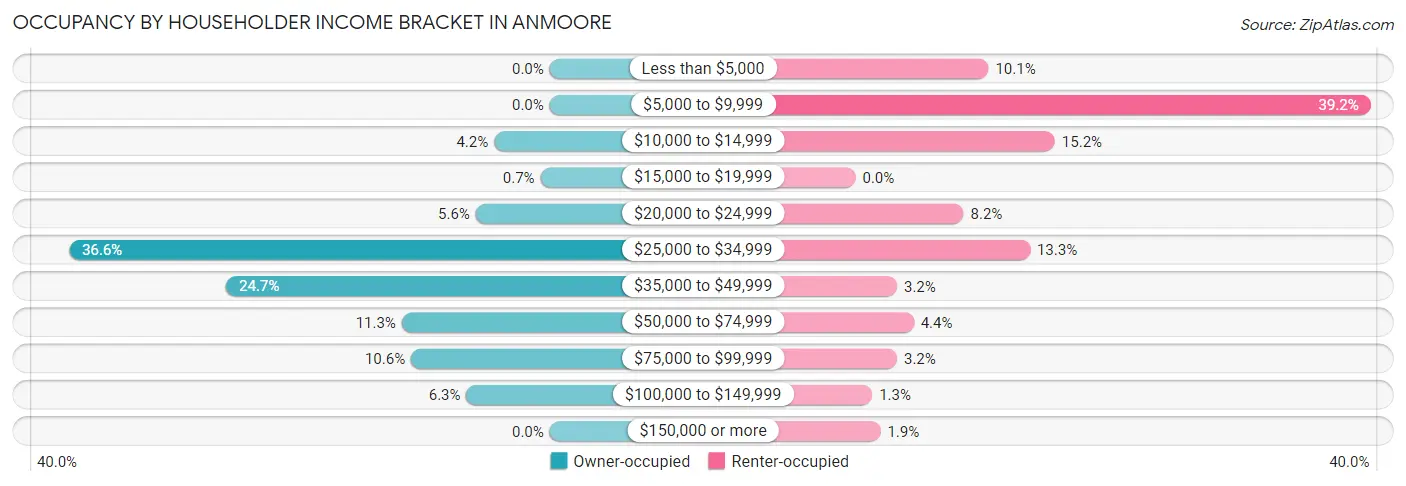
| Income Bracket | Owner-occupied | Renter-occupied |
| Less than $5,000 | 0 (0.0%) | 16 (10.1%) |
| $5,000 to $9,999 | 0 (0.0%) | 62 (39.2%) |
| $10,000 to $14,999 | 6 (4.2%) | 24 (15.2%) |
| $15,000 to $19,999 | 1 (0.7%) | 0 (0.0%) |
| $20,000 to $24,999 | 8 (5.6%) | 13 (8.2%) |
| $25,000 to $34,999 | 52 (36.6%) | 21 (13.3%) |
| $35,000 to $49,999 | 35 (24.6%) | 5 (3.2%) |
| $50,000 to $74,999 | 16 (11.3%) | 7 (4.4%) |
| $75,000 to $99,999 | 15 (10.6%) | 5 (3.2%) |
| $100,000 to $149,999 | 9 (6.3%) | 2 (1.3%) |
| $150,000 or more | 0 (0.0%) | 3 (1.9%) |
| Total | 142 (100.0%) | 158 (100.0%) |
Monthly Housing Cost Tiers in Anmoore
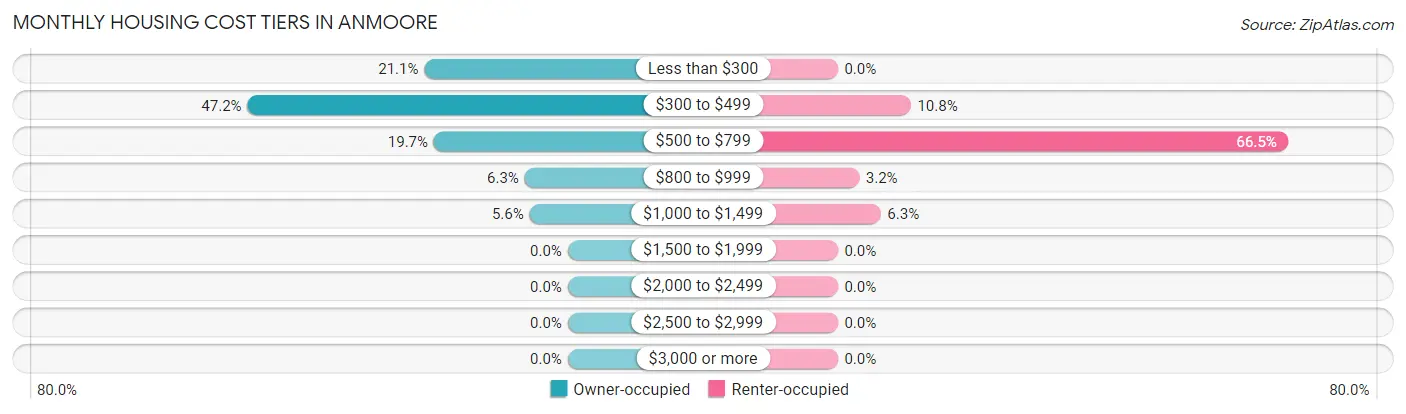
| Monthly Cost | Owner-occupied | Renter-occupied |
| Less than $300 | 30 (21.1%) | 0 (0.0%) |
| $300 to $499 | 67 (47.2%) | 17 (10.8%) |
| $500 to $799 | 28 (19.7%) | 105 (66.5%) |
| $800 to $999 | 9 (6.3%) | 5 (3.2%) |
| $1,000 to $1,499 | 8 (5.6%) | 10 (6.3%) |
| $1,500 to $1,999 | 0 (0.0%) | 0 (0.0%) |
| $2,000 to $2,499 | 0 (0.0%) | 0 (0.0%) |
| $2,500 to $2,999 | 0 (0.0%) | 0 (0.0%) |
| $3,000 or more | 0 (0.0%) | 0 (0.0%) |
| Total | 142 (100.0%) | 158 (100.0%) |
Physical Housing Characteristics in Anmoore
Housing Structures in Anmoore
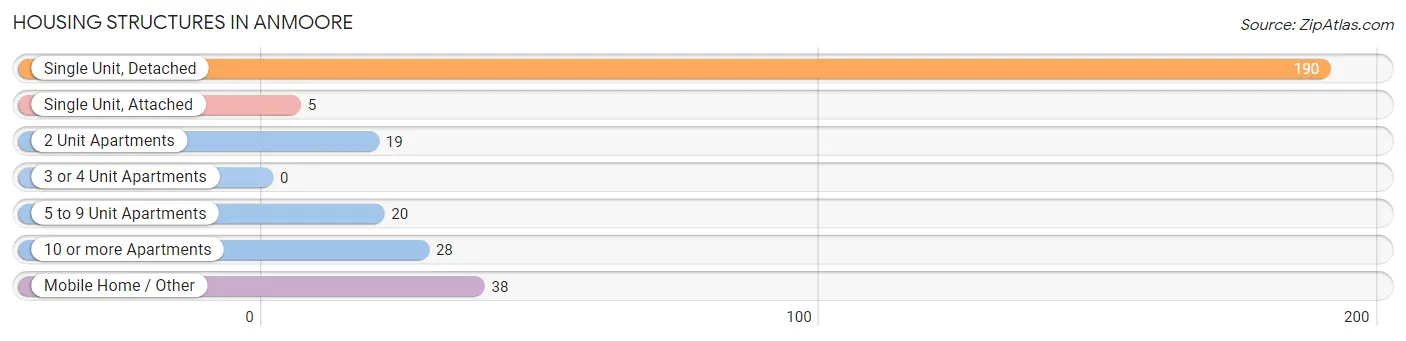
| Structure Type | # Housing Units | % Housing Units |
| Single Unit, Detached | 190 | 63.3% |
| Single Unit, Attached | 5 | 1.7% |
| 2 Unit Apartments | 19 | 6.3% |
| 3 or 4 Unit Apartments | 0 | 0.0% |
| 5 to 9 Unit Apartments | 20 | 6.7% |
| 10 or more Apartments | 28 | 9.3% |
| Mobile Home / Other | 38 | 12.7% |
| Total | 300 | 100.0% |
Housing Structures by Occupancy in Anmoore
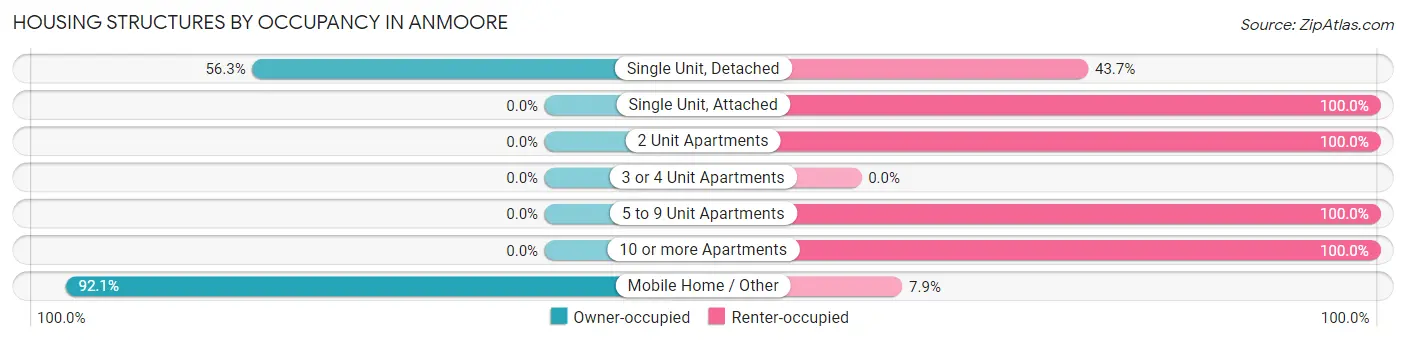
| Structure Type | Owner-occupied | Renter-occupied |
| Single Unit, Detached | 107 (56.3%) | 83 (43.7%) |
| Single Unit, Attached | 0 (0.0%) | 5 (100.0%) |
| 2 Unit Apartments | 0 (0.0%) | 19 (100.0%) |
| 3 or 4 Unit Apartments | 0 (0.0%) | 0 (0.0%) |
| 5 to 9 Unit Apartments | 0 (0.0%) | 20 (100.0%) |
| 10 or more Apartments | 0 (0.0%) | 28 (100.0%) |
| Mobile Home / Other | 35 (92.1%) | 3 (7.9%) |
| Total | 142 (47.3%) | 158 (52.7%) |
Housing Structures by Number of Rooms in Anmoore
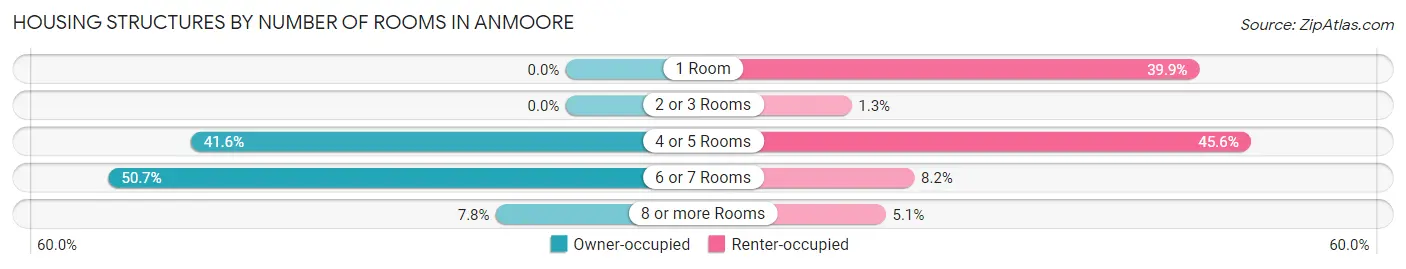
| Number of Rooms | Owner-occupied | Renter-occupied |
| 1 Room | 0 (0.0%) | 63 (39.9%) |
| 2 or 3 Rooms | 0 (0.0%) | 2 (1.3%) |
| 4 or 5 Rooms | 59 (41.5%) | 72 (45.6%) |
| 6 or 7 Rooms | 72 (50.7%) | 13 (8.2%) |
| 8 or more Rooms | 11 (7.7%) | 8 (5.1%) |
| Total | 142 (100.0%) | 158 (100.0%) |
Housing Structure by Heating Type in Anmoore
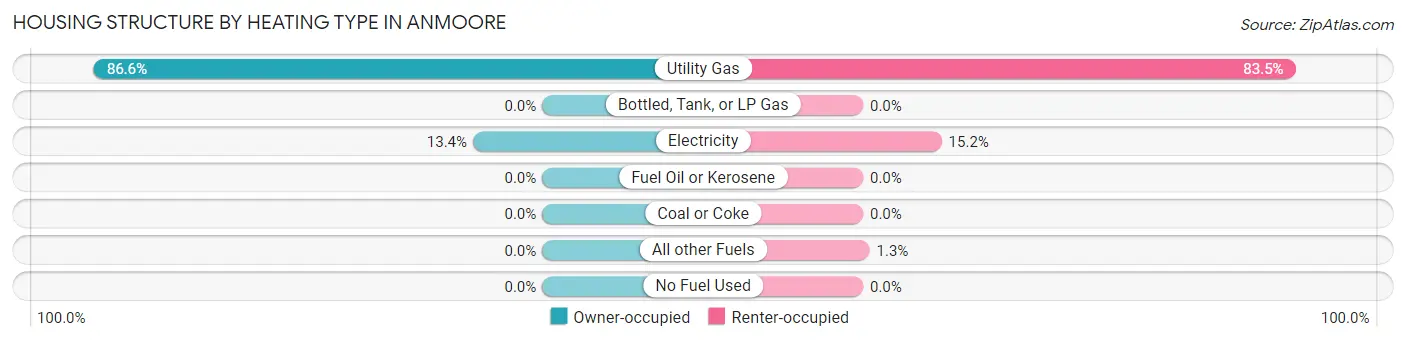
| Heating Type | Owner-occupied | Renter-occupied |
| Utility Gas | 123 (86.6%) | 132 (83.5%) |
| Bottled, Tank, or LP Gas | 0 (0.0%) | 0 (0.0%) |
| Electricity | 19 (13.4%) | 24 (15.2%) |
| Fuel Oil or Kerosene | 0 (0.0%) | 0 (0.0%) |
| Coal or Coke | 0 (0.0%) | 0 (0.0%) |
| All other Fuels | 0 (0.0%) | 2 (1.3%) |
| No Fuel Used | 0 (0.0%) | 0 (0.0%) |
| Total | 142 (100.0%) | 158 (100.0%) |
Household Vehicle Usage in Anmoore
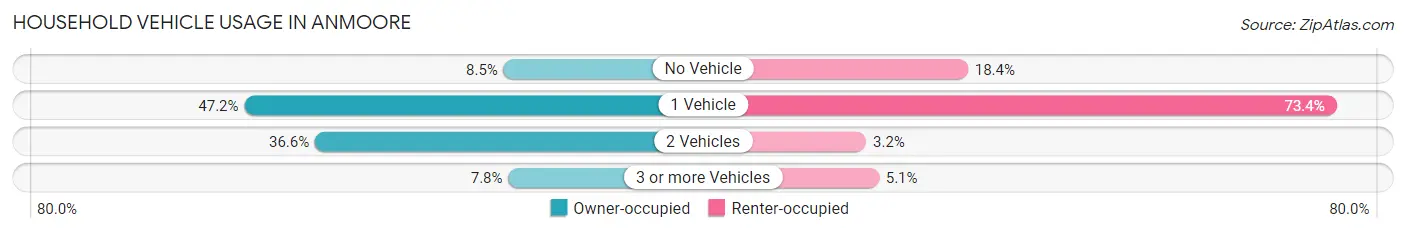
| Vehicles per Household | Owner-occupied | Renter-occupied |
| No Vehicle | 12 (8.5%) | 29 (18.3%) |
| 1 Vehicle | 67 (47.2%) | 116 (73.4%) |
| 2 Vehicles | 52 (36.6%) | 5 (3.2%) |
| 3 or more Vehicles | 11 (7.7%) | 8 (5.1%) |
| Total | 142 (100.0%) | 158 (100.0%) |
Real Estate & Mortgages in Anmoore
Real Estate and Mortgage Overview in Anmoore
| Characteristic | Without Mortgage | With Mortgage |
| Housing Units | 98 | 44 |
| Median Property Value | $91,300 | $72,900 |
| Median Household Income | $35,625 | $0 |
| Monthly Housing Costs | $357 | $0 |
| Real Estate Taxes | $446 | $2 |
Property Value by Mortgage Status in Anmoore
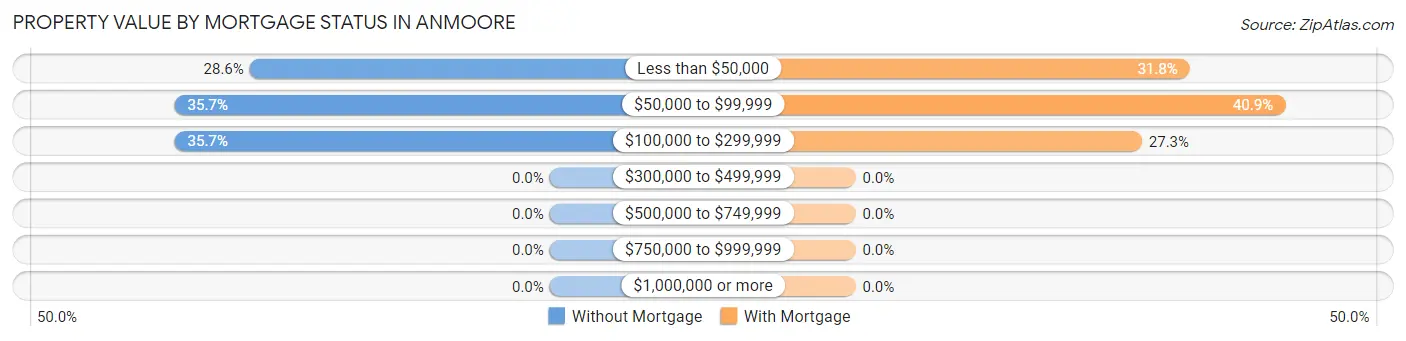
| Property Value | Without Mortgage | With Mortgage |
| Less than $50,000 | 28 (28.6%) | 14 (31.8%) |
| $50,000 to $99,999 | 35 (35.7%) | 18 (40.9%) |
| $100,000 to $299,999 | 35 (35.7%) | 12 (27.3%) |
| $300,000 to $499,999 | 0 (0.0%) | 0 (0.0%) |
| $500,000 to $749,999 | 0 (0.0%) | 0 (0.0%) |
| $750,000 to $999,999 | 0 (0.0%) | 0 (0.0%) |
| $1,000,000 or more | 0 (0.0%) | 0 (0.0%) |
| Total | 98 (100.0%) | 44 (100.0%) |
Household Income by Mortgage Status in Anmoore
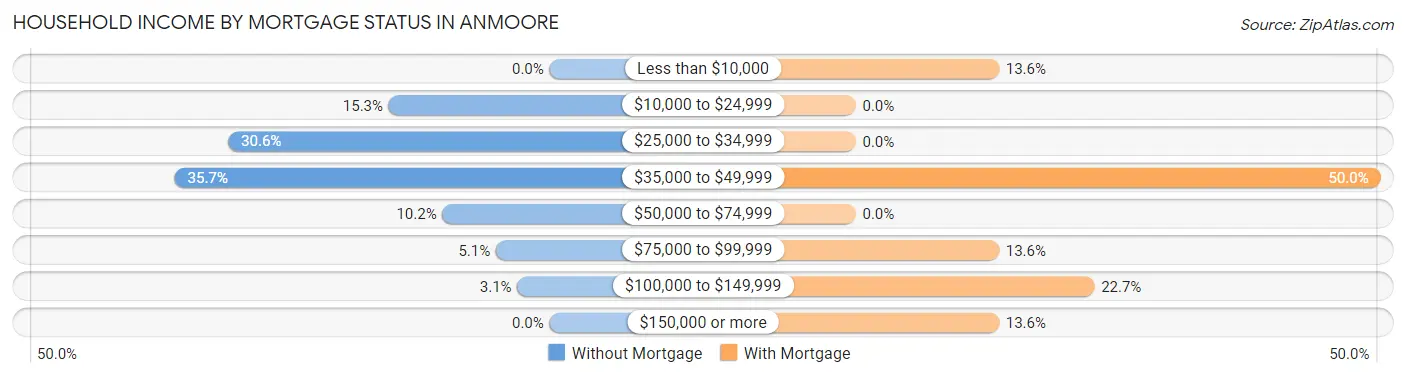
| Household Income | Without Mortgage | With Mortgage |
| Less than $10,000 | 0 (0.0%) | 6 (13.6%) |
| $10,000 to $24,999 | 15 (15.3%) | 0 (0.0%) |
| $25,000 to $34,999 | 30 (30.6%) | 0 (0.0%) |
| $35,000 to $49,999 | 35 (35.7%) | 22 (50.0%) |
| $50,000 to $74,999 | 10 (10.2%) | 0 (0.0%) |
| $75,000 to $99,999 | 5 (5.1%) | 6 (13.6%) |
| $100,000 to $149,999 | 3 (3.1%) | 10 (22.7%) |
| $150,000 or more | 0 (0.0%) | 6 (13.6%) |
| Total | 98 (100.0%) | 44 (100.0%) |
Property Value to Household Income Ratio in Anmoore
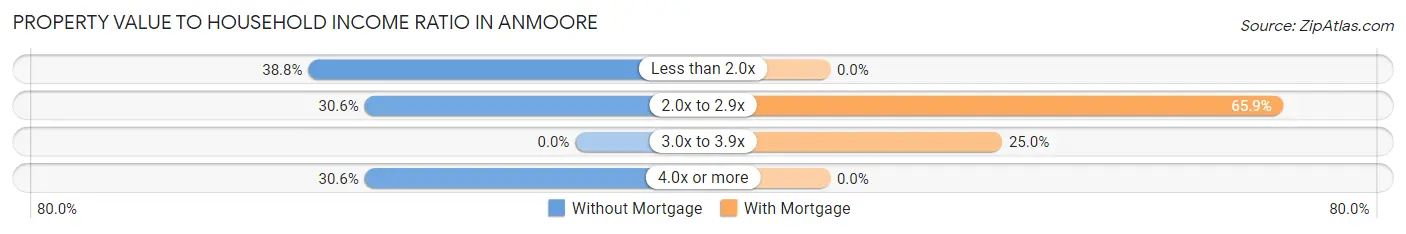
| Value-to-Income Ratio | Without Mortgage | With Mortgage |
| Less than 2.0x | 38 (38.8%) | 0 (0.0%) |
| 2.0x to 2.9x | 30 (30.6%) | 29 (65.9%) |
| 3.0x to 3.9x | 0 (0.0%) | 11 (25.0%) |
| 4.0x or more | 30 (30.6%) | 0 (0.0%) |
| Total | 98 (100.0%) | 44 (100.0%) |
Real Estate Taxes by Mortgage Status in Anmoore
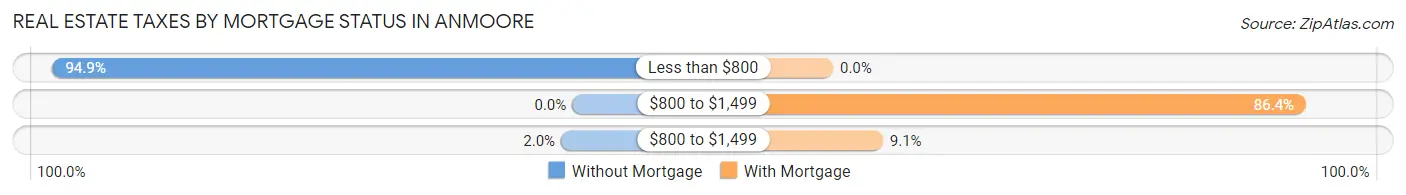
| Property Taxes | Without Mortgage | With Mortgage |
| Less than $800 | 93 (94.9%) | 0 (0.0%) |
| $800 to $1,499 | 0 (0.0%) | 38 (86.4%) |
| $800 to $1,499 | 2 (2.0%) | 4 (9.1%) |
| Total | 98 (100.0%) | 44 (100.0%) |
Health & Disability in Anmoore
Health Insurance Coverage by Age in Anmoore
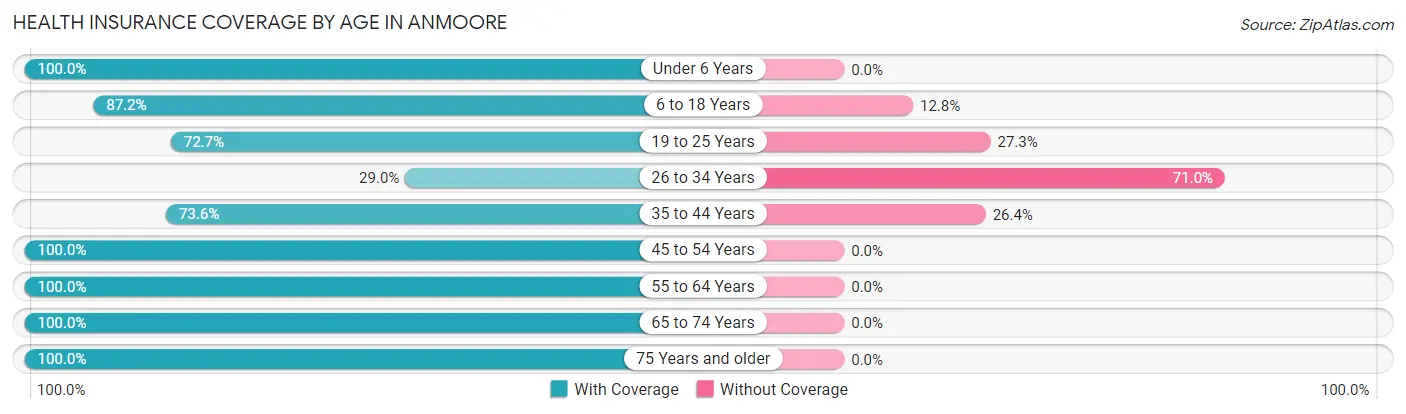
| Age Bracket | With Coverage | Without Coverage |
| Under 6 Years | 11 (100.0%) | 0 (0.0%) |
| 6 to 18 Years | 68 (87.2%) | 10 (12.8%) |
| 19 to 25 Years | 24 (72.7%) | 9 (27.3%) |
| 26 to 34 Years | 27 (29.0%) | 66 (71.0%) |
| 35 to 44 Years | 67 (73.6%) | 24 (26.4%) |
| 45 to 54 Years | 82 (100.0%) | 0 (0.0%) |
| 55 to 64 Years | 75 (100.0%) | 0 (0.0%) |
| 65 to 74 Years | 62 (100.0%) | 0 (0.0%) |
| 75 Years and older | 37 (100.0%) | 0 (0.0%) |
| Total | 453 (80.6%) | 109 (19.4%) |
Health Insurance Coverage by Citizenship Status in Anmoore
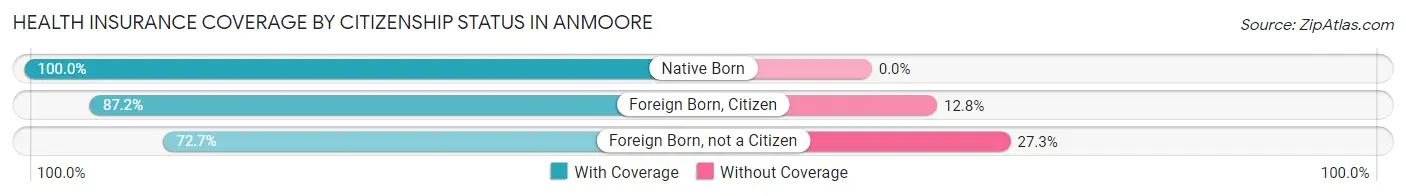
| Citizenship Status | With Coverage | Without Coverage |
| Native Born | 11 (100.0%) | 0 (0.0%) |
| Foreign Born, Citizen | 68 (87.2%) | 10 (12.8%) |
| Foreign Born, not a Citizen | 24 (72.7%) | 9 (27.3%) |
Health Insurance Coverage by Household Income in Anmoore
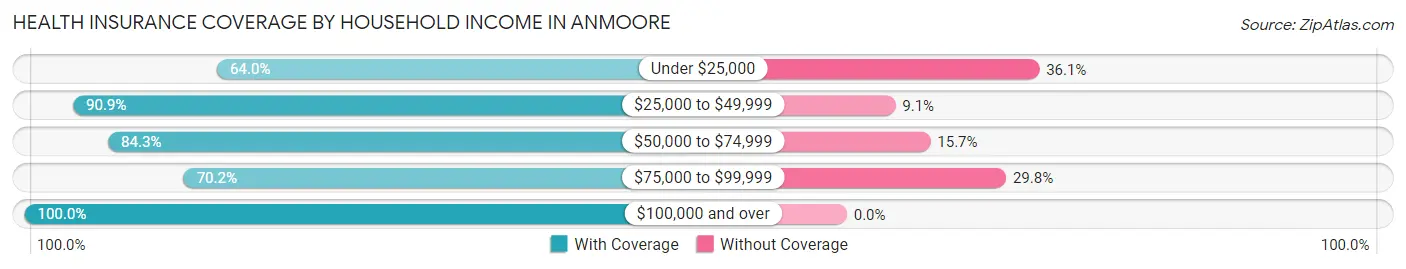
| Household Income | With Coverage | Without Coverage |
| Under $25,000 | 110 (63.9%) | 62 (36.0%) |
| $25,000 to $49,999 | 170 (90.9%) | 17 (9.1%) |
| $50,000 to $74,999 | 70 (84.3%) | 13 (15.7%) |
| $75,000 to $99,999 | 40 (70.2%) | 17 (29.8%) |
| $100,000 and over | 63 (100.0%) | 0 (0.0%) |
Public vs Private Health Insurance Coverage by Age in Anmoore
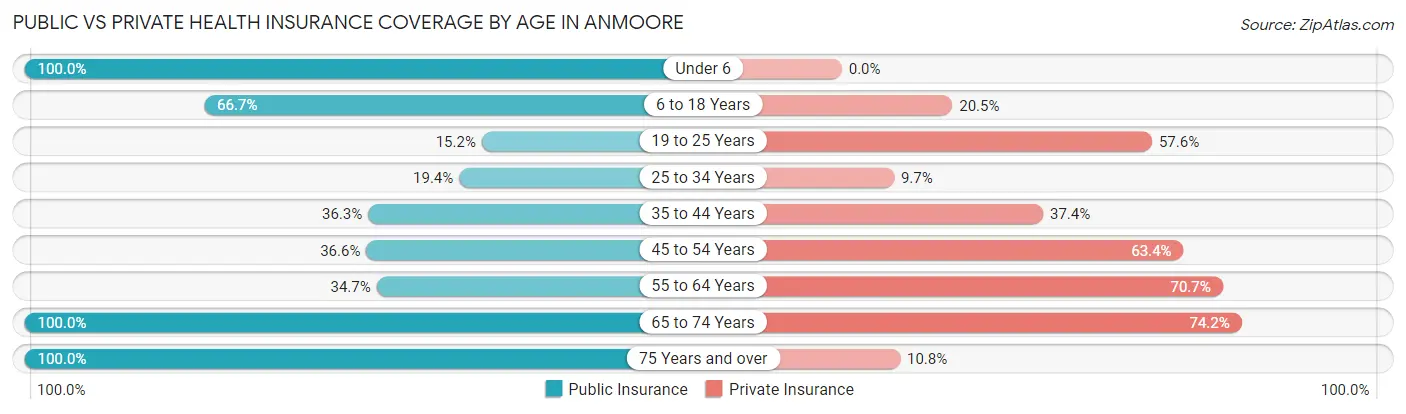
| Age Bracket | Public Insurance | Private Insurance |
| Under 6 | 11 (100.0%) | 0 (0.0%) |
| 6 to 18 Years | 52 (66.7%) | 16 (20.5%) |
| 19 to 25 Years | 5 (15.1%) | 19 (57.6%) |
| 25 to 34 Years | 18 (19.4%) | 9 (9.7%) |
| 35 to 44 Years | 33 (36.3%) | 34 (37.4%) |
| 45 to 54 Years | 30 (36.6%) | 52 (63.4%) |
| 55 to 64 Years | 26 (34.7%) | 53 (70.7%) |
| 65 to 74 Years | 62 (100.0%) | 46 (74.2%) |
| 75 Years and over | 37 (100.0%) | 4 (10.8%) |
| Total | 274 (48.7%) | 233 (41.5%) |
Disability Status by Sex by Age in Anmoore
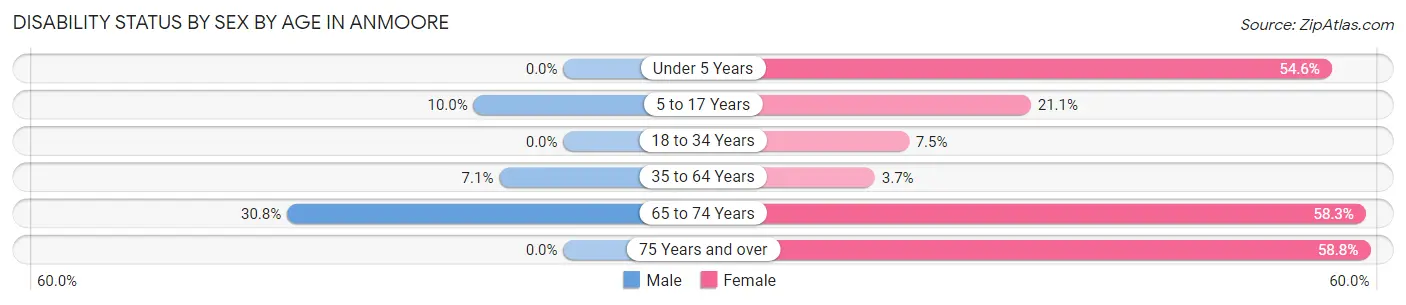
| Age Bracket | Male | Female |
| Under 5 Years | 0 (0.0%) | 6 (54.5%) |
| 5 to 17 Years | 4 (10.0%) | 8 (21.0%) |
| 18 to 34 Years | 0 (0.0%) | 7 (7.4%) |
| 35 to 64 Years | 8 (7.1%) | 5 (3.7%) |
| 65 to 74 Years | 8 (30.8%) | 21 (58.3%) |
| 75 Years and over | 0 (0.0%) | 20 (58.8%) |
Disability Class by Sex by Age in Anmoore
Disability Class: Hearing Difficulty
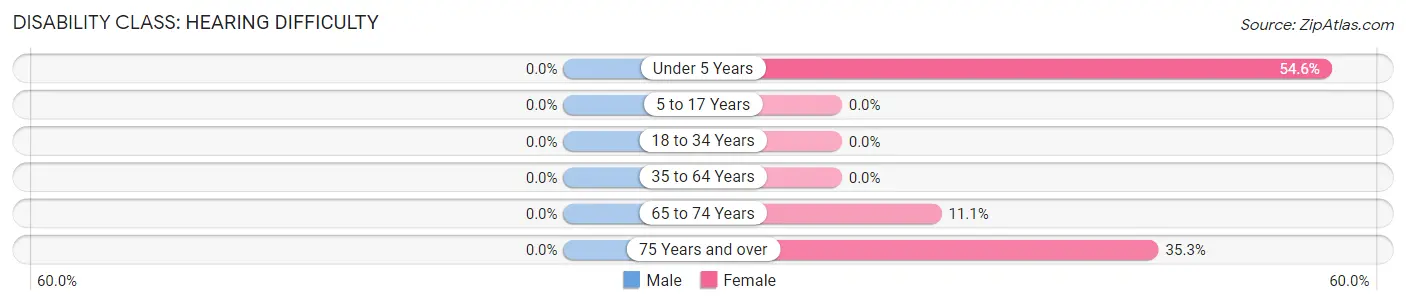
| Age Bracket | Male | Female |
| Under 5 Years | 0 (0.0%) | 6 (54.5%) |
| 5 to 17 Years | 0 (0.0%) | 0 (0.0%) |
| 18 to 34 Years | 0 (0.0%) | 0 (0.0%) |
| 35 to 64 Years | 0 (0.0%) | 0 (0.0%) |
| 65 to 74 Years | 0 (0.0%) | 4 (11.1%) |
| 75 Years and over | 0 (0.0%) | 12 (35.3%) |
Disability Class: Vision Difficulty
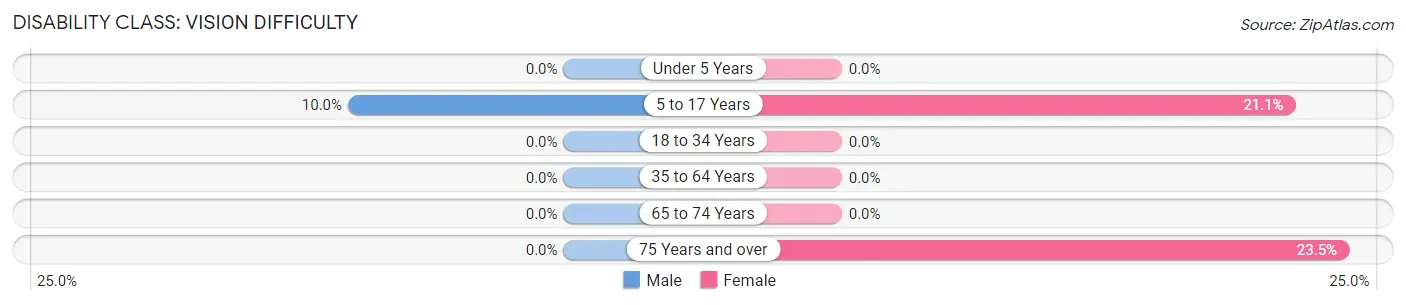
| Age Bracket | Male | Female |
| Under 5 Years | 0 (0.0%) | 0 (0.0%) |
| 5 to 17 Years | 4 (10.0%) | 8 (21.0%) |
| 18 to 34 Years | 0 (0.0%) | 0 (0.0%) |
| 35 to 64 Years | 0 (0.0%) | 0 (0.0%) |
| 65 to 74 Years | 0 (0.0%) | 0 (0.0%) |
| 75 Years and over | 0 (0.0%) | 8 (23.5%) |
Disability Class: Cognitive Difficulty
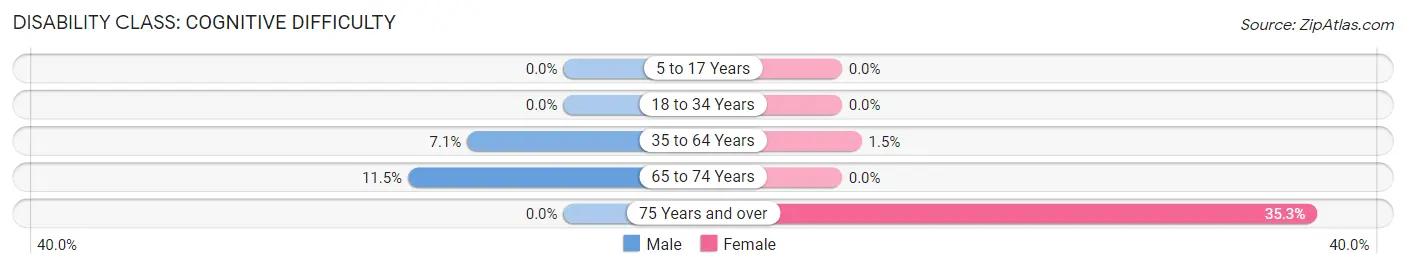
| Age Bracket | Male | Female |
| 5 to 17 Years | 0 (0.0%) | 0 (0.0%) |
| 18 to 34 Years | 0 (0.0%) | 0 (0.0%) |
| 35 to 64 Years | 8 (7.1%) | 2 (1.5%) |
| 65 to 74 Years | 3 (11.5%) | 0 (0.0%) |
| 75 Years and over | 0 (0.0%) | 12 (35.3%) |
Disability Class: Ambulatory Difficulty
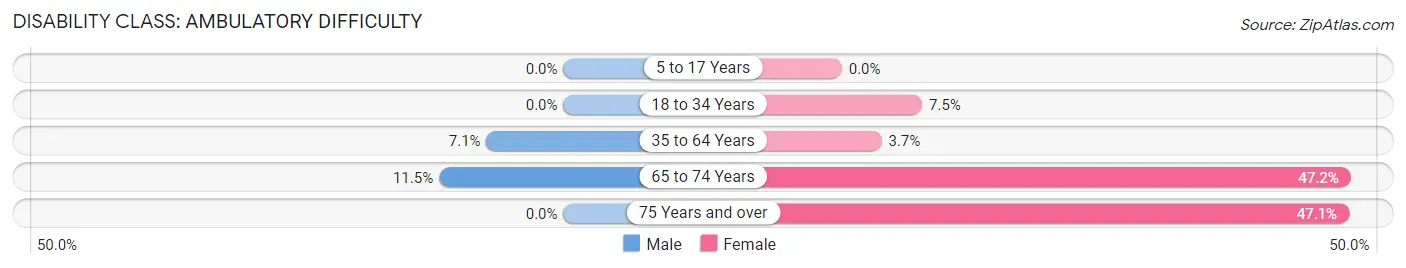
| Age Bracket | Male | Female |
| 5 to 17 Years | 0 (0.0%) | 0 (0.0%) |
| 18 to 34 Years | 0 (0.0%) | 7 (7.4%) |
| 35 to 64 Years | 8 (7.1%) | 5 (3.7%) |
| 65 to 74 Years | 3 (11.5%) | 17 (47.2%) |
| 75 Years and over | 0 (0.0%) | 16 (47.1%) |
Disability Class: Self-Care Difficulty
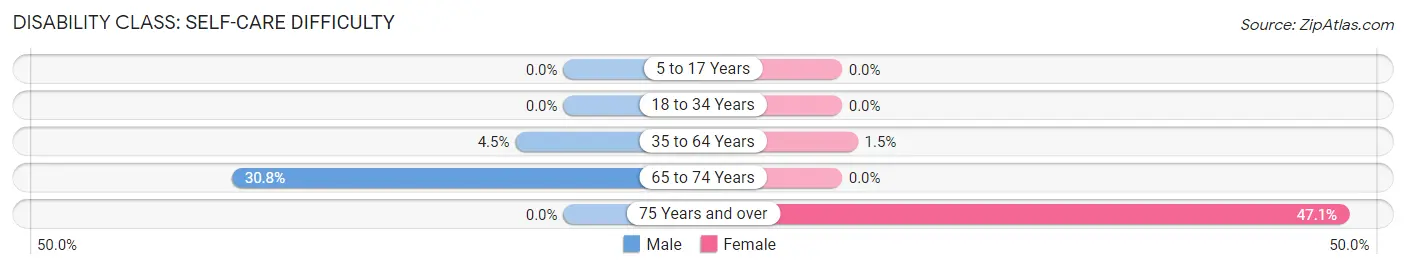
| Age Bracket | Male | Female |
| 5 to 17 Years | 0 (0.0%) | 0 (0.0%) |
| 18 to 34 Years | 0 (0.0%) | 0 (0.0%) |
| 35 to 64 Years | 5 (4.5%) | 2 (1.5%) |
| 65 to 74 Years | 8 (30.8%) | 0 (0.0%) |
| 75 Years and over | 0 (0.0%) | 16 (47.1%) |
Technology Access in Anmoore
Computing Device Access in Anmoore
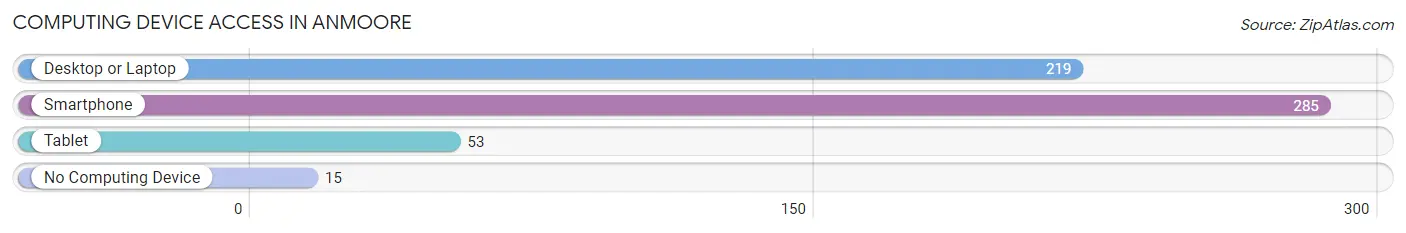
| Device Type | # Households | % Households |
| Desktop or Laptop | 219 | 73.0% |
| Smartphone | 285 | 95.0% |
| Tablet | 53 | 17.7% |
| No Computing Device | 15 | 5.0% |
| Total | 300 | 100.0% |
Internet Access in Anmoore
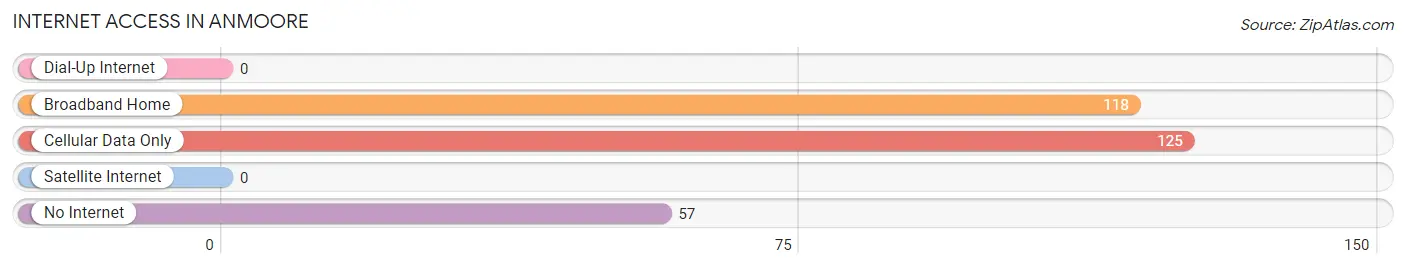
| Internet Type | # Households | % Households |
| Dial-Up Internet | 0 | 0.0% |
| Broadband Home | 118 | 39.3% |
| Cellular Data Only | 125 | 41.7% |
| Satellite Internet | 0 | 0.0% |
| No Internet | 57 | 19.0% |
| Total | 300 | 100.0% |
Anmoore Summary
Anmoore is a small town located in Harrison County, West Virginia. It is situated in the northern part of the state, about 25 miles south of the Pennsylvania border. The town was founded in 1891 and has a population of approximately 1,000 people.
Geography
Anmoore is located in the northern part of Harrison County, West Virginia. It is situated in the Appalachian Mountains, and is surrounded by rolling hills and forests. The town is located at an elevation of 1,400 feet above sea level. The nearest major city is Clarksburg, which is about 25 miles to the south.
The climate in Anmoore is humid continental, with hot summers and cold winters. The average annual temperature is around 50 degrees Fahrenheit. The average annual precipitation is around 40 inches.
Economy
The economy of Anmoore is largely based on agriculture and tourism. The town is home to several small farms, which produce a variety of crops, including corn, soybeans, and hay. The town also has several small businesses, including a grocery store, a hardware store, and a few restaurants.
Tourism is an important part of the economy in Anmoore. The town is home to several attractions, including the Anmoore Historical Museum, the Anmoore Railroad Museum, and the Anmoore State Park. The town also hosts several annual festivals, including the Anmoore Apple Festival and the Anmoore Bluegrass Festival.
Demographics
As of the 2010 census, the population of Anmoore was 1,000 people. The racial makeup of the town was 97.2% White, 0.7% African American, 0.2% Native American, 0.2% Asian, 0.2% from other races, and 1.7% from two or more races. Hispanic or Latino of any race were 0.7% of the population.
The median household income in Anmoore was $30,000, and the median family income was $35,000. The per capita income was $15,000. About 15.7% of the population was below the poverty line.
History
Anmoore was founded in 1891 by a group of settlers from Pennsylvania. The town was named after the Anmoore family, who were among the first settlers. The town grew slowly over the years, and by the early 1900s, it had become a thriving agricultural community.
In the 1950s, the town began to decline as many of its residents moved away in search of better economic opportunities. The town was revitalized in the 1970s, when the Anmoore Historical Museum was established. The museum has become a popular tourist attraction, and has helped to bring new life to the town.
Today, Anmoore is a small but vibrant community. The town is home to several small businesses, and its residents enjoy a peaceful, rural lifestyle. The town is also home to several annual festivals, which attract visitors from all over the region.
Common Questions
What is Per Capita Income in Anmoore?
Per Capita income in Anmoore is $18,852.
What is the Median Family Income in Anmoore?
Median Family Income in Anmoore is $29,712.
What is the Median Household income in Anmoore?
Median Household Income in Anmoore is $26,471.
What is Income or Wage Gap in Anmoore?
Income or Wage Gap in Anmoore is 12.2%.
Women in Anmoore earn 87.8 cents for every dollar earned by a man.
What is Inequality or Gini Index in Anmoore?
Inequality or Gini Index in Anmoore is 0.44.
What is the Total Population of Anmoore?
Total Population of Anmoore is 562.
What is the Total Male Population of Anmoore?
Total Male Population of Anmoore is 213.
What is the Total Female Population of Anmoore?
Total Female Population of Anmoore is 349.
What is the Ratio of Males per 100 Females in Anmoore?
There are 61.03 Males per 100 Females in Anmoore.
What is the Ratio of Females per 100 Males in Anmoore?
There are 163.85 Females per 100 Males in Anmoore.
What is the Median Population Age in Anmoore?
Median Population Age in Anmoore is 40.4 Years.
What is the Average Family Size in Anmoore
Average Family Size in Anmoore is 2.8 People.
What is the Average Household Size in Anmoore
Average Household Size in Anmoore is 1.9 People.
How Large is the Labor Force in Anmoore?
There are 232 People in the Labor Forcein in Anmoore.
What is the Percentage of People in the Labor Force in Anmoore?
47.0% of People are in the Labor Force in Anmoore.
What is the Unemployment Rate in Anmoore?
Unemployment Rate in Anmoore is 6.5%.