Spencer, WV Map & Demographics
Spencer Map
Spencer Overview
$20,127
PER CAPITA INCOME
$41,131
AVG FAMILY INCOME
$23,983
AVG HOUSEHOLD INCOME
37.4%
WAGE / INCOME GAP [ % ]
62.6¢/ $1
WAGE / INCOME GAP [ $ ]
0.51
INEQUALITY / GINI INDEX
2,057
TOTAL POPULATION
1,022
MALE POPULATION
1,035
FEMALE POPULATION
98.74
MALES / 100 FEMALES
101.27
FEMALES / 100 MALES
43.8
MEDIAN AGE
3.4
AVG FAMILY SIZE
2.2
AVG HOUSEHOLD SIZE
592
LABOR FORCE [ PEOPLE ]
34.1%
PERCENT IN LABOR FORCE
24.0%
UNEMPLOYMENT RATE
Spencer Zip Codes
Spencer Area Codes
Income in Spencer
Income Overview in Spencer
Per Capita Income in Spencer is $20,127, while median incomes of families and households are $41,131 and $23,983 respectively.
| Characteristic | Number | Measure |
| Per Capita Income | 2,057 | $20,127 |
| Median Family Income | 383 | $41,131 |
| Mean Family Income | 383 | $51,415 |
| Median Household Income | 892 | $23,983 |
| Mean Household Income | 892 | $42,717 |
| Income Deficit | 383 | $0 |
| Wage / Income Gap (%) | 2,057 | 37.42% |
| Wage / Income Gap ($) | 2,057 | 62.58¢ per $1 |
| Gini / Inequality Index | 2,057 | 0.51 |
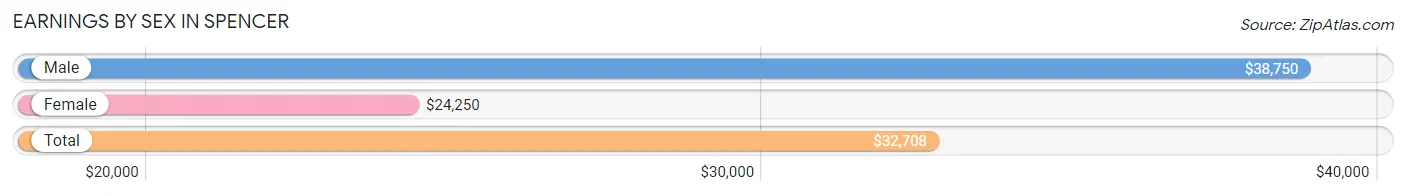
Earnings by Sex in Spencer
Average Earnings in Spencer are $32,708, $38,750 for men and $24,250 for women, a difference of 37.4%.
| Sex | Number | Average Earnings |
| Male | 300 (60.1%) | $38,750 |
| Female | 199 (39.9%) | $24,250 |
| Total | 499 (100.0%) | $32,708 |
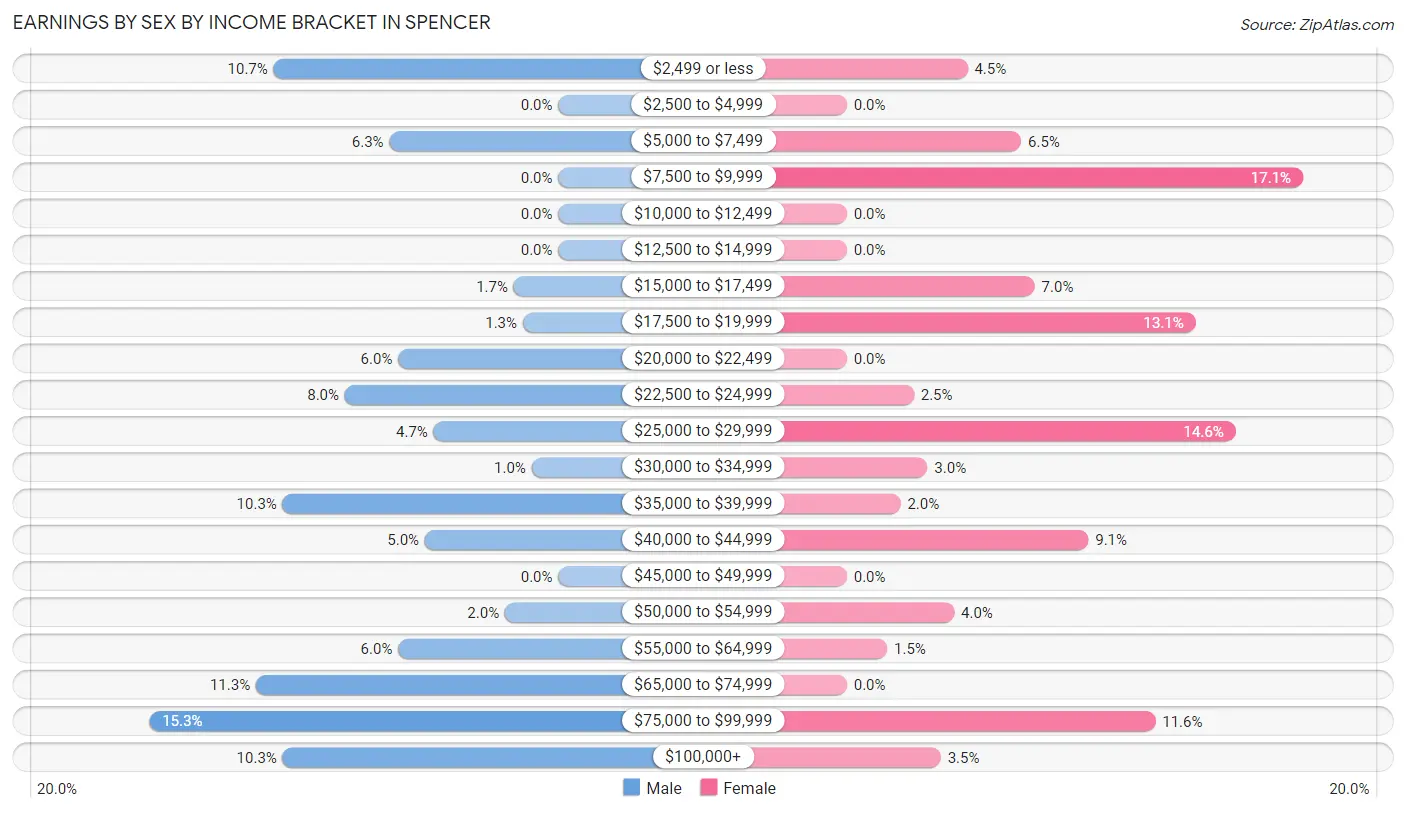
Earnings by Sex by Income Bracket in Spencer
The most common earnings brackets in Spencer are $75,000 to $99,999 for men (46 | 15.3%) and $7,500 to $9,999 for women (34 | 17.1%).
| Income | Male | Female |
| $2,499 or less | 32 (10.7%) | 9 (4.5%) |
| $2,500 to $4,999 | 0 (0.0%) | 0 (0.0%) |
| $5,000 to $7,499 | 19 (6.3%) | 13 (6.5%) |
| $7,500 to $9,999 | 0 (0.0%) | 34 (17.1%) |
| $10,000 to $12,499 | 0 (0.0%) | 0 (0.0%) |
| $12,500 to $14,999 | 0 (0.0%) | 0 (0.0%) |
| $15,000 to $17,499 | 5 (1.7%) | 14 (7.0%) |
| $17,500 to $19,999 | 4 (1.3%) | 26 (13.1%) |
| $20,000 to $22,499 | 18 (6.0%) | 0 (0.0%) |
| $22,500 to $24,999 | 24 (8.0%) | 5 (2.5%) |
| $25,000 to $29,999 | 14 (4.7%) | 29 (14.6%) |
| $30,000 to $34,999 | 3 (1.0%) | 6 (3.0%) |
| $35,000 to $39,999 | 31 (10.3%) | 4 (2.0%) |
| $40,000 to $44,999 | 15 (5.0%) | 18 (9.0%) |
| $45,000 to $49,999 | 0 (0.0%) | 0 (0.0%) |
| $50,000 to $54,999 | 6 (2.0%) | 8 (4.0%) |
| $55,000 to $64,999 | 18 (6.0%) | 3 (1.5%) |
| $65,000 to $74,999 | 34 (11.3%) | 0 (0.0%) |
| $75,000 to $99,999 | 46 (15.3%) | 23 (11.6%) |
| $100,000+ | 31 (10.3%) | 7 (3.5%) |
| Total | 300 (100.0%) | 199 (100.0%) |
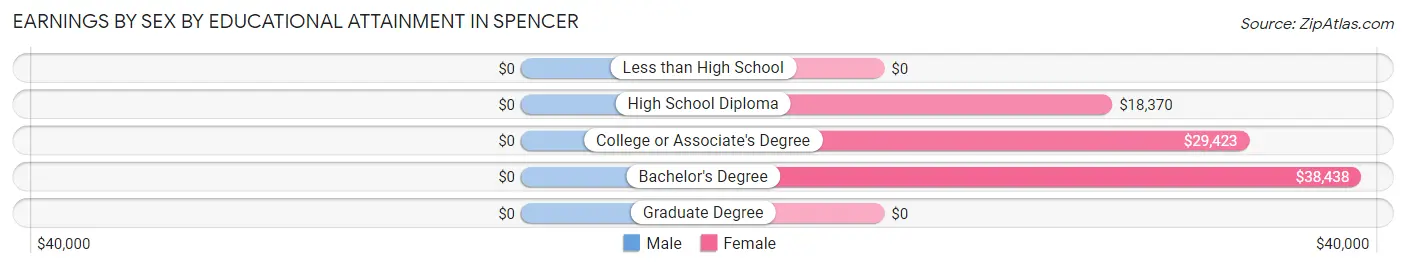
Earnings by Sex by Educational Attainment in Spencer
| Educational Attainment | Male Income | Female Income |
| Less than High School | - | - |
| High School Diploma | - | - |
| College or Associate's Degree | - | - |
| Bachelor's Degree | - | - |
| Graduate Degree | - | - |
| Total | $47,500 | $28,707 |
Family Income in Spencer
Family Income Brackets in Spencer
According to the Spencer family income data, there are 108 families falling into the $75,000 to $99,999 income range, which is the most common income bracket and makes up 28.2% of all families.
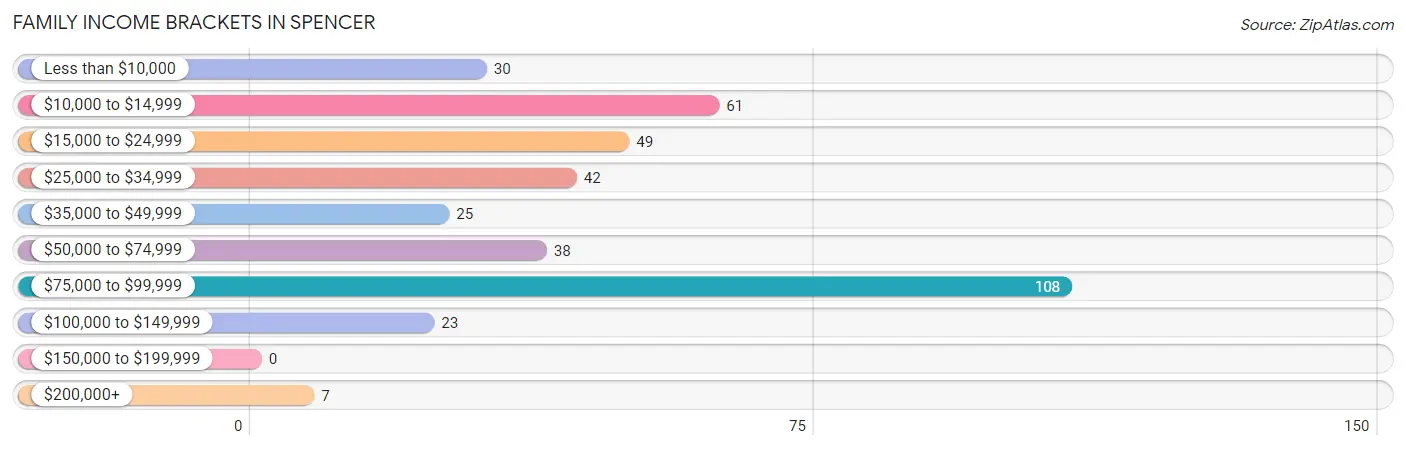
| Income Bracket | # Families | % Families |
| Less than $10,000 | 30 | 7.8% |
| $10,000 to $14,999 | 61 | 15.9% |
| $15,000 to $24,999 | 49 | 12.8% |
| $25,000 to $34,999 | 42 | 11.0% |
| $35,000 to $49,999 | 25 | 6.5% |
| $50,000 to $74,999 | 38 | 9.9% |
| $75,000 to $99,999 | 108 | 28.2% |
| $100,000 to $149,999 | 23 | 6.0% |
| $150,000 to $199,999 | 0 | 0.0% |
| $200,000+ | 7 | 1.8% |
Family Income by Famaliy Size in Spencer
2-person families (244 | 63.7%) account for the highest median family income in Spencer with $40,962 per family, while 2-person families (244 | 63.7%) have the highest median income of $20,481 per family member.
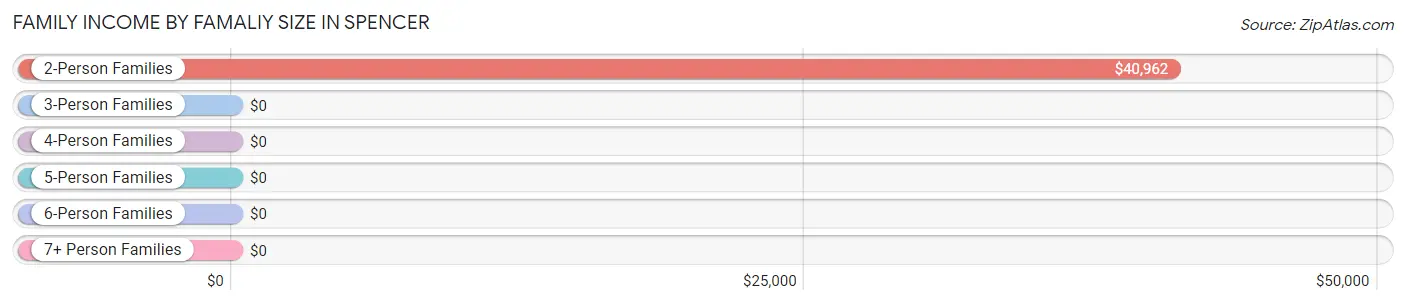
| Income Bracket | # Families | Median Income |
| 2-Person Families | 244 (63.7%) | $40,962 |
| 3-Person Families | 70 (18.3%) | $0 |
| 4-Person Families | 51 (13.3%) | $0 |
| 5-Person Families | 10 (2.6%) | $0 |
| 6-Person Families | 8 (2.1%) | $0 |
| 7+ Person Families | 0 (0.0%) | $0 |
| Total | 383 (100.0%) | $41,131 |
Family Income by Number of Earners in Spencer
The median family income in Spencer is $41,131, with families comprising 3+ earners (10) having the highest median family income of $110,833, while families with no earners (162) have the lowest median family income of $20,500, accounting for 2.6% and 42.3% of families, respectively.
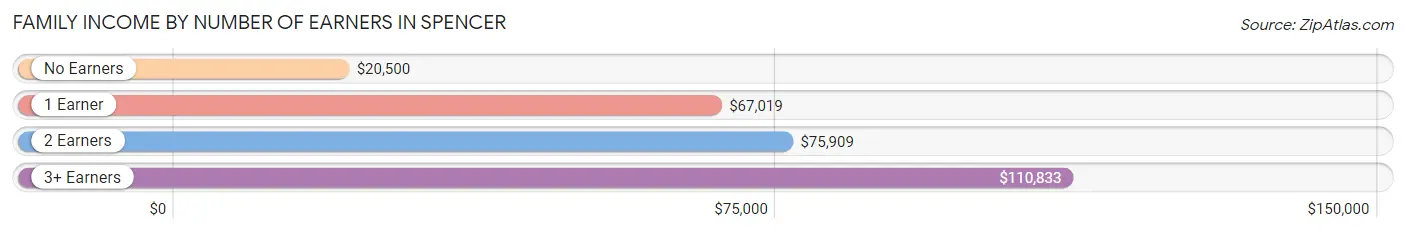
| Number of Earners | # Families | Median Income |
| No Earners | 162 (42.3%) | $20,500 |
| 1 Earner | 155 (40.5%) | $67,019 |
| 2 Earners | 56 (14.6%) | $75,909 |
| 3+ Earners | 10 (2.6%) | $110,833 |
| Total | 383 (100.0%) | $41,131 |
Household Income in Spencer
Household Income Brackets in Spencer
With 208 households falling in the category, the $10,000 to $14,999 income range is the most frequent in Spencer, accounting for 23.3% of all households. In contrast, only 7 households (0.8%) fall into the $200,000+ income bracket, making it the least populous group.
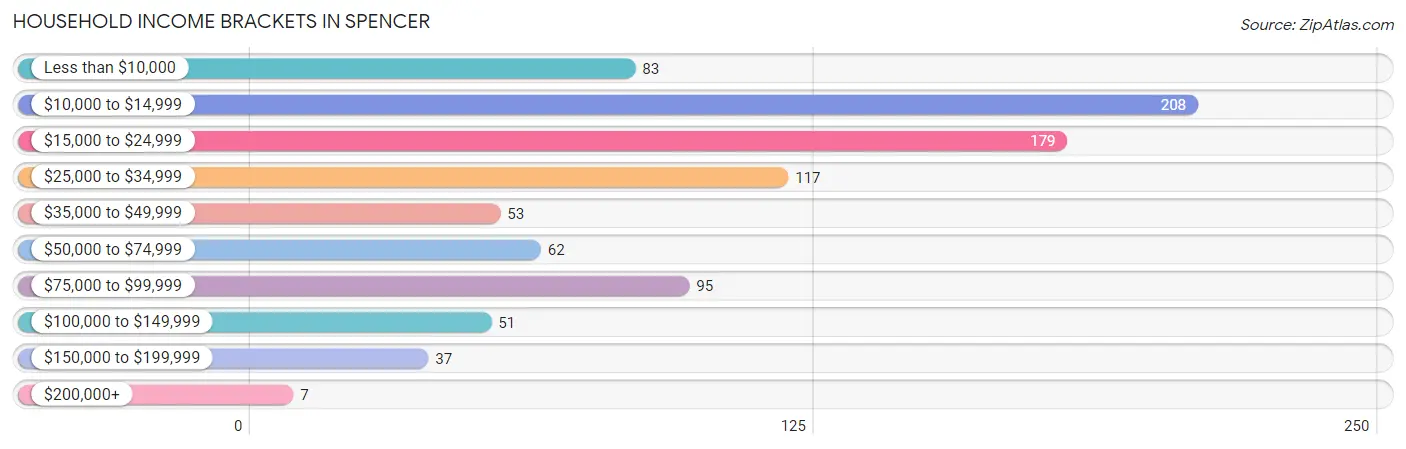
| Income Bracket | # Households | % Households |
| Less than $10,000 | 83 | 9.3% |
| $10,000 to $14,999 | 208 | 23.3% |
| $15,000 to $24,999 | 179 | 20.1% |
| $25,000 to $34,999 | 117 | 13.1% |
| $35,000 to $49,999 | 53 | 5.9% |
| $50,000 to $74,999 | 62 | 7.0% |
| $75,000 to $99,999 | 95 | 10.7% |
| $100,000 to $149,999 | 51 | 5.7% |
| $150,000 to $199,999 | 37 | 4.1% |
| $200,000+ | 7 | 0.8% |
Household Income by Householder Age in Spencer
The median household income in Spencer is $23,983, with the highest median household income of $50,938 found in the 25 to 44 years age bracket for the primary householder. A total of 157 households (17.6%) fall into this category. Meanwhile, the 15 to 24 years age bracket for the primary householder has the lowest median household income of $0, with 54 households (6.0%) in this group.
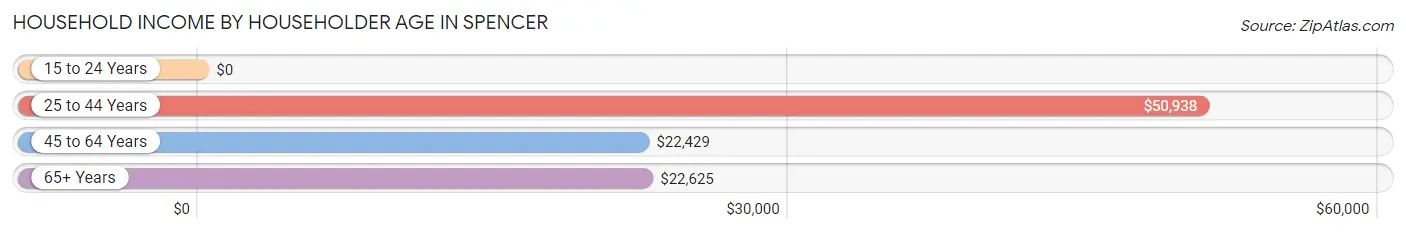
| Income Bracket | # Households | Median Income |
| 15 to 24 Years | 54 (6.0%) | $0 |
| 25 to 44 Years | 157 (17.6%) | $50,938 |
| 45 to 64 Years | 328 (36.8%) | $22,429 |
| 65+ Years | 353 (39.6%) | $22,625 |
| Total | 892 (100.0%) | $23,983 |
Poverty in Spencer
Income Below Poverty by Sex and Age in Spencer
With 40.3% poverty level for males and 39.9% for females among the residents of Spencer, 6 to 11 year old males and 18 to 24 year old females are the most vulnerable to poverty, with 78 males (100.0%) and 86 females (73.5%) in their respective age groups living below the poverty level.
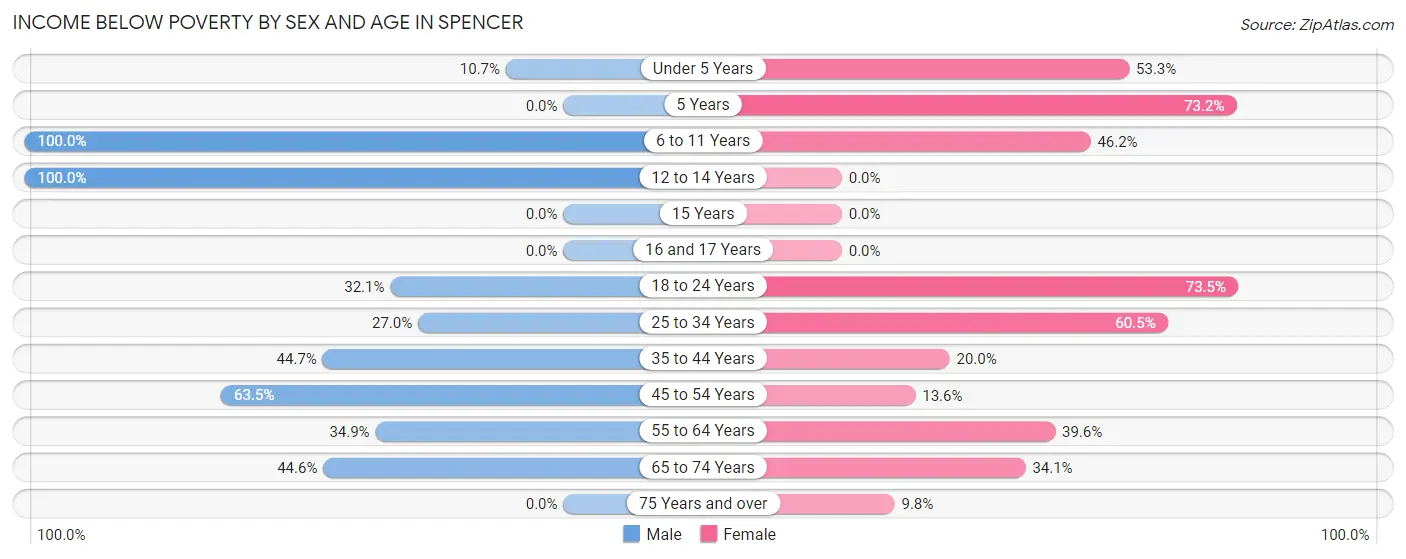
| Age Bracket | Male | Female |
| Under 5 Years | 8 (10.7%) | 32 (53.3%) |
| 5 Years | 0 (0.0%) | 41 (73.2%) |
| 6 to 11 Years | 78 (100.0%) | 12 (46.2%) |
| 12 to 14 Years | 17 (100.0%) | 0 (0.0%) |
| 15 Years | 0 (0.0%) | 0 (0.0%) |
| 16 and 17 Years | 0 (0.0%) | 0 (0.0%) |
| 18 to 24 Years | 44 (32.1%) | 86 (73.5%) |
| 25 to 34 Years | 41 (27.0%) | 81 (60.5%) |
| 35 to 44 Years | 63 (44.7%) | 6 (20.0%) |
| 45 to 54 Years | 54 (63.5%) | 18 (13.6%) |
| 55 to 64 Years | 60 (34.9%) | 57 (39.6%) |
| 65 to 74 Years | 41 (44.6%) | 45 (34.1%) |
| 75 Years and over | 0 (0.0%) | 14 (9.8%) |
| Total | 406 (40.3%) | 392 (39.9%) |
Income Above Poverty by Sex and Age in Spencer
According to the poverty statistics in Spencer, males aged 16 and 17 years and females aged 15 years are the age groups that are most secure financially, with 100.0% of males and 100.0% of females in these age groups living above the poverty line.
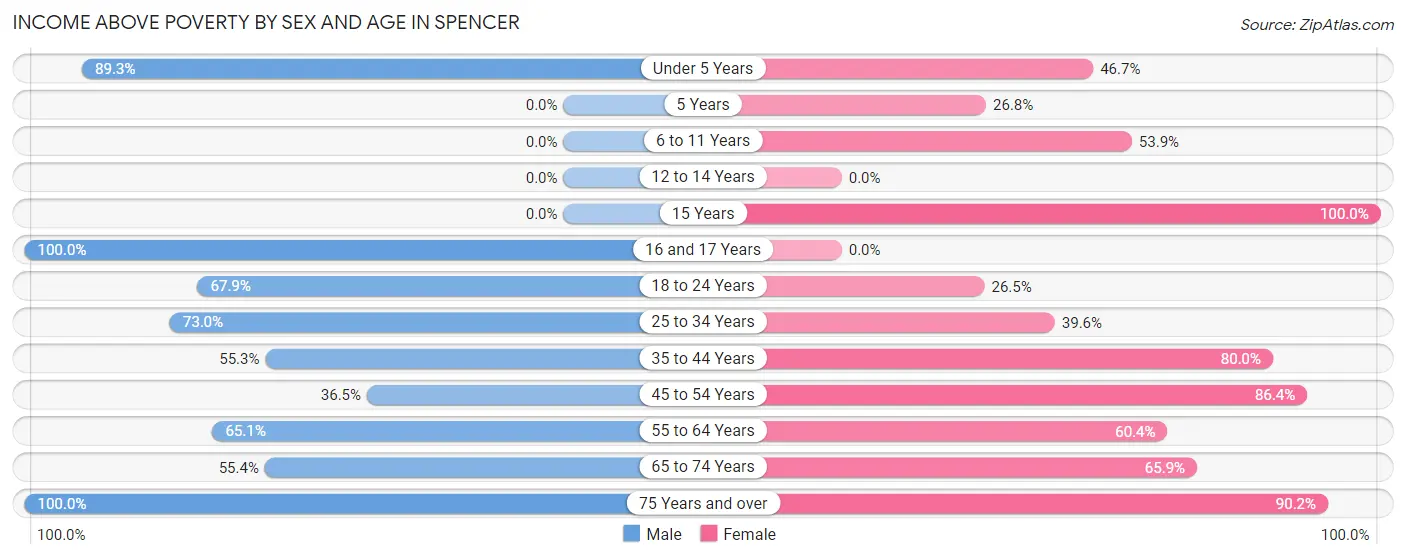
| Age Bracket | Male | Female |
| Under 5 Years | 67 (89.3%) | 28 (46.7%) |
| 5 Years | 0 (0.0%) | 15 (26.8%) |
| 6 to 11 Years | 0 (0.0%) | 14 (53.8%) |
| 12 to 14 Years | 0 (0.0%) | 0 (0.0%) |
| 15 Years | 0 (0.0%) | 8 (100.0%) |
| 16 and 17 Years | 15 (100.0%) | 0 (0.0%) |
| 18 to 24 Years | 93 (67.9%) | 31 (26.5%) |
| 25 to 34 Years | 111 (73.0%) | 53 (39.6%) |
| 35 to 44 Years | 78 (55.3%) | 24 (80.0%) |
| 45 to 54 Years | 31 (36.5%) | 114 (86.4%) |
| 55 to 64 Years | 112 (65.1%) | 87 (60.4%) |
| 65 to 74 Years | 51 (55.4%) | 87 (65.9%) |
| 75 Years and over | 43 (100.0%) | 129 (90.2%) |
| Total | 601 (59.7%) | 590 (60.1%) |
Income Below Poverty Among Married-Couple Families in Spencer
The poverty statistics for married-couple families in Spencer show that 17.0% or 33 of the total 194 families live below the poverty line. Families with 1 or 2 children have the highest poverty rate of 56.0%, comprising of 28 families. On the other hand, families with 3 or 4 children have the lowest poverty rate of 0.0%, which includes 0 families.
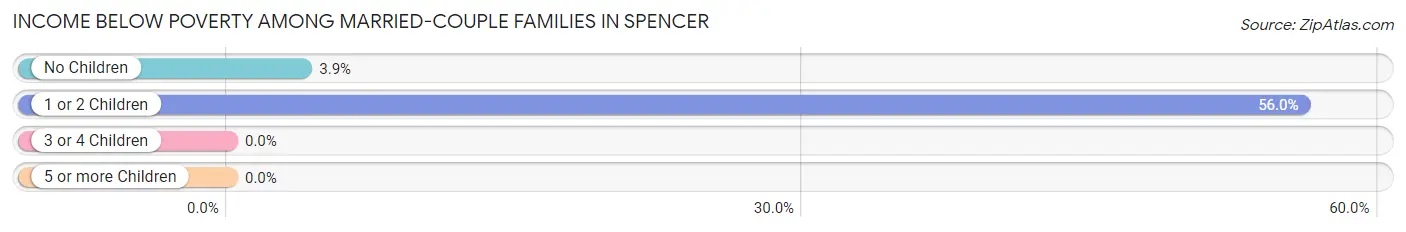
| Children | Above Poverty | Below Poverty |
| No Children | 124 (96.1%) | 5 (3.9%) |
| 1 or 2 Children | 22 (44.0%) | 28 (56.0%) |
| 3 or 4 Children | 15 (100.0%) | 0 (0.0%) |
| 5 or more Children | 0 (0.0%) | 0 (0.0%) |
| Total | 161 (83.0%) | 33 (17.0%) |
Income Below Poverty Among Single-Parent Households in Spencer
According to the poverty data in Spencer, 40.7% or 11 single-father households and 53.7% or 87 single-mother households are living below the poverty line. Among single-father households, those with 3 or 4 children have the highest poverty rate, with 11 households (100.0%) experiencing poverty. Likewise, among single-mother households, those with 1 or 2 children have the highest poverty rate, with 48 households (92.3%) falling below the poverty line.
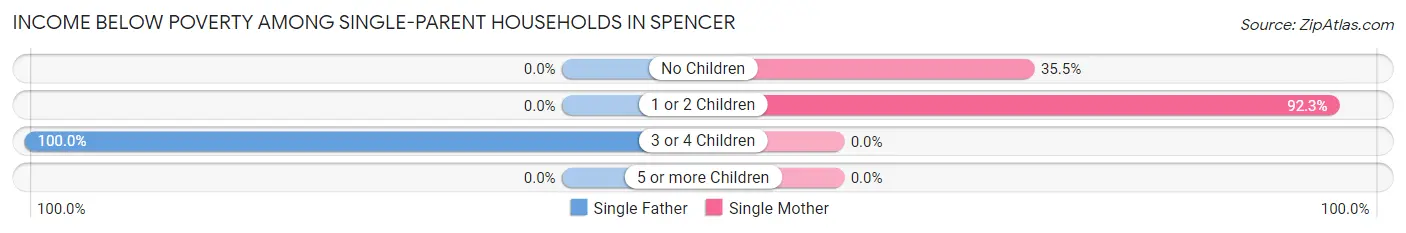
| Children | Single Father | Single Mother |
| No Children | 0 (0.0%) | 39 (35.4%) |
| 1 or 2 Children | 0 (0.0%) | 48 (92.3%) |
| 3 or 4 Children | 11 (100.0%) | 0 (0.0%) |
| 5 or more Children | 0 (0.0%) | 0 (0.0%) |
| Total | 11 (40.7%) | 87 (53.7%) |
Income Below Poverty Among Married-Couple vs Single-Parent Households in Spencer
The poverty data for Spencer shows that 33 of the married-couple family households (17.0%) and 98 of the single-parent households (51.8%) are living below the poverty level. Within the married-couple family households, those with 1 or 2 children have the highest poverty rate, with 28 households (56.0%) falling below the poverty line. Among the single-parent households, those with 3 or 4 children have the highest poverty rate, with 11 household (100.0%) living below poverty.
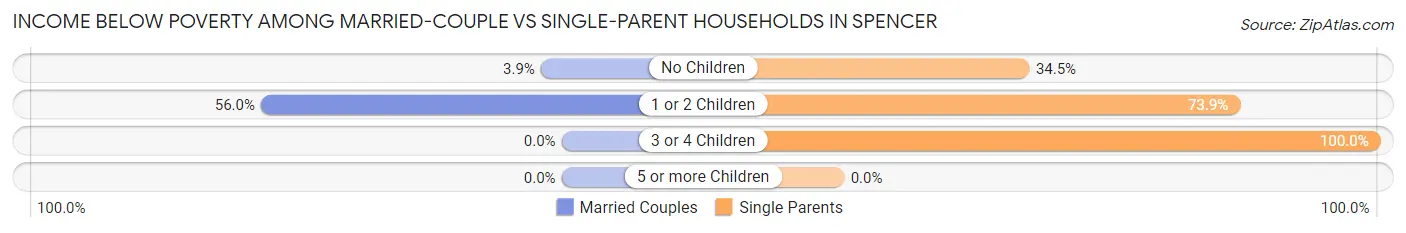
| Children | Married-Couple Families | Single-Parent Households |
| No Children | 5 (3.9%) | 39 (34.5%) |
| 1 or 2 Children | 28 (56.0%) | 48 (73.9%) |
| 3 or 4 Children | 0 (0.0%) | 11 (100.0%) |
| 5 or more Children | 0 (0.0%) | 0 (0.0%) |
| Total | 33 (17.0%) | 98 (51.8%) |
Race in Spencer
The most populous races in Spencer are White / Caucasian (1,938 | 94.2%), Two or more Races (60 | 2.9%), and Asian (57 | 2.8%).
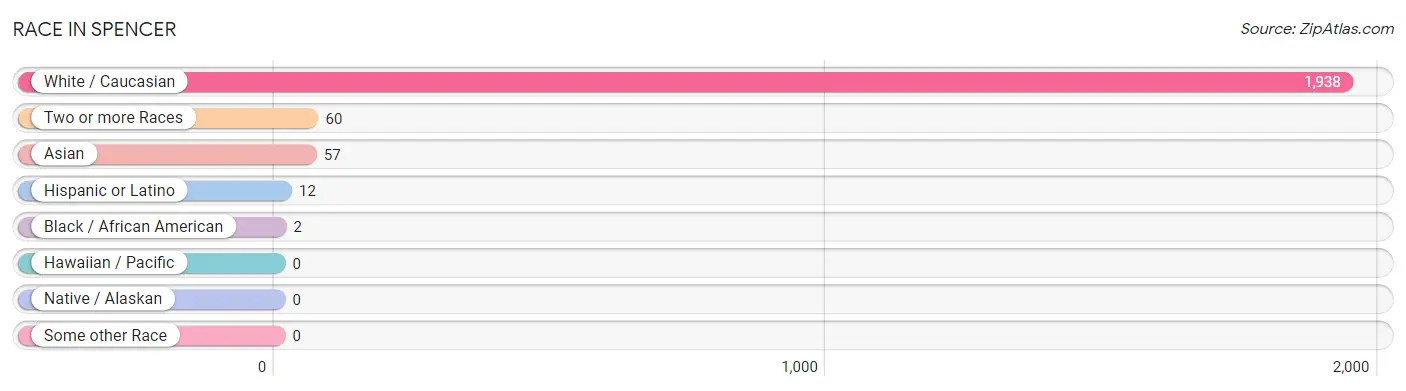
| Race | # Population | % Population |
| Asian | 57 | 2.8% |
| Black / African American | 2 | 0.1% |
| Hawaiian / Pacific | 0 | 0.0% |
| Hispanic or Latino | 12 | 0.6% |
| Native / Alaskan | 0 | 0.0% |
| White / Caucasian | 1,938 | 94.2% |
| Two or more Races | 60 | 2.9% |
| Some other Race | 0 | 0.0% |
| Total | 2,057 | 100.0% |
Ancestry in Spencer
The most populous ancestries reported in Spencer are Irish (361 | 17.5%), English (318 | 15.5%), German (289 | 14.1%), American (197 | 9.6%), and Scotch-Irish (109 | 5.3%), together accounting for 61.9% of all Spencer residents.
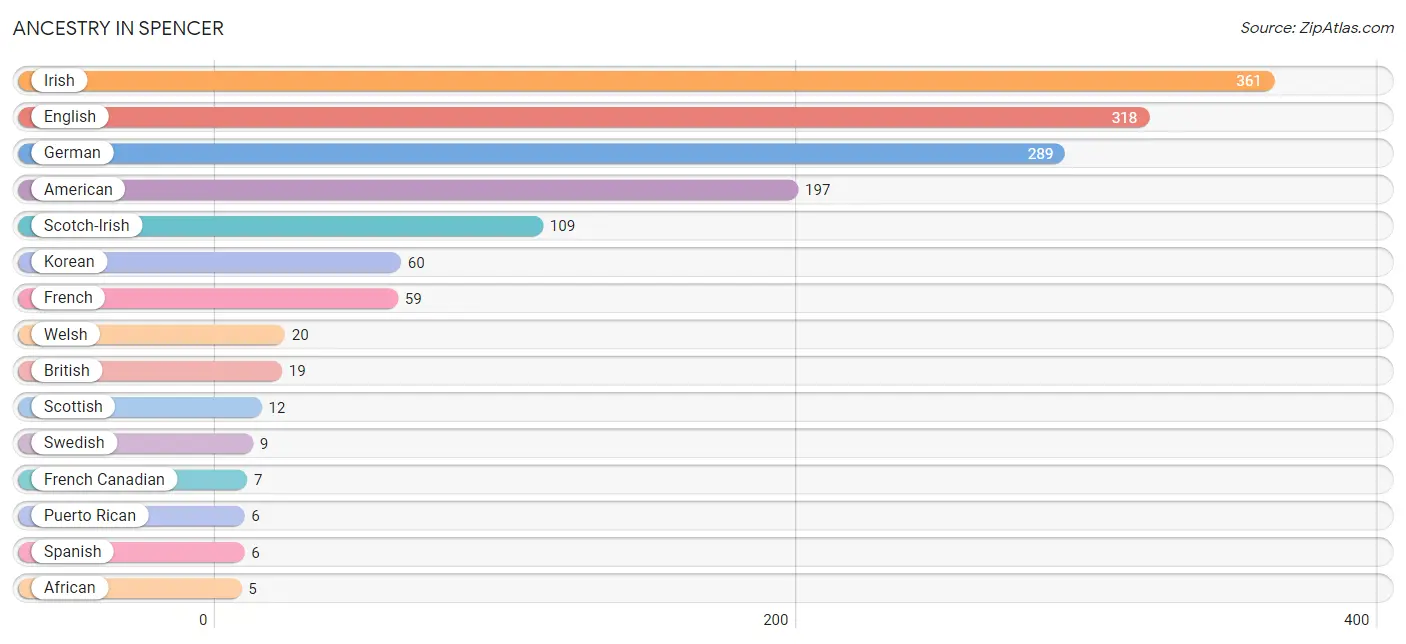
| Ancestry | # Population | % Population |
| African | 5 | 0.2% |
| American | 197 | 9.6% |
| Belgian | 5 | 0.2% |
| British | 19 | 0.9% |
| Dutch | 5 | 0.2% |
| English | 318 | 15.5% |
| French | 59 | 2.9% |
| French Canadian | 7 | 0.3% |
| German | 289 | 14.1% |
| Irish | 361 | 17.5% |
| Korean | 60 | 2.9% |
| Puerto Rican | 6 | 0.3% |
| Scotch-Irish | 109 | 5.3% |
| Scottish | 12 | 0.6% |
| Spanish | 6 | 0.3% |
| Subsaharan African | 5 | 0.2% |
| Swedish | 9 | 0.4% |
| Welsh | 20 | 1.0% | View All 18 Rows |
Immigrants in Spencer
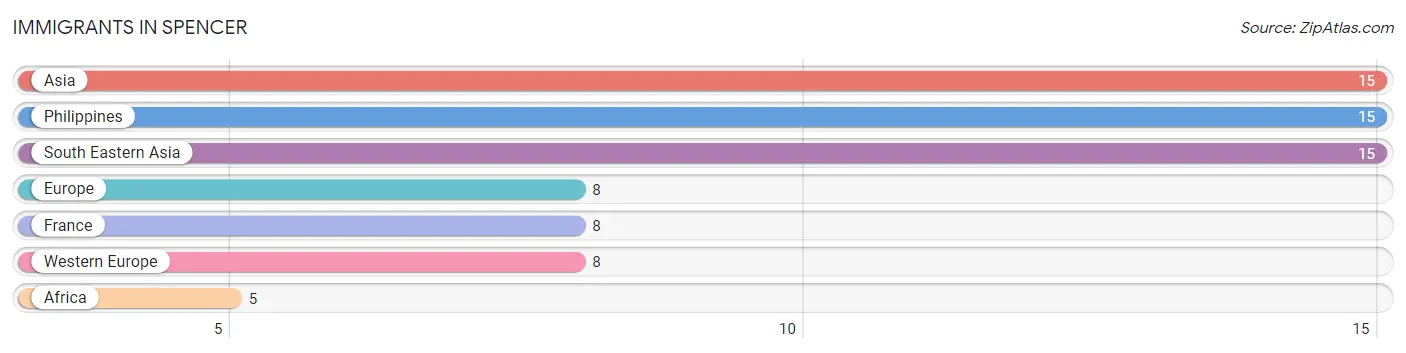
The most numerous immigrant groups reported in Spencer came from Asia (15 | 0.7%), Philippines (15 | 0.7%), South Eastern Asia (15 | 0.7%), Europe (8 | 0.4%), and France (8 | 0.4%), together accounting for 3.0% of all Spencer residents.
| Immigration Origin | # Population | % Population |
| Africa | 5 | 0.2% |
| Asia | 15 | 0.7% |
| Europe | 8 | 0.4% |
| France | 8 | 0.4% |
| Philippines | 15 | 0.7% |
| South Eastern Asia | 15 | 0.7% |
| Western Europe | 8 | 0.4% | View All 7 Rows |
Sex and Age in Spencer
Sex and Age in Spencer
The most populous age groups in Spencer are 20 to 24 Years (137 | 13.4%) for men and 15 to 19 Years (94 | 9.1%) for women.
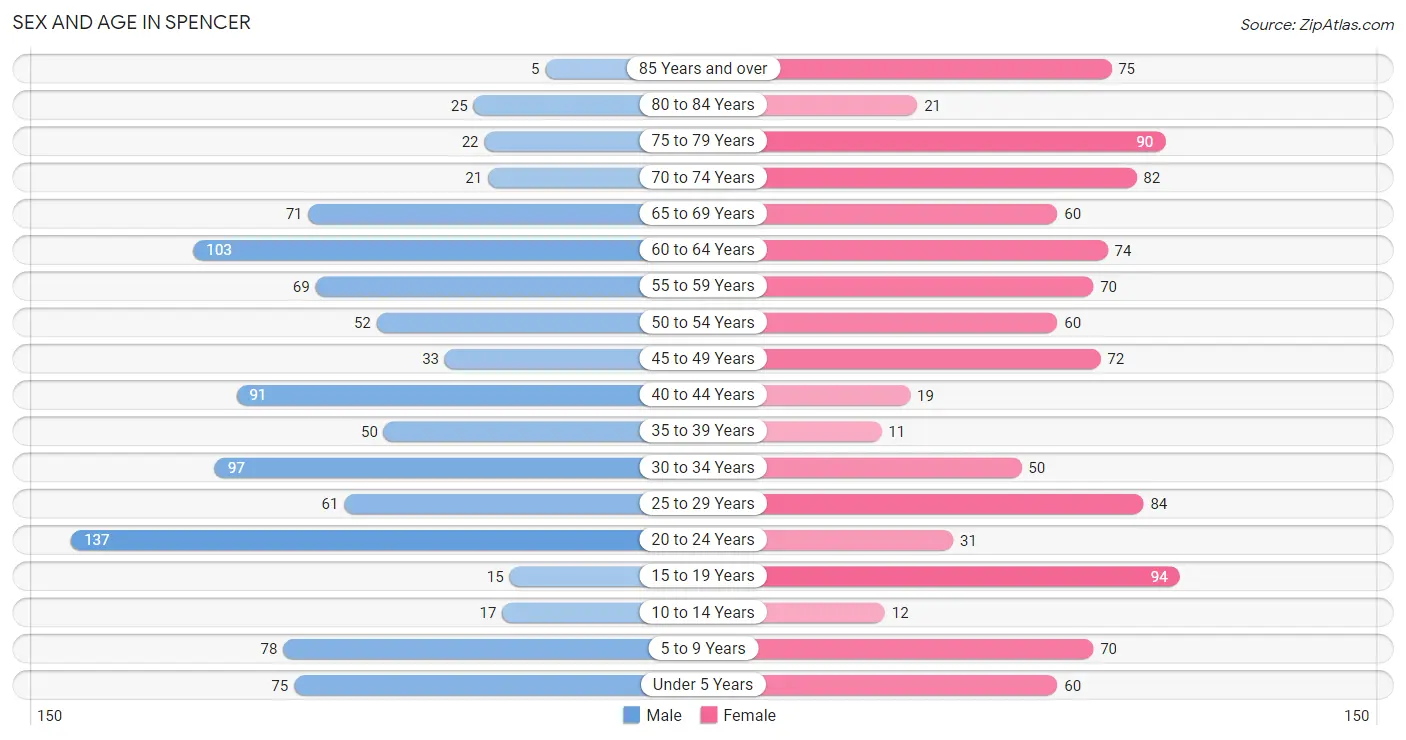
| Age Bracket | Male | Female |
| Under 5 Years | 75 (7.3%) | 60 (5.8%) |
| 5 to 9 Years | 78 (7.6%) | 70 (6.8%) |
| 10 to 14 Years | 17 (1.7%) | 12 (1.2%) |
| 15 to 19 Years | 15 (1.5%) | 94 (9.1%) |
| 20 to 24 Years | 137 (13.4%) | 31 (3.0%) |
| 25 to 29 Years | 61 (6.0%) | 84 (8.1%) |
| 30 to 34 Years | 97 (9.5%) | 50 (4.8%) |
| 35 to 39 Years | 50 (4.9%) | 11 (1.1%) |
| 40 to 44 Years | 91 (8.9%) | 19 (1.8%) |
| 45 to 49 Years | 33 (3.2%) | 72 (7.0%) |
| 50 to 54 Years | 52 (5.1%) | 60 (5.8%) |
| 55 to 59 Years | 69 (6.8%) | 70 (6.8%) |
| 60 to 64 Years | 103 (10.1%) | 74 (7.1%) |
| 65 to 69 Years | 71 (7.0%) | 60 (5.8%) |
| 70 to 74 Years | 21 (2.1%) | 82 (7.9%) |
| 75 to 79 Years | 22 (2.1%) | 90 (8.7%) |
| 80 to 84 Years | 25 (2.5%) | 21 (2.0%) |
| 85 Years and over | 5 (0.5%) | 75 (7.2%) |
| Total | 1,022 (100.0%) | 1,035 (100.0%) |
Families and Households in Spencer
Median Family Size in Spencer
The median family size in Spencer is 3.41 persons per family, with single male/father families (27 | 7.0%) accounting for the largest median family size of 4.19 persons per family. On the other hand, single female/mother families (162 | 42.3%) represent the smallest median family size with 3.33 persons per family.
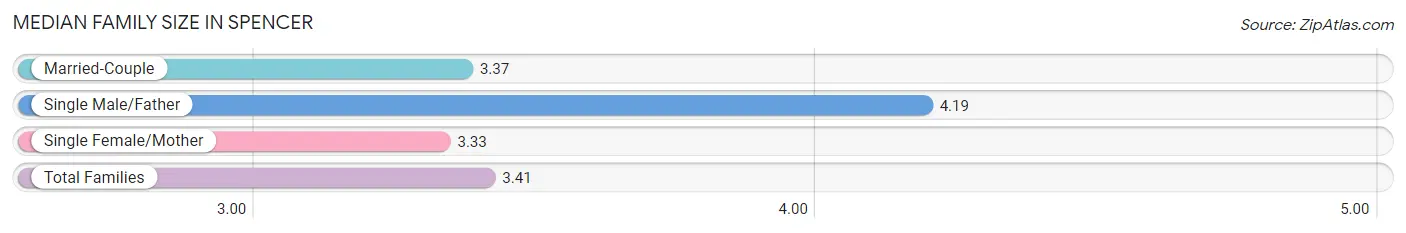
| Family Type | # Families | Family Size |
| Married-Couple | 194 (50.6%) | 3.37 |
| Single Male/Father | 27 (7.0%) | 4.19 |
| Single Female/Mother | 162 (42.3%) | 3.33 |
| Total Families | 383 (100.0%) | 3.41 |
Median Household Size in Spencer
The median household size in Spencer is 2.23 persons per household, with single male/father households (27 | 3.0%) accounting for the largest median household size of 4.3 persons per household. non-family households (509 | 57.1%) represent the smallest median household size with 1.21 persons per household.
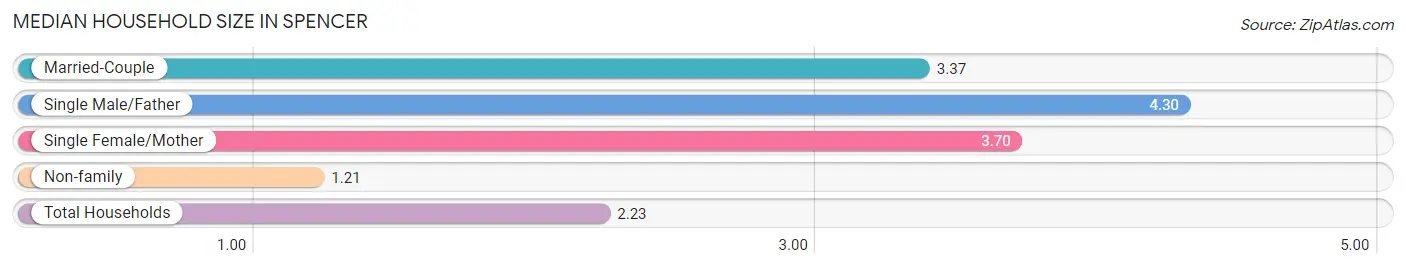
| Household Type | # Households | Household Size |
| Married-Couple | 194 (21.7%) | 3.37 |
| Single Male/Father | 27 (3.0%) | 4.30 |
| Single Female/Mother | 162 (18.2%) | 3.70 |
| Non-family | 509 (57.1%) | 1.21 |
| Total Households | 892 (100.0%) | 2.23 |
Household Size by Marriage Status in Spencer
Out of a total of 892 households in Spencer, 383 (42.9%) are family households, while 509 (57.1%) are nonfamily households. The most numerous type of family households are 2-person households, comprising 167, and the most common type of nonfamily households are 1-person households, comprising 433.
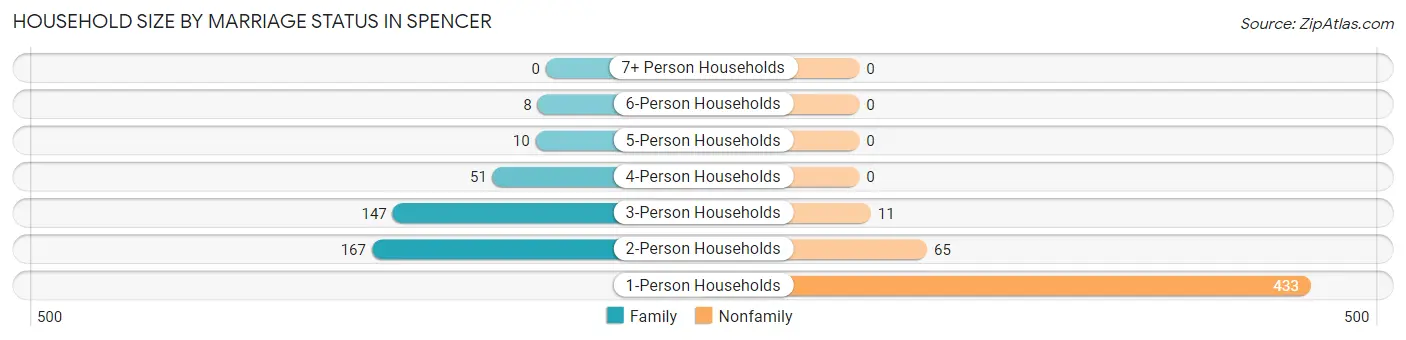
| Household Size | Family Households | Nonfamily Households |
| 1-Person Households | - | 433 (48.5%) |
| 2-Person Households | 167 (18.7%) | 65 (7.3%) |
| 3-Person Households | 147 (16.5%) | 11 (1.2%) |
| 4-Person Households | 51 (5.7%) | 0 (0.0%) |
| 5-Person Households | 10 (1.1%) | 0 (0.0%) |
| 6-Person Households | 8 (0.9%) | 0 (0.0%) |
| 7+ Person Households | 0 (0.0%) | 0 (0.0%) |
| Total | 383 (42.9%) | 509 (57.1%) |
Female Fertility in Spencer
Fertility by Age in Spencer
Average fertility rate in Spencer is 61.0 births per 1,000 women. Women in the age bracket of 15 to 19 years have the highest fertility rate with 234.0 births per 1,000 women. Women in the age bracket of 15 to 19 years acount for 100.0% of all women with births.
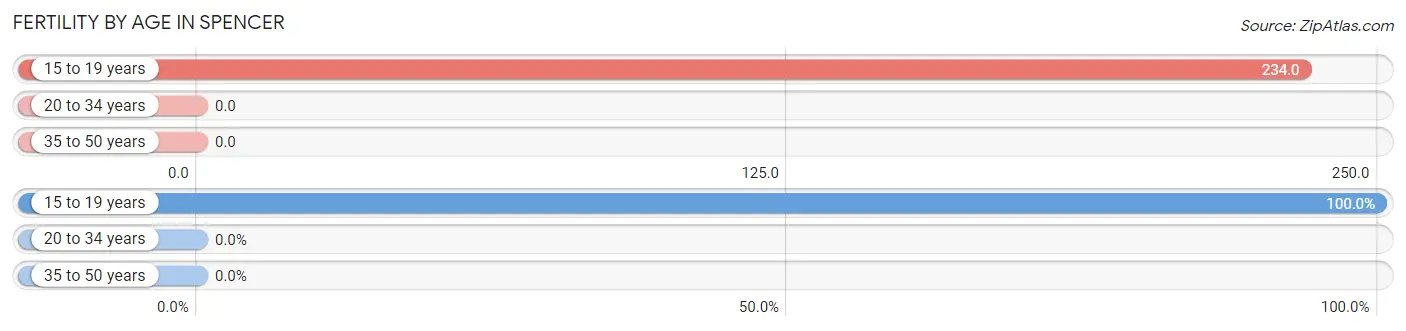
| Age Bracket | Women with Births | Births / 1,000 Women |
| 15 to 19 years | 22 (100.0%) | 234.0 |
| 20 to 34 years | 0 (0.0%) | 0.0 |
| 35 to 50 years | 0 (0.0%) | 0.0 |
| Total | 22 (100.0%) | 61.0 |
Fertility by Age by Marriage Status in Spencer
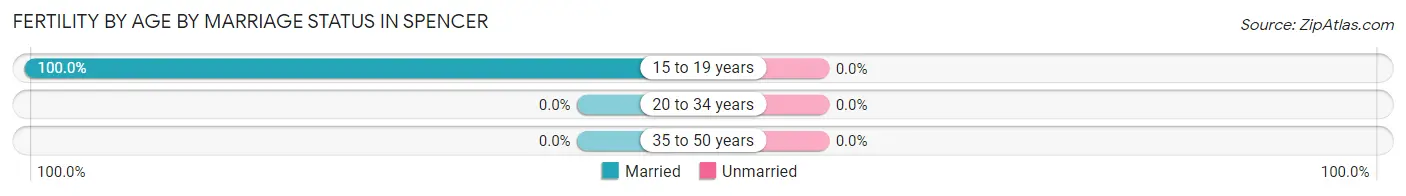
| Age Bracket | Married | Unmarried |
| 15 to 19 years | 22 (100.0%) | 0 (0.0%) |
| 20 to 34 years | 0 (0.0%) | 0 (0.0%) |
| 35 to 50 years | 0 (0.0%) | 0 (0.0%) |
| Total | 22 (100.0%) | 0 (0.0%) |
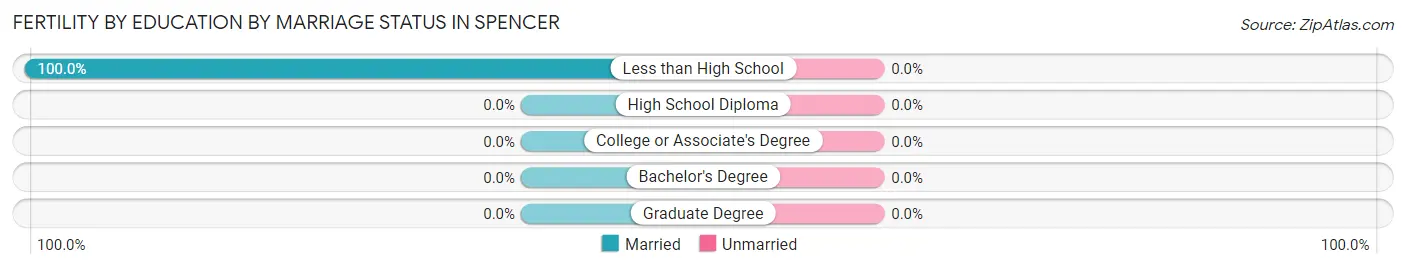
Fertility by Education in Spencer
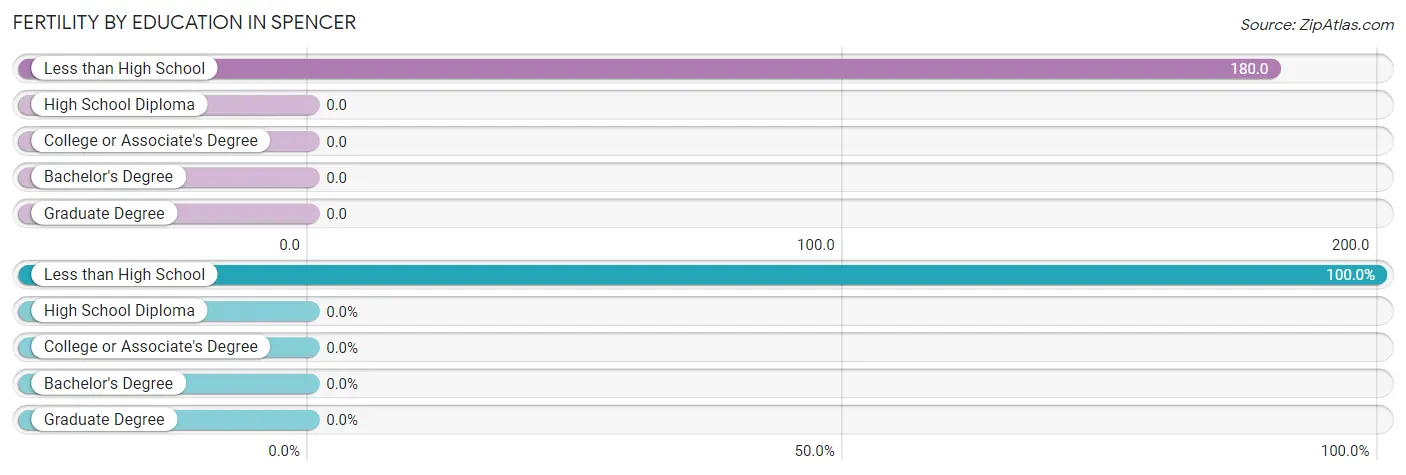
| Educational Attainment | Women with Births | Births / 1,000 Women |
| Less than High School | 22 (100.0%) | 180.0 |
| High School Diploma | 0 (0.0%) | 0.0 |
| College or Associate's Degree | 0 (0.0%) | 0.0 |
| Bachelor's Degree | 0 (0.0%) | 0.0 |
| Graduate Degree | 0 (0.0%) | 0.0 |
| Total | 22 (100.0%) | 61.0 |
Fertility by Education by Marriage Status in Spencer
| Educational Attainment | Married | Unmarried |
| Less than High School | 22 (100.0%) | 0 (0.0%) |
| High School Diploma | 0 (0.0%) | 0 (0.0%) |
| College or Associate's Degree | 0 (0.0%) | 0 (0.0%) |
| Bachelor's Degree | 0 (0.0%) | 0 (0.0%) |
| Graduate Degree | 0 (0.0%) | 0 (0.0%) |
| Total | 22 (100.0%) | 0 (0.0%) |
Employment Characteristics in Spencer
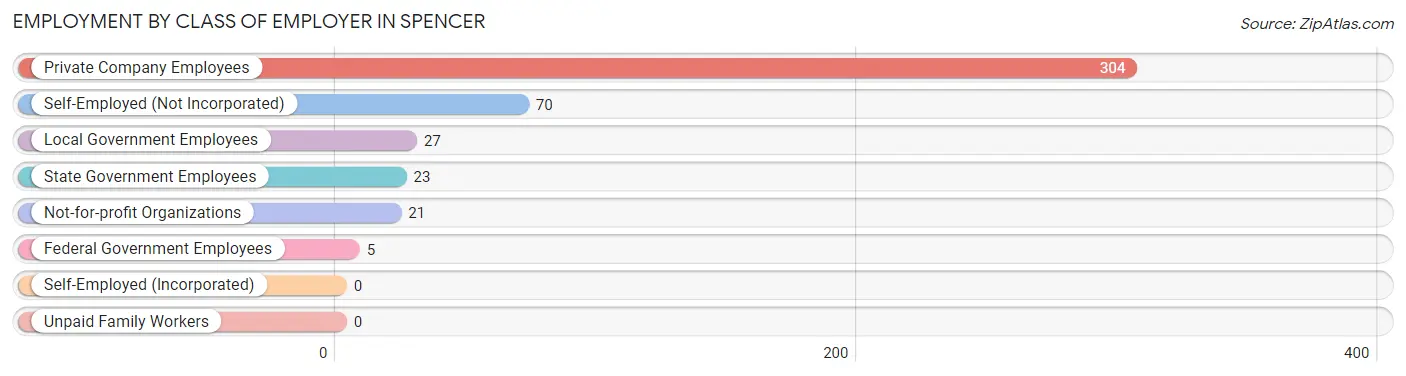
Employment by Class of Employer in Spencer
Among the 450 employed individuals in Spencer, private company employees (304 | 67.6%), self-employed (not incorporated) (70 | 15.6%), and local government employees (27 | 6.0%) make up the most common classes of employment.
| Employer Class | # Employees | % Employees |
| Private Company Employees | 304 | 67.6% |
| Self-Employed (Incorporated) | 0 | 0.0% |
| Self-Employed (Not Incorporated) | 70 | 15.6% |
| Not-for-profit Organizations | 21 | 4.7% |
| Local Government Employees | 27 | 6.0% |
| State Government Employees | 23 | 5.1% |
| Federal Government Employees | 5 | 1.1% |
| Unpaid Family Workers | 0 | 0.0% |
| Total | 450 | 100.0% |
Employment Status by Age in Spencer
According to the labor force statistics for Spencer, out of the total population over 16 years of age (1,737), 34.1% or 592 individuals are in the labor force, with 24.0% or 142 of them unemployed. The age group with the highest labor force participation rate is 20 to 24 years, with 78.0% or 131 individuals in the labor force. Within the labor force, the 30 to 34 years age range has the highest percentage of unemployed individuals, with 40.3% or 25 of them being unemployed.
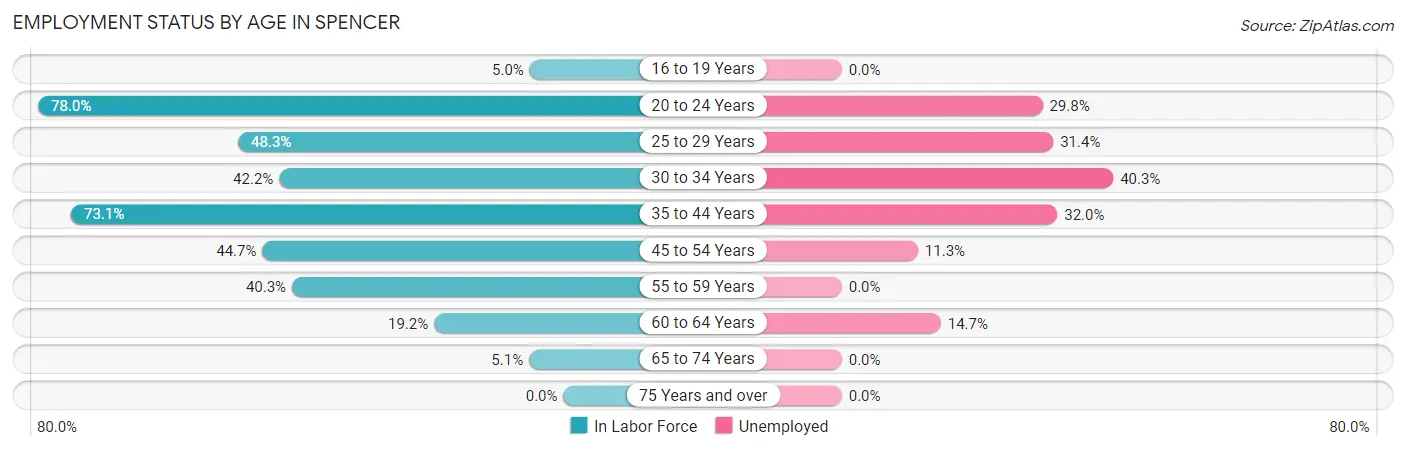
| Age Bracket | In Labor Force | Unemployed |
| 16 to 19 Years | 5 (5.0%) | 0 (0.0%) |
| 20 to 24 Years | 131 (78.0%) | 39 (29.8%) |
| 25 to 29 Years | 70 (48.3%) | 22 (31.4%) |
| 30 to 34 Years | 62 (42.2%) | 25 (40.3%) |
| 35 to 44 Years | 125 (73.1%) | 40 (32.0%) |
| 45 to 54 Years | 97 (44.7%) | 11 (11.3%) |
| 55 to 59 Years | 56 (40.3%) | 0 (0.0%) |
| 60 to 64 Years | 34 (19.2%) | 5 (14.7%) |
| 65 to 74 Years | 12 (5.1%) | 0 (0.0%) |
| 75 Years and over | 0 (0.0%) | 0 (0.0%) |
| Total | 592 (34.1%) | 142 (24.0%) |
Employment Status by Educational Attainment in Spencer
According to labor force statistics for Spencer, 44.6% of individuals (444) out of the total population between 25 and 64 years of age (996) are in the labor force, with 23.2% or 103 of them being unemployed. The group with the highest labor force participation rate are those with the educational attainment of bachelor's degree or higher, with 68.6% or 59 individuals in the labor force. Within the labor force, individuals with less than high school education have the highest percentage of unemployment, with 71.0% or 22 of them being unemployed.
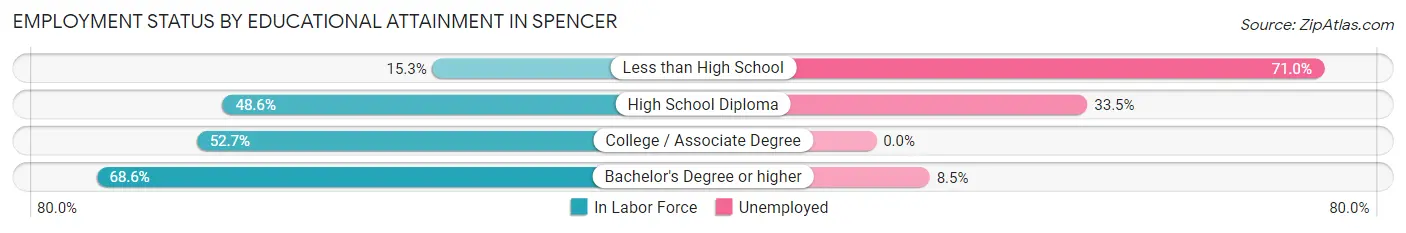
| Educational Attainment | In Labor Force | Unemployed |
| Less than High School | 31 (15.3%) | 143 (71.0%) |
| High School Diploma | 227 (48.6%) | 156 (33.5%) |
| College / Associate Degree | 127 (52.7%) | 0 (0.0%) |
| Bachelor's Degree or higher | 59 (68.6%) | 7 (8.5%) |
| Total | 444 (44.6%) | 231 (23.2%) |
Employment Occupations by Sex in Spencer
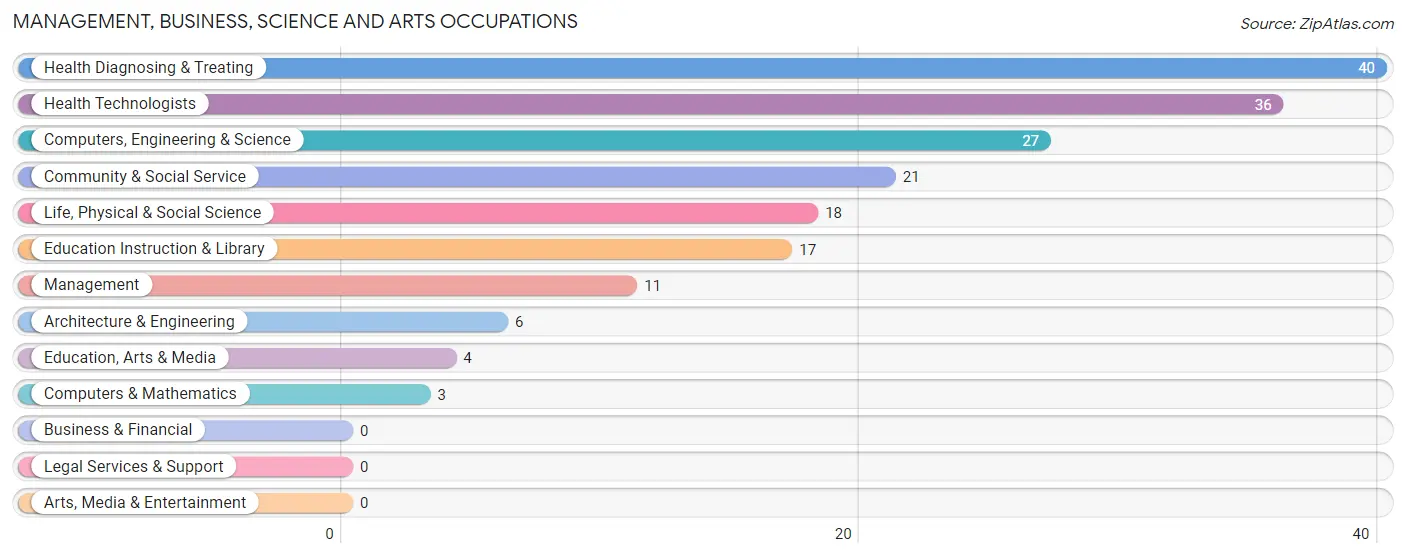
Management, Business, Science and Arts Occupations
The most common Management, Business, Science and Arts occupations in Spencer are Health Diagnosing & Treating (40 | 8.9%), Health Technologists (36 | 8.0%), Computers, Engineering & Science (27 | 6.0%), Community & Social Service (21 | 4.7%), and Life, Physical & Social Science (18 | 4.0%).
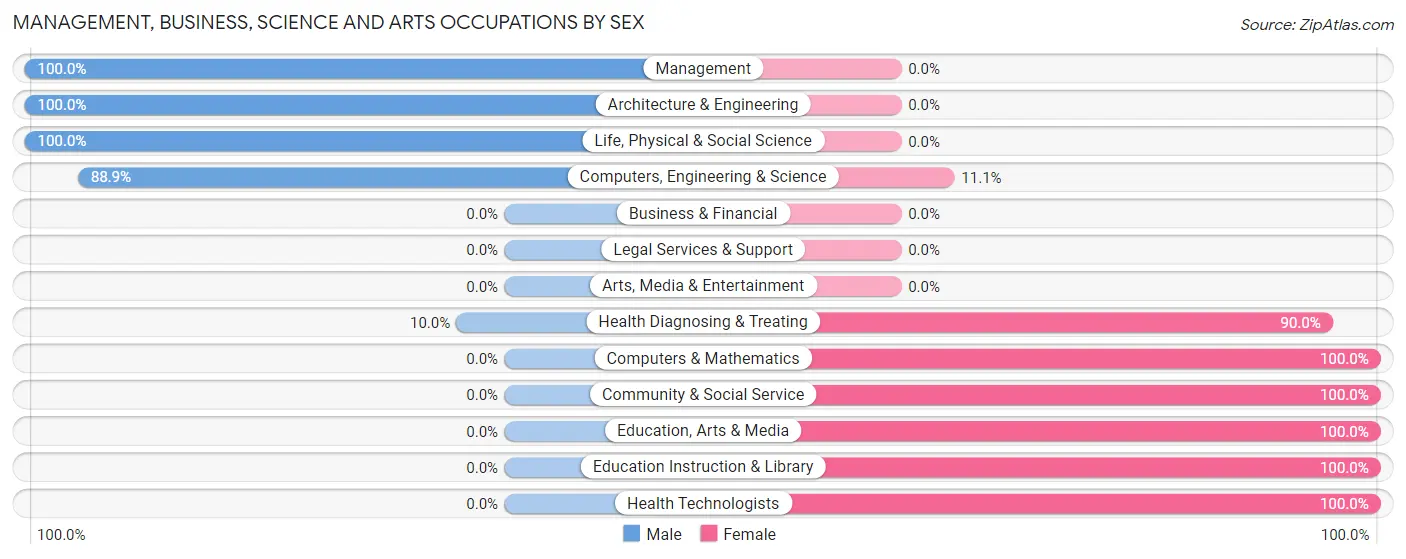
Management, Business, Science and Arts Occupations by Sex
Within the Management, Business, Science and Arts occupations in Spencer, the most male-oriented occupations are Management (100.0%), Architecture & Engineering (100.0%), and Life, Physical & Social Science (100.0%), while the most female-oriented occupations are Computers & Mathematics (100.0%), Community & Social Service (100.0%), and Education, Arts & Media (100.0%).
| Occupation | Male | Female |
| Management | 11 (100.0%) | 0 (0.0%) |
| Business & Financial | 0 (0.0%) | 0 (0.0%) |
| Computers, Engineering & Science | 24 (88.9%) | 3 (11.1%) |
| Computers & Mathematics | 0 (0.0%) | 3 (100.0%) |
| Architecture & Engineering | 6 (100.0%) | 0 (0.0%) |
| Life, Physical & Social Science | 18 (100.0%) | 0 (0.0%) |
| Community & Social Service | 0 (0.0%) | 21 (100.0%) |
| Education, Arts & Media | 0 (0.0%) | 4 (100.0%) |
| Legal Services & Support | 0 (0.0%) | 0 (0.0%) |
| Education Instruction & Library | 0 (0.0%) | 17 (100.0%) |
| Arts, Media & Entertainment | 0 (0.0%) | 0 (0.0%) |
| Health Diagnosing & Treating | 4 (10.0%) | 36 (90.0%) |
| Health Technologists | 0 (0.0%) | 36 (100.0%) |
| Total (Category) | 39 (39.4%) | 60 (60.6%) |
| Total (Overall) | 282 (62.7%) | 168 (37.3%) |
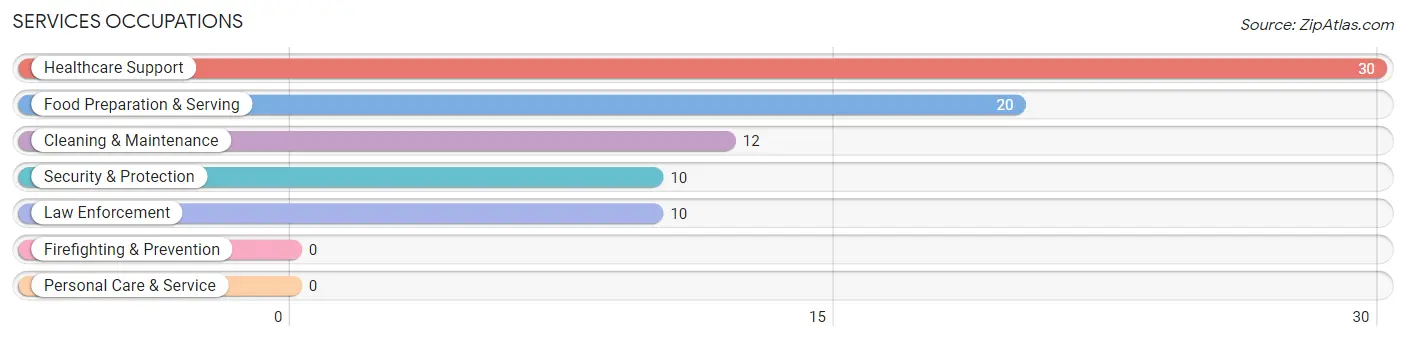
Services Occupations
The most common Services occupations in Spencer are Healthcare Support (30 | 6.7%), Food Preparation & Serving (20 | 4.4%), Cleaning & Maintenance (12 | 2.7%), Security & Protection (10 | 2.2%), and Law Enforcement (10 | 2.2%).
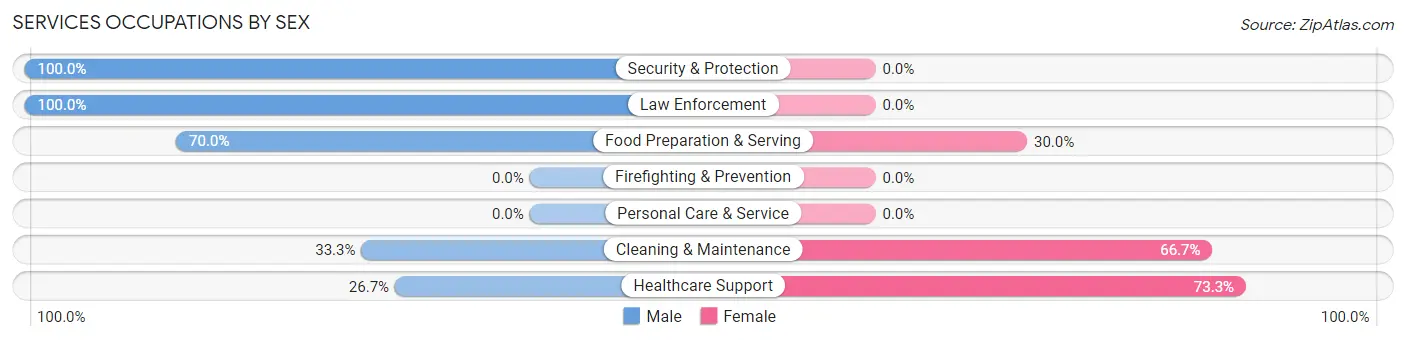
Services Occupations by Sex
Within the Services occupations in Spencer, the most male-oriented occupations are Security & Protection (100.0%), Law Enforcement (100.0%), and Food Preparation & Serving (70.0%), while the most female-oriented occupations are Healthcare Support (73.3%), Cleaning & Maintenance (66.7%), and Food Preparation & Serving (30.0%).
| Occupation | Male | Female |
| Healthcare Support | 8 (26.7%) | 22 (73.3%) |
| Security & Protection | 10 (100.0%) | 0 (0.0%) |
| Firefighting & Prevention | 0 (0.0%) | 0 (0.0%) |
| Law Enforcement | 10 (100.0%) | 0 (0.0%) |
| Food Preparation & Serving | 14 (70.0%) | 6 (30.0%) |
| Cleaning & Maintenance | 4 (33.3%) | 8 (66.7%) |
| Personal Care & Service | 0 (0.0%) | 0 (0.0%) |
| Total (Category) | 36 (50.0%) | 36 (50.0%) |
| Total (Overall) | 282 (62.7%) | 168 (37.3%) |
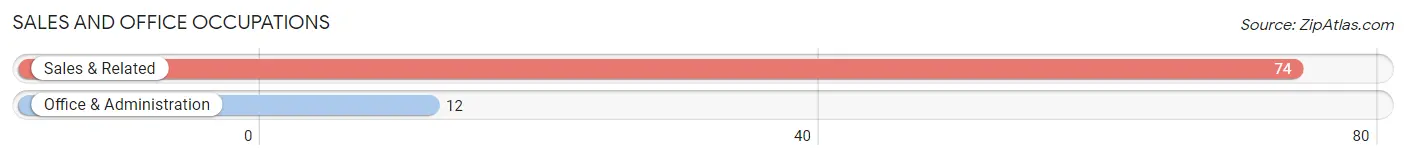
Sales and Office Occupations
The most common Sales and Office occupations in Spencer are Sales & Related (74 | 16.4%), and Office & Administration (12 | 2.7%).
Sales and Office Occupations by Sex
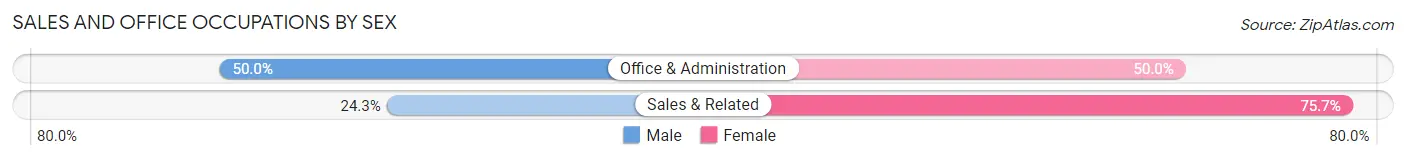
| Occupation | Male | Female |
| Sales & Related | 18 (24.3%) | 56 (75.7%) |
| Office & Administration | 6 (50.0%) | 6 (50.0%) |
| Total (Category) | 24 (27.9%) | 62 (72.1%) |
| Total (Overall) | 282 (62.7%) | 168 (37.3%) |
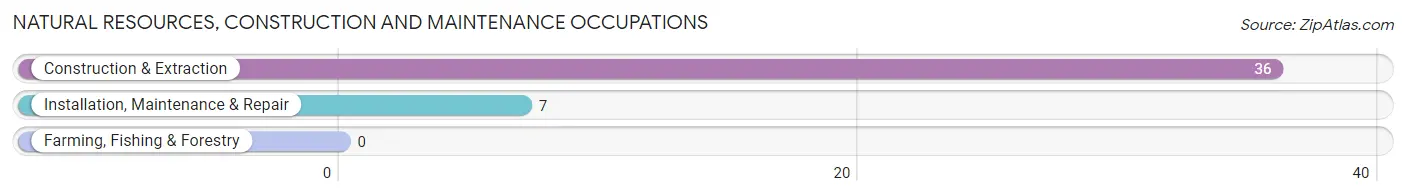
Natural Resources, Construction and Maintenance Occupations
The most common Natural Resources, Construction and Maintenance occupations in Spencer are Construction & Extraction (36 | 8.0%), and Installation, Maintenance & Repair (7 | 1.6%).
Natural Resources, Construction and Maintenance Occupations by Sex
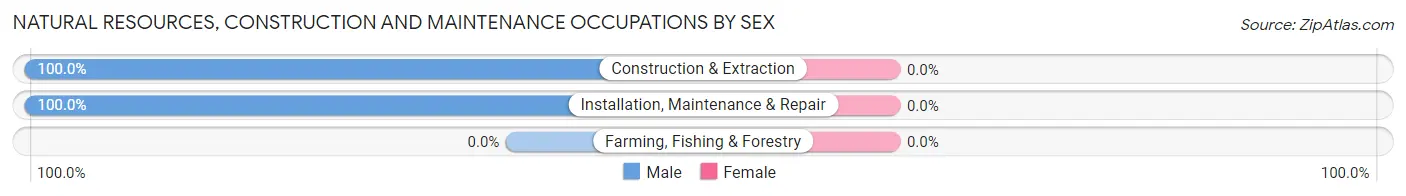
| Occupation | Male | Female |
| Farming, Fishing & Forestry | 0 (0.0%) | 0 (0.0%) |
| Construction & Extraction | 36 (100.0%) | 0 (0.0%) |
| Installation, Maintenance & Repair | 7 (100.0%) | 0 (0.0%) |
| Total (Category) | 43 (100.0%) | 0 (0.0%) |
| Total (Overall) | 282 (62.7%) | 168 (37.3%) |
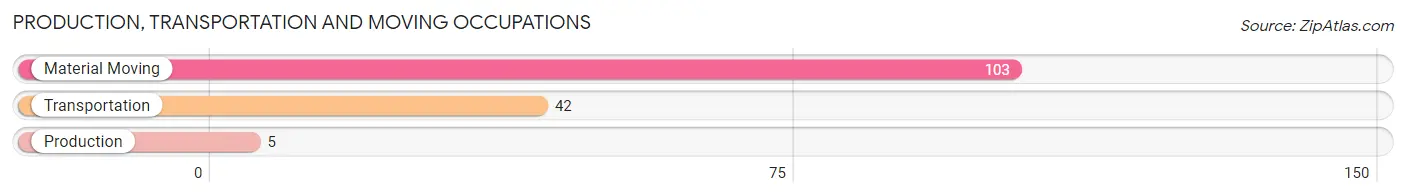
Production, Transportation and Moving Occupations
The most common Production, Transportation and Moving occupations in Spencer are Material Moving (103 | 22.9%), Transportation (42 | 9.3%), and Production (5 | 1.1%).
Production, Transportation and Moving Occupations by Sex
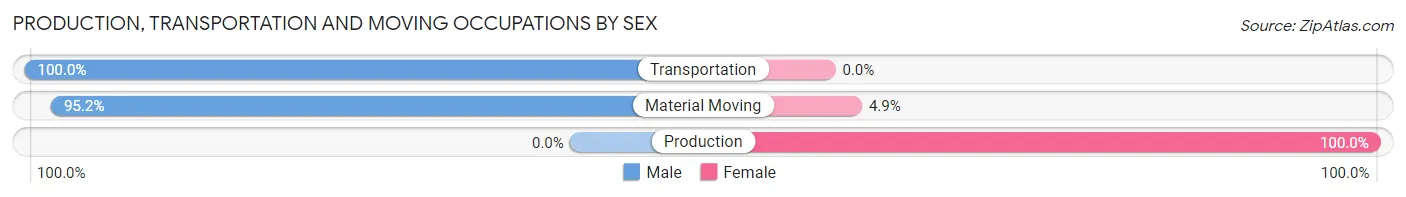
| Occupation | Male | Female |
| Production | 0 (0.0%) | 5 (100.0%) |
| Transportation | 42 (100.0%) | 0 (0.0%) |
| Material Moving | 98 (95.2%) | 5 (4.9%) |
| Total (Category) | 140 (93.3%) | 10 (6.7%) |
| Total (Overall) | 282 (62.7%) | 168 (37.3%) |
Employment Industries by Sex in Spencer
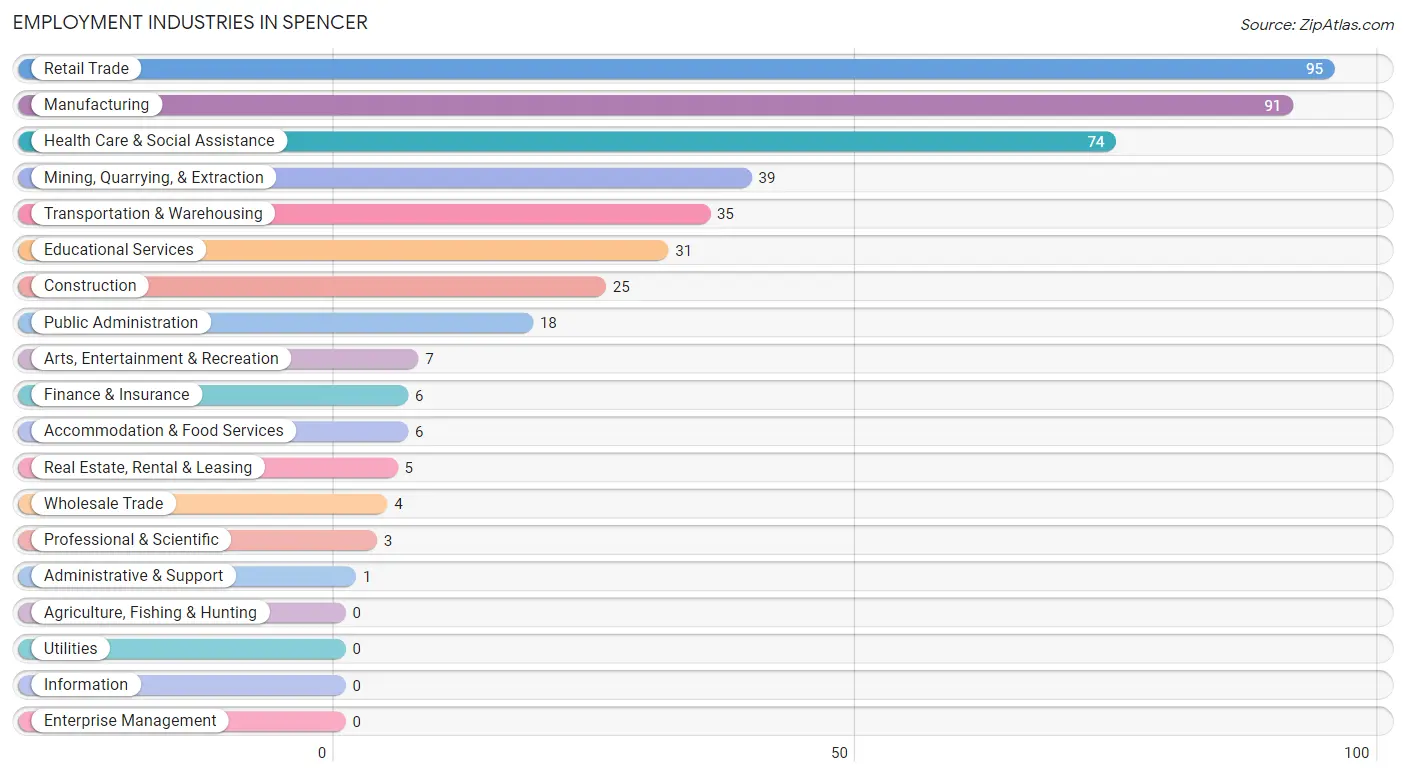
Employment Industries in Spencer
The major employment industries in Spencer include Retail Trade (95 | 21.1%), Manufacturing (91 | 20.2%), Health Care & Social Assistance (74 | 16.4%), Mining, Quarrying, & Extraction (39 | 8.7%), and Transportation & Warehousing (35 | 7.8%).
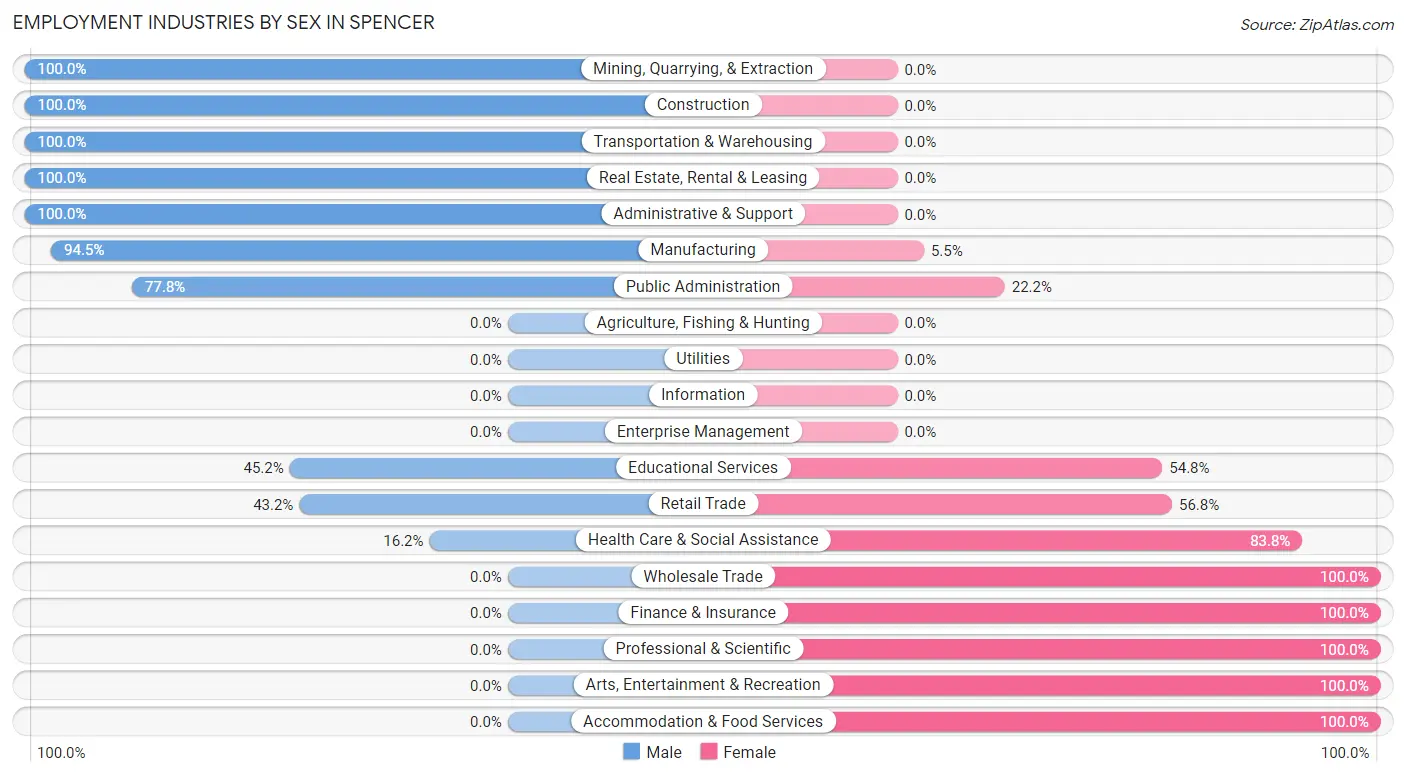
Employment Industries by Sex in Spencer
The Spencer industries that see more men than women are Mining, Quarrying, & Extraction (100.0%), Construction (100.0%), and Transportation & Warehousing (100.0%), whereas the industries that tend to have a higher number of women are Wholesale Trade (100.0%), Finance & Insurance (100.0%), and Professional & Scientific (100.0%).
| Industry | Male | Female |
| Agriculture, Fishing & Hunting | 0 (0.0%) | 0 (0.0%) |
| Mining, Quarrying, & Extraction | 39 (100.0%) | 0 (0.0%) |
| Construction | 25 (100.0%) | 0 (0.0%) |
| Manufacturing | 86 (94.5%) | 5 (5.5%) |
| Wholesale Trade | 0 (0.0%) | 4 (100.0%) |
| Retail Trade | 41 (43.2%) | 54 (56.8%) |
| Transportation & Warehousing | 35 (100.0%) | 0 (0.0%) |
| Utilities | 0 (0.0%) | 0 (0.0%) |
| Information | 0 (0.0%) | 0 (0.0%) |
| Finance & Insurance | 0 (0.0%) | 6 (100.0%) |
| Real Estate, Rental & Leasing | 5 (100.0%) | 0 (0.0%) |
| Professional & Scientific | 0 (0.0%) | 3 (100.0%) |
| Enterprise Management | 0 (0.0%) | 0 (0.0%) |
| Administrative & Support | 1 (100.0%) | 0 (0.0%) |
| Educational Services | 14 (45.2%) | 17 (54.8%) |
| Health Care & Social Assistance | 12 (16.2%) | 62 (83.8%) |
| Arts, Entertainment & Recreation | 0 (0.0%) | 7 (100.0%) |
| Accommodation & Food Services | 0 (0.0%) | 6 (100.0%) |
| Public Administration | 14 (77.8%) | 4 (22.2%) |
| Total | 282 (62.7%) | 168 (37.3%) |
Education in Spencer
School Enrollment in Spencer
The most common levels of schooling among the 254 students in Spencer are elementary school (90 | 35.4%), high school (79 | 31.1%), and nursery / preschool (41 | 16.1%).
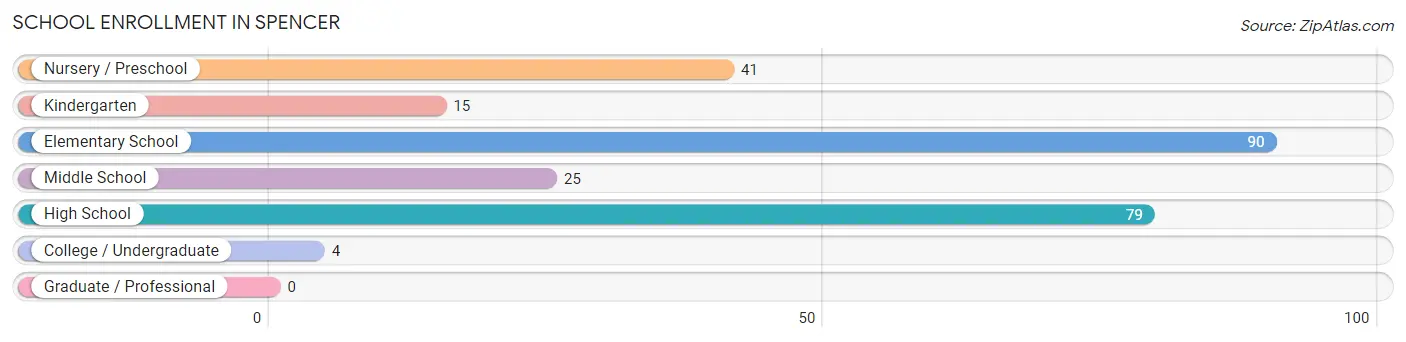
| School Level | # Students | % Students |
| Nursery / Preschool | 41 | 16.1% |
| Kindergarten | 15 | 5.9% |
| Elementary School | 90 | 35.4% |
| Middle School | 25 | 9.8% |
| High School | 79 | 31.1% |
| College / Undergraduate | 4 | 1.6% |
| Graduate / Professional | 0 | 0.0% |
| Total | 254 | 100.0% |
School Enrollment by Age by Funding Source in Spencer
Out of a total of 254 students who are enrolled in schools in Spencer, 17 (6.7%) attend a private institution, while the remaining 237 (93.3%) are enrolled in public schools. The age group of 15 to 17 year olds has the highest likelihood of being enrolled in private schools, with 8 (34.8% in the age bracket) enrolled. Conversely, the age group of 5 to 9 year old has the lowest likelihood of being enrolled in a private school, with 134 (100.0% in the age bracket) attending a public institution.
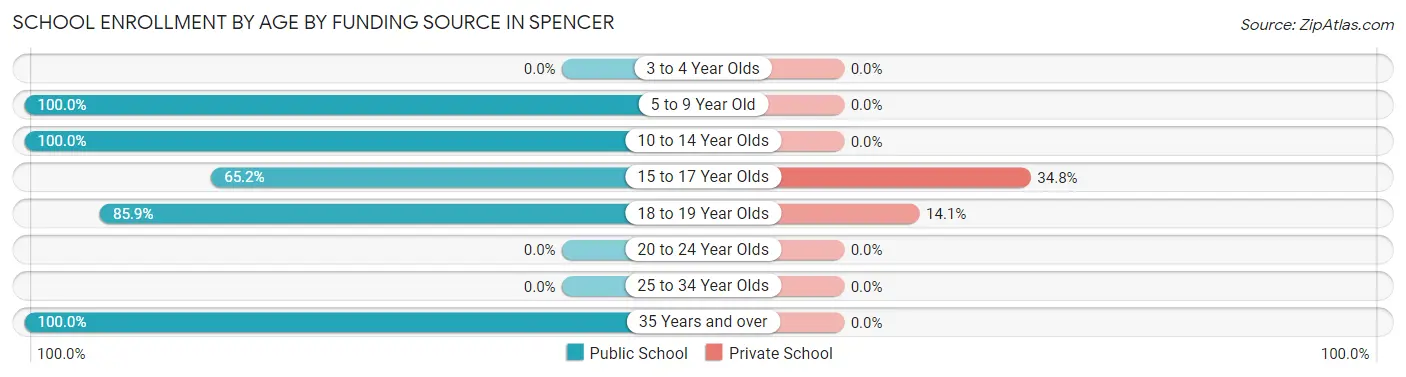
| Age Bracket | Public School | Private School |
| 3 to 4 Year Olds | 0 (0.0%) | 0 (0.0%) |
| 5 to 9 Year Old | 134 (100.0%) | 0 (0.0%) |
| 10 to 14 Year Olds | 29 (100.0%) | 0 (0.0%) |
| 15 to 17 Year Olds | 15 (65.2%) | 8 (34.8%) |
| 18 to 19 Year Olds | 55 (85.9%) | 9 (14.1%) |
| 20 to 24 Year Olds | 0 (0.0%) | 0 (0.0%) |
| 25 to 34 Year Olds | 0 (0.0%) | 0 (0.0%) |
| 35 Years and over | 4 (100.0%) | 0 (0.0%) |
| Total | 237 (93.3%) | 17 (6.7%) |
Educational Attainment by Field of Study in Spencer
Education (49 | 35.5%), business (19 | 13.8%), arts & humanities (17 | 12.3%), communications (14 | 10.1%), and science & technology (11 | 8.0%) are the most common fields of study among 138 individuals in Spencer who have obtained a bachelor's degree or higher.
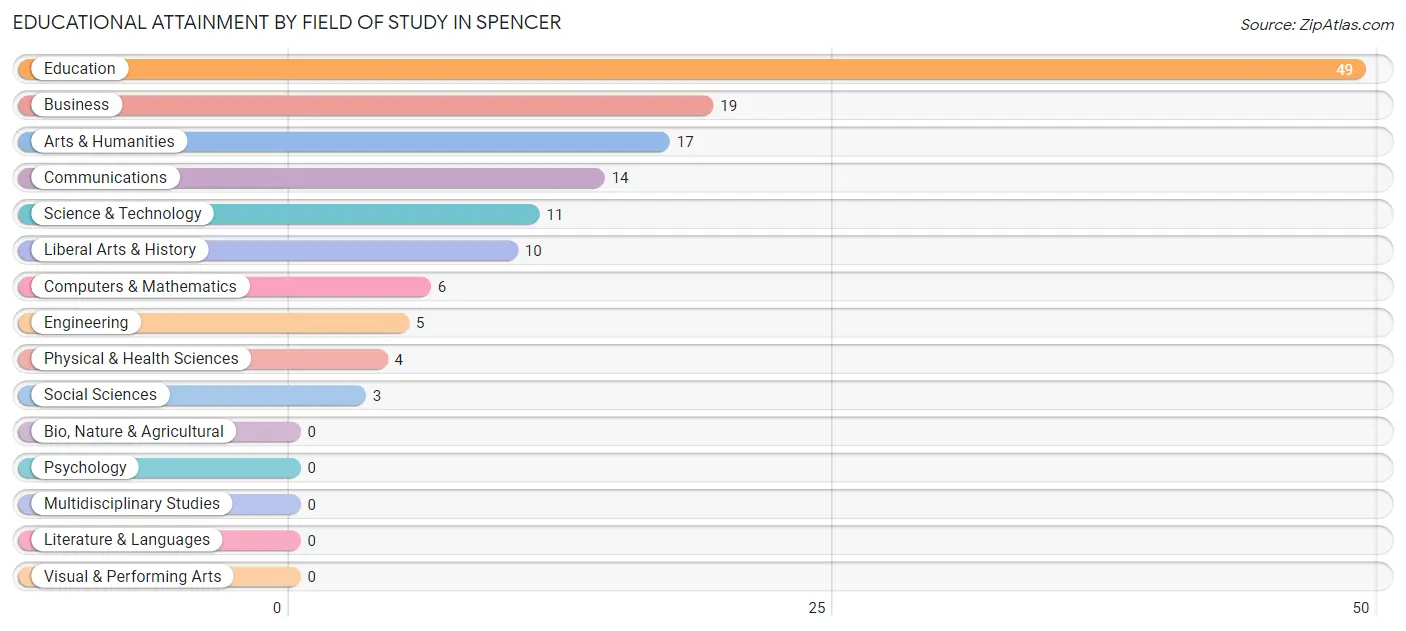
| Field of Study | # Graduates | % Graduates |
| Computers & Mathematics | 6 | 4.3% |
| Bio, Nature & Agricultural | 0 | 0.0% |
| Physical & Health Sciences | 4 | 2.9% |
| Psychology | 0 | 0.0% |
| Social Sciences | 3 | 2.2% |
| Engineering | 5 | 3.6% |
| Multidisciplinary Studies | 0 | 0.0% |
| Science & Technology | 11 | 8.0% |
| Business | 19 | 13.8% |
| Education | 49 | 35.5% |
| Literature & Languages | 0 | 0.0% |
| Liberal Arts & History | 10 | 7.2% |
| Visual & Performing Arts | 0 | 0.0% |
| Communications | 14 | 10.1% |
| Arts & Humanities | 17 | 12.3% |
| Total | 138 | 100.0% |
Transportation & Commute in Spencer
Vehicle Availability by Sex in Spencer
The most prevalent vehicle ownership categories in Spencer are males with 1 vehicle (90, accounting for 32.0%) and females with 1 vehicle (65, making up 53.6%).
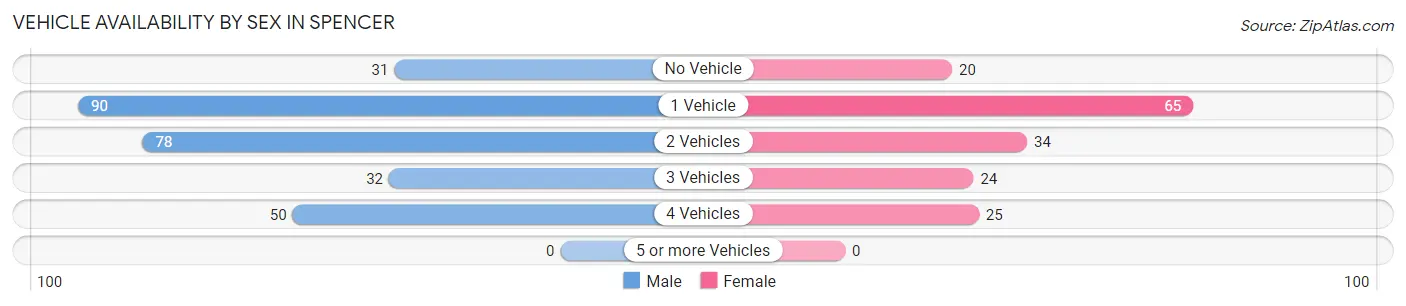
| Vehicles Available | Male | Female |
| No Vehicle | 31 (11.0%) | 20 (11.9%) |
| 1 Vehicle | 90 (32.0%) | 65 (38.7%) |
| 2 Vehicles | 78 (27.8%) | 34 (20.2%) |
| 3 Vehicles | 32 (11.4%) | 24 (14.3%) |
| 4 Vehicles | 50 (17.8%) | 25 (14.9%) |
| 5 or more Vehicles | 0 (0.0%) | 0 (0.0%) |
| Total | 281 (100.0%) | 168 (100.0%) |
Commute Time in Spencer
The most frequently occuring commute durations in Spencer are 5 to 9 minutes (159 commuters, 42.6%), 30 to 34 minutes (39 commuters, 10.5%), and 10 to 14 minutes (34 commuters, 9.1%).
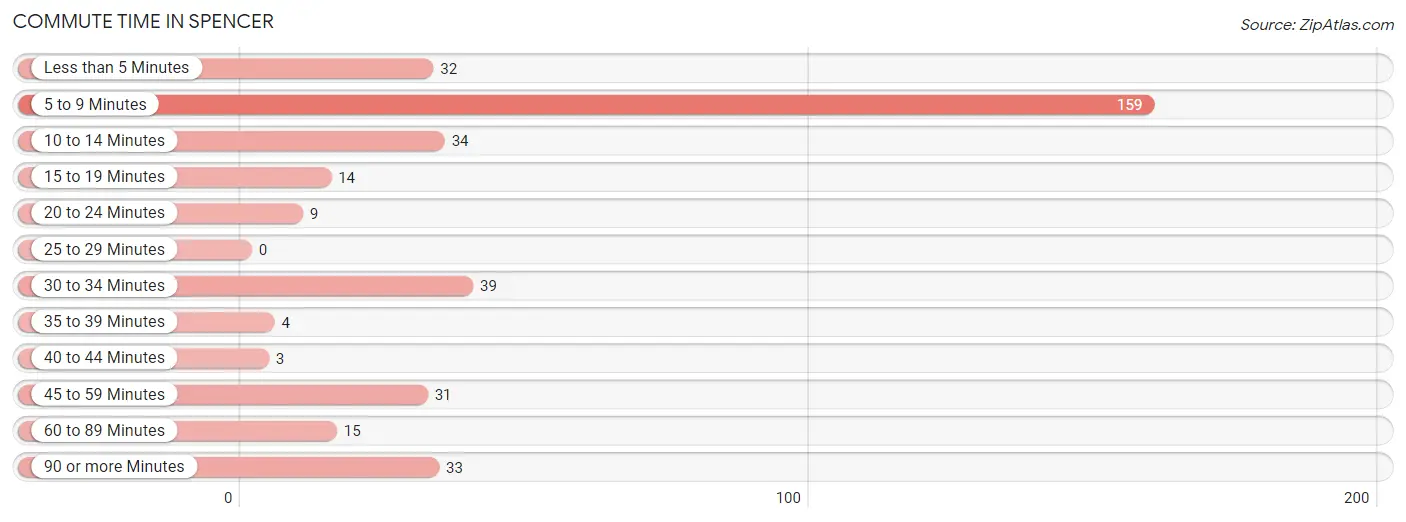
| Commute Time | # Commuters | % Commuters |
| Less than 5 Minutes | 32 | 8.6% |
| 5 to 9 Minutes | 159 | 42.6% |
| 10 to 14 Minutes | 34 | 9.1% |
| 15 to 19 Minutes | 14 | 3.7% |
| 20 to 24 Minutes | 9 | 2.4% |
| 25 to 29 Minutes | 0 | 0.0% |
| 30 to 34 Minutes | 39 | 10.5% |
| 35 to 39 Minutes | 4 | 1.1% |
| 40 to 44 Minutes | 3 | 0.8% |
| 45 to 59 Minutes | 31 | 8.3% |
| 60 to 89 Minutes | 15 | 4.0% |
| 90 or more Minutes | 33 | 8.8% |
Commute Time by Sex in Spencer
The most common commute times in Spencer are 5 to 9 minutes (54 commuters, 25.7%) for males and 5 to 9 minutes (105 commuters, 64.4%) for females.
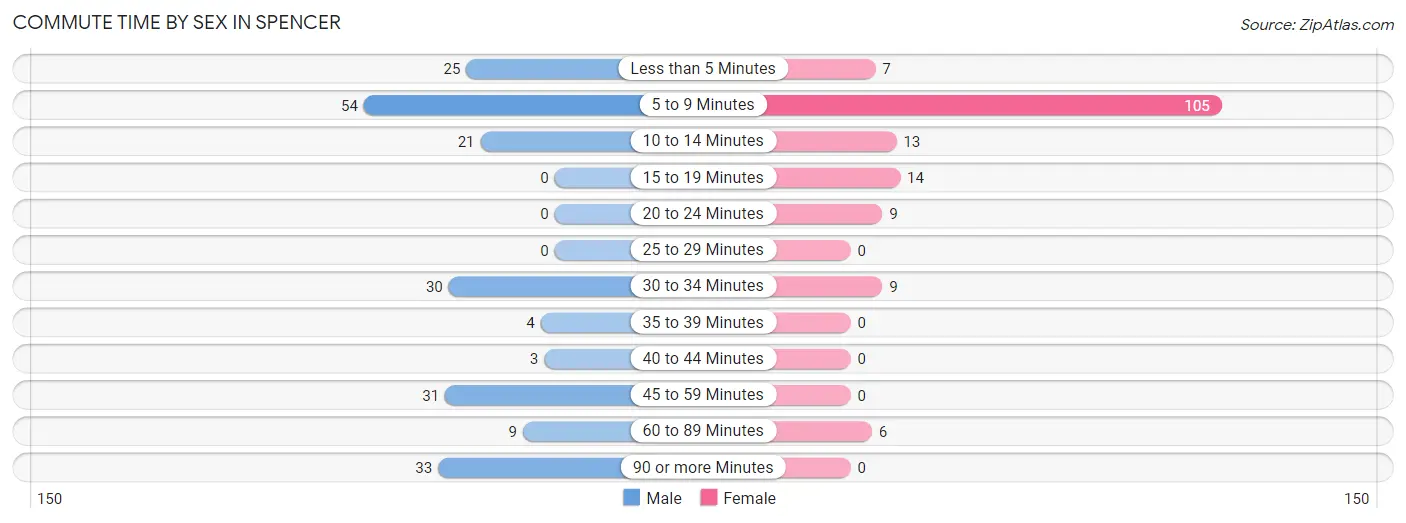
| Commute Time | Male | Female |
| Less than 5 Minutes | 25 (11.9%) | 7 (4.3%) |
| 5 to 9 Minutes | 54 (25.7%) | 105 (64.4%) |
| 10 to 14 Minutes | 21 (10.0%) | 13 (8.0%) |
| 15 to 19 Minutes | 0 (0.0%) | 14 (8.6%) |
| 20 to 24 Minutes | 0 (0.0%) | 9 (5.5%) |
| 25 to 29 Minutes | 0 (0.0%) | 0 (0.0%) |
| 30 to 34 Minutes | 30 (14.3%) | 9 (5.5%) |
| 35 to 39 Minutes | 4 (1.9%) | 0 (0.0%) |
| 40 to 44 Minutes | 3 (1.4%) | 0 (0.0%) |
| 45 to 59 Minutes | 31 (14.8%) | 0 (0.0%) |
| 60 to 89 Minutes | 9 (4.3%) | 6 (3.7%) |
| 90 or more Minutes | 33 (15.7%) | 0 (0.0%) |
Time of Departure to Work by Sex in Spencer
The most frequent times of departure to work in Spencer are 7:00 AM to 7:29 AM (48, 22.9%) for males and 9:00 AM to 9:59 AM (45, 27.6%) for females.
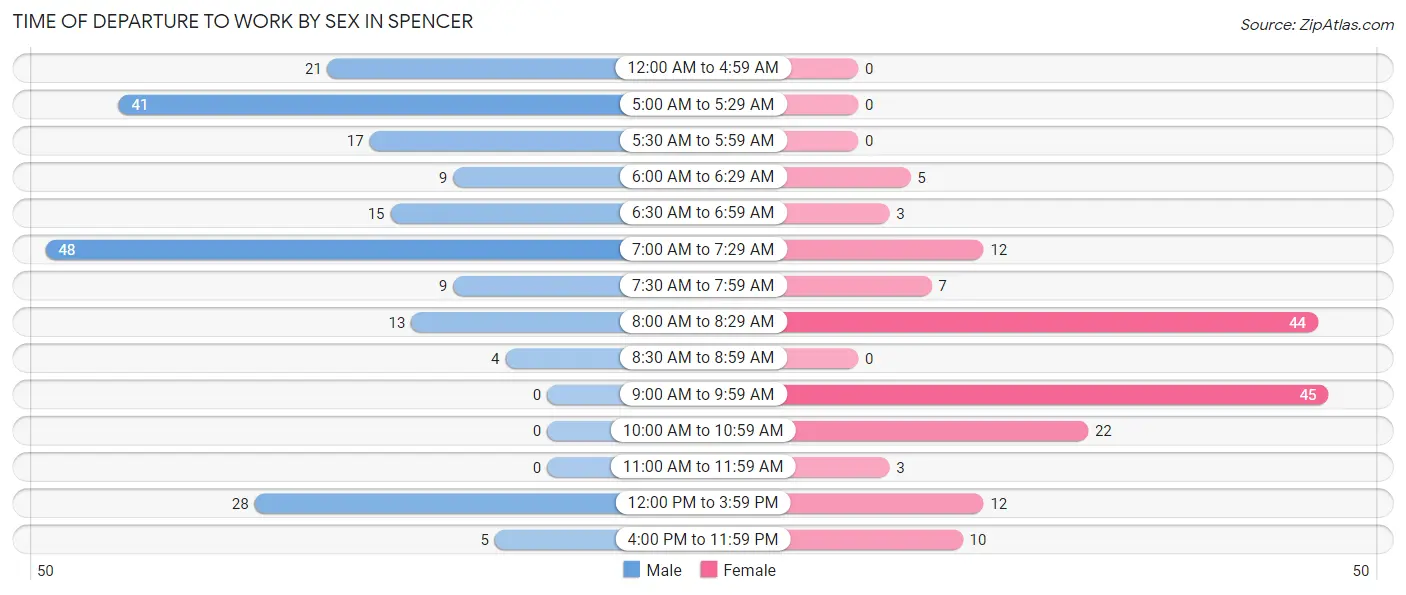
| Time of Departure | Male | Female |
| 12:00 AM to 4:59 AM | 21 (10.0%) | 0 (0.0%) |
| 5:00 AM to 5:29 AM | 41 (19.5%) | 0 (0.0%) |
| 5:30 AM to 5:59 AM | 17 (8.1%) | 0 (0.0%) |
| 6:00 AM to 6:29 AM | 9 (4.3%) | 5 (3.1%) |
| 6:30 AM to 6:59 AM | 15 (7.1%) | 3 (1.8%) |
| 7:00 AM to 7:29 AM | 48 (22.9%) | 12 (7.4%) |
| 7:30 AM to 7:59 AM | 9 (4.3%) | 7 (4.3%) |
| 8:00 AM to 8:29 AM | 13 (6.2%) | 44 (27.0%) |
| 8:30 AM to 8:59 AM | 4 (1.9%) | 0 (0.0%) |
| 9:00 AM to 9:59 AM | 0 (0.0%) | 45 (27.6%) |
| 10:00 AM to 10:59 AM | 0 (0.0%) | 22 (13.5%) |
| 11:00 AM to 11:59 AM | 0 (0.0%) | 3 (1.8%) |
| 12:00 PM to 3:59 PM | 28 (13.3%) | 12 (7.4%) |
| 4:00 PM to 11:59 PM | 5 (2.4%) | 10 (6.1%) |
| Total | 210 (100.0%) | 163 (100.0%) |
Housing Occupancy in Spencer
Occupancy by Ownership in Spencer
Of the total 892 dwellings in Spencer, owner-occupied units account for 358 (40.1%), while renter-occupied units make up 534 (59.9%).
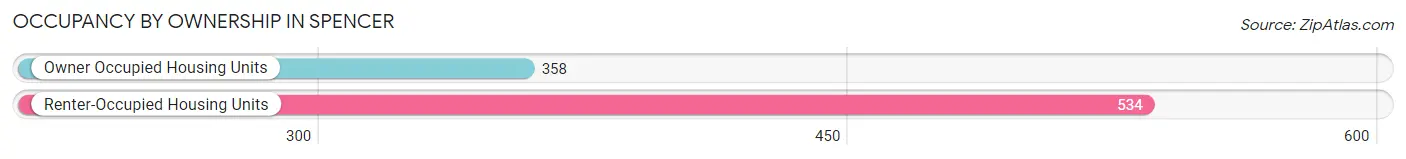
| Occupancy | # Housing Units | % Housing Units |
| Owner Occupied Housing Units | 358 | 40.1% |
| Renter-Occupied Housing Units | 534 | 59.9% |
| Total Occupied Housing Units | 892 | 100.0% |
Occupancy by Household Size in Spencer
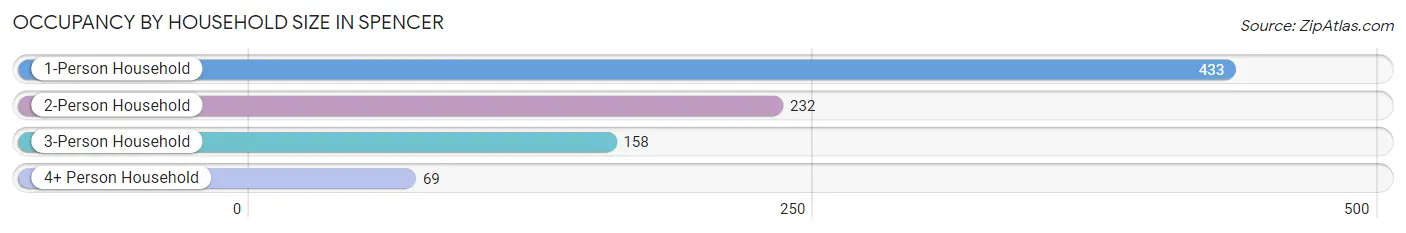
| Household Size | # Housing Units | % Housing Units |
| 1-Person Household | 433 | 48.5% |
| 2-Person Household | 232 | 26.0% |
| 3-Person Household | 158 | 17.7% |
| 4+ Person Household | 69 | 7.7% |
| Total Housing Units | 892 | 100.0% |
Occupancy by Ownership by Household Size in Spencer
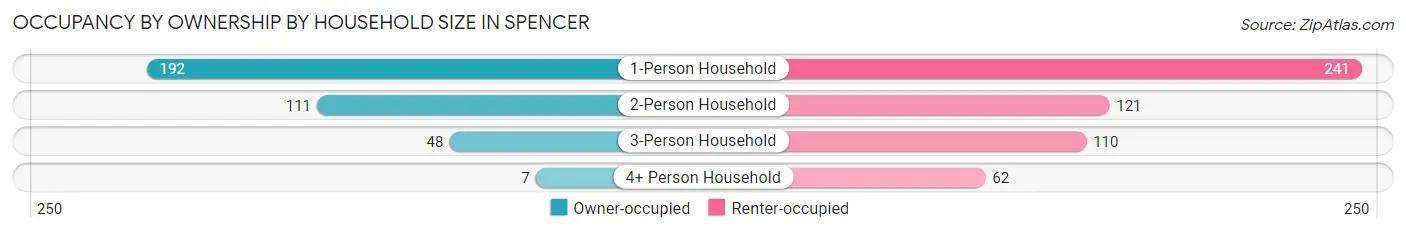
| Household Size | Owner-occupied | Renter-occupied |
| 1-Person Household | 192 (44.3%) | 241 (55.7%) |
| 2-Person Household | 111 (47.8%) | 121 (52.2%) |
| 3-Person Household | 48 (30.4%) | 110 (69.6%) |
| 4+ Person Household | 7 (10.1%) | 62 (89.9%) |
| Total Housing Units | 358 (40.1%) | 534 (59.9%) |
Occupancy by Educational Attainment in Spencer
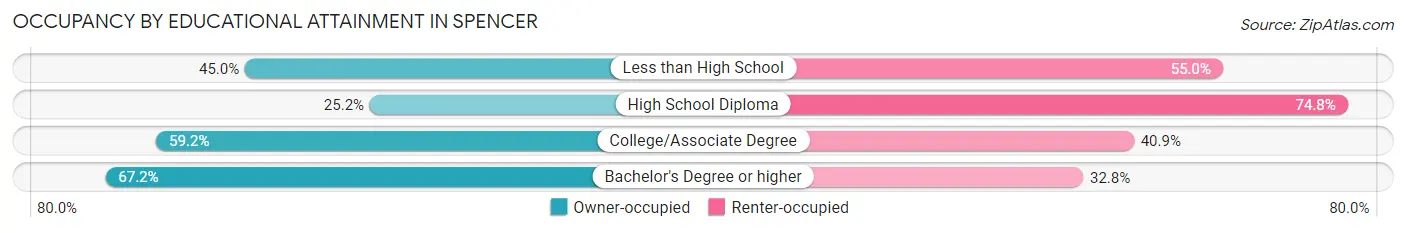
| Household Size | Owner-occupied | Renter-occupied |
| Less than High School | 77 (45.0%) | 94 (55.0%) |
| High School Diploma | 112 (25.2%) | 332 (74.8%) |
| College/Associate Degree | 126 (59.2%) | 87 (40.8%) |
| Bachelor's Degree or higher | 43 (67.2%) | 21 (32.8%) |
Occupancy by Age of Householder in Spencer
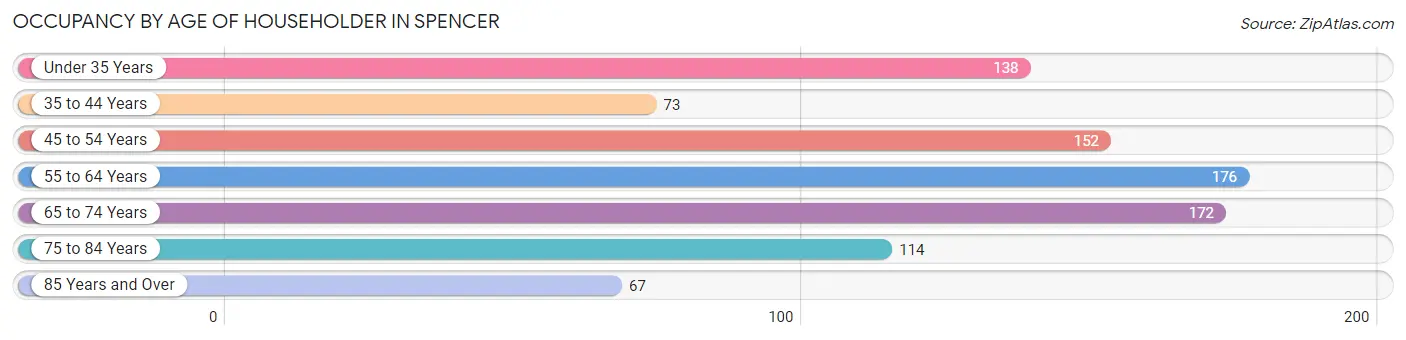
| Age Bracket | # Households | % Households |
| Under 35 Years | 138 | 15.5% |
| 35 to 44 Years | 73 | 8.2% |
| 45 to 54 Years | 152 | 17.0% |
| 55 to 64 Years | 176 | 19.7% |
| 65 to 74 Years | 172 | 19.3% |
| 75 to 84 Years | 114 | 12.8% |
| 85 Years and Over | 67 | 7.5% |
| Total | 892 | 100.0% |
Housing Finances in Spencer
Median Income by Occupancy in Spencer
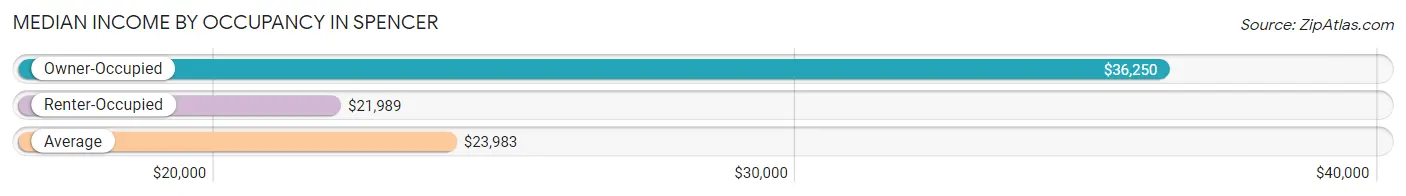
| Occupancy Type | # Households | Median Income |
| Owner-Occupied | 358 (40.1%) | $36,250 |
| Renter-Occupied | 534 (59.9%) | $21,989 |
| Average | 892 (100.0%) | $23,983 |
Occupancy by Householder Income Bracket in Spencer
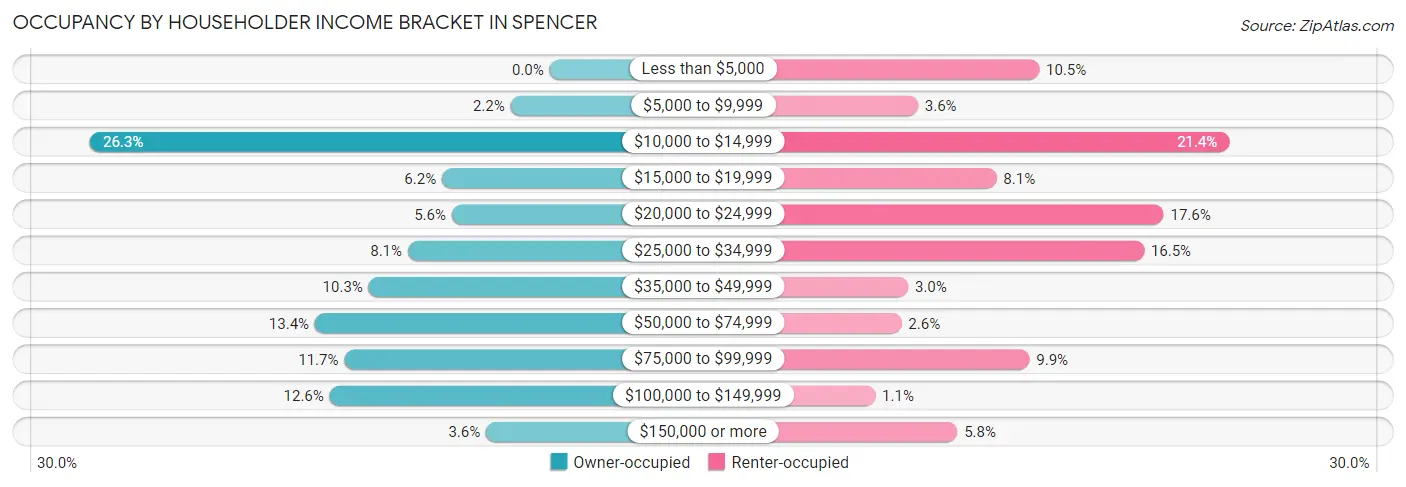
| Income Bracket | Owner-occupied | Renter-occupied |
| Less than $5,000 | 0 (0.0%) | 56 (10.5%) |
| $5,000 to $9,999 | 8 (2.2%) | 19 (3.6%) |
| $10,000 to $14,999 | 94 (26.3%) | 114 (21.3%) |
| $15,000 to $19,999 | 22 (6.1%) | 43 (8.1%) |
| $20,000 to $24,999 | 20 (5.6%) | 94 (17.6%) |
| $25,000 to $34,999 | 29 (8.1%) | 88 (16.5%) |
| $35,000 to $49,999 | 37 (10.3%) | 16 (3.0%) |
| $50,000 to $74,999 | 48 (13.4%) | 14 (2.6%) |
| $75,000 to $99,999 | 42 (11.7%) | 53 (9.9%) |
| $100,000 to $149,999 | 45 (12.6%) | 6 (1.1%) |
| $150,000 or more | 13 (3.6%) | 31 (5.8%) |
| Total | 358 (100.0%) | 534 (100.0%) |
Monthly Housing Cost Tiers in Spencer
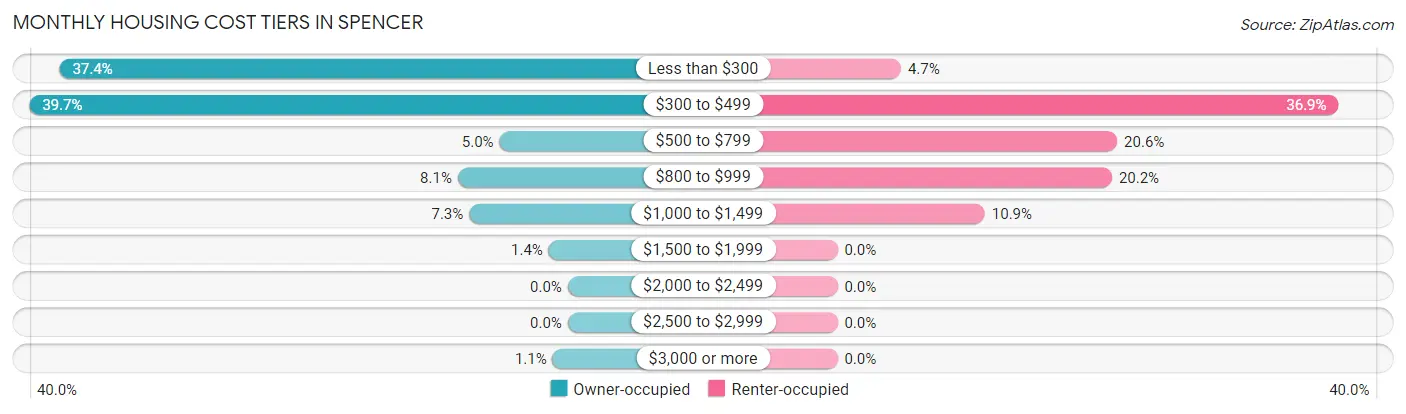
| Monthly Cost | Owner-occupied | Renter-occupied |
| Less than $300 | 134 (37.4%) | 25 (4.7%) |
| $300 to $499 | 142 (39.7%) | 197 (36.9%) |
| $500 to $799 | 18 (5.0%) | 110 (20.6%) |
| $800 to $999 | 29 (8.1%) | 108 (20.2%) |
| $1,000 to $1,499 | 26 (7.3%) | 58 (10.9%) |
| $1,500 to $1,999 | 5 (1.4%) | 0 (0.0%) |
| $2,000 to $2,499 | 0 (0.0%) | 0 (0.0%) |
| $2,500 to $2,999 | 0 (0.0%) | 0 (0.0%) |
| $3,000 or more | 4 (1.1%) | 0 (0.0%) |
| Total | 358 (100.0%) | 534 (100.0%) |
Physical Housing Characteristics in Spencer
Housing Structures in Spencer
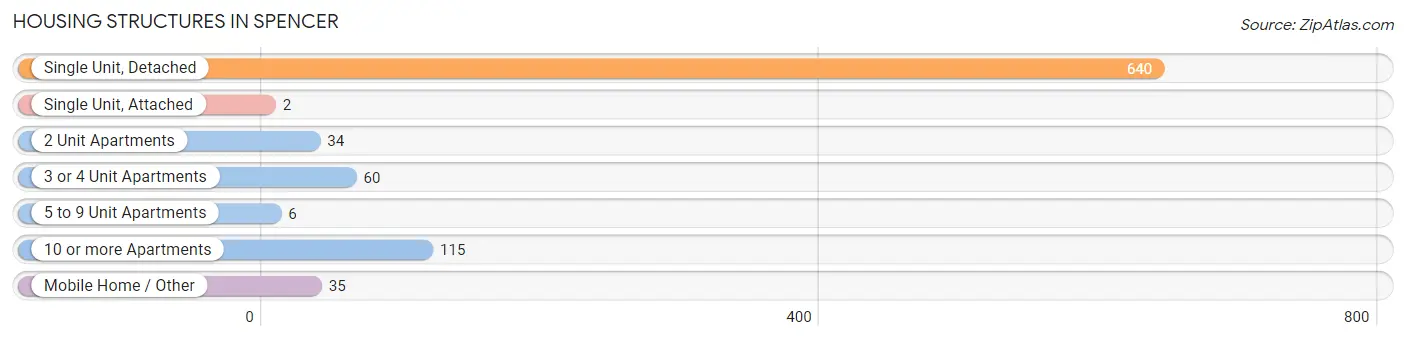
| Structure Type | # Housing Units | % Housing Units |
| Single Unit, Detached | 640 | 71.8% |
| Single Unit, Attached | 2 | 0.2% |
| 2 Unit Apartments | 34 | 3.8% |
| 3 or 4 Unit Apartments | 60 | 6.7% |
| 5 to 9 Unit Apartments | 6 | 0.7% |
| 10 or more Apartments | 115 | 12.9% |
| Mobile Home / Other | 35 | 3.9% |
| Total | 892 | 100.0% |
Housing Structures by Occupancy in Spencer
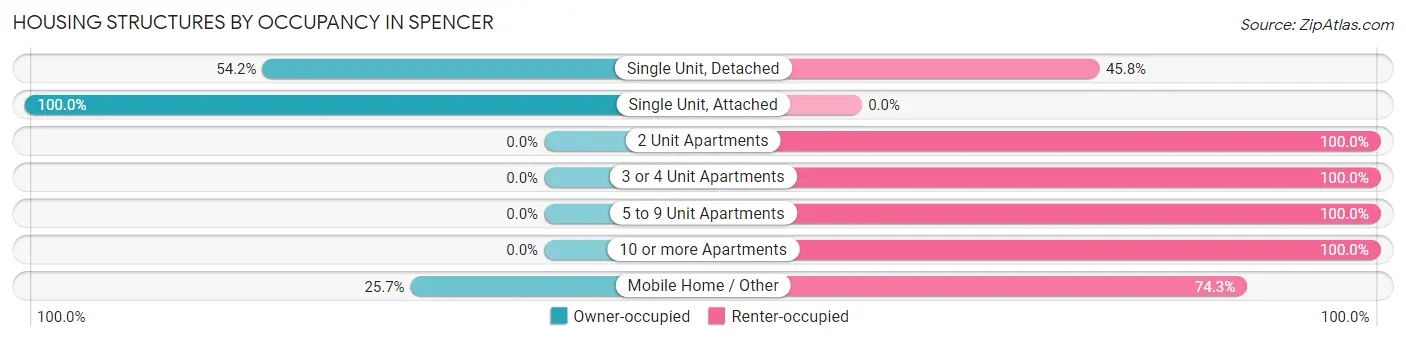
| Structure Type | Owner-occupied | Renter-occupied |
| Single Unit, Detached | 347 (54.2%) | 293 (45.8%) |
| Single Unit, Attached | 2 (100.0%) | 0 (0.0%) |
| 2 Unit Apartments | 0 (0.0%) | 34 (100.0%) |
| 3 or 4 Unit Apartments | 0 (0.0%) | 60 (100.0%) |
| 5 to 9 Unit Apartments | 0 (0.0%) | 6 (100.0%) |
| 10 or more Apartments | 0 (0.0%) | 115 (100.0%) |
| Mobile Home / Other | 9 (25.7%) | 26 (74.3%) |
| Total | 358 (40.1%) | 534 (59.9%) |
Housing Structures by Number of Rooms in Spencer
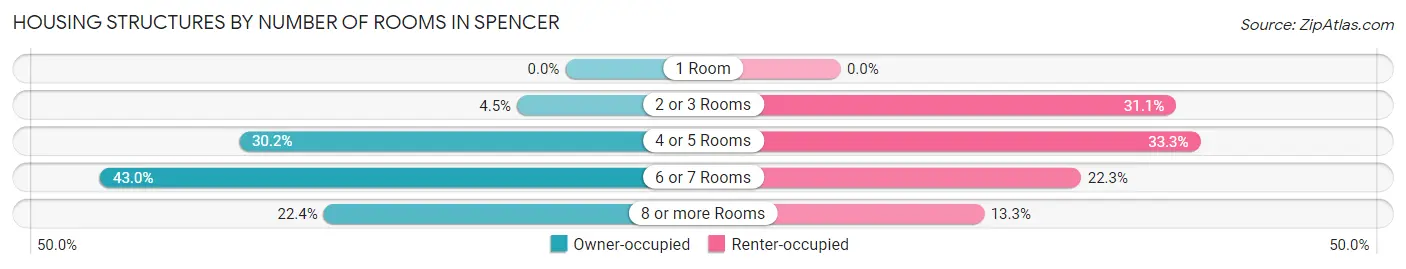
| Number of Rooms | Owner-occupied | Renter-occupied |
| 1 Room | 0 (0.0%) | 0 (0.0%) |
| 2 or 3 Rooms | 16 (4.5%) | 166 (31.1%) |
| 4 or 5 Rooms | 108 (30.2%) | 178 (33.3%) |
| 6 or 7 Rooms | 154 (43.0%) | 119 (22.3%) |
| 8 or more Rooms | 80 (22.4%) | 71 (13.3%) |
| Total | 358 (100.0%) | 534 (100.0%) |
Housing Structure by Heating Type in Spencer
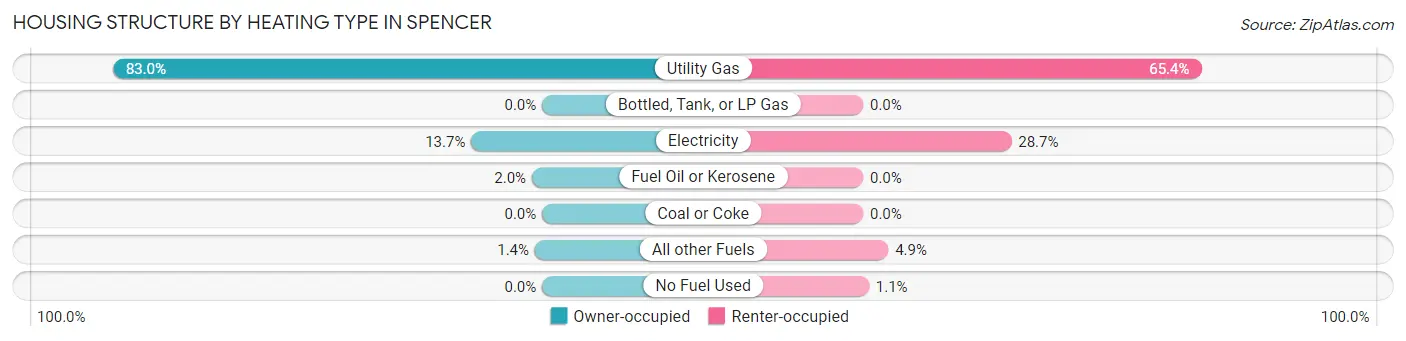
| Heating Type | Owner-occupied | Renter-occupied |
| Utility Gas | 297 (83.0%) | 349 (65.4%) |
| Bottled, Tank, or LP Gas | 0 (0.0%) | 0 (0.0%) |
| Electricity | 49 (13.7%) | 153 (28.6%) |
| Fuel Oil or Kerosene | 7 (2.0%) | 0 (0.0%) |
| Coal or Coke | 0 (0.0%) | 0 (0.0%) |
| All other Fuels | 5 (1.4%) | 26 (4.9%) |
| No Fuel Used | 0 (0.0%) | 6 (1.1%) |
| Total | 358 (100.0%) | 534 (100.0%) |
Household Vehicle Usage in Spencer
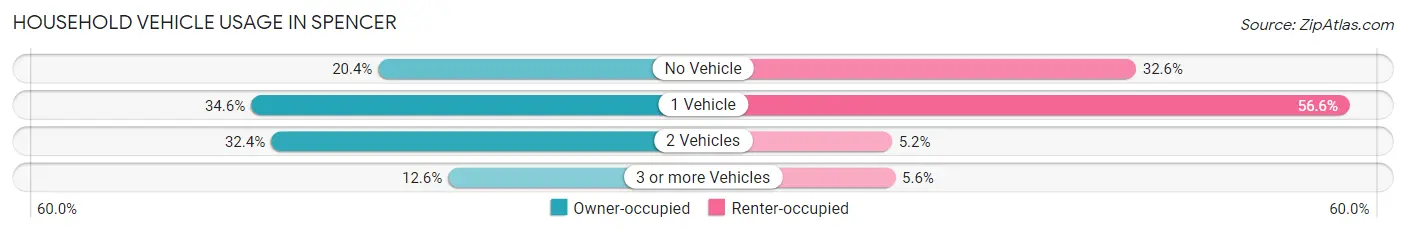
| Vehicles per Household | Owner-occupied | Renter-occupied |
| No Vehicle | 73 (20.4%) | 174 (32.6%) |
| 1 Vehicle | 124 (34.6%) | 302 (56.6%) |
| 2 Vehicles | 116 (32.4%) | 28 (5.2%) |
| 3 or more Vehicles | 45 (12.6%) | 30 (5.6%) |
| Total | 358 (100.0%) | 534 (100.0%) |
Real Estate & Mortgages in Spencer
Real Estate and Mortgage Overview in Spencer
| Characteristic | Without Mortgage | With Mortgage |
| Housing Units | 284 | 74 |
| Median Property Value | $107,800 | $97,500 |
| Median Household Income | $26,406 | $7 |
| Monthly Housing Costs | $304 | $0 |
| Real Estate Taxes | $369 | $6 |
Property Value by Mortgage Status in Spencer
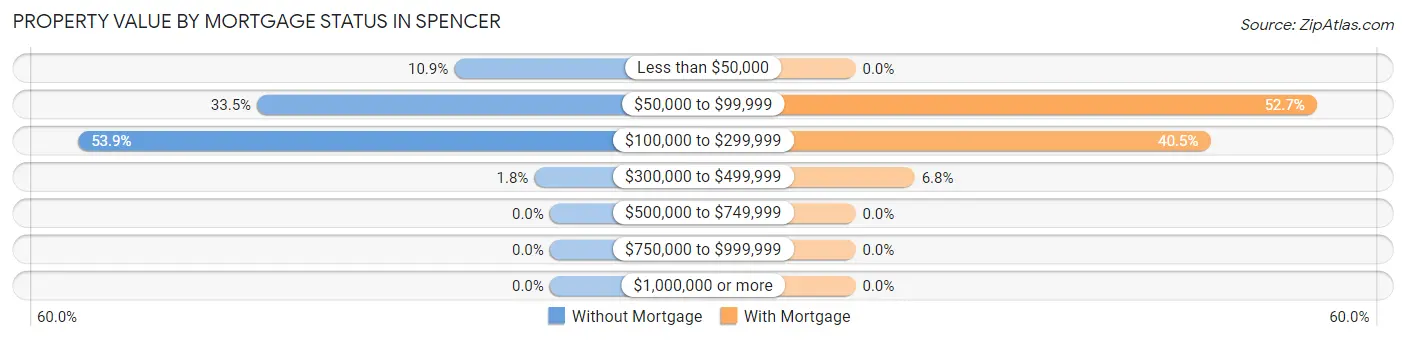
| Property Value | Without Mortgage | With Mortgage |
| Less than $50,000 | 31 (10.9%) | 0 (0.0%) |
| $50,000 to $99,999 | 95 (33.5%) | 39 (52.7%) |
| $100,000 to $299,999 | 153 (53.9%) | 30 (40.5%) |
| $300,000 to $499,999 | 5 (1.8%) | 5 (6.8%) |
| $500,000 to $749,999 | 0 (0.0%) | 0 (0.0%) |
| $750,000 to $999,999 | 0 (0.0%) | 0 (0.0%) |
| $1,000,000 or more | 0 (0.0%) | 0 (0.0%) |
| Total | 284 (100.0%) | 74 (100.0%) |
Household Income by Mortgage Status in Spencer
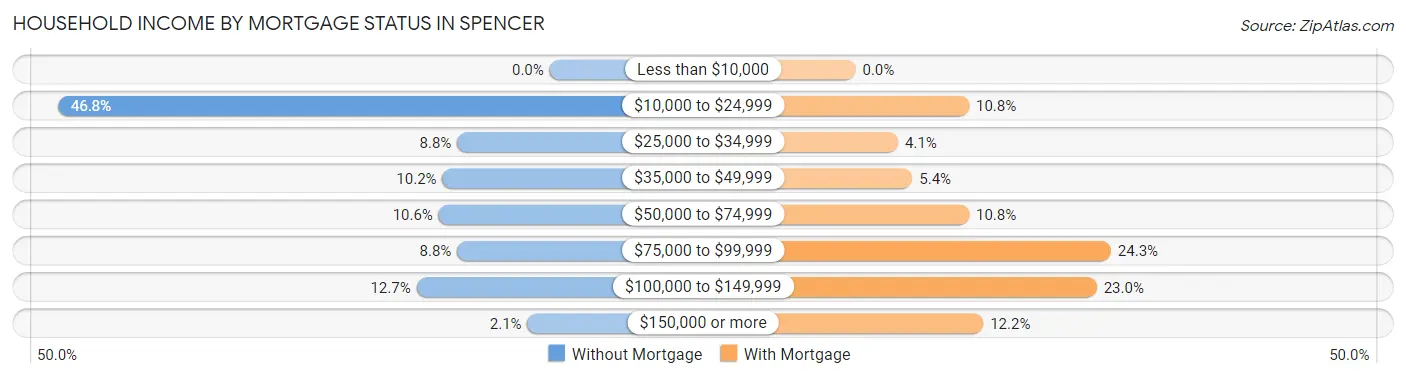
| Household Income | Without Mortgage | With Mortgage |
| Less than $10,000 | 0 (0.0%) | 0 (0.0%) |
| $10,000 to $24,999 | 133 (46.8%) | 8 (10.8%) |
| $25,000 to $34,999 | 25 (8.8%) | 3 (4.1%) |
| $35,000 to $49,999 | 29 (10.2%) | 4 (5.4%) |
| $50,000 to $74,999 | 30 (10.6%) | 8 (10.8%) |
| $75,000 to $99,999 | 25 (8.8%) | 18 (24.3%) |
| $100,000 to $149,999 | 36 (12.7%) | 17 (23.0%) |
| $150,000 or more | 6 (2.1%) | 9 (12.2%) |
| Total | 284 (100.0%) | 74 (100.0%) |
Property Value to Household Income Ratio in Spencer
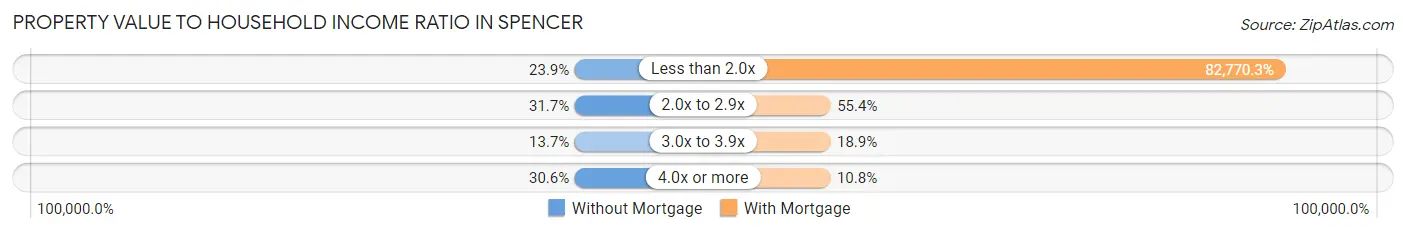
| Value-to-Income Ratio | Without Mortgage | With Mortgage |
| Less than 2.0x | 68 (23.9%) | 61,250 (82,770.3%) |
| 2.0x to 2.9x | 90 (31.7%) | 41 (55.4%) |
| 3.0x to 3.9x | 39 (13.7%) | 14 (18.9%) |
| 4.0x or more | 87 (30.6%) | 8 (10.8%) |
| Total | 284 (100.0%) | 74 (100.0%) |
Real Estate Taxes by Mortgage Status in Spencer
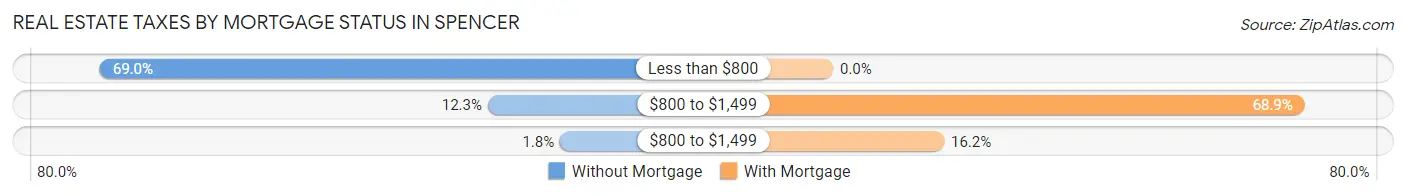
| Property Taxes | Without Mortgage | With Mortgage |
| Less than $800 | 196 (69.0%) | 0 (0.0%) |
| $800 to $1,499 | 35 (12.3%) | 51 (68.9%) |
| $800 to $1,499 | 5 (1.8%) | 12 (16.2%) |
| Total | 284 (100.0%) | 74 (100.0%) |
Health & Disability in Spencer
Health Insurance Coverage by Age in Spencer
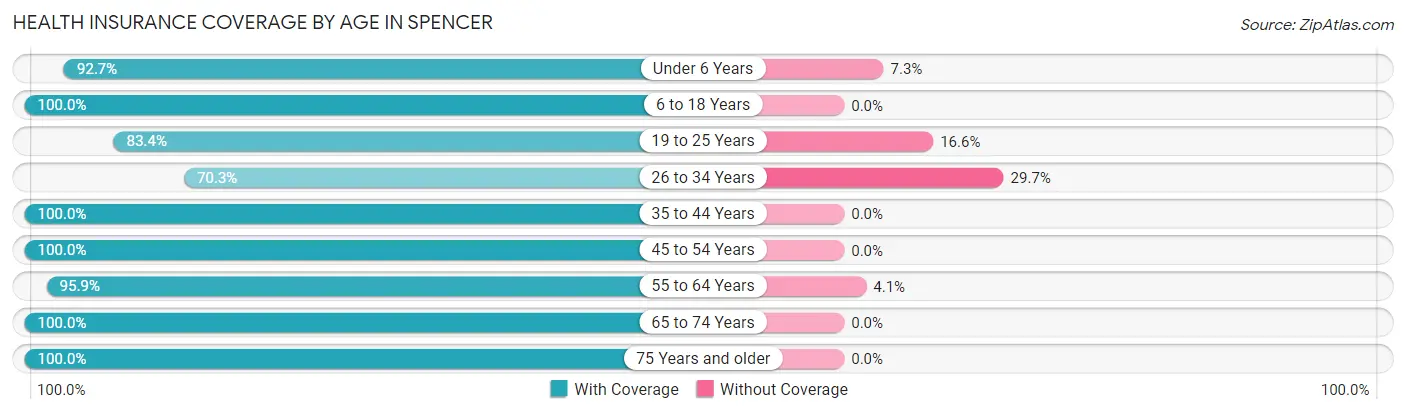
| Age Bracket | With Coverage | Without Coverage |
| Under 6 Years | 177 (92.7%) | 14 (7.3%) |
| 6 to 18 Years | 230 (100.0%) | 0 (0.0%) |
| 19 to 25 Years | 171 (83.4%) | 34 (16.6%) |
| 26 to 34 Years | 175 (70.3%) | 74 (29.7%) |
| 35 to 44 Years | 171 (100.0%) | 0 (0.0%) |
| 45 to 54 Years | 217 (100.0%) | 0 (0.0%) |
| 55 to 64 Years | 303 (95.9%) | 13 (4.1%) |
| 65 to 74 Years | 224 (100.0%) | 0 (0.0%) |
| 75 Years and older | 186 (100.0%) | 0 (0.0%) |
| Total | 1,854 (93.2%) | 135 (6.8%) |
Health Insurance Coverage by Citizenship Status in Spencer
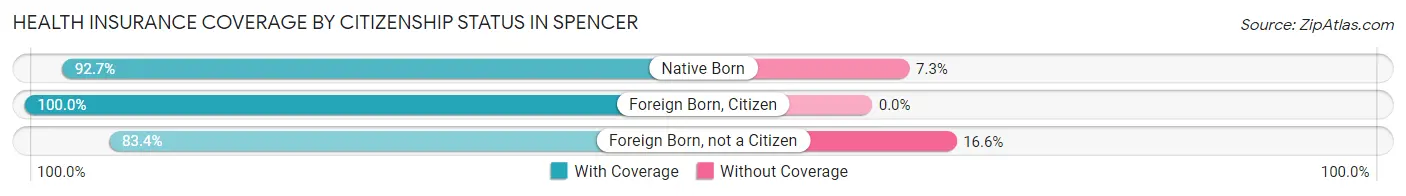
| Citizenship Status | With Coverage | Without Coverage |
| Native Born | 177 (92.7%) | 14 (7.3%) |
| Foreign Born, Citizen | 230 (100.0%) | 0 (0.0%) |
| Foreign Born, not a Citizen | 171 (83.4%) | 34 (16.6%) |
Health Insurance Coverage by Household Income in Spencer
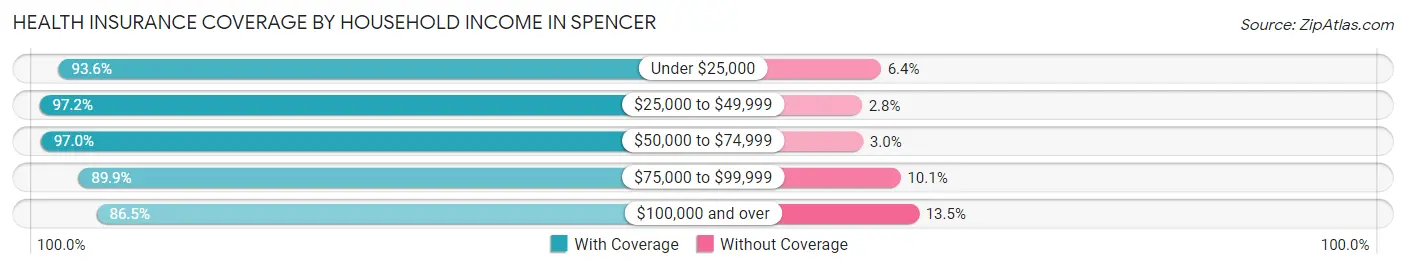
| Household Income | With Coverage | Without Coverage |
| Under $25,000 | 677 (93.6%) | 46 (6.4%) |
| $25,000 to $49,999 | 451 (97.2%) | 13 (2.8%) |
| $50,000 to $74,999 | 193 (97.0%) | 6 (3.0%) |
| $75,000 to $99,999 | 286 (89.9%) | 32 (10.1%) |
| $100,000 and over | 244 (86.5%) | 38 (13.5%) |
Public vs Private Health Insurance Coverage by Age in Spencer
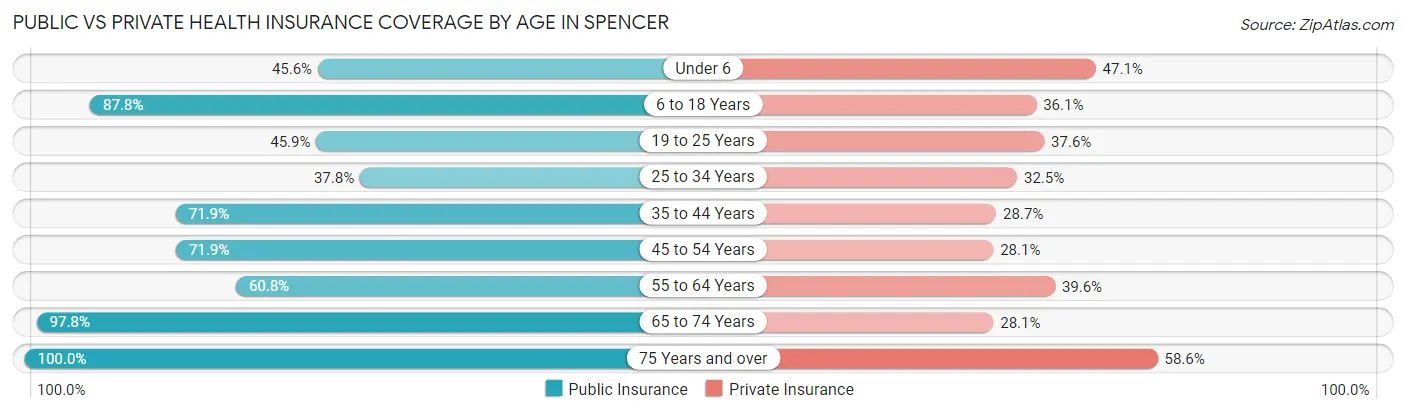
| Age Bracket | Public Insurance | Private Insurance |
| Under 6 | 87 (45.6%) | 90 (47.1%) |
| 6 to 18 Years | 202 (87.8%) | 83 (36.1%) |
| 19 to 25 Years | 94 (45.9%) | 77 (37.6%) |
| 25 to 34 Years | 94 (37.8%) | 81 (32.5%) |
| 35 to 44 Years | 123 (71.9%) | 49 (28.6%) |
| 45 to 54 Years | 156 (71.9%) | 61 (28.1%) |
| 55 to 64 Years | 192 (60.8%) | 125 (39.6%) |
| 65 to 74 Years | 219 (97.8%) | 63 (28.1%) |
| 75 Years and over | 186 (100.0%) | 109 (58.6%) |
| Total | 1,353 (68.0%) | 738 (37.1%) |
Disability Status by Sex by Age in Spencer
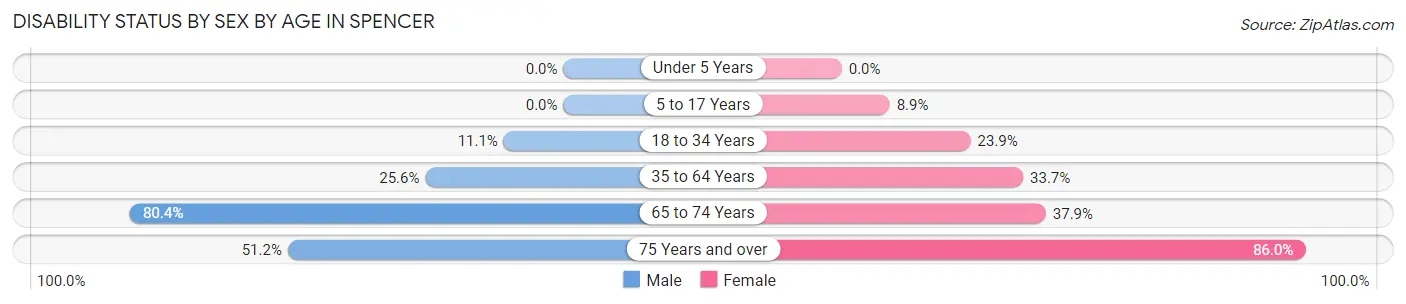
| Age Bracket | Male | Female |
| Under 5 Years | 0 (0.0%) | 0 (0.0%) |
| 5 to 17 Years | 0 (0.0%) | 8 (8.9%) |
| 18 to 34 Years | 32 (11.1%) | 60 (23.9%) |
| 35 to 64 Years | 102 (25.6%) | 103 (33.7%) |
| 65 to 74 Years | 74 (80.4%) | 50 (37.9%) |
| 75 Years and over | 22 (51.2%) | 123 (86.0%) |
Disability Class by Sex by Age in Spencer
Disability Class: Hearing Difficulty
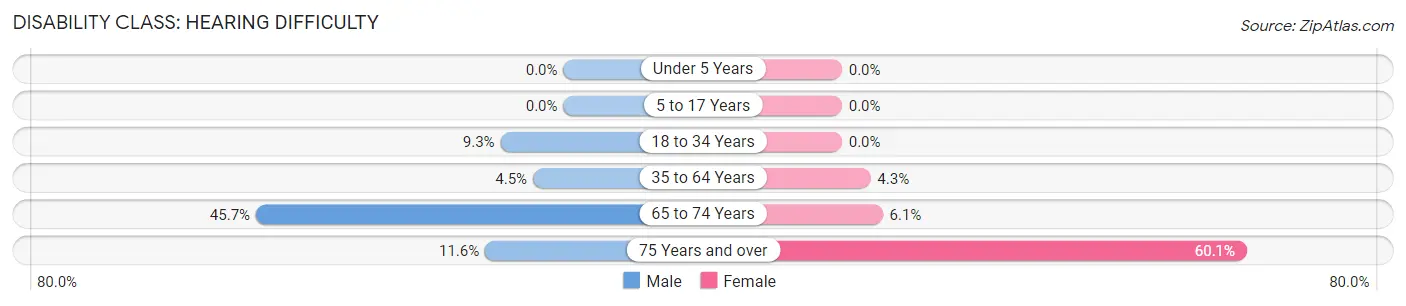
| Age Bracket | Male | Female |
| Under 5 Years | 0 (0.0%) | 0 (0.0%) |
| 5 to 17 Years | 0 (0.0%) | 0 (0.0%) |
| 18 to 34 Years | 27 (9.3%) | 0 (0.0%) |
| 35 to 64 Years | 18 (4.5%) | 13 (4.3%) |
| 65 to 74 Years | 42 (45.7%) | 8 (6.1%) |
| 75 Years and over | 5 (11.6%) | 86 (60.1%) |
Disability Class: Vision Difficulty
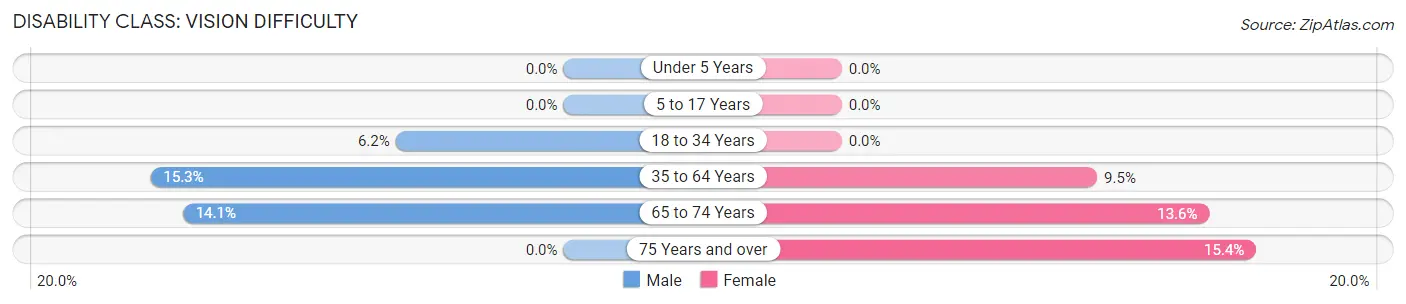
| Age Bracket | Male | Female |
| Under 5 Years | 0 (0.0%) | 0 (0.0%) |
| 5 to 17 Years | 0 (0.0%) | 0 (0.0%) |
| 18 to 34 Years | 18 (6.2%) | 0 (0.0%) |
| 35 to 64 Years | 61 (15.3%) | 29 (9.5%) |
| 65 to 74 Years | 13 (14.1%) | 18 (13.6%) |
| 75 Years and over | 0 (0.0%) | 22 (15.4%) |
Disability Class: Cognitive Difficulty
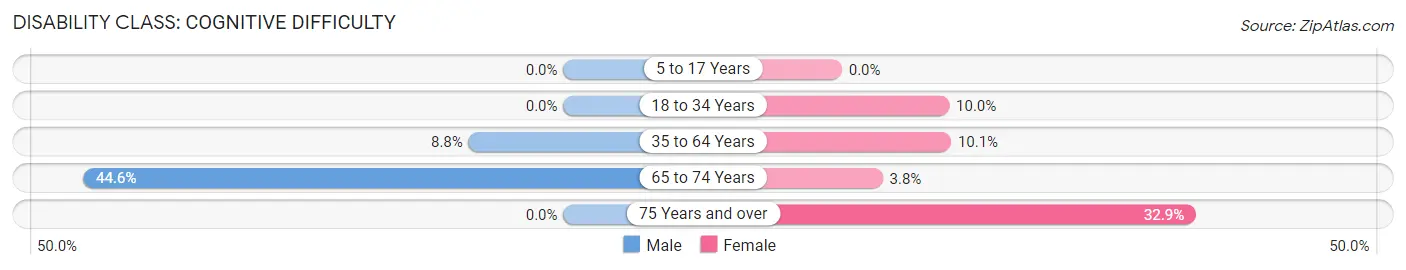
| Age Bracket | Male | Female |
| 5 to 17 Years | 0 (0.0%) | 0 (0.0%) |
| 18 to 34 Years | 0 (0.0%) | 25 (10.0%) |
| 35 to 64 Years | 35 (8.8%) | 31 (10.1%) |
| 65 to 74 Years | 41 (44.6%) | 5 (3.8%) |
| 75 Years and over | 0 (0.0%) | 47 (32.9%) |
Disability Class: Ambulatory Difficulty
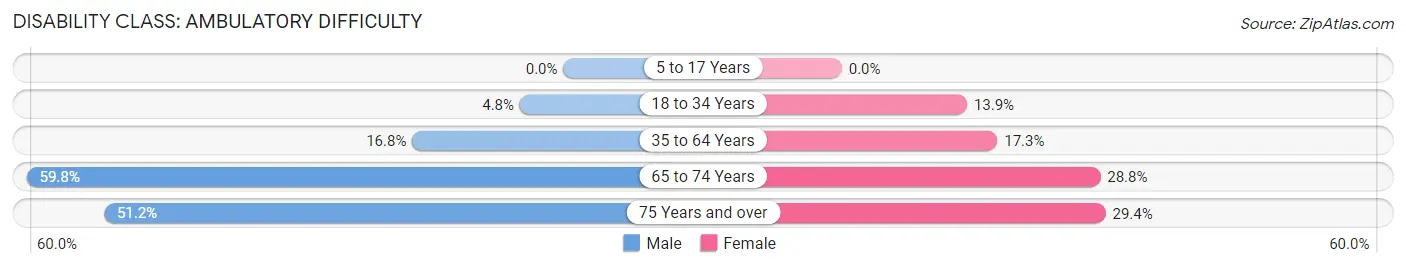
| Age Bracket | Male | Female |
| 5 to 17 Years | 0 (0.0%) | 0 (0.0%) |
| 18 to 34 Years | 14 (4.8%) | 35 (13.9%) |
| 35 to 64 Years | 67 (16.8%) | 53 (17.3%) |
| 65 to 74 Years | 55 (59.8%) | 38 (28.8%) |
| 75 Years and over | 22 (51.2%) | 42 (29.4%) |
Disability Class: Self-Care Difficulty
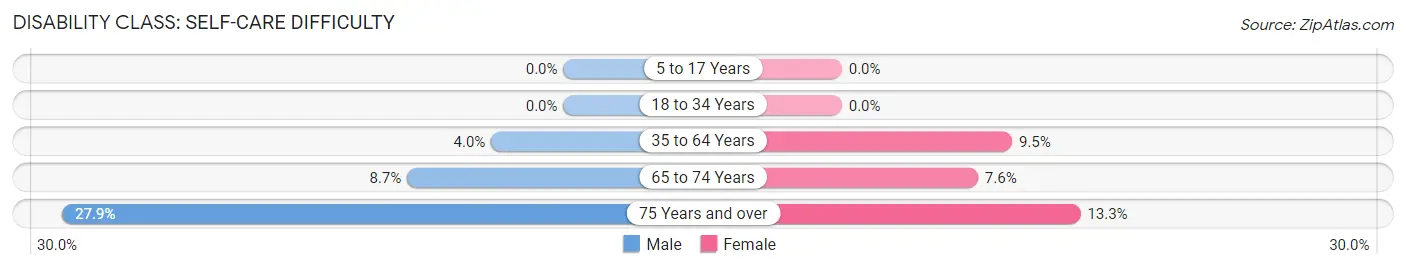
| Age Bracket | Male | Female |
| 5 to 17 Years | 0 (0.0%) | 0 (0.0%) |
| 18 to 34 Years | 0 (0.0%) | 0 (0.0%) |
| 35 to 64 Years | 16 (4.0%) | 29 (9.5%) |
| 65 to 74 Years | 8 (8.7%) | 10 (7.6%) |
| 75 Years and over | 12 (27.9%) | 19 (13.3%) |
Technology Access in Spencer
Computing Device Access in Spencer
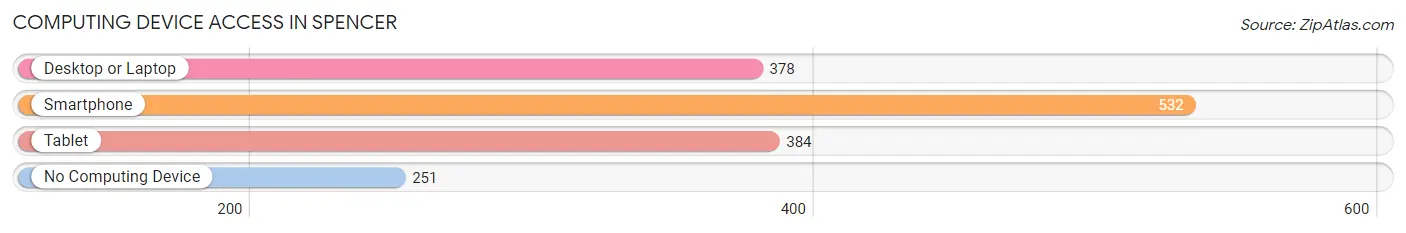
| Device Type | # Households | % Households |
| Desktop or Laptop | 378 | 42.4% |
| Smartphone | 532 | 59.6% |
| Tablet | 384 | 43.0% |
| No Computing Device | 251 | 28.1% |
| Total | 892 | 100.0% |
Internet Access in Spencer
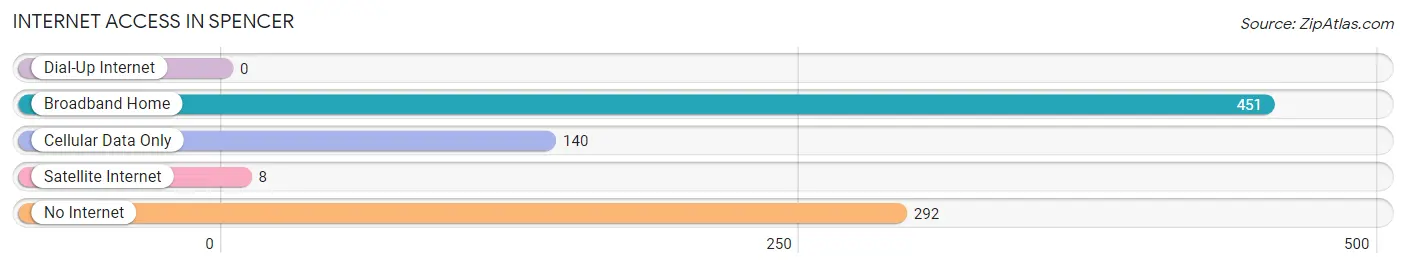
| Internet Type | # Households | % Households |
| Dial-Up Internet | 0 | 0.0% |
| Broadband Home | 451 | 50.6% |
| Cellular Data Only | 140 | 15.7% |
| Satellite Internet | 8 | 0.9% |
| No Internet | 292 | 32.7% |
| Total | 892 | 100.0% |
Spencer Summary
Spencer, West Virginia is a small town located in Roane County, West Virginia. It is situated on the banks of the Elk River, and is the county seat of Roane County. The population of Spencer was 2,322 at the 2010 census.
History
Spencer was founded in 1817 by William Spencer, a Revolutionary War veteran. The town was originally known as Spencer’s Station, and was a stop on the Northwestern Turnpike. The town was incorporated in 1832, and the name was changed to Spencer.
In the late 19th century, Spencer was a major center of the timber industry. The town was home to several sawmills, and the timber industry provided employment for many of the town’s residents.
Geography
Spencer is located at the confluence of the Elk and Kanawha Rivers. The town is situated in the Appalachian Mountains, and is surrounded by rolling hills and forests. The climate in Spencer is humid subtropical, with hot summers and mild winters.
Economy
Spencer’s economy is largely based on agriculture and tourism. The town is home to several farms, and the surrounding area is known for its apple orchards. Tourism is also an important part of the local economy, as the town is a popular destination for outdoor recreation.
Demographics
As of the 2010 census, the population of Spencer was 2,322. The racial makeup of the town was 97.2% White, 0.7% African American, 0.2% Native American, 0.2% Asian, 0.1% Pacific Islander, 0.3% from other races, and 1.3% from two or more races. Hispanic or Latino of any race were 0.9% of the population.
The median income for a household in Spencer was $30,938, and the median income for a family was $37,813. The per capita income for the town was $17,845. About 16.2% of families and 19.2% of the population were below the poverty line, including 25.2% of those under age 18 and 11.2% of those age 65 or over.
Spencer is a small town with a rich history and a vibrant economy. The town is home to a diverse population, and is a popular destination for outdoor recreation. With its beautiful scenery and friendly people, Spencer is a great place to live and visit.
Common Questions
What is Per Capita Income in Spencer?
Per Capita income in Spencer is $20,127.
What is the Median Family Income in Spencer?
Median Family Income in Spencer is $41,131.
What is the Median Household income in Spencer?
Median Household Income in Spencer is $23,983.
What is Income or Wage Gap in Spencer?
Income or Wage Gap in Spencer is 37.4%.
Women in Spencer earn 62.6 cents for every dollar earned by a man.
What is Inequality or Gini Index in Spencer?
Inequality or Gini Index in Spencer is 0.51.
What is the Total Population of Spencer?
Total Population of Spencer is 2,057.
What is the Total Male Population of Spencer?
Total Male Population of Spencer is 1,022.
What is the Total Female Population of Spencer?
Total Female Population of Spencer is 1,035.
What is the Ratio of Males per 100 Females in Spencer?
There are 98.74 Males per 100 Females in Spencer.
What is the Ratio of Females per 100 Males in Spencer?
There are 101.27 Females per 100 Males in Spencer.
What is the Median Population Age in Spencer?
Median Population Age in Spencer is 43.8 Years.
What is the Average Family Size in Spencer
Average Family Size in Spencer is 3.4 People.
What is the Average Household Size in Spencer
Average Household Size in Spencer is 2.2 People.
How Large is the Labor Force in Spencer?
There are 592 People in the Labor Forcein in Spencer.
What is the Percentage of People in the Labor Force in Spencer?
34.1% of People are in the Labor Force in Spencer.
What is the Unemployment Rate in Spencer?
Unemployment Rate in Spencer is 24.0%.