Mount Hope, WV Map & Demographics
Mount Hope Map
Mount Hope Overview
$17,035
PER CAPITA INCOME
$38,214
AVG FAMILY INCOME
$25,404
AVG HOUSEHOLD INCOME
19.3%
WAGE / INCOME GAP [ % ]
80.7¢/ $1
WAGE / INCOME GAP [ $ ]
0.45
INEQUALITY / GINI INDEX
1,032
TOTAL POPULATION
507
MALE POPULATION
525
FEMALE POPULATION
96.57
MALES / 100 FEMALES
103.55
FEMALES / 100 MALES
46.0
MEDIAN AGE
3.2
AVG FAMILY SIZE
2.1
AVG HOUSEHOLD SIZE
362
LABOR FORCE [ PEOPLE ]
40.2%
PERCENT IN LABOR FORCE
11.9%
UNEMPLOYMENT RATE
Mount Hope Zip Codes
Income in Mount Hope
Income Overview in Mount Hope
Per Capita Income in Mount Hope is $17,035, while median incomes of families and households are $38,214 and $25,404 respectively.
| Characteristic | Number | Measure |
| Per Capita Income | 1,032 | $17,035 |
| Median Family Income | 220 | $38,214 |
| Mean Family Income | 220 | $50,575 |
| Median Household Income | 483 | $25,404 |
| Mean Household Income | 483 | $35,878 |
| Income Deficit | 220 | $0 |
| Wage / Income Gap (%) | 1,032 | 19.32% |
| Wage / Income Gap ($) | 1,032 | 80.68¢ per $1 |
| Gini / Inequality Index | 1,032 | 0.45 |
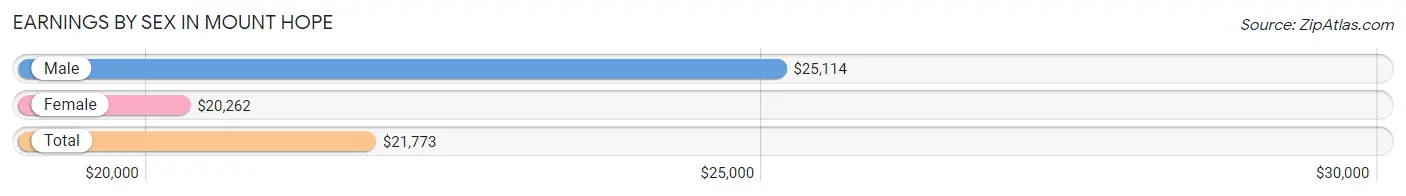
Earnings by Sex in Mount Hope
Average Earnings in Mount Hope are $21,773, $25,114 for men and $20,262 for women, a difference of 19.3%.
| Sex | Number | Average Earnings |
| Male | 194 (50.4%) | $25,114 |
| Female | 191 (49.6%) | $20,262 |
| Total | 385 (100.0%) | $21,773 |
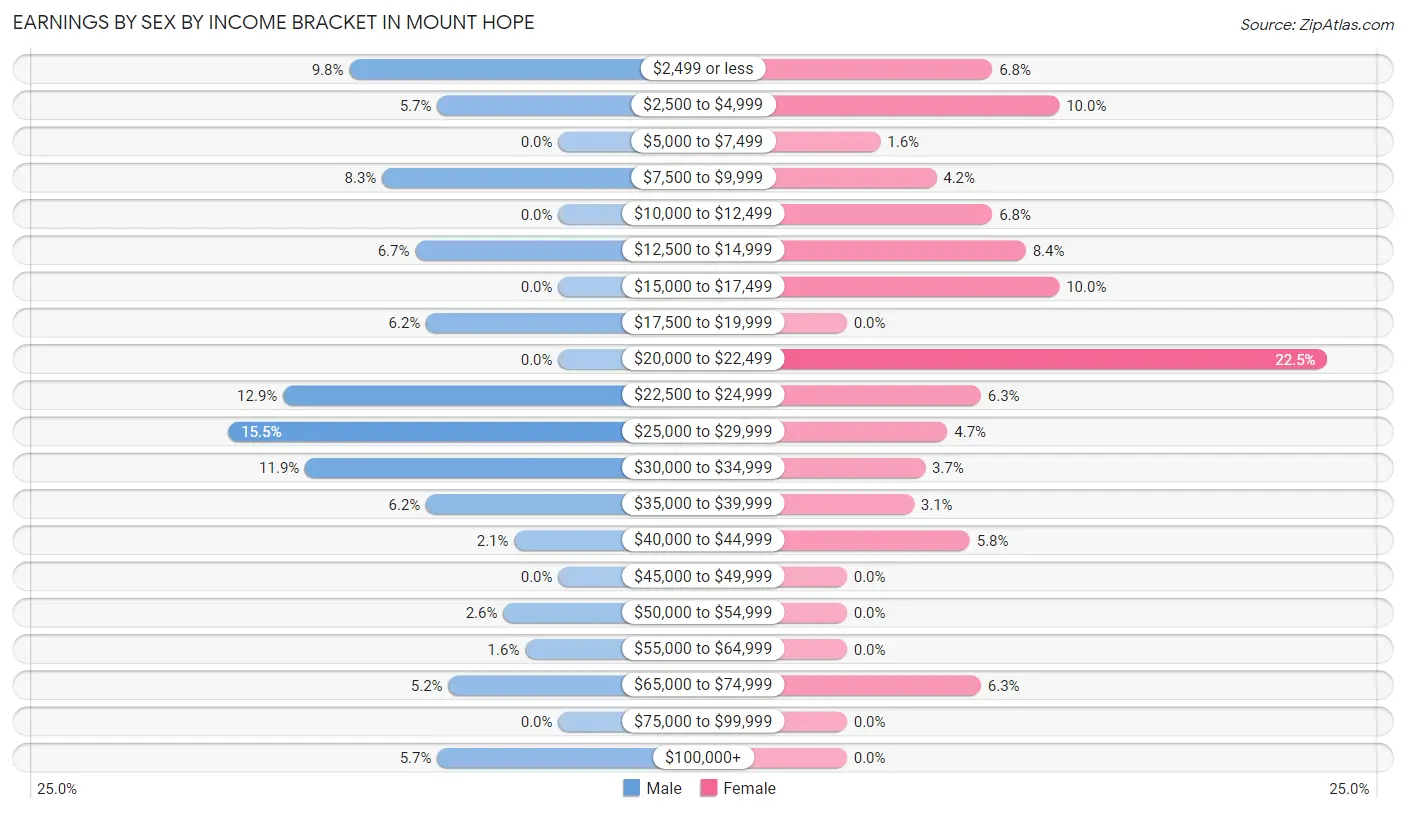
Earnings by Sex by Income Bracket in Mount Hope
The most common earnings brackets in Mount Hope are $25,000 to $29,999 for men (30 | 15.5%) and $20,000 to $22,499 for women (43 | 22.5%).
| Income | Male | Female |
| $2,499 or less | 19 (9.8%) | 13 (6.8%) |
| $2,500 to $4,999 | 11 (5.7%) | 19 (10.0%) |
| $5,000 to $7,499 | 0 (0.0%) | 3 (1.6%) |
| $7,500 to $9,999 | 16 (8.3%) | 8 (4.2%) |
| $10,000 to $12,499 | 0 (0.0%) | 13 (6.8%) |
| $12,500 to $14,999 | 13 (6.7%) | 16 (8.4%) |
| $15,000 to $17,499 | 0 (0.0%) | 19 (10.0%) |
| $17,500 to $19,999 | 12 (6.2%) | 0 (0.0%) |
| $20,000 to $22,499 | 0 (0.0%) | 43 (22.5%) |
| $22,500 to $24,999 | 25 (12.9%) | 12 (6.3%) |
| $25,000 to $29,999 | 30 (15.5%) | 9 (4.7%) |
| $30,000 to $34,999 | 23 (11.9%) | 7 (3.7%) |
| $35,000 to $39,999 | 12 (6.2%) | 6 (3.1%) |
| $40,000 to $44,999 | 4 (2.1%) | 11 (5.8%) |
| $45,000 to $49,999 | 0 (0.0%) | 0 (0.0%) |
| $50,000 to $54,999 | 5 (2.6%) | 0 (0.0%) |
| $55,000 to $64,999 | 3 (1.5%) | 0 (0.0%) |
| $65,000 to $74,999 | 10 (5.1%) | 12 (6.3%) |
| $75,000 to $99,999 | 0 (0.0%) | 0 (0.0%) |
| $100,000+ | 11 (5.7%) | 0 (0.0%) |
| Total | 194 (100.0%) | 191 (100.0%) |
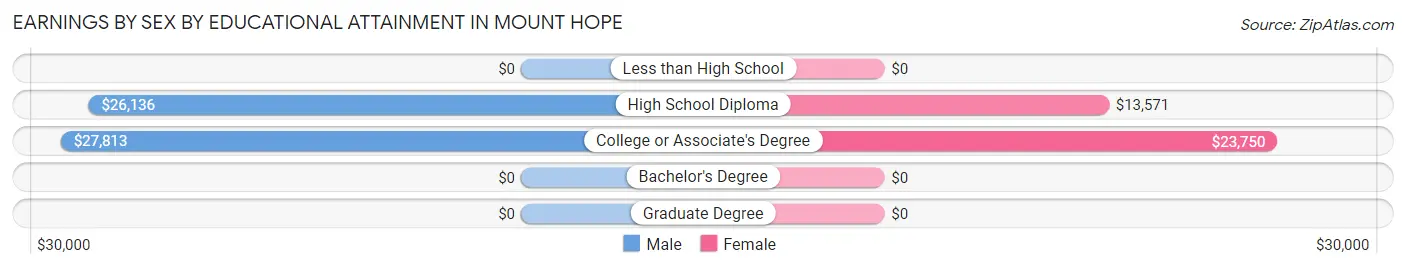
Earnings by Sex by Educational Attainment in Mount Hope
Average earnings in Mount Hope are $26,307 for men and $20,357 for women, a difference of 22.6%. Men with an educational attainment of college or associate's degree enjoy the highest average annual earnings of $27,813, while those with high school diploma education earn the least with $26,136. Women with an educational attainment of college or associate's degree earn the most with the average annual earnings of $23,750, while those with high school diploma education have the smallest earnings of $13,571.
| Educational Attainment | Male Income | Female Income |
| Less than High School | - | - |
| High School Diploma | $26,136 | $13,571 |
| College or Associate's Degree | $27,813 | $23,750 |
| Bachelor's Degree | - | - |
| Graduate Degree | - | - |
| Total | $26,307 | $20,357 |
Family Income in Mount Hope
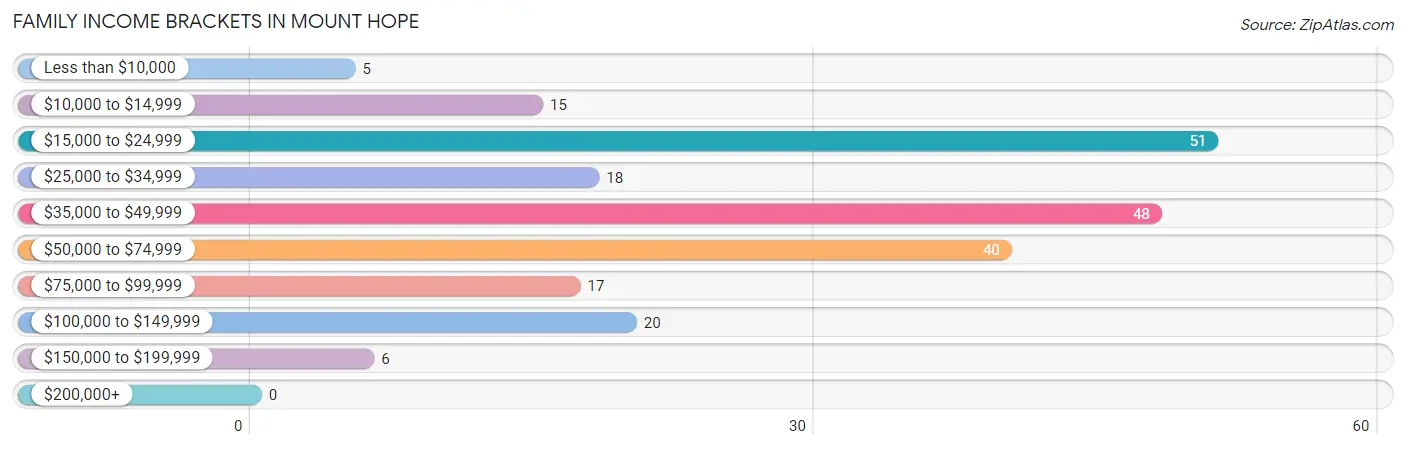
Family Income Brackets in Mount Hope
According to the Mount Hope family income data, there are 51 families falling into the $15,000 to $24,999 income range, which is the most common income bracket and makes up 23.2% of all families.
| Income Bracket | # Families | % Families |
| Less than $10,000 | 5 | 2.3% |
| $10,000 to $14,999 | 15 | 6.8% |
| $15,000 to $24,999 | 51 | 23.2% |
| $25,000 to $34,999 | 18 | 8.2% |
| $35,000 to $49,999 | 48 | 21.8% |
| $50,000 to $74,999 | 40 | 18.2% |
| $75,000 to $99,999 | 17 | 7.7% |
| $100,000 to $149,999 | 20 | 9.1% |
| $150,000 to $199,999 | 6 | 2.7% |
| $200,000+ | 0 | 0.0% |
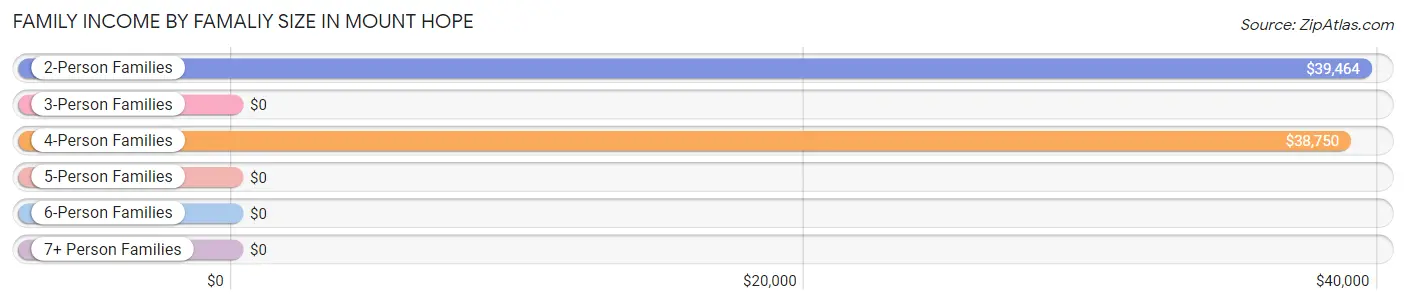
Family Income by Famaliy Size in Mount Hope
2-person families (107 | 48.6%) account for the highest median family income in Mount Hope with $39,464 per family, while 2-person families (107 | 48.6%) have the highest median income of $19,732 per family member.
| Income Bracket | # Families | Median Income |
| 2-Person Families | 107 (48.6%) | $39,464 |
| 3-Person Families | 43 (19.6%) | $0 |
| 4-Person Families | 64 (29.1%) | $38,750 |
| 5-Person Families | 0 (0.0%) | $0 |
| 6-Person Families | 0 (0.0%) | $0 |
| 7+ Person Families | 6 (2.7%) | $0 |
| Total | 220 (100.0%) | $38,214 |
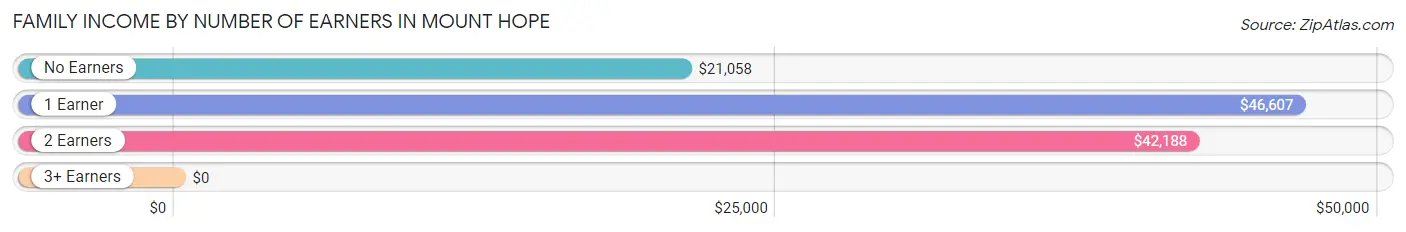
Family Income by Number of Earners in Mount Hope
| Number of Earners | # Families | Median Income |
| No Earners | 63 (28.6%) | $21,058 |
| 1 Earner | 95 (43.2%) | $46,607 |
| 2 Earners | 57 (25.9%) | $42,188 |
| 3+ Earners | 5 (2.3%) | $0 |
| Total | 220 (100.0%) | $38,214 |
Household Income in Mount Hope
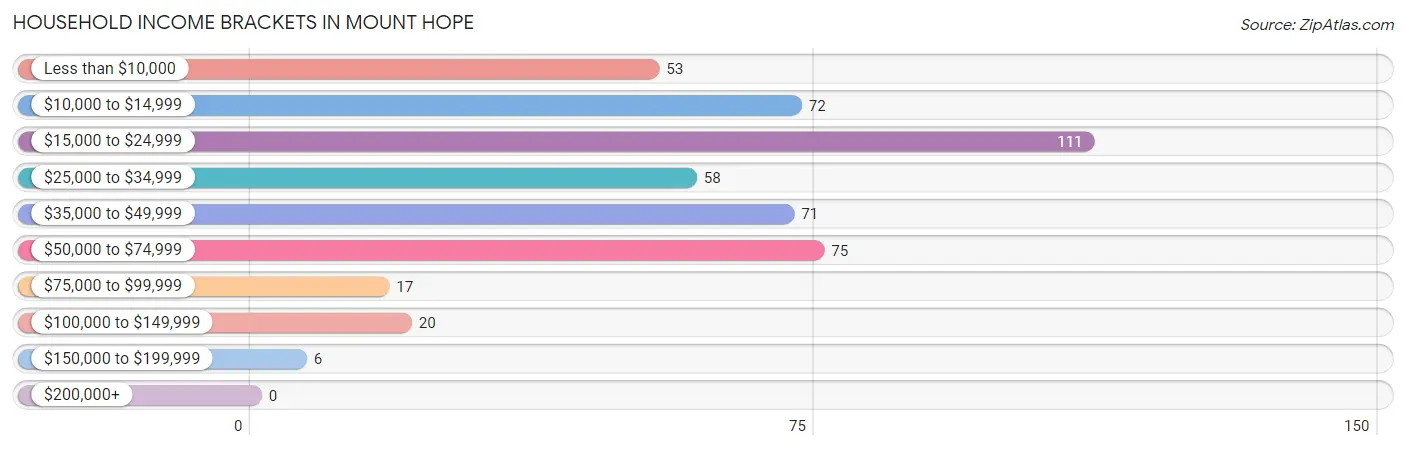
Household Income Brackets in Mount Hope
With 111 households falling in the category, the $15,000 to $24,999 income range is the most frequent in Mount Hope, accounting for 23.0% of all households.
| Income Bracket | # Households | % Households |
| Less than $10,000 | 53 | 11.0% |
| $10,000 to $14,999 | 72 | 14.9% |
| $15,000 to $24,999 | 111 | 23.0% |
| $25,000 to $34,999 | 58 | 12.0% |
| $35,000 to $49,999 | 71 | 14.7% |
| $50,000 to $74,999 | 75 | 15.5% |
| $75,000 to $99,999 | 17 | 3.5% |
| $100,000 to $149,999 | 20 | 4.1% |
| $150,000 to $199,999 | 6 | 1.2% |
| $200,000+ | 0 | 0.0% |
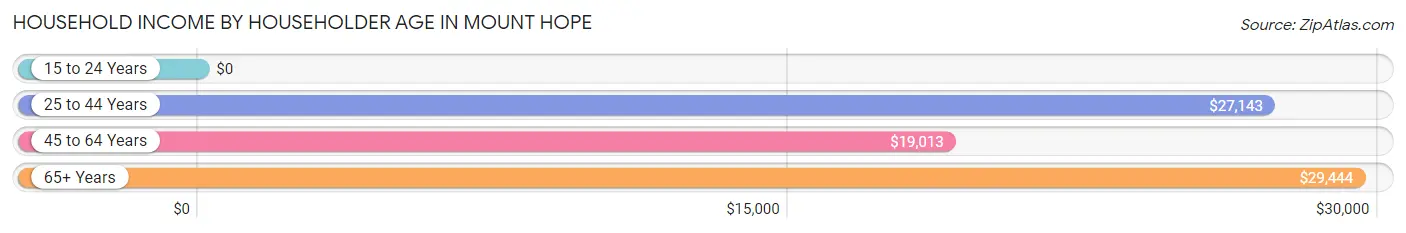
Household Income by Householder Age in Mount Hope
The median household income in Mount Hope is $25,404, with the highest median household income of $29,444 found in the 65+ years age bracket for the primary householder. A total of 158 households (32.7%) fall into this category. Meanwhile, the 15 to 24 years age bracket for the primary householder has the lowest median household income of $0, with 19 households (3.9%) in this group.
| Income Bracket | # Households | Median Income |
| 15 to 24 Years | 19 (3.9%) | $0 |
| 25 to 44 Years | 100 (20.7%) | $27,143 |
| 45 to 64 Years | 206 (42.6%) | $19,013 |
| 65+ Years | 158 (32.7%) | $29,444 |
| Total | 483 (100.0%) | $25,404 |
Poverty in Mount Hope
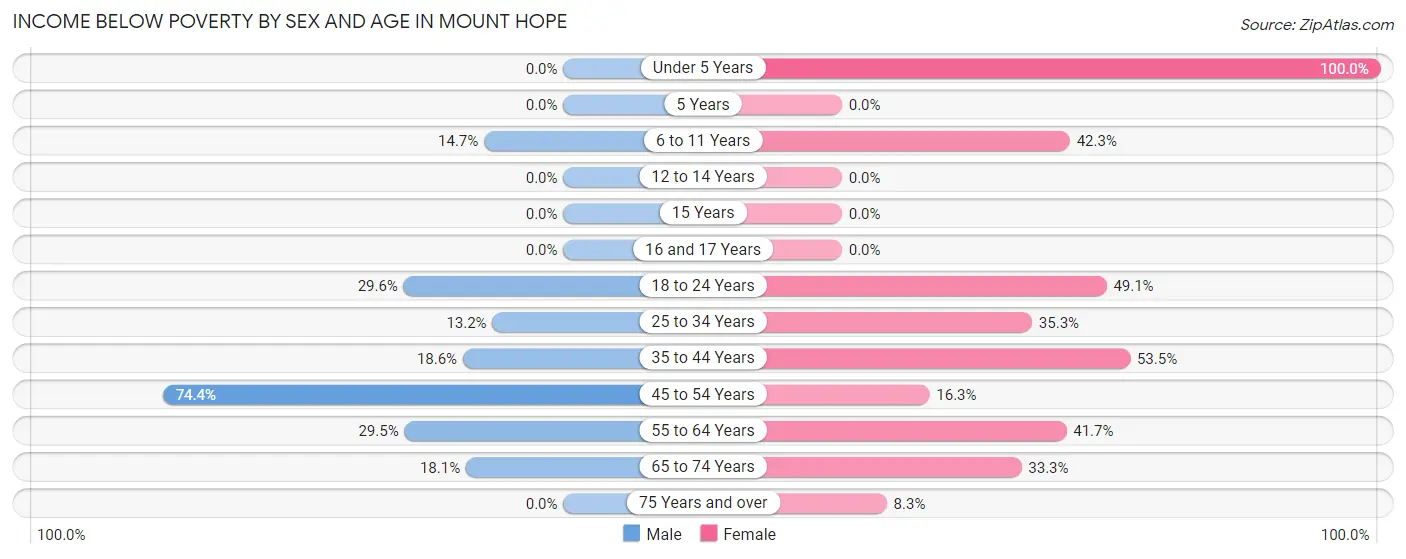
Income Below Poverty by Sex and Age in Mount Hope
With 27.0% poverty level for males and 36.4% for females among the residents of Mount Hope, 45 to 54 year old males and under 5 year old females are the most vulnerable to poverty, with 58 males (74.4%) and 5 females (100.0%) in their respective age groups living below the poverty level.
| Age Bracket | Male | Female |
| Under 5 Years | 0 (0.0%) | 5 (100.0%) |
| 5 Years | 0 (0.0%) | 0 (0.0%) |
| 6 to 11 Years | 5 (14.7%) | 22 (42.3%) |
| 12 to 14 Years | 0 (0.0%) | 0 (0.0%) |
| 15 Years | 0 (0.0%) | 0 (0.0%) |
| 16 and 17 Years | 0 (0.0%) | 0 (0.0%) |
| 18 to 24 Years | 16 (29.6%) | 28 (49.1%) |
| 25 to 34 Years | 5 (13.2%) | 24 (35.3%) |
| 35 to 44 Years | 11 (18.6%) | 46 (53.5%) |
| 45 to 54 Years | 58 (74.4%) | 13 (16.3%) |
| 55 to 64 Years | 23 (29.5%) | 15 (41.7%) |
| 65 to 74 Years | 15 (18.1%) | 35 (33.3%) |
| 75 Years and over | 0 (0.0%) | 3 (8.3%) |
| Total | 133 (27.0%) | 191 (36.4%) |
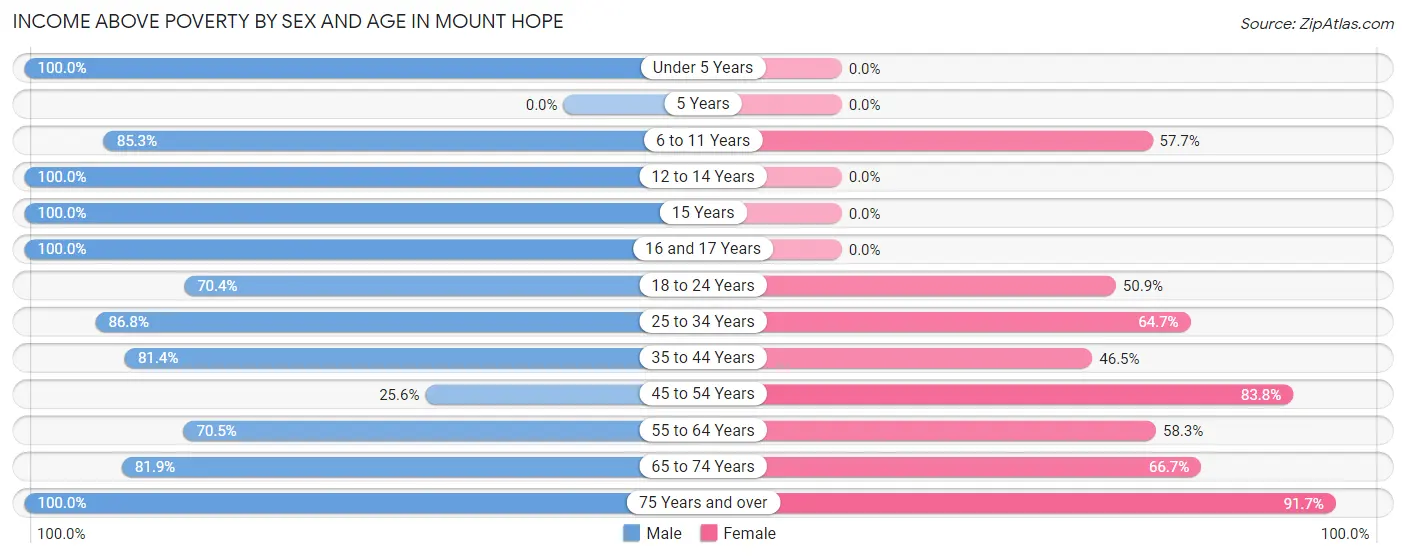
Income Above Poverty by Sex and Age in Mount Hope
According to the poverty statistics in Mount Hope, males aged under 5 years and females aged 75 years and over are the age groups that are most secure financially, with 100.0% of males and 91.7% of females in these age groups living above the poverty line.
| Age Bracket | Male | Female |
| Under 5 Years | 11 (100.0%) | 0 (0.0%) |
| 5 Years | 0 (0.0%) | 0 (0.0%) |
| 6 to 11 Years | 29 (85.3%) | 30 (57.7%) |
| 12 to 14 Years | 17 (100.0%) | 0 (0.0%) |
| 15 Years | 9 (100.0%) | 0 (0.0%) |
| 16 and 17 Years | 10 (100.0%) | 0 (0.0%) |
| 18 to 24 Years | 38 (70.4%) | 29 (50.9%) |
| 25 to 34 Years | 33 (86.8%) | 44 (64.7%) |
| 35 to 44 Years | 48 (81.4%) | 40 (46.5%) |
| 45 to 54 Years | 20 (25.6%) | 67 (83.8%) |
| 55 to 64 Years | 55 (70.5%) | 21 (58.3%) |
| 65 to 74 Years | 68 (81.9%) | 70 (66.7%) |
| 75 Years and over | 21 (100.0%) | 33 (91.7%) |
| Total | 359 (73.0%) | 334 (63.6%) |
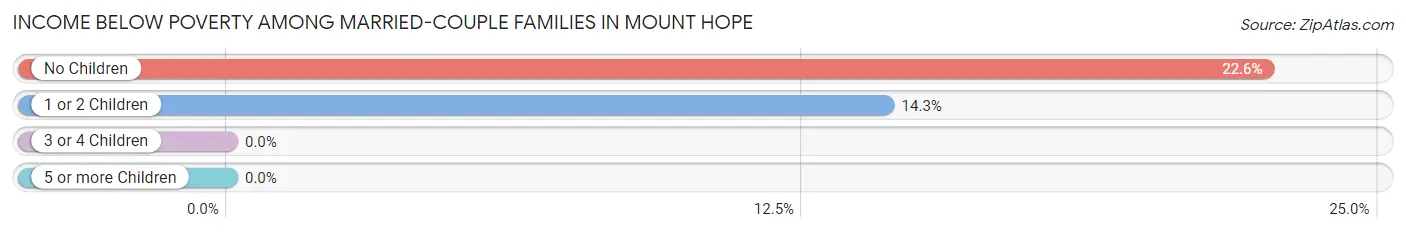
Income Below Poverty Among Married-Couple Families in Mount Hope
The poverty statistics for married-couple families in Mount Hope show that 19.6% or 28 of the total 143 families live below the poverty line. Families with no children have the highest poverty rate of 22.6%, comprising of 23 families. On the other hand, families with 3 or 4 children have the lowest poverty rate of 0.0%, which includes 0 families.
| Children | Above Poverty | Below Poverty |
| No Children | 79 (77.4%) | 23 (22.6%) |
| 1 or 2 Children | 30 (85.7%) | 5 (14.3%) |
| 3 or 4 Children | 6 (100.0%) | 0 (0.0%) |
| 5 or more Children | 0 (0.0%) | 0 (0.0%) |
| Total | 115 (80.4%) | 28 (19.6%) |
Income Below Poverty Among Single-Parent Households in Mount Hope
According to the poverty data in Mount Hope, 26.9% or 7 single-father households and 52.9% or 27 single-mother households are living below the poverty line. Among single-father households, those with no children have the highest poverty rate, with 7 households (36.8%) experiencing poverty. Likewise, among single-mother households, those with 1 or 2 children have the highest poverty rate, with 18 households (100.0%) falling below the poverty line.
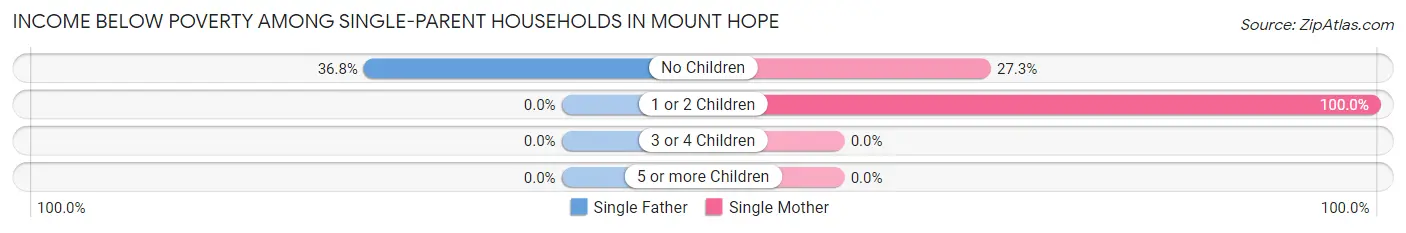
| Children | Single Father | Single Mother |
| No Children | 7 (36.8%) | 9 (27.3%) |
| 1 or 2 Children | 0 (0.0%) | 18 (100.0%) |
| 3 or 4 Children | 0 (0.0%) | 0 (0.0%) |
| 5 or more Children | 0 (0.0%) | 0 (0.0%) |
| Total | 7 (26.9%) | 27 (52.9%) |
Income Below Poverty Among Married-Couple vs Single-Parent Households in Mount Hope
The poverty data for Mount Hope shows that 28 of the married-couple family households (19.6%) and 34 of the single-parent households (44.2%) are living below the poverty level. Within the married-couple family households, those with no children have the highest poverty rate, with 23 households (22.6%) falling below the poverty line. Among the single-parent households, those with 1 or 2 children have the highest poverty rate, with 18 household (72.0%) living below poverty.
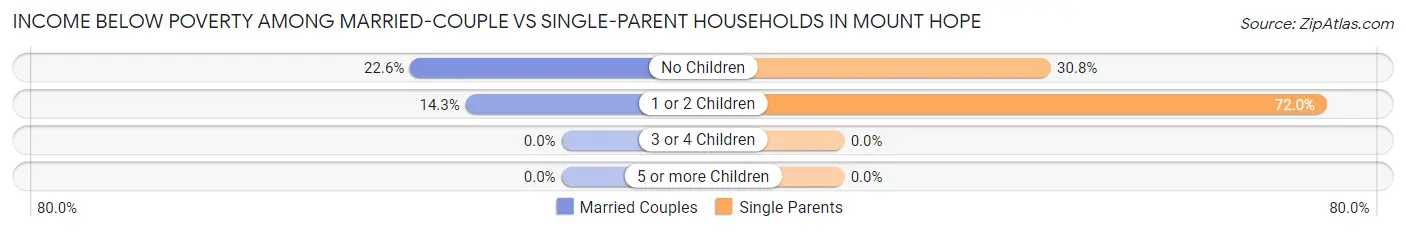
| Children | Married-Couple Families | Single-Parent Households |
| No Children | 23 (22.6%) | 16 (30.8%) |
| 1 or 2 Children | 5 (14.3%) | 18 (72.0%) |
| 3 or 4 Children | 0 (0.0%) | 0 (0.0%) |
| 5 or more Children | 0 (0.0%) | 0 (0.0%) |
| Total | 28 (19.6%) | 34 (44.2%) |
Race in Mount Hope
The most populous races in Mount Hope are White / Caucasian (901 | 87.3%), Black / African American (122 | 11.8%), and Two or more Races (9 | 0.9%).
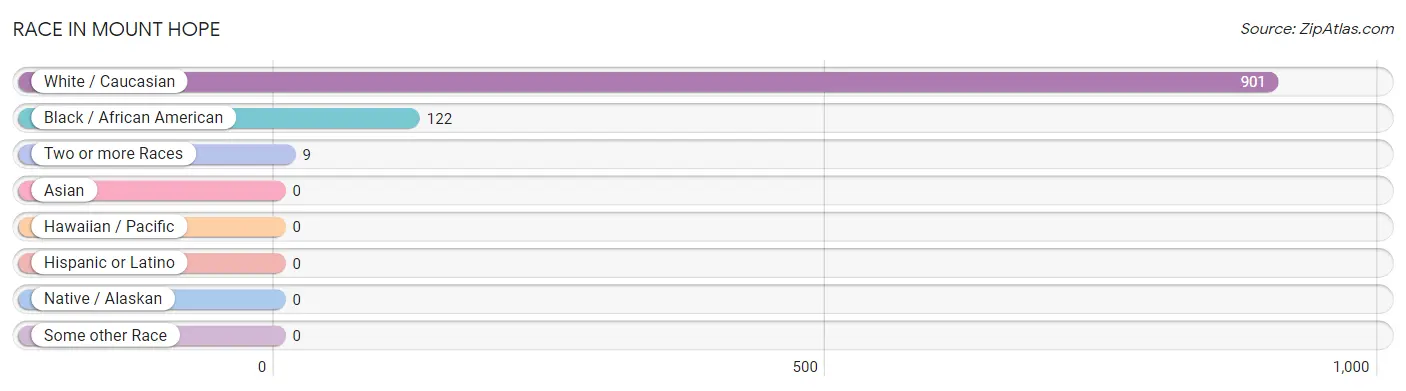
| Race | # Population | % Population |
| Asian | 0 | 0.0% |
| Black / African American | 122 | 11.8% |
| Hawaiian / Pacific | 0 | 0.0% |
| Hispanic or Latino | 0 | 0.0% |
| Native / Alaskan | 0 | 0.0% |
| White / Caucasian | 901 | 87.3% |
| Two or more Races | 9 | 0.9% |
| Some other Race | 0 | 0.0% |
| Total | 1,032 | 100.0% |
Ancestry in Mount Hope
The most populous ancestries reported in Mount Hope are English (130 | 12.6%), Irish (120 | 11.6%), American (115 | 11.1%), German (56 | 5.4%), and Scottish (40 | 3.9%), together accounting for 44.7% of all Mount Hope residents.
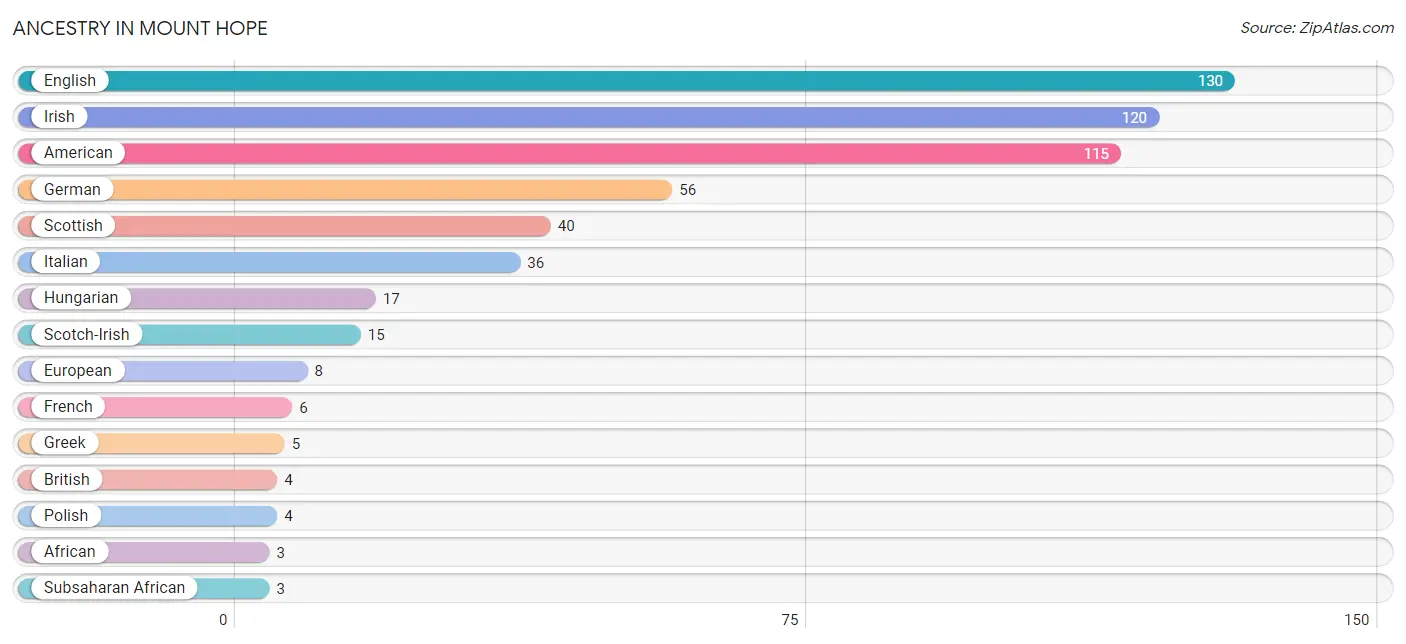
| Ancestry | # Population | % Population |
| African | 3 | 0.3% |
| American | 115 | 11.1% |
| British | 4 | 0.4% |
| Cherokee | 2 | 0.2% |
| Czechoslovakian | 2 | 0.2% |
| Dutch | 2 | 0.2% |
| English | 130 | 12.6% |
| European | 8 | 0.8% |
| French | 6 | 0.6% |
| German | 56 | 5.4% |
| Greek | 5 | 0.5% |
| Hungarian | 17 | 1.7% |
| Irish | 120 | 11.6% |
| Italian | 36 | 3.5% |
| Polish | 4 | 0.4% |
| Scotch-Irish | 15 | 1.5% |
| Scottish | 40 | 3.9% |
| Subsaharan African | 3 | 0.3% |
| Welsh | 3 | 0.3% | View All 19 Rows |
Immigrants in Mount Hope

| Immigration Origin | # Population | % Population | View All 0 Rows |
Sex and Age in Mount Hope
Sex and Age in Mount Hope
The most populous age groups in Mount Hope are 45 to 49 Years (73 | 14.4%) for men and 65 to 69 Years (66 | 12.6%) for women.
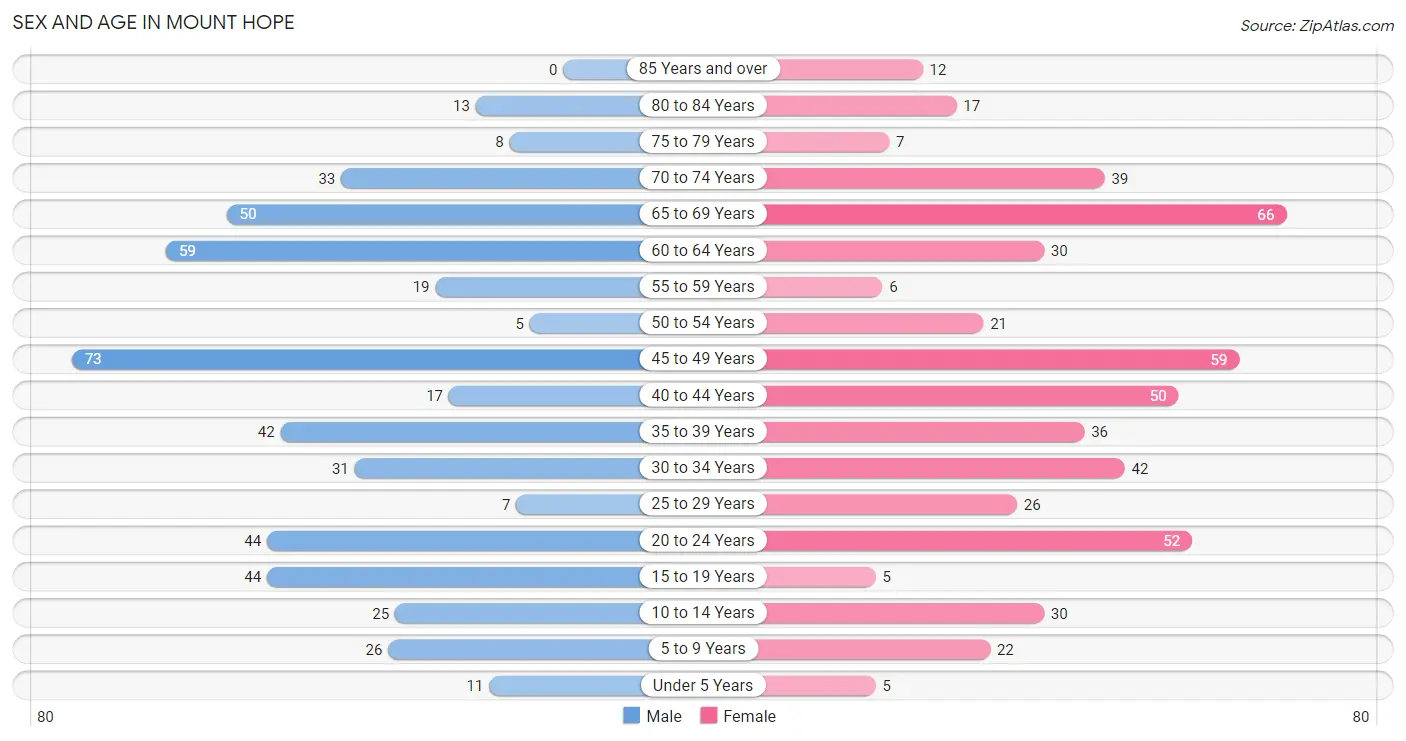
| Age Bracket | Male | Female |
| Under 5 Years | 11 (2.2%) | 5 (0.9%) |
| 5 to 9 Years | 26 (5.1%) | 22 (4.2%) |
| 10 to 14 Years | 25 (4.9%) | 30 (5.7%) |
| 15 to 19 Years | 44 (8.7%) | 5 (0.9%) |
| 20 to 24 Years | 44 (8.7%) | 52 (9.9%) |
| 25 to 29 Years | 7 (1.4%) | 26 (5.0%) |
| 30 to 34 Years | 31 (6.1%) | 42 (8.0%) |
| 35 to 39 Years | 42 (8.3%) | 36 (6.9%) |
| 40 to 44 Years | 17 (3.4%) | 50 (9.5%) |
| 45 to 49 Years | 73 (14.4%) | 59 (11.2%) |
| 50 to 54 Years | 5 (1.0%) | 21 (4.0%) |
| 55 to 59 Years | 19 (3.7%) | 6 (1.1%) |
| 60 to 64 Years | 59 (11.6%) | 30 (5.7%) |
| 65 to 69 Years | 50 (9.9%) | 66 (12.6%) |
| 70 to 74 Years | 33 (6.5%) | 39 (7.4%) |
| 75 to 79 Years | 8 (1.6%) | 7 (1.3%) |
| 80 to 84 Years | 13 (2.6%) | 17 (3.2%) |
| 85 Years and over | 0 (0.0%) | 12 (2.3%) |
| Total | 507 (100.0%) | 525 (100.0%) |
Families and Households in Mount Hope
Median Family Size in Mount Hope
The median family size in Mount Hope is 3.20 persons per family, with single male/father families (26 | 11.8%) accounting for the largest median family size of 3.46 persons per family. On the other hand, married-couple families (143 | 65.0%) represent the smallest median family size with 3.11 persons per family.
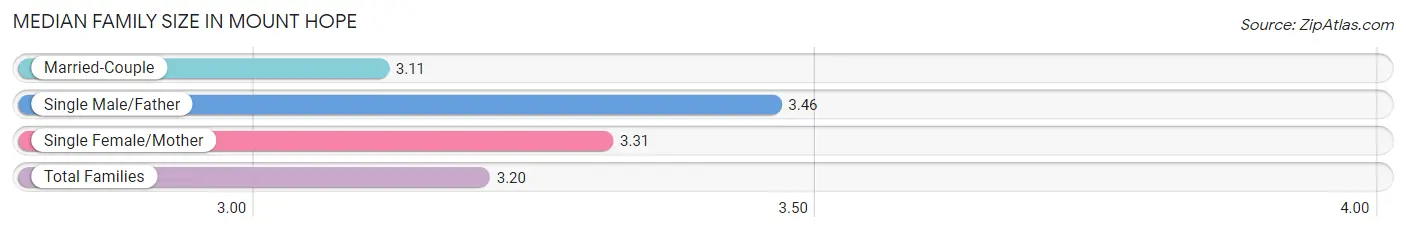
| Family Type | # Families | Family Size |
| Married-Couple | 143 (65.0%) | 3.11 |
| Single Male/Father | 26 (11.8%) | 3.46 |
| Single Female/Mother | 51 (23.2%) | 3.31 |
| Total Families | 220 (100.0%) | 3.20 |
Median Household Size in Mount Hope
The median household size in Mount Hope is 2.11 persons per household, with single male/father households (26 | 5.4%) accounting for the largest median household size of 3.77 persons per household. non-family households (263 | 54.4%) represent the smallest median household size with 1.13 persons per household.
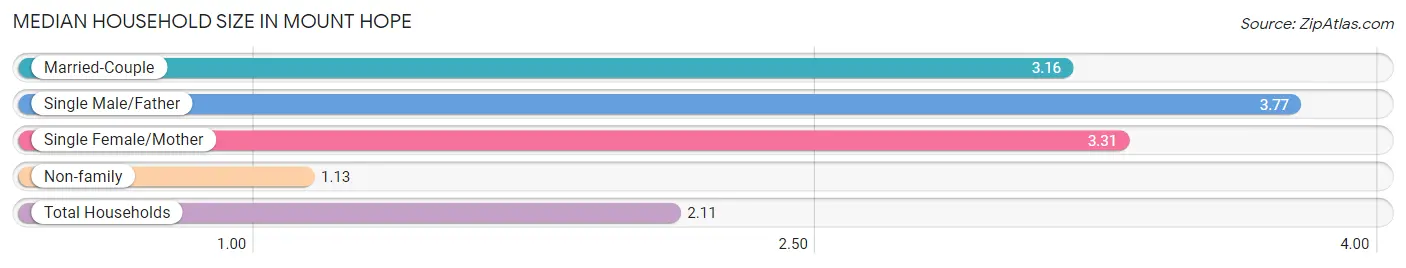
| Household Type | # Households | Household Size |
| Married-Couple | 143 (29.6%) | 3.16 |
| Single Male/Father | 26 (5.4%) | 3.77 |
| Single Female/Mother | 51 (10.6%) | 3.31 |
| Non-family | 263 (54.4%) | 1.13 |
| Total Households | 483 (100.0%) | 2.11 |
Household Size by Marriage Status in Mount Hope
Out of a total of 483 households in Mount Hope, 220 (45.6%) are family households, while 263 (54.4%) are nonfamily households. The most numerous type of family households are 2-person households, comprising 107, and the most common type of nonfamily households are 1-person households, comprising 231.
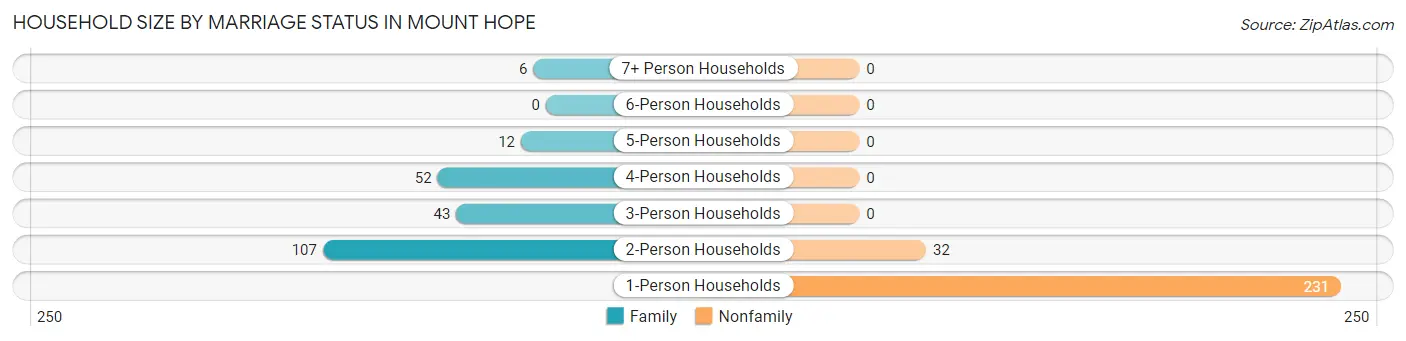
| Household Size | Family Households | Nonfamily Households |
| 1-Person Households | - | 231 (47.8%) |
| 2-Person Households | 107 (22.2%) | 32 (6.6%) |
| 3-Person Households | 43 (8.9%) | 0 (0.0%) |
| 4-Person Households | 52 (10.8%) | 0 (0.0%) |
| 5-Person Households | 12 (2.5%) | 0 (0.0%) |
| 6-Person Households | 0 (0.0%) | 0 (0.0%) |
| 7+ Person Households | 6 (1.2%) | 0 (0.0%) |
| Total | 220 (45.6%) | 263 (54.4%) |
Female Fertility in Mount Hope
Fertility by Age in Mount Hope
| Age Bracket | Women with Births | Births / 1,000 Women |
| 15 to 19 years | 0 (0.0%) | 0.0 |
| 20 to 34 years | 0 (0.0%) | 0.0 |
| 35 to 50 years | 0 (0.0%) | 0.0 |
| Total | 0 (0.0%) | 0.0 |
Fertility by Age by Marriage Status in Mount Hope
| Age Bracket | Married | Unmarried |
| 15 to 19 years | 0 (0.0%) | 0 (0.0%) |
| 20 to 34 years | 0 (0.0%) | 0 (0.0%) |
| 35 to 50 years | 0 (0.0%) | 0 (0.0%) |
| Total | 0 (0.0%) | 0 (0.0%) |
Fertility by Education in Mount Hope
| Educational Attainment | Women with Births | Births / 1,000 Women |
| Less than High School | 0 (0.0%) | 0.0 |
| High School Diploma | 0 (0.0%) | 0.0 |
| College or Associate's Degree | 0 (0.0%) | 0.0 |
| Bachelor's Degree | 0 (0.0%) | 0.0 |
| Graduate Degree | 0 (0.0%) | 0.0 |
| Total | 0 (0.0%) | 0.0 |
Fertility by Education by Marriage Status in Mount Hope
| Educational Attainment | Married | Unmarried |
| Less than High School | 0 (0.0%) | 0 (0.0%) |
| High School Diploma | 0 (0.0%) | 0 (0.0%) |
| College or Associate's Degree | 0 (0.0%) | 0 (0.0%) |
| Bachelor's Degree | 0 (0.0%) | 0 (0.0%) |
| Graduate Degree | 0 (0.0%) | 0 (0.0%) |
| Total | 0 (0.0%) | 0 (0.0%) |
Employment Characteristics in Mount Hope
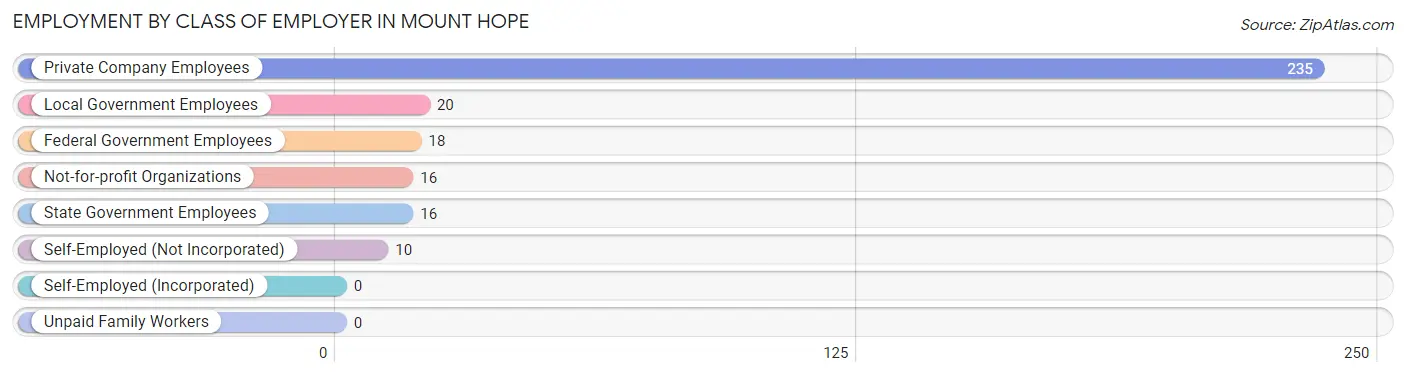
Employment by Class of Employer in Mount Hope
Among the 315 employed individuals in Mount Hope, private company employees (235 | 74.6%), local government employees (20 | 6.4%), and federal government employees (18 | 5.7%) make up the most common classes of employment.
| Employer Class | # Employees | % Employees |
| Private Company Employees | 235 | 74.6% |
| Self-Employed (Incorporated) | 0 | 0.0% |
| Self-Employed (Not Incorporated) | 10 | 3.2% |
| Not-for-profit Organizations | 16 | 5.1% |
| Local Government Employees | 20 | 6.4% |
| State Government Employees | 16 | 5.1% |
| Federal Government Employees | 18 | 5.7% |
| Unpaid Family Workers | 0 | 0.0% |
| Total | 315 | 100.0% |
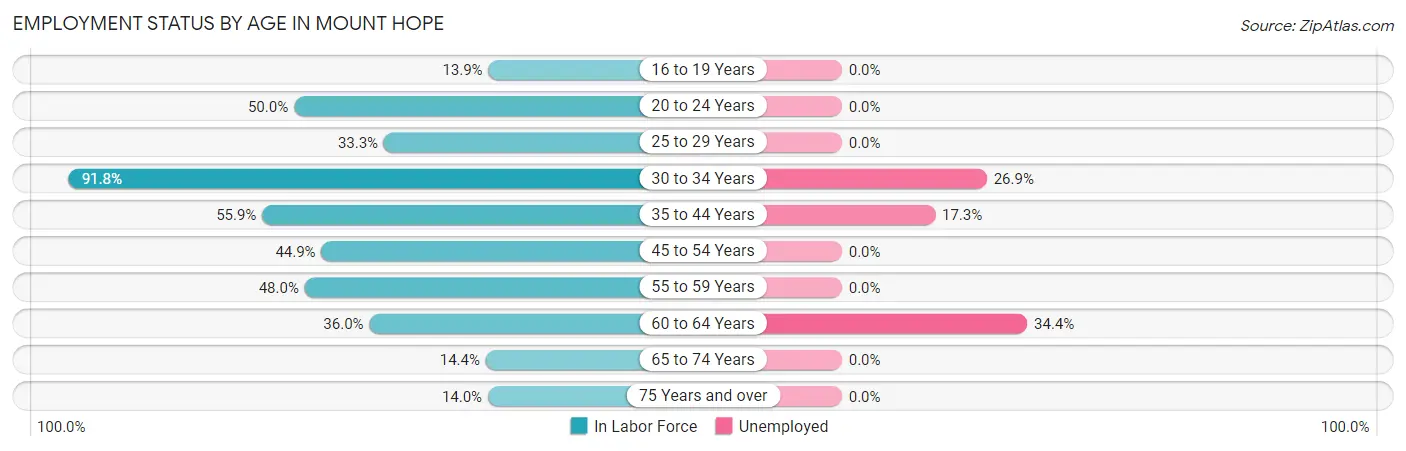
Employment Status by Age in Mount Hope
According to the labor force statistics for Mount Hope, out of the total population over 16 years of age (900), 40.2% or 362 individuals are in the labor force, with 11.9% or 43 of them unemployed. The age group with the highest labor force participation rate is 30 to 34 years, with 91.8% or 67 individuals in the labor force. Within the labor force, the 60 to 64 years age range has the highest percentage of unemployed individuals, with 34.4% or 11 of them being unemployed.
| Age Bracket | In Labor Force | Unemployed |
| 16 to 19 Years | 5 (13.9%) | 0 (0.0%) |
| 20 to 24 Years | 48 (50.0%) | 0 (0.0%) |
| 25 to 29 Years | 11 (33.3%) | 0 (0.0%) |
| 30 to 34 Years | 67 (91.8%) | 18 (26.9%) |
| 35 to 44 Years | 81 (55.9%) | 14 (17.3%) |
| 45 to 54 Years | 71 (44.9%) | 0 (0.0%) |
| 55 to 59 Years | 12 (48.0%) | 0 (0.0%) |
| 60 to 64 Years | 32 (36.0%) | 11 (34.4%) |
| 65 to 74 Years | 27 (14.4%) | 0 (0.0%) |
| 75 Years and over | 8 (14.0%) | 0 (0.0%) |
| Total | 362 (40.2%) | 43 (11.9%) |
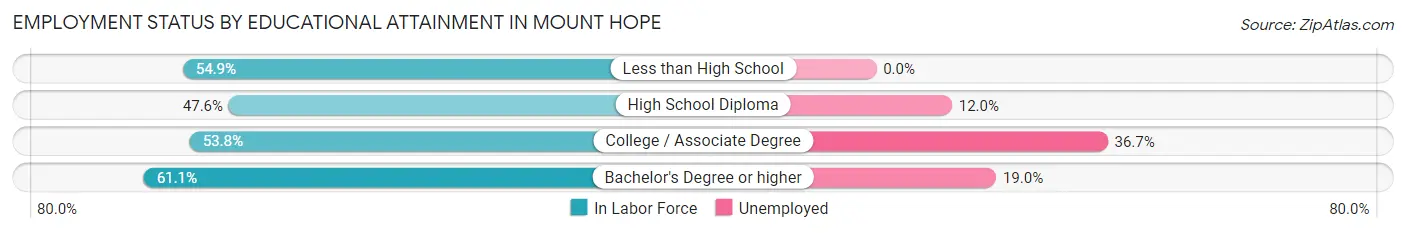
Employment Status by Educational Attainment in Mount Hope
According to labor force statistics for Mount Hope, 52.4% of individuals (274) out of the total population between 25 and 64 years of age (523) are in the labor force, with 15.7% or 43 of them being unemployed. The group with the highest labor force participation rate are those with the educational attainment of bachelor's degree or higher, with 61.1% or 58 individuals in the labor force. Within the labor force, individuals with college / associate degree education have the highest percentage of unemployment, with 36.7% or 18 of them being unemployed.
| Educational Attainment | In Labor Force | Unemployed |
| Less than High School | 50 (54.9%) | 0 (0.0%) |
| High School Diploma | 117 (47.6%) | 30 (12.0%) |
| College / Associate Degree | 49 (53.8%) | 33 (36.7%) |
| Bachelor's Degree or higher | 58 (61.1%) | 18 (19.0%) |
| Total | 274 (52.4%) | 82 (15.7%) |
Employment Occupations by Sex in Mount Hope
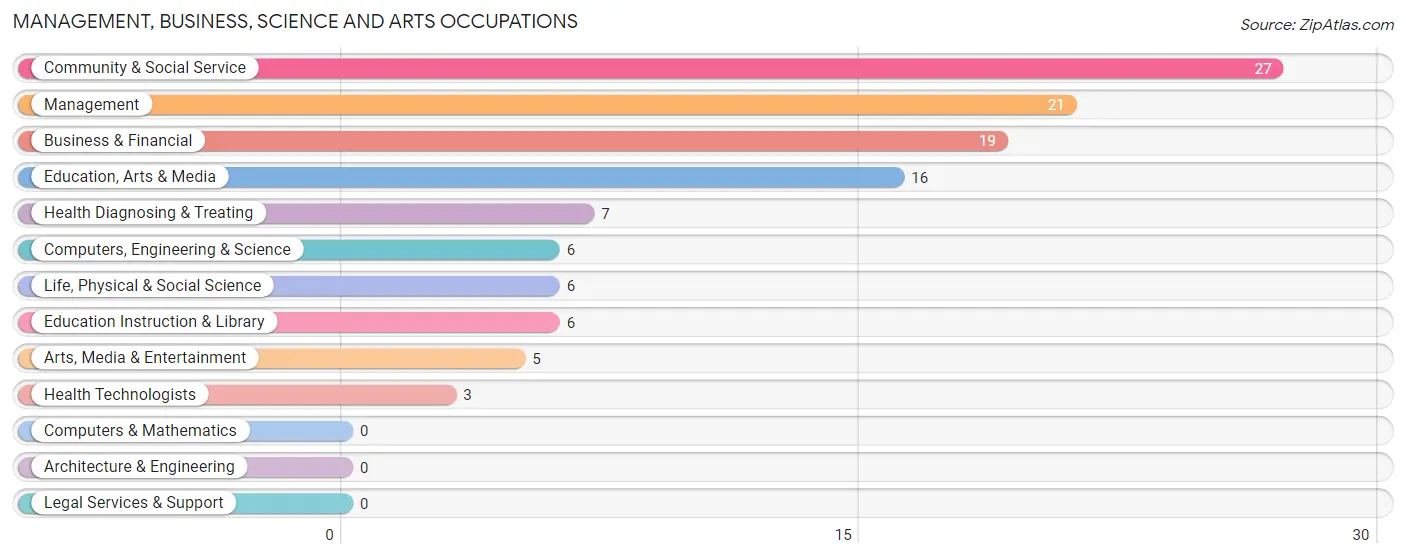
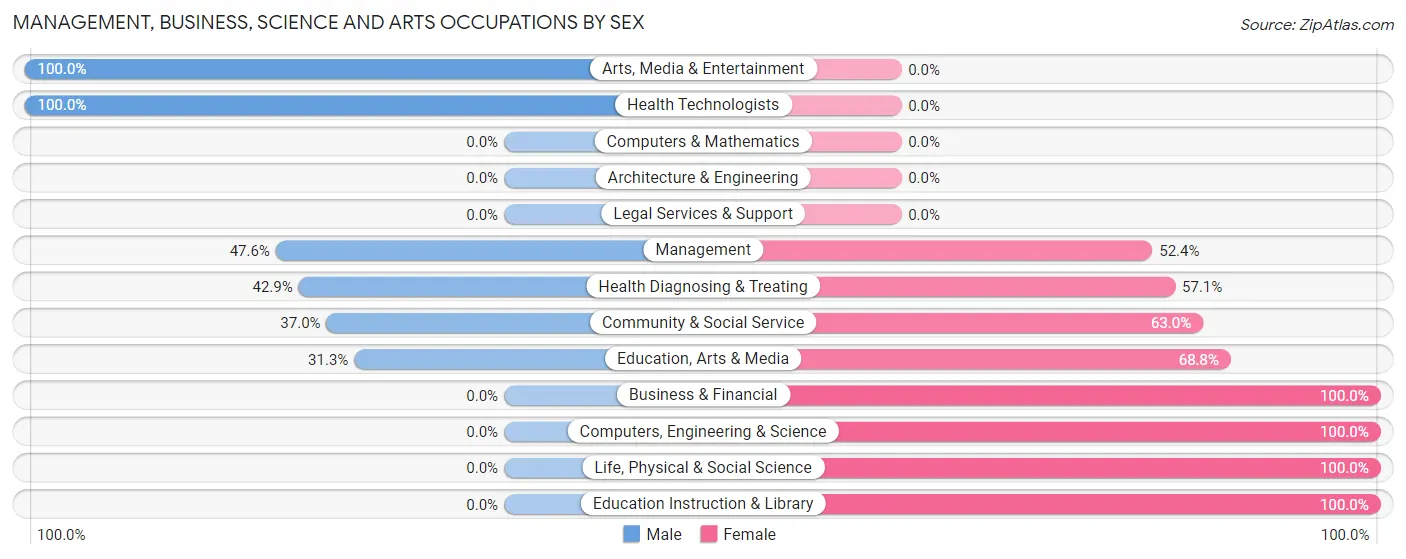
Management, Business, Science and Arts Occupations
The most common Management, Business, Science and Arts occupations in Mount Hope are Community & Social Service (27 | 8.5%), Management (21 | 6.6%), Business & Financial (19 | 6.0%), Education, Arts & Media (16 | 5.0%), and Health Diagnosing & Treating (7 | 2.2%).
Management, Business, Science and Arts Occupations by Sex
Within the Management, Business, Science and Arts occupations in Mount Hope, the most male-oriented occupations are Arts, Media & Entertainment (100.0%), Health Technologists (100.0%), and Management (47.6%), while the most female-oriented occupations are Business & Financial (100.0%), Computers, Engineering & Science (100.0%), and Life, Physical & Social Science (100.0%).
| Occupation | Male | Female |
| Management | 10 (47.6%) | 11 (52.4%) |
| Business & Financial | 0 (0.0%) | 19 (100.0%) |
| Computers, Engineering & Science | 0 (0.0%) | 6 (100.0%) |
| Computers & Mathematics | 0 (0.0%) | 0 (0.0%) |
| Architecture & Engineering | 0 (0.0%) | 0 (0.0%) |
| Life, Physical & Social Science | 0 (0.0%) | 6 (100.0%) |
| Community & Social Service | 10 (37.0%) | 17 (63.0%) |
| Education, Arts & Media | 5 (31.2%) | 11 (68.8%) |
| Legal Services & Support | 0 (0.0%) | 0 (0.0%) |
| Education Instruction & Library | 0 (0.0%) | 6 (100.0%) |
| Arts, Media & Entertainment | 5 (100.0%) | 0 (0.0%) |
| Health Diagnosing & Treating | 3 (42.9%) | 4 (57.1%) |
| Health Technologists | 3 (100.0%) | 0 (0.0%) |
| Total (Category) | 23 (28.7%) | 57 (71.3%) |
| Total (Overall) | 156 (48.9%) | 163 (51.1%) |
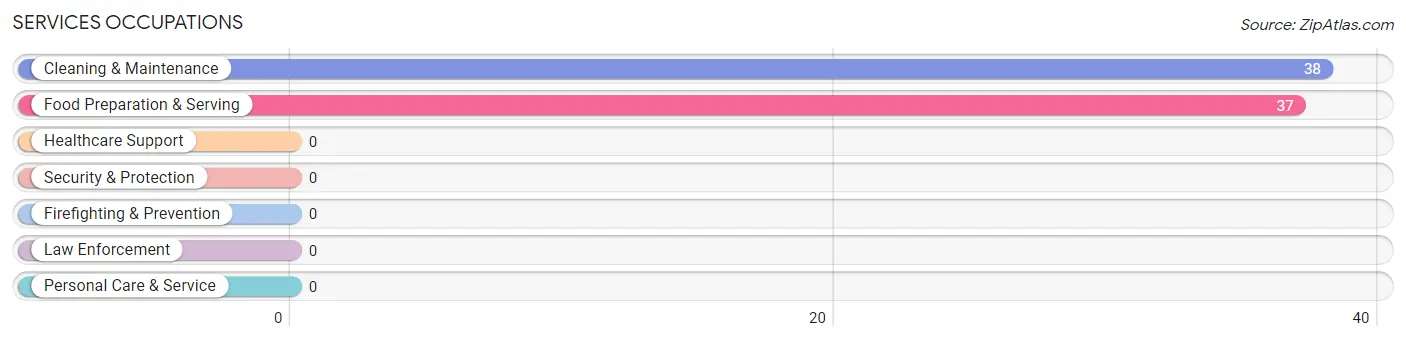
Services Occupations
The most common Services occupations in Mount Hope are Cleaning & Maintenance (38 | 11.9%), and Food Preparation & Serving (37 | 11.6%).
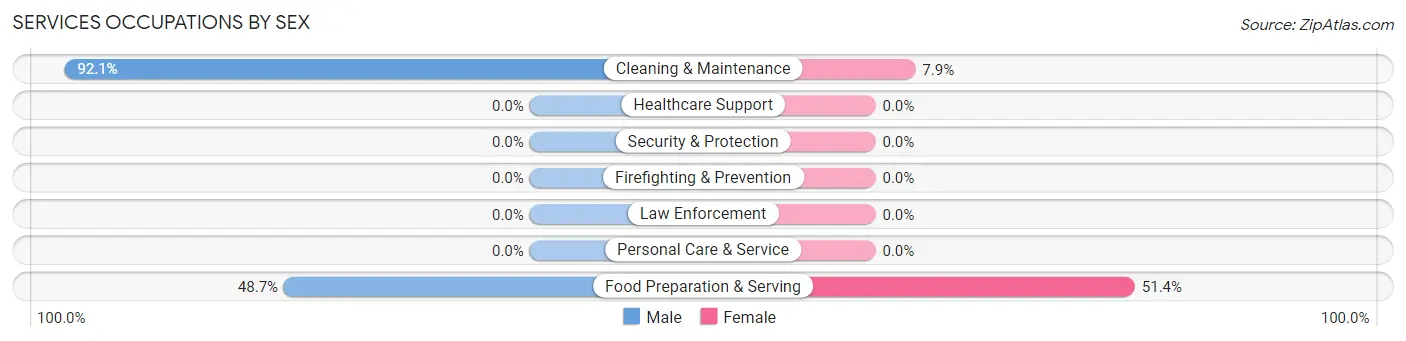
Services Occupations by Sex
Within the Services occupations in Mount Hope, the most male-oriented occupations are Cleaning & Maintenance (92.1%), and Food Preparation & Serving (48.6%), while the most female-oriented occupations are Food Preparation & Serving (51.3%), and Cleaning & Maintenance (7.9%).
| Occupation | Male | Female |
| Healthcare Support | 0 (0.0%) | 0 (0.0%) |
| Security & Protection | 0 (0.0%) | 0 (0.0%) |
| Firefighting & Prevention | 0 (0.0%) | 0 (0.0%) |
| Law Enforcement | 0 (0.0%) | 0 (0.0%) |
| Food Preparation & Serving | 18 (48.6%) | 19 (51.3%) |
| Cleaning & Maintenance | 35 (92.1%) | 3 (7.9%) |
| Personal Care & Service | 0 (0.0%) | 0 (0.0%) |
| Total (Category) | 53 (70.7%) | 22 (29.3%) |
| Total (Overall) | 156 (48.9%) | 163 (51.1%) |
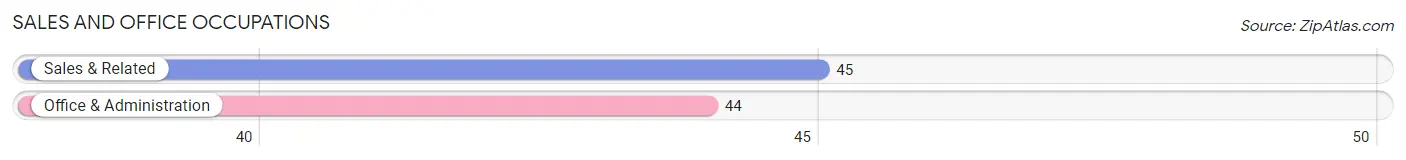
Sales and Office Occupations
The most common Sales and Office occupations in Mount Hope are Sales & Related (45 | 14.1%), and Office & Administration (44 | 13.8%).
Sales and Office Occupations by Sex
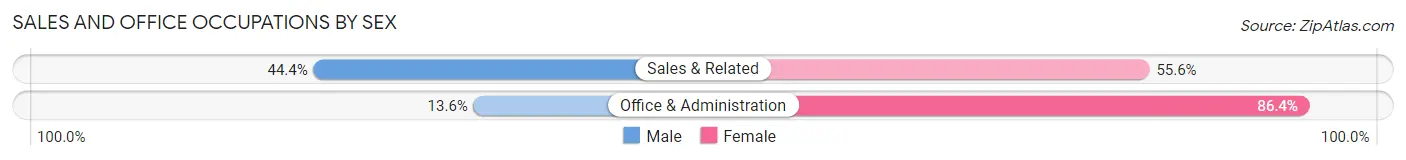
| Occupation | Male | Female |
| Sales & Related | 20 (44.4%) | 25 (55.6%) |
| Office & Administration | 6 (13.6%) | 38 (86.4%) |
| Total (Category) | 26 (29.2%) | 63 (70.8%) |
| Total (Overall) | 156 (48.9%) | 163 (51.1%) |
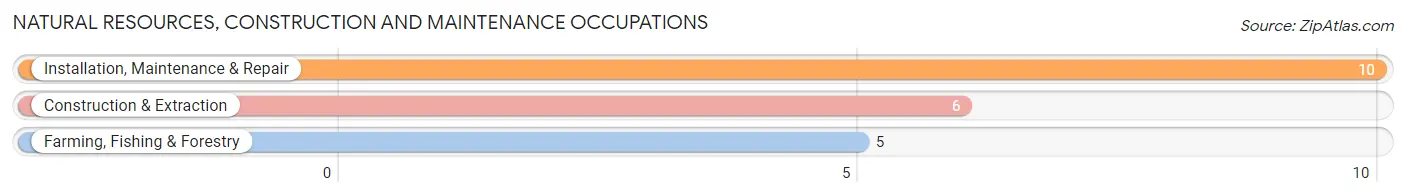
Natural Resources, Construction and Maintenance Occupations
The most common Natural Resources, Construction and Maintenance occupations in Mount Hope are Installation, Maintenance & Repair (10 | 3.1%), Construction & Extraction (6 | 1.9%), and Farming, Fishing & Forestry (5 | 1.6%).
Natural Resources, Construction and Maintenance Occupations by Sex
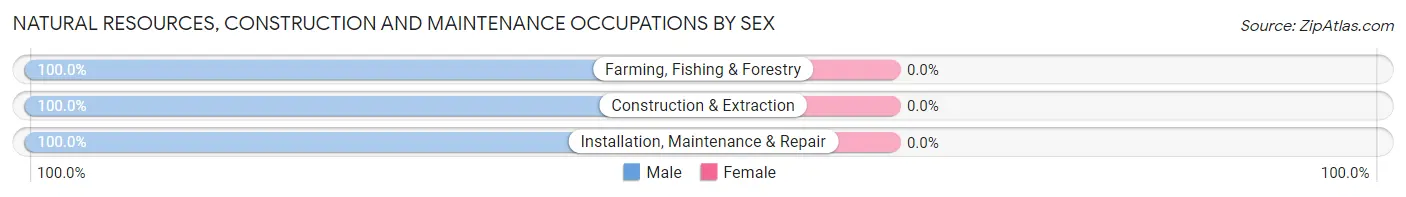
| Occupation | Male | Female |
| Farming, Fishing & Forestry | 5 (100.0%) | 0 (0.0%) |
| Construction & Extraction | 6 (100.0%) | 0 (0.0%) |
| Installation, Maintenance & Repair | 10 (100.0%) | 0 (0.0%) |
| Total (Category) | 21 (100.0%) | 0 (0.0%) |
| Total (Overall) | 156 (48.9%) | 163 (51.1%) |
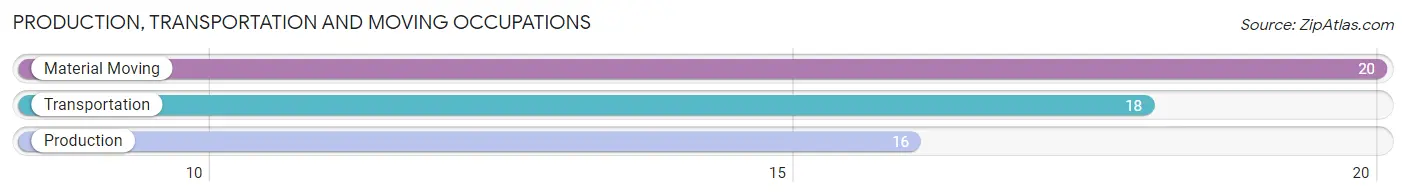
Production, Transportation and Moving Occupations
The most common Production, Transportation and Moving occupations in Mount Hope are Material Moving (20 | 6.3%), Transportation (18 | 5.6%), and Production (16 | 5.0%).
Production, Transportation and Moving Occupations by Sex
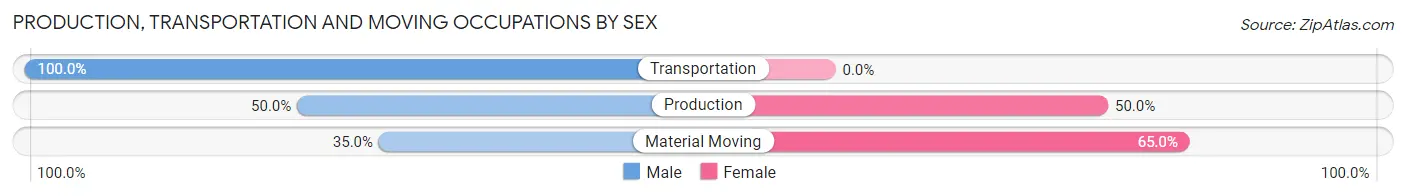
| Occupation | Male | Female |
| Production | 8 (50.0%) | 8 (50.0%) |
| Transportation | 18 (100.0%) | 0 (0.0%) |
| Material Moving | 7 (35.0%) | 13 (65.0%) |
| Total (Category) | 33 (61.1%) | 21 (38.9%) |
| Total (Overall) | 156 (48.9%) | 163 (51.1%) |
Employment Industries by Sex in Mount Hope
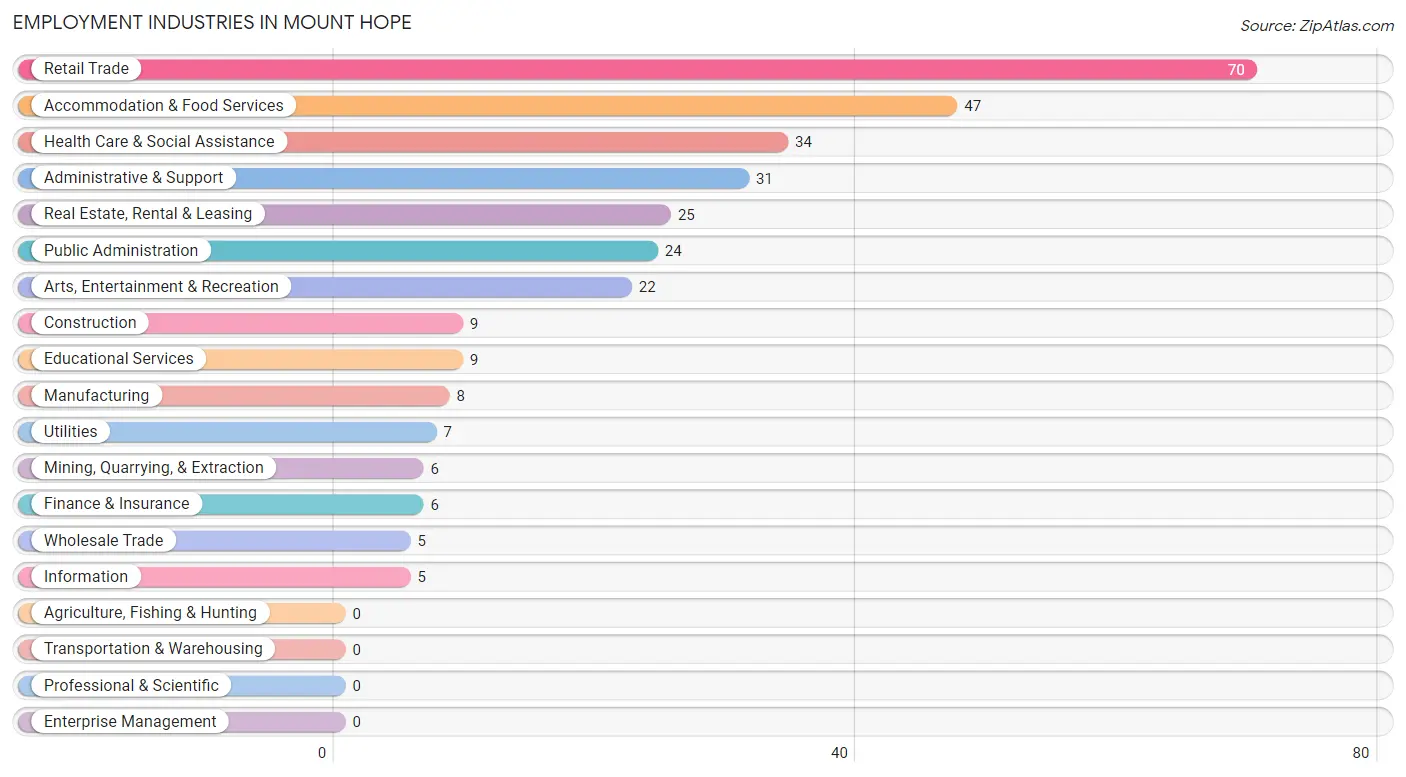
Employment Industries in Mount Hope
The major employment industries in Mount Hope include Retail Trade (70 | 21.9%), Accommodation & Food Services (47 | 14.7%), Health Care & Social Assistance (34 | 10.7%), Administrative & Support (31 | 9.7%), and Real Estate, Rental & Leasing (25 | 7.8%).
Employment Industries by Sex in Mount Hope
The Mount Hope industries that see more men than women are Mining, Quarrying, & Extraction (100.0%), Construction (100.0%), and Wholesale Trade (100.0%), whereas the industries that tend to have a higher number of women are Manufacturing (100.0%), Educational Services (100.0%), and Public Administration (100.0%).
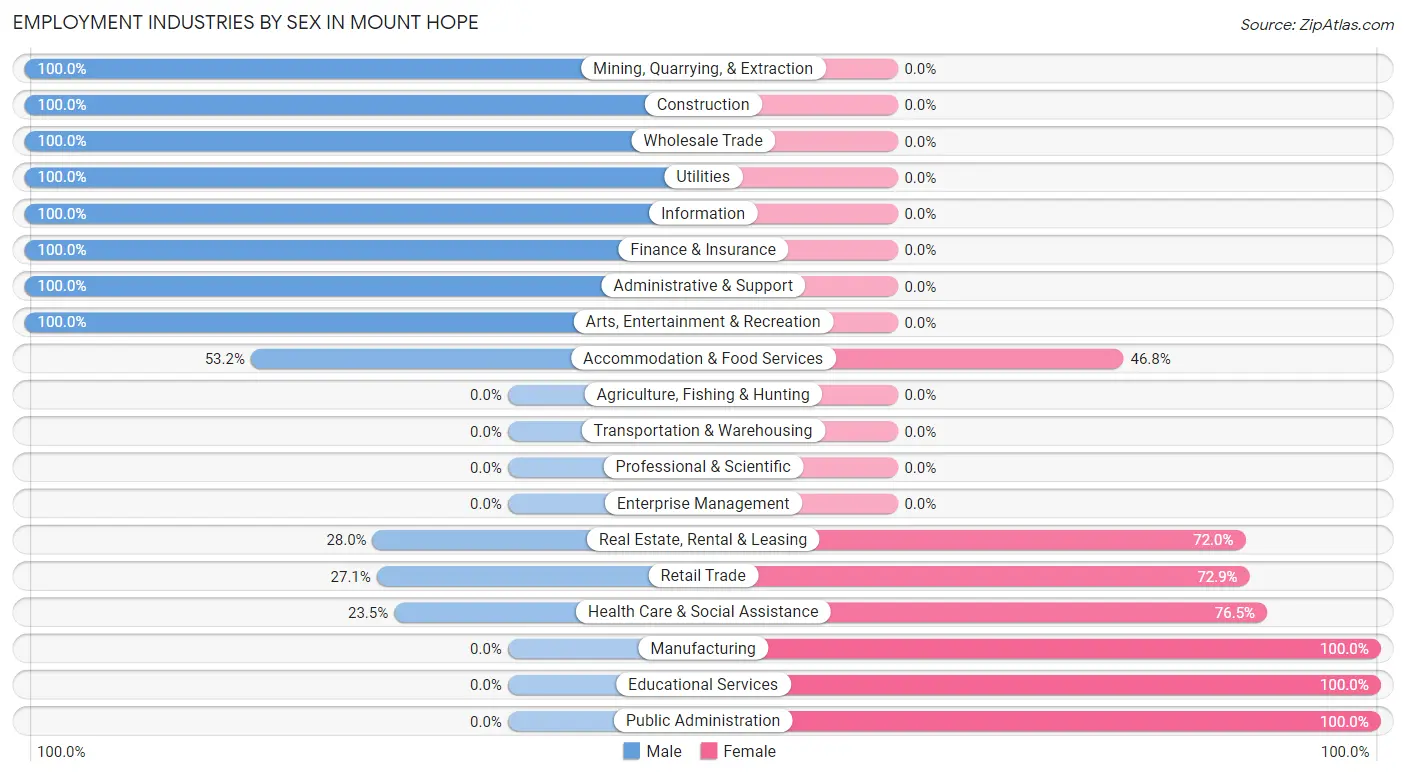
| Industry | Male | Female |
| Agriculture, Fishing & Hunting | 0 (0.0%) | 0 (0.0%) |
| Mining, Quarrying, & Extraction | 6 (100.0%) | 0 (0.0%) |
| Construction | 9 (100.0%) | 0 (0.0%) |
| Manufacturing | 0 (0.0%) | 8 (100.0%) |
| Wholesale Trade | 5 (100.0%) | 0 (0.0%) |
| Retail Trade | 19 (27.1%) | 51 (72.9%) |
| Transportation & Warehousing | 0 (0.0%) | 0 (0.0%) |
| Utilities | 7 (100.0%) | 0 (0.0%) |
| Information | 5 (100.0%) | 0 (0.0%) |
| Finance & Insurance | 6 (100.0%) | 0 (0.0%) |
| Real Estate, Rental & Leasing | 7 (28.0%) | 18 (72.0%) |
| Professional & Scientific | 0 (0.0%) | 0 (0.0%) |
| Enterprise Management | 0 (0.0%) | 0 (0.0%) |
| Administrative & Support | 31 (100.0%) | 0 (0.0%) |
| Educational Services | 0 (0.0%) | 9 (100.0%) |
| Health Care & Social Assistance | 8 (23.5%) | 26 (76.5%) |
| Arts, Entertainment & Recreation | 22 (100.0%) | 0 (0.0%) |
| Accommodation & Food Services | 25 (53.2%) | 22 (46.8%) |
| Public Administration | 0 (0.0%) | 24 (100.0%) |
| Total | 156 (48.9%) | 163 (51.1%) |
Education in Mount Hope
School Enrollment in Mount Hope
The most common levels of schooling among the 151 students in Mount Hope are middle school (55 | 36.4%), high school (43 | 28.5%), and elementary school (39 | 25.8%).
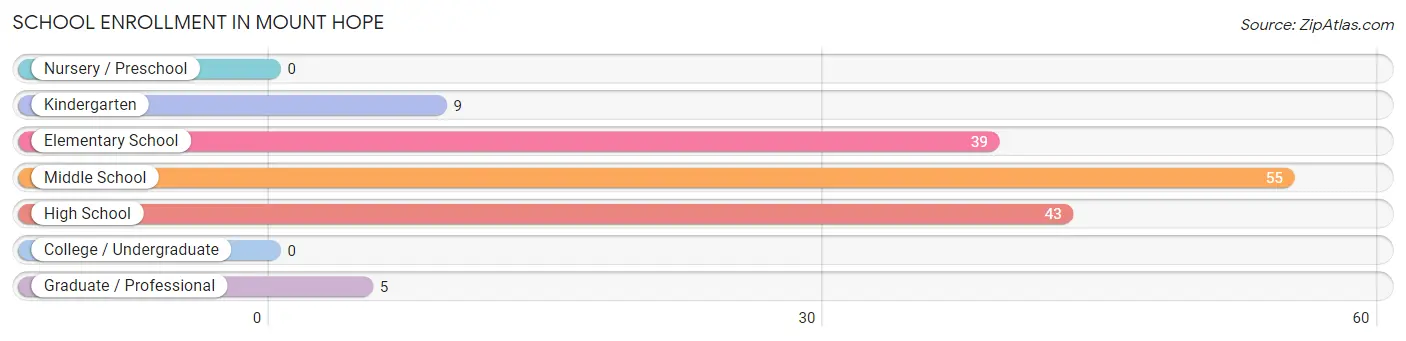
| School Level | # Students | % Students |
| Nursery / Preschool | 0 | 0.0% |
| Kindergarten | 9 | 6.0% |
| Elementary School | 39 | 25.8% |
| Middle School | 55 | 36.4% |
| High School | 43 | 28.5% |
| College / Undergraduate | 0 | 0.0% |
| Graduate / Professional | 5 | 3.3% |
| Total | 151 | 100.0% |
School Enrollment by Age by Funding Source in Mount Hope
Out of a total of 151 students who are enrolled in schools in Mount Hope, 22 (14.6%) attend a private institution, while the remaining 129 (85.4%) are enrolled in public schools. The age group of 35 years and over has the highest likelihood of being enrolled in private schools, with 5 (100.0% in the age bracket) enrolled. Conversely, the age group of 5 to 9 year old has the lowest likelihood of being enrolled in a private school, with 48 (100.0% in the age bracket) attending a public institution.
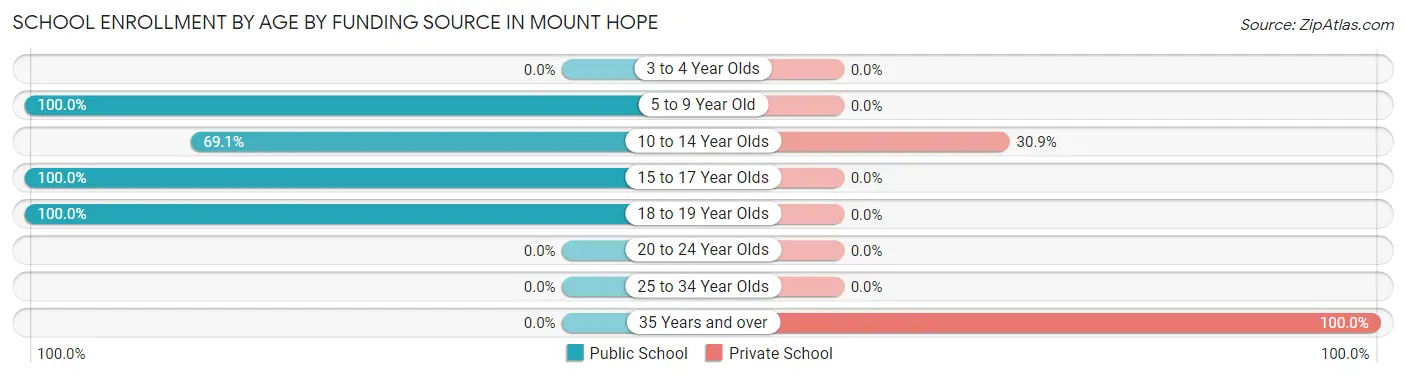
| Age Bracket | Public School | Private School |
| 3 to 4 Year Olds | 0 (0.0%) | 0 (0.0%) |
| 5 to 9 Year Old | 48 (100.0%) | 0 (0.0%) |
| 10 to 14 Year Olds | 38 (69.1%) | 17 (30.9%) |
| 15 to 17 Year Olds | 26 (100.0%) | 0 (0.0%) |
| 18 to 19 Year Olds | 17 (100.0%) | 0 (0.0%) |
| 20 to 24 Year Olds | 0 (0.0%) | 0 (0.0%) |
| 25 to 34 Year Olds | 0 (0.0%) | 0 (0.0%) |
| 35 Years and over | 0 (0.0%) | 5 (100.0%) |
| Total | 129 (85.4%) | 22 (14.6%) |
Educational Attainment by Field of Study in Mount Hope
Business (27 | 19.0%), science & technology (23 | 16.2%), liberal arts & history (22 | 15.5%), psychology (20 | 14.1%), and arts & humanities (15 | 10.6%) are the most common fields of study among 142 individuals in Mount Hope who have obtained a bachelor's degree or higher.
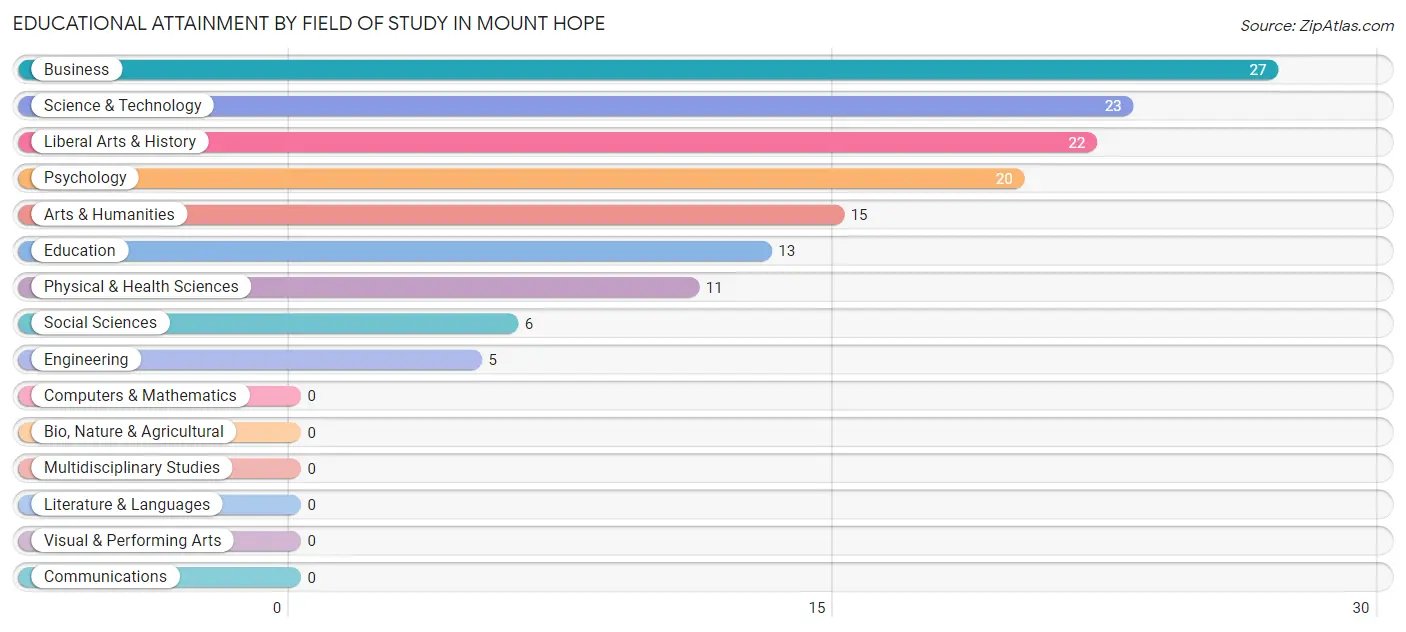
| Field of Study | # Graduates | % Graduates |
| Computers & Mathematics | 0 | 0.0% |
| Bio, Nature & Agricultural | 0 | 0.0% |
| Physical & Health Sciences | 11 | 7.7% |
| Psychology | 20 | 14.1% |
| Social Sciences | 6 | 4.2% |
| Engineering | 5 | 3.5% |
| Multidisciplinary Studies | 0 | 0.0% |
| Science & Technology | 23 | 16.2% |
| Business | 27 | 19.0% |
| Education | 13 | 9.1% |
| Literature & Languages | 0 | 0.0% |
| Liberal Arts & History | 22 | 15.5% |
| Visual & Performing Arts | 0 | 0.0% |
| Communications | 0 | 0.0% |
| Arts & Humanities | 15 | 10.6% |
| Total | 142 | 100.0% |
Transportation & Commute in Mount Hope
Vehicle Availability by Sex in Mount Hope
The most prevalent vehicle ownership categories in Mount Hope are males with 2 vehicles (94, accounting for 61.8%) and females with 2 vehicles (51, making up 57.7%).
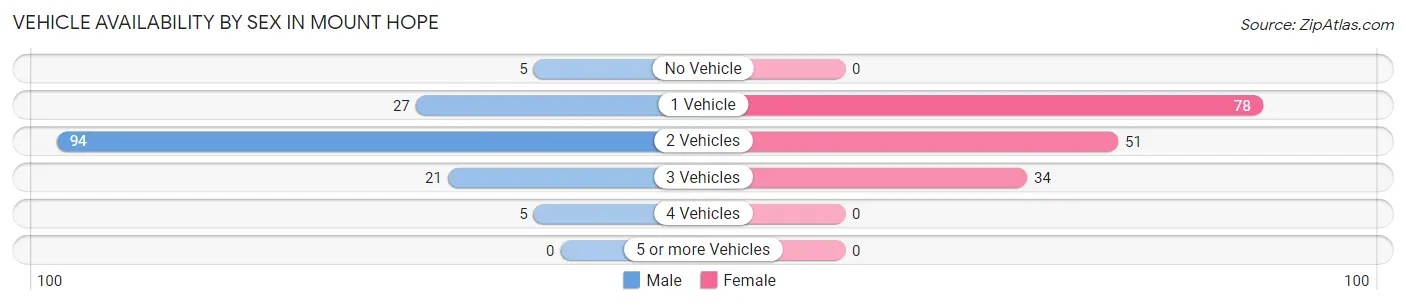
| Vehicles Available | Male | Female |
| No Vehicle | 5 (3.3%) | 0 (0.0%) |
| 1 Vehicle | 27 (17.8%) | 78 (47.8%) |
| 2 Vehicles | 94 (61.8%) | 51 (31.3%) |
| 3 Vehicles | 21 (13.8%) | 34 (20.9%) |
| 4 Vehicles | 5 (3.3%) | 0 (0.0%) |
| 5 or more Vehicles | 0 (0.0%) | 0 (0.0%) |
| Total | 152 (100.0%) | 163 (100.0%) |
Commute Time in Mount Hope
The most frequently occuring commute durations in Mount Hope are 20 to 24 minutes (74 commuters, 24.5%), 10 to 14 minutes (69 commuters, 22.9%), and 30 to 34 minutes (53 commuters, 17.5%).
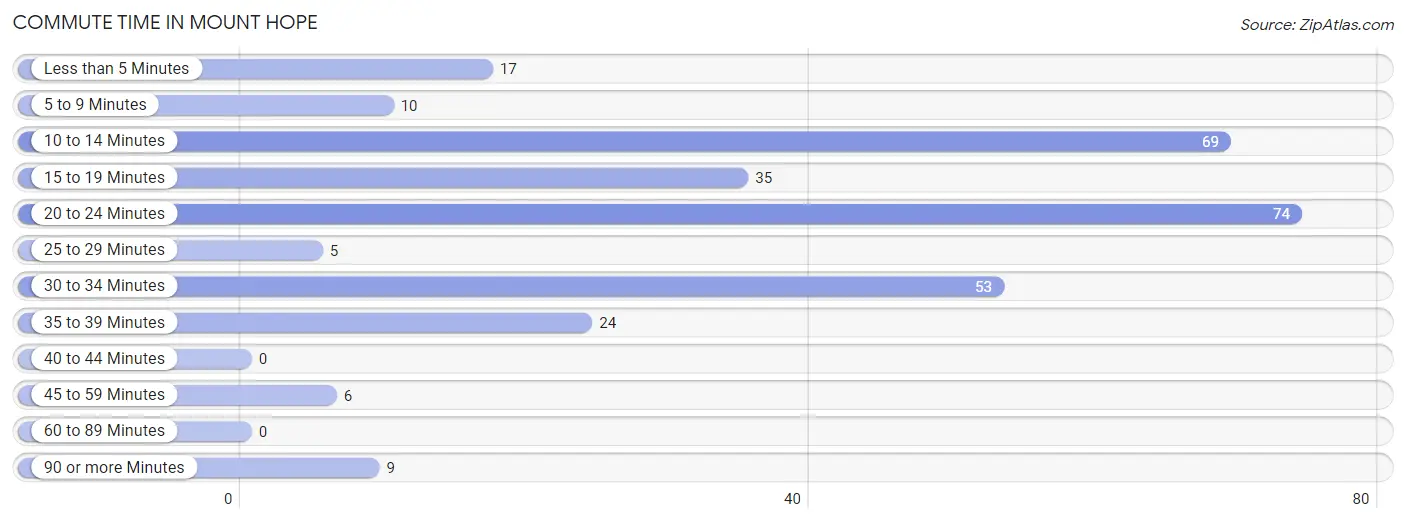
| Commute Time | # Commuters | % Commuters |
| Less than 5 Minutes | 17 | 5.6% |
| 5 to 9 Minutes | 10 | 3.3% |
| 10 to 14 Minutes | 69 | 22.9% |
| 15 to 19 Minutes | 35 | 11.6% |
| 20 to 24 Minutes | 74 | 24.5% |
| 25 to 29 Minutes | 5 | 1.7% |
| 30 to 34 Minutes | 53 | 17.5% |
| 35 to 39 Minutes | 24 | 8.0% |
| 40 to 44 Minutes | 0 | 0.0% |
| 45 to 59 Minutes | 6 | 2.0% |
| 60 to 89 Minutes | 0 | 0.0% |
| 90 or more Minutes | 9 | 3.0% |
Commute Time by Sex in Mount Hope
The most common commute times in Mount Hope are 20 to 24 minutes (43 commuters, 29.2%) for males and 30 to 34 minutes (50 commuters, 32.3%) for females.
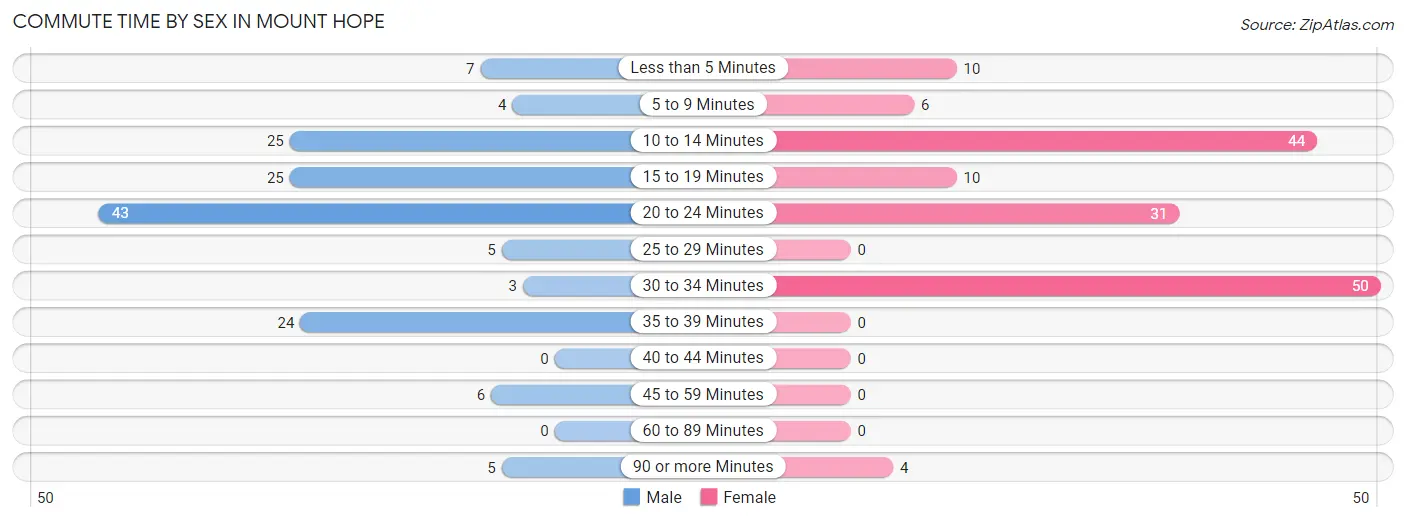
| Commute Time | Male | Female |
| Less than 5 Minutes | 7 (4.8%) | 10 (6.5%) |
| 5 to 9 Minutes | 4 (2.7%) | 6 (3.9%) |
| 10 to 14 Minutes | 25 (17.0%) | 44 (28.4%) |
| 15 to 19 Minutes | 25 (17.0%) | 10 (6.5%) |
| 20 to 24 Minutes | 43 (29.2%) | 31 (20.0%) |
| 25 to 29 Minutes | 5 (3.4%) | 0 (0.0%) |
| 30 to 34 Minutes | 3 (2.0%) | 50 (32.3%) |
| 35 to 39 Minutes | 24 (16.3%) | 0 (0.0%) |
| 40 to 44 Minutes | 0 (0.0%) | 0 (0.0%) |
| 45 to 59 Minutes | 6 (4.1%) | 0 (0.0%) |
| 60 to 89 Minutes | 0 (0.0%) | 0 (0.0%) |
| 90 or more Minutes | 5 (3.4%) | 4 (2.6%) |
Time of Departure to Work by Sex in Mount Hope
The most frequent times of departure to work in Mount Hope are 6:30 AM to 6:59 AM (36, 24.5%) for males and 7:00 AM to 7:29 AM (51, 32.9%) for females.
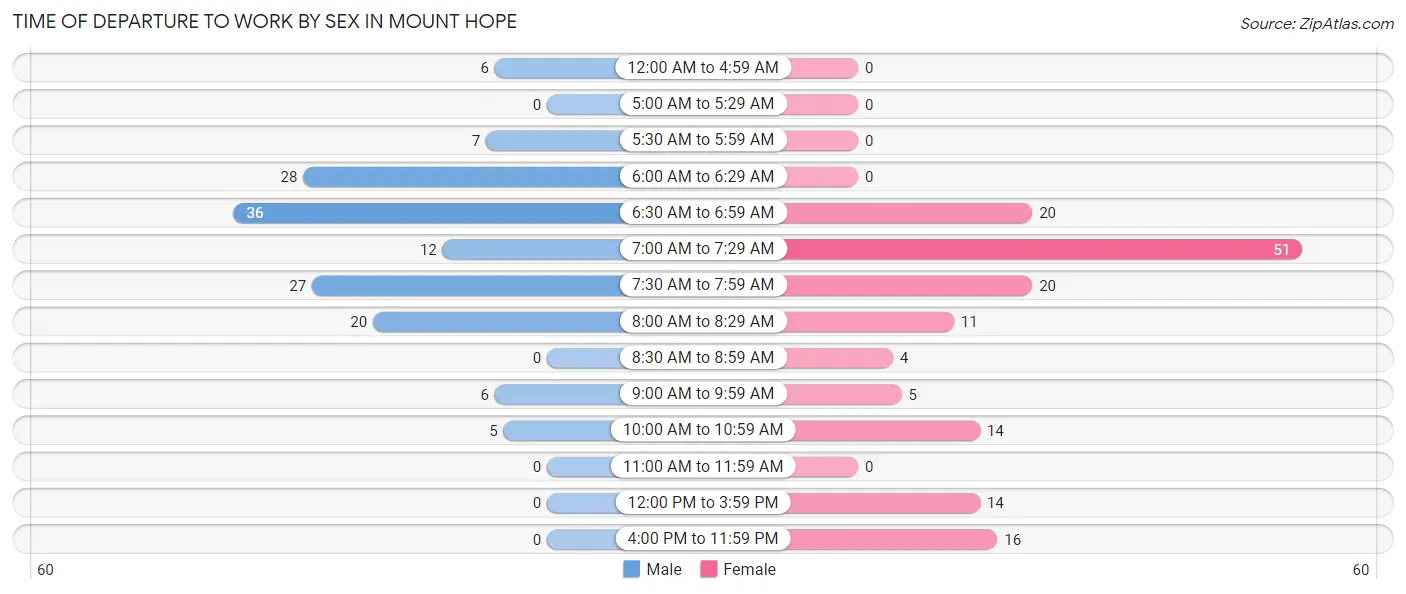
| Time of Departure | Male | Female |
| 12:00 AM to 4:59 AM | 6 (4.1%) | 0 (0.0%) |
| 5:00 AM to 5:29 AM | 0 (0.0%) | 0 (0.0%) |
| 5:30 AM to 5:59 AM | 7 (4.8%) | 0 (0.0%) |
| 6:00 AM to 6:29 AM | 28 (19.1%) | 0 (0.0%) |
| 6:30 AM to 6:59 AM | 36 (24.5%) | 20 (12.9%) |
| 7:00 AM to 7:29 AM | 12 (8.2%) | 51 (32.9%) |
| 7:30 AM to 7:59 AM | 27 (18.4%) | 20 (12.9%) |
| 8:00 AM to 8:29 AM | 20 (13.6%) | 11 (7.1%) |
| 8:30 AM to 8:59 AM | 0 (0.0%) | 4 (2.6%) |
| 9:00 AM to 9:59 AM | 6 (4.1%) | 5 (3.2%) |
| 10:00 AM to 10:59 AM | 5 (3.4%) | 14 (9.0%) |
| 11:00 AM to 11:59 AM | 0 (0.0%) | 0 (0.0%) |
| 12:00 PM to 3:59 PM | 0 (0.0%) | 14 (9.0%) |
| 4:00 PM to 11:59 PM | 0 (0.0%) | 16 (10.3%) |
| Total | 147 (100.0%) | 155 (100.0%) |
Housing Occupancy in Mount Hope
Occupancy by Ownership in Mount Hope
Of the total 483 dwellings in Mount Hope, owner-occupied units account for 227 (47.0%), while renter-occupied units make up 256 (53.0%).
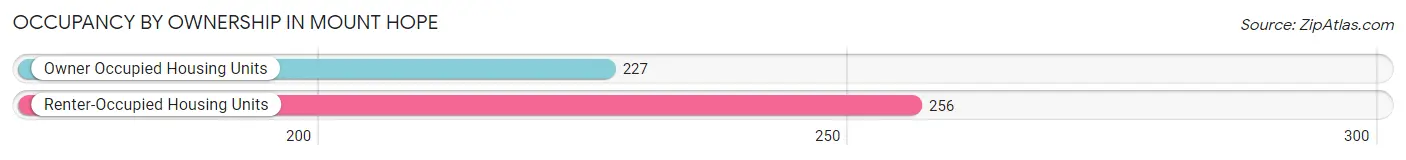
| Occupancy | # Housing Units | % Housing Units |
| Owner Occupied Housing Units | 227 | 47.0% |
| Renter-Occupied Housing Units | 256 | 53.0% |
| Total Occupied Housing Units | 483 | 100.0% |
Occupancy by Household Size in Mount Hope
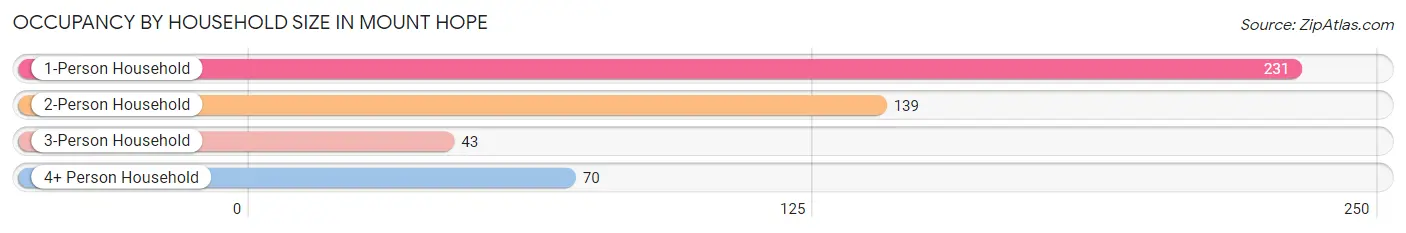
| Household Size | # Housing Units | % Housing Units |
| 1-Person Household | 231 | 47.8% |
| 2-Person Household | 139 | 28.8% |
| 3-Person Household | 43 | 8.9% |
| 4+ Person Household | 70 | 14.5% |
| Total Housing Units | 483 | 100.0% |
Occupancy by Ownership by Household Size in Mount Hope
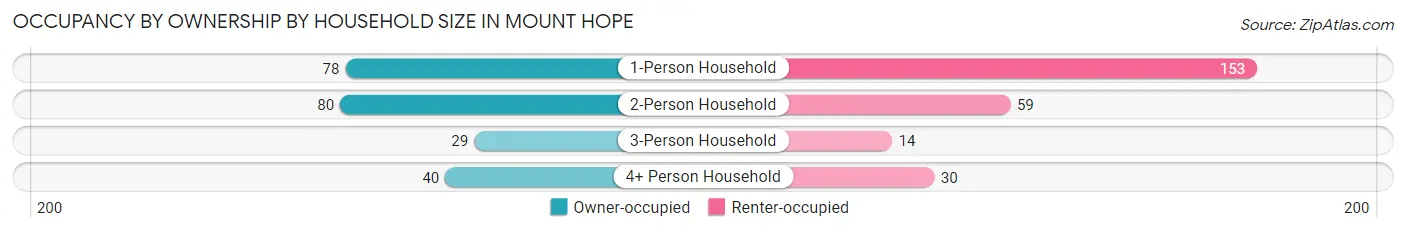
| Household Size | Owner-occupied | Renter-occupied |
| 1-Person Household | 78 (33.8%) | 153 (66.2%) |
| 2-Person Household | 80 (57.6%) | 59 (42.4%) |
| 3-Person Household | 29 (67.4%) | 14 (32.6%) |
| 4+ Person Household | 40 (57.1%) | 30 (42.9%) |
| Total Housing Units | 227 (47.0%) | 256 (53.0%) |
Occupancy by Educational Attainment in Mount Hope
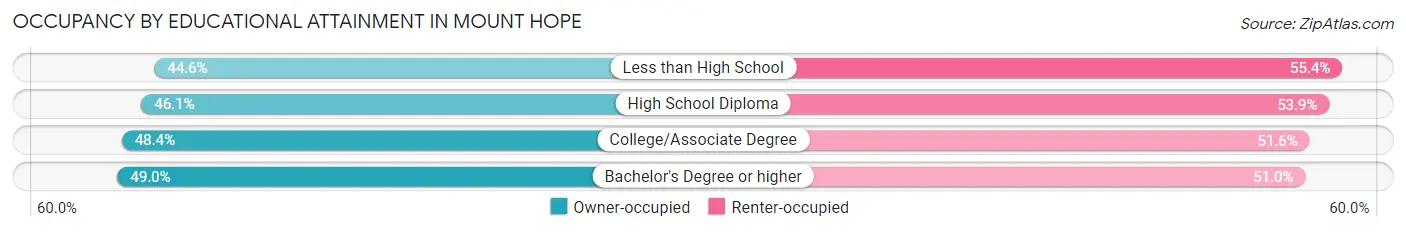
| Household Size | Owner-occupied | Renter-occupied |
| Less than High School | 41 (44.6%) | 51 (55.4%) |
| High School Diploma | 77 (46.1%) | 90 (53.9%) |
| College/Associate Degree | 62 (48.4%) | 66 (51.6%) |
| Bachelor's Degree or higher | 47 (49.0%) | 49 (51.0%) |
Occupancy by Age of Householder in Mount Hope
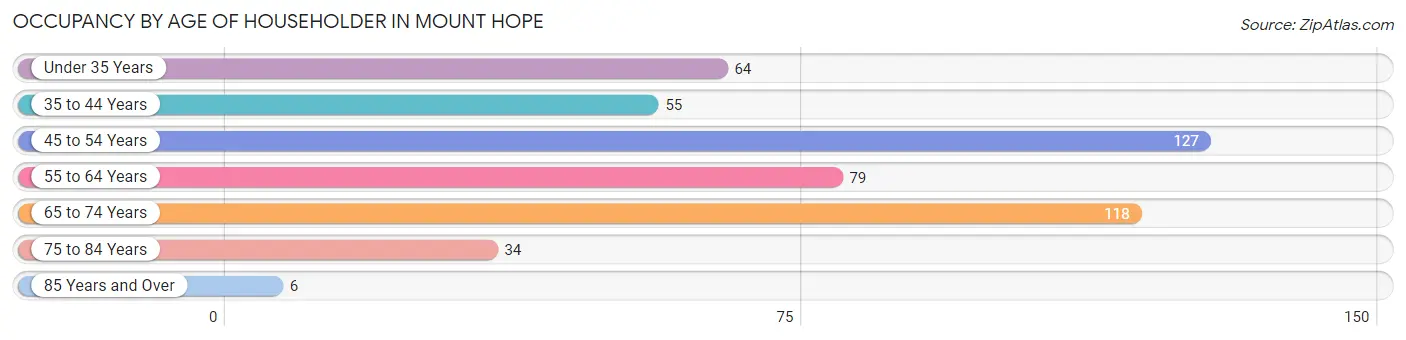
| Age Bracket | # Households | % Households |
| Under 35 Years | 64 | 13.3% |
| 35 to 44 Years | 55 | 11.4% |
| 45 to 54 Years | 127 | 26.3% |
| 55 to 64 Years | 79 | 16.4% |
| 65 to 74 Years | 118 | 24.4% |
| 75 to 84 Years | 34 | 7.0% |
| 85 Years and Over | 6 | 1.2% |
| Total | 483 | 100.0% |
Housing Finances in Mount Hope
Median Income by Occupancy in Mount Hope
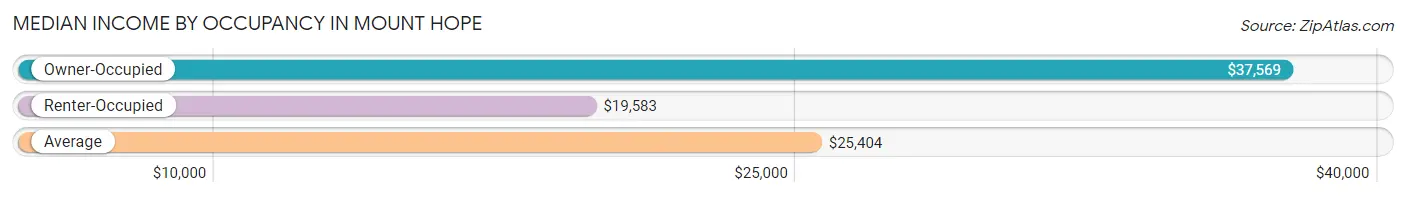
| Occupancy Type | # Households | Median Income |
| Owner-Occupied | 227 (47.0%) | $37,569 |
| Renter-Occupied | 256 (53.0%) | $19,583 |
| Average | 483 (100.0%) | $25,404 |
Occupancy by Householder Income Bracket in Mount Hope
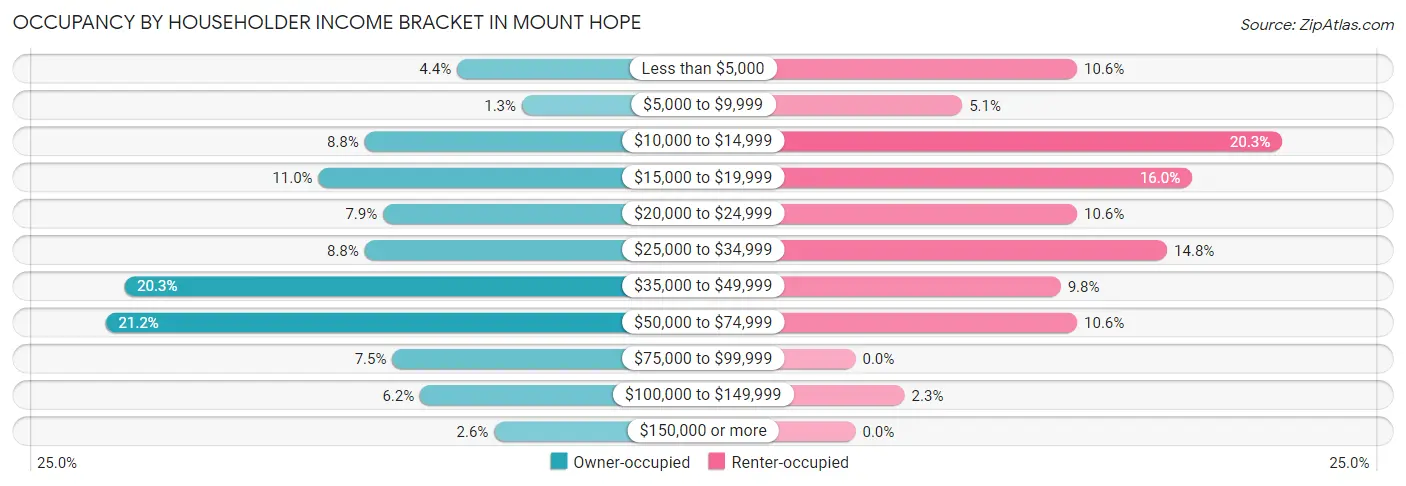
| Income Bracket | Owner-occupied | Renter-occupied |
| Less than $5,000 | 10 (4.4%) | 27 (10.5%) |
| $5,000 to $9,999 | 3 (1.3%) | 13 (5.1%) |
| $10,000 to $14,999 | 20 (8.8%) | 52 (20.3%) |
| $15,000 to $19,999 | 25 (11.0%) | 41 (16.0%) |
| $20,000 to $24,999 | 18 (7.9%) | 27 (10.5%) |
| $25,000 to $34,999 | 20 (8.8%) | 38 (14.8%) |
| $35,000 to $49,999 | 46 (20.3%) | 25 (9.8%) |
| $50,000 to $74,999 | 48 (21.1%) | 27 (10.5%) |
| $75,000 to $99,999 | 17 (7.5%) | 0 (0.0%) |
| $100,000 to $149,999 | 14 (6.2%) | 6 (2.3%) |
| $150,000 or more | 6 (2.6%) | 0 (0.0%) |
| Total | 227 (100.0%) | 256 (100.0%) |
Monthly Housing Cost Tiers in Mount Hope
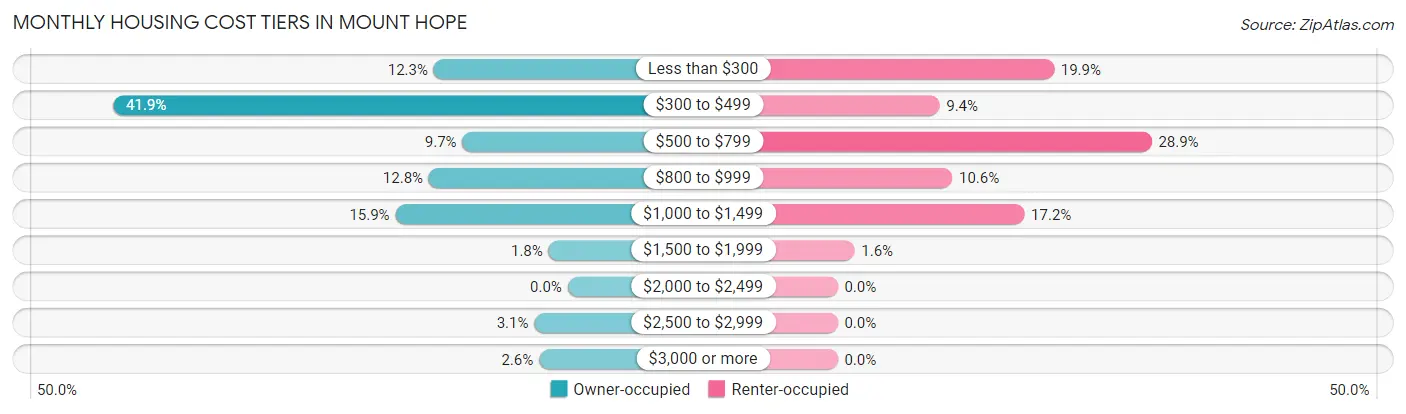
| Monthly Cost | Owner-occupied | Renter-occupied |
| Less than $300 | 28 (12.3%) | 51 (19.9%) |
| $300 to $499 | 95 (41.8%) | 24 (9.4%) |
| $500 to $799 | 22 (9.7%) | 74 (28.9%) |
| $800 to $999 | 29 (12.8%) | 27 (10.5%) |
| $1,000 to $1,499 | 36 (15.9%) | 44 (17.2%) |
| $1,500 to $1,999 | 4 (1.8%) | 4 (1.6%) |
| $2,000 to $2,499 | 0 (0.0%) | 0 (0.0%) |
| $2,500 to $2,999 | 7 (3.1%) | 0 (0.0%) |
| $3,000 or more | 6 (2.6%) | 0 (0.0%) |
| Total | 227 (100.0%) | 256 (100.0%) |
Physical Housing Characteristics in Mount Hope
Housing Structures in Mount Hope
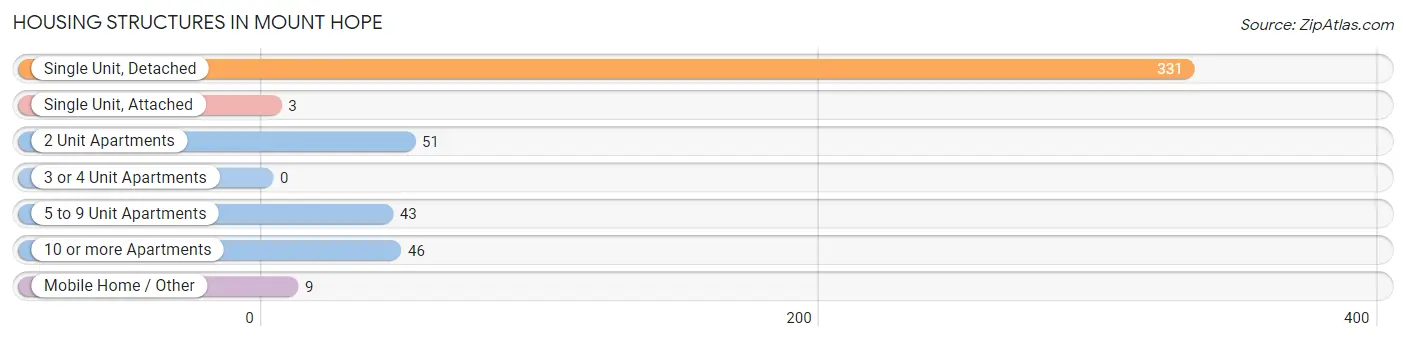
| Structure Type | # Housing Units | % Housing Units |
| Single Unit, Detached | 331 | 68.5% |
| Single Unit, Attached | 3 | 0.6% |
| 2 Unit Apartments | 51 | 10.6% |
| 3 or 4 Unit Apartments | 0 | 0.0% |
| 5 to 9 Unit Apartments | 43 | 8.9% |
| 10 or more Apartments | 46 | 9.5% |
| Mobile Home / Other | 9 | 1.9% |
| Total | 483 | 100.0% |
Housing Structures by Occupancy in Mount Hope
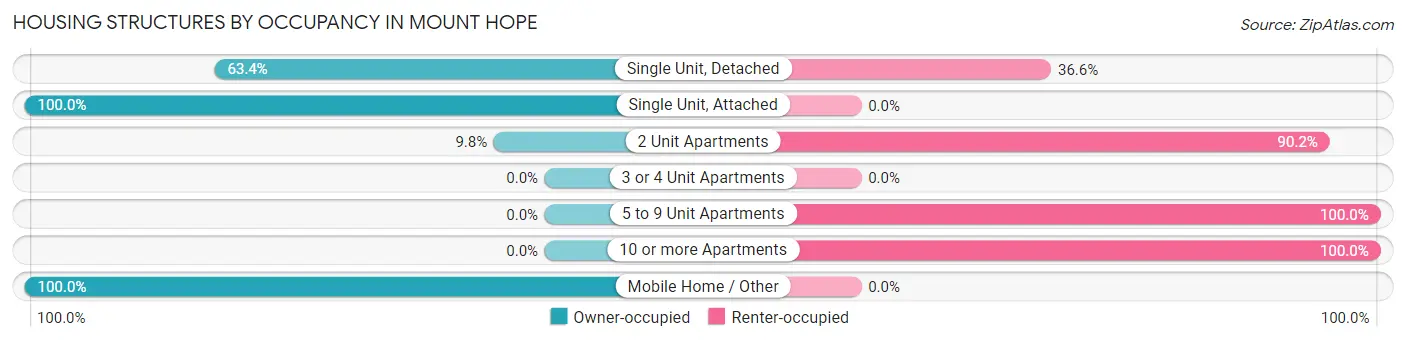
| Structure Type | Owner-occupied | Renter-occupied |
| Single Unit, Detached | 210 (63.4%) | 121 (36.6%) |
| Single Unit, Attached | 3 (100.0%) | 0 (0.0%) |
| 2 Unit Apartments | 5 (9.8%) | 46 (90.2%) |
| 3 or 4 Unit Apartments | 0 (0.0%) | 0 (0.0%) |
| 5 to 9 Unit Apartments | 0 (0.0%) | 43 (100.0%) |
| 10 or more Apartments | 0 (0.0%) | 46 (100.0%) |
| Mobile Home / Other | 9 (100.0%) | 0 (0.0%) |
| Total | 227 (47.0%) | 256 (53.0%) |
Housing Structures by Number of Rooms in Mount Hope
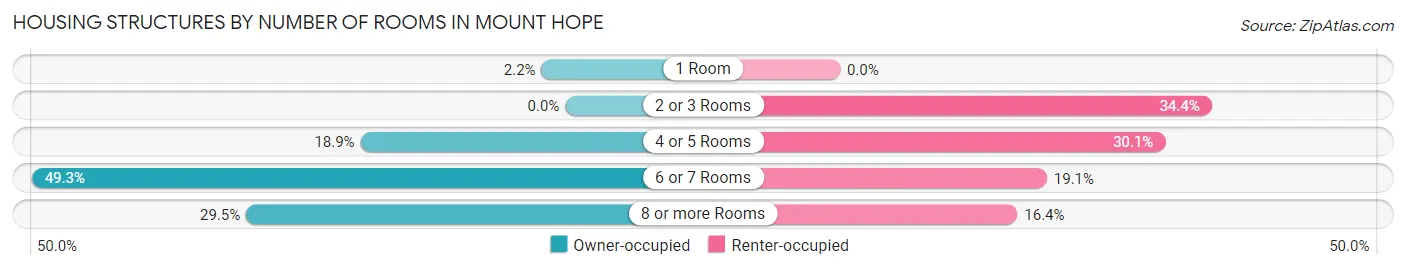
| Number of Rooms | Owner-occupied | Renter-occupied |
| 1 Room | 5 (2.2%) | 0 (0.0%) |
| 2 or 3 Rooms | 0 (0.0%) | 88 (34.4%) |
| 4 or 5 Rooms | 43 (18.9%) | 77 (30.1%) |
| 6 or 7 Rooms | 112 (49.3%) | 49 (19.1%) |
| 8 or more Rooms | 67 (29.5%) | 42 (16.4%) |
| Total | 227 (100.0%) | 256 (100.0%) |
Housing Structure by Heating Type in Mount Hope
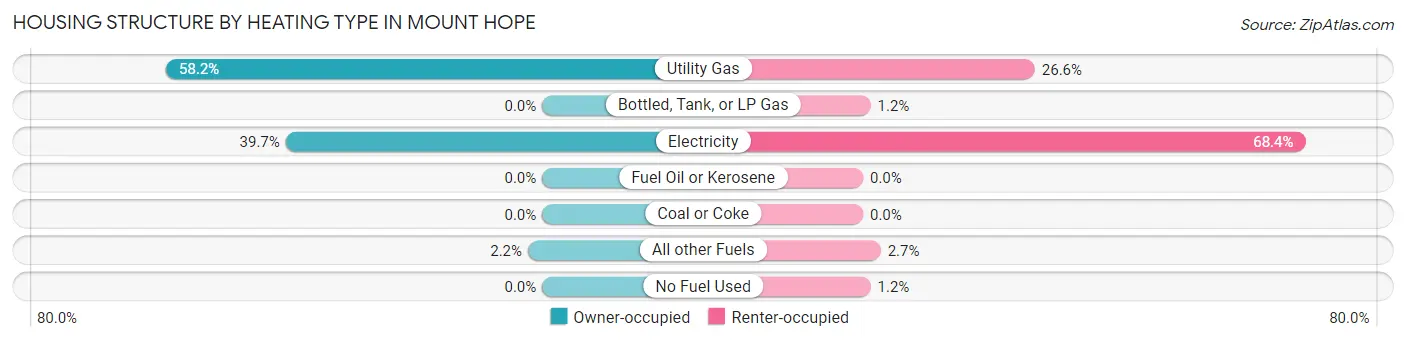
| Heating Type | Owner-occupied | Renter-occupied |
| Utility Gas | 132 (58.2%) | 68 (26.6%) |
| Bottled, Tank, or LP Gas | 0 (0.0%) | 3 (1.2%) |
| Electricity | 90 (39.7%) | 175 (68.4%) |
| Fuel Oil or Kerosene | 0 (0.0%) | 0 (0.0%) |
| Coal or Coke | 0 (0.0%) | 0 (0.0%) |
| All other Fuels | 5 (2.2%) | 7 (2.7%) |
| No Fuel Used | 0 (0.0%) | 3 (1.2%) |
| Total | 227 (100.0%) | 256 (100.0%) |
Household Vehicle Usage in Mount Hope
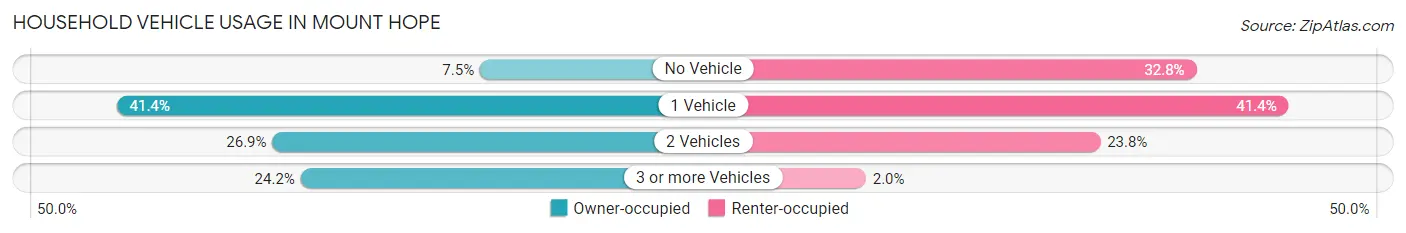
| Vehicles per Household | Owner-occupied | Renter-occupied |
| No Vehicle | 17 (7.5%) | 84 (32.8%) |
| 1 Vehicle | 94 (41.4%) | 106 (41.4%) |
| 2 Vehicles | 61 (26.9%) | 61 (23.8%) |
| 3 or more Vehicles | 55 (24.2%) | 5 (1.9%) |
| Total | 227 (100.0%) | 256 (100.0%) |
Real Estate & Mortgages in Mount Hope
Real Estate and Mortgage Overview in Mount Hope
| Characteristic | Without Mortgage | With Mortgage |
| Housing Units | 132 | 95 |
| Median Property Value | $48,500 | $98,700 |
| Median Household Income | $25,714 | $6 |
| Monthly Housing Costs | $398 | $6 |
| Real Estate Taxes | $394 | $0 |
Property Value by Mortgage Status in Mount Hope
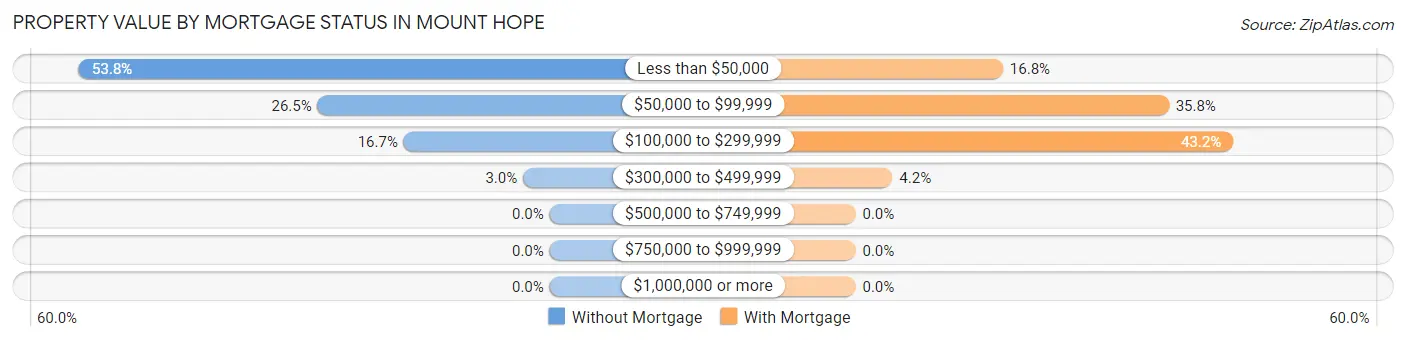
| Property Value | Without Mortgage | With Mortgage |
| Less than $50,000 | 71 (53.8%) | 16 (16.8%) |
| $50,000 to $99,999 | 35 (26.5%) | 34 (35.8%) |
| $100,000 to $299,999 | 22 (16.7%) | 41 (43.2%) |
| $300,000 to $499,999 | 4 (3.0%) | 4 (4.2%) |
| $500,000 to $749,999 | 0 (0.0%) | 0 (0.0%) |
| $750,000 to $999,999 | 0 (0.0%) | 0 (0.0%) |
| $1,000,000 or more | 0 (0.0%) | 0 (0.0%) |
| Total | 132 (100.0%) | 95 (100.0%) |
Household Income by Mortgage Status in Mount Hope
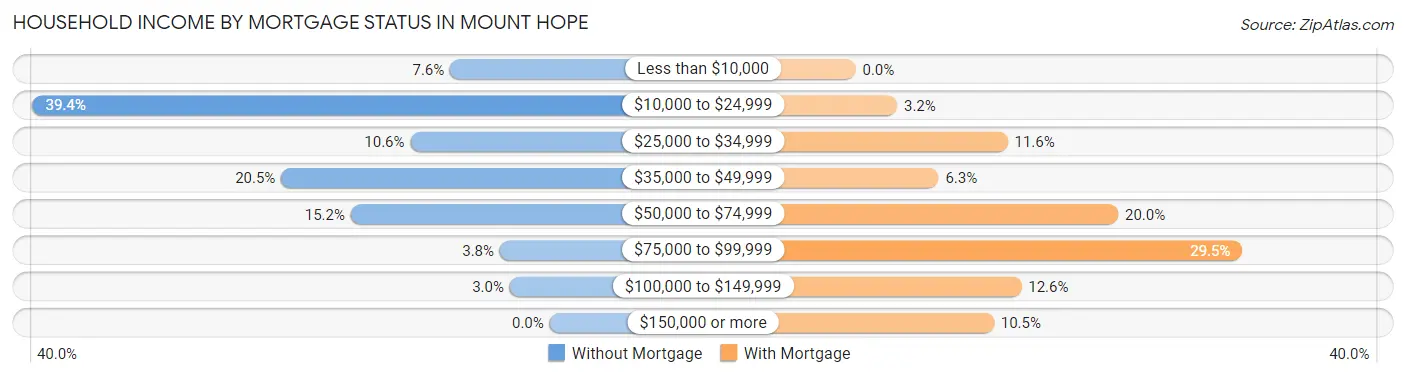
| Household Income | Without Mortgage | With Mortgage |
| Less than $10,000 | 10 (7.6%) | 0 (0.0%) |
| $10,000 to $24,999 | 52 (39.4%) | 3 (3.2%) |
| $25,000 to $34,999 | 14 (10.6%) | 11 (11.6%) |
| $35,000 to $49,999 | 27 (20.4%) | 6 (6.3%) |
| $50,000 to $74,999 | 20 (15.1%) | 19 (20.0%) |
| $75,000 to $99,999 | 5 (3.8%) | 28 (29.5%) |
| $100,000 to $149,999 | 4 (3.0%) | 12 (12.6%) |
| $150,000 or more | 0 (0.0%) | 10 (10.5%) |
| Total | 132 (100.0%) | 95 (100.0%) |
Property Value to Household Income Ratio in Mount Hope
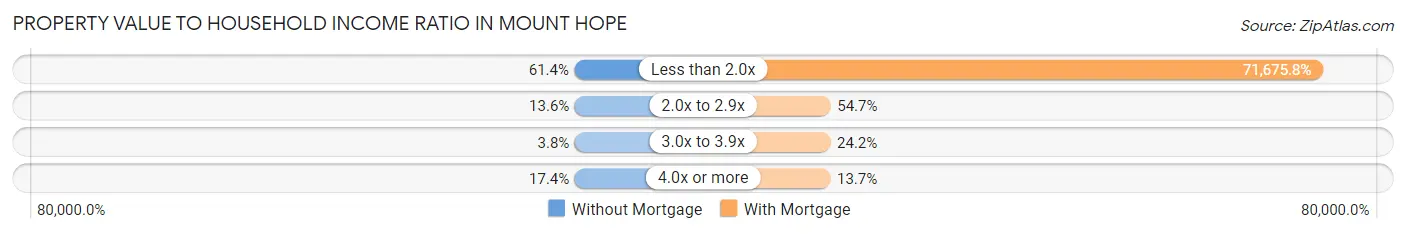
| Value-to-Income Ratio | Without Mortgage | With Mortgage |
| Less than 2.0x | 81 (61.4%) | 68,092 (71,675.8%) |
| 2.0x to 2.9x | 18 (13.6%) | 52 (54.7%) |
| 3.0x to 3.9x | 5 (3.8%) | 23 (24.2%) |
| 4.0x or more | 23 (17.4%) | 13 (13.7%) |
| Total | 132 (100.0%) | 95 (100.0%) |
Real Estate Taxes by Mortgage Status in Mount Hope
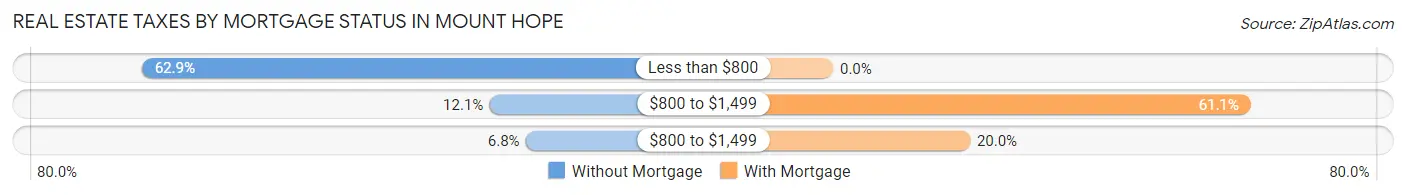
| Property Taxes | Without Mortgage | With Mortgage |
| Less than $800 | 83 (62.9%) | 0 (0.0%) |
| $800 to $1,499 | 16 (12.1%) | 58 (61.1%) |
| $800 to $1,499 | 9 (6.8%) | 19 (20.0%) |
| Total | 132 (100.0%) | 95 (100.0%) |
Health & Disability in Mount Hope
Health Insurance Coverage by Age in Mount Hope
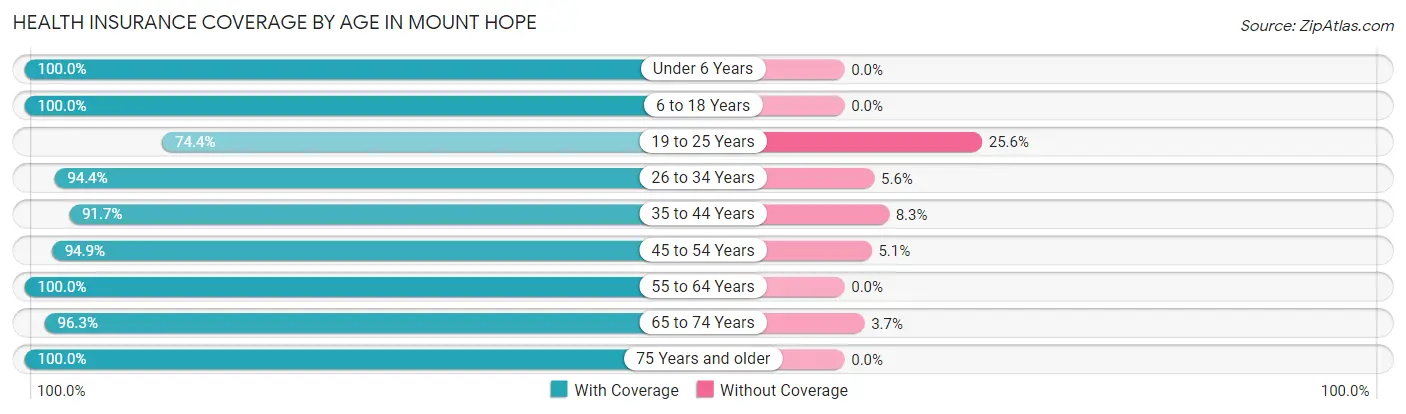
| Age Bracket | With Coverage | Without Coverage |
| Under 6 Years | 16 (100.0%) | 0 (0.0%) |
| 6 to 18 Years | 132 (100.0%) | 0 (0.0%) |
| 19 to 25 Years | 87 (74.4%) | 30 (25.6%) |
| 26 to 34 Years | 85 (94.4%) | 5 (5.6%) |
| 35 to 44 Years | 133 (91.7%) | 12 (8.3%) |
| 45 to 54 Years | 150 (94.9%) | 8 (5.1%) |
| 55 to 64 Years | 114 (100.0%) | 0 (0.0%) |
| 65 to 74 Years | 181 (96.3%) | 7 (3.7%) |
| 75 Years and older | 57 (100.0%) | 0 (0.0%) |
| Total | 955 (93.9%) | 62 (6.1%) |
Health Insurance Coverage by Citizenship Status in Mount Hope
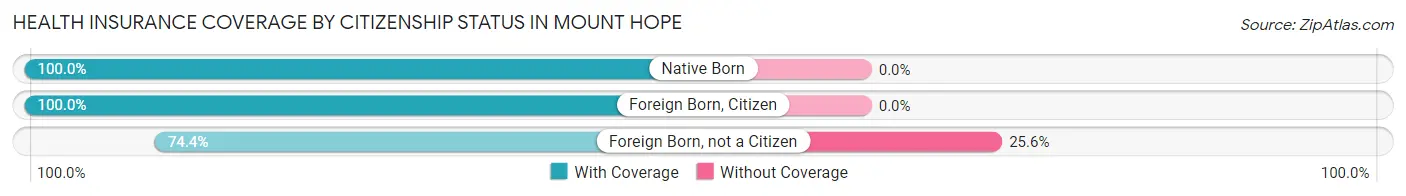
| Citizenship Status | With Coverage | Without Coverage |
| Native Born | 16 (100.0%) | 0 (0.0%) |
| Foreign Born, Citizen | 132 (100.0%) | 0 (0.0%) |
| Foreign Born, not a Citizen | 87 (74.4%) | 30 (25.6%) |
Health Insurance Coverage by Household Income in Mount Hope
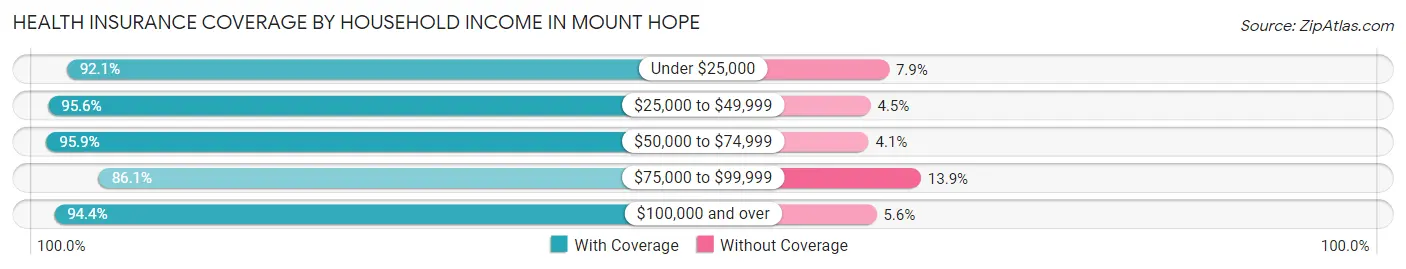
| Household Income | With Coverage | Without Coverage |
| Under $25,000 | 338 (92.1%) | 29 (7.9%) |
| $25,000 to $49,999 | 279 (95.6%) | 13 (4.4%) |
| $50,000 to $74,999 | 188 (95.9%) | 8 (4.1%) |
| $75,000 to $99,999 | 31 (86.1%) | 5 (13.9%) |
| $100,000 and over | 119 (94.4%) | 7 (5.6%) |
Public vs Private Health Insurance Coverage by Age in Mount Hope
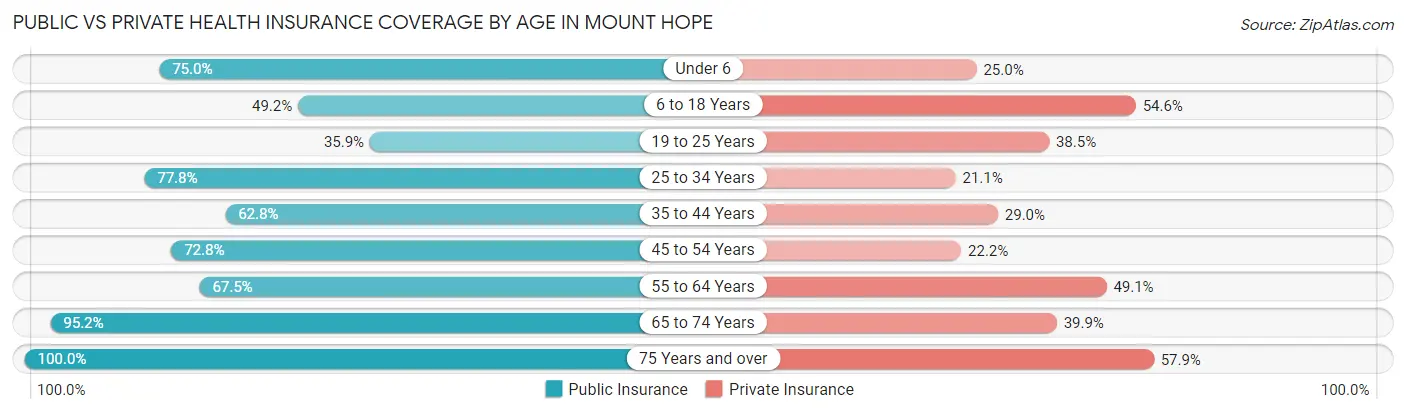
| Age Bracket | Public Insurance | Private Insurance |
| Under 6 | 12 (75.0%) | 4 (25.0%) |
| 6 to 18 Years | 65 (49.2%) | 72 (54.5%) |
| 19 to 25 Years | 42 (35.9%) | 45 (38.5%) |
| 25 to 34 Years | 70 (77.8%) | 19 (21.1%) |
| 35 to 44 Years | 91 (62.8%) | 42 (29.0%) |
| 45 to 54 Years | 115 (72.8%) | 35 (22.2%) |
| 55 to 64 Years | 77 (67.5%) | 56 (49.1%) |
| 65 to 74 Years | 179 (95.2%) | 75 (39.9%) |
| 75 Years and over | 57 (100.0%) | 33 (57.9%) |
| Total | 708 (69.6%) | 381 (37.5%) |
Disability Status by Sex by Age in Mount Hope
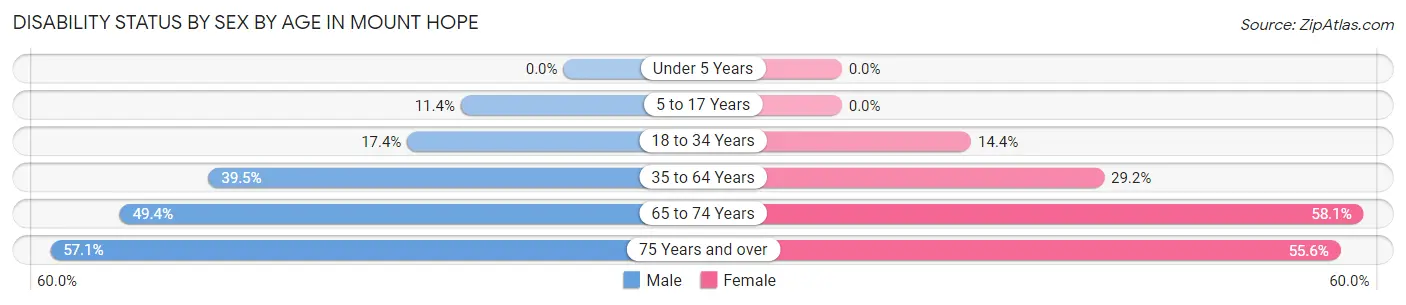
| Age Bracket | Male | Female |
| Under 5 Years | 0 (0.0%) | 0 (0.0%) |
| 5 to 17 Years | 8 (11.4%) | 0 (0.0%) |
| 18 to 34 Years | 16 (17.4%) | 18 (14.4%) |
| 35 to 64 Years | 85 (39.5%) | 59 (29.2%) |
| 65 to 74 Years | 41 (49.4%) | 61 (58.1%) |
| 75 Years and over | 12 (57.1%) | 20 (55.6%) |
Disability Class by Sex by Age in Mount Hope
Disability Class: Hearing Difficulty
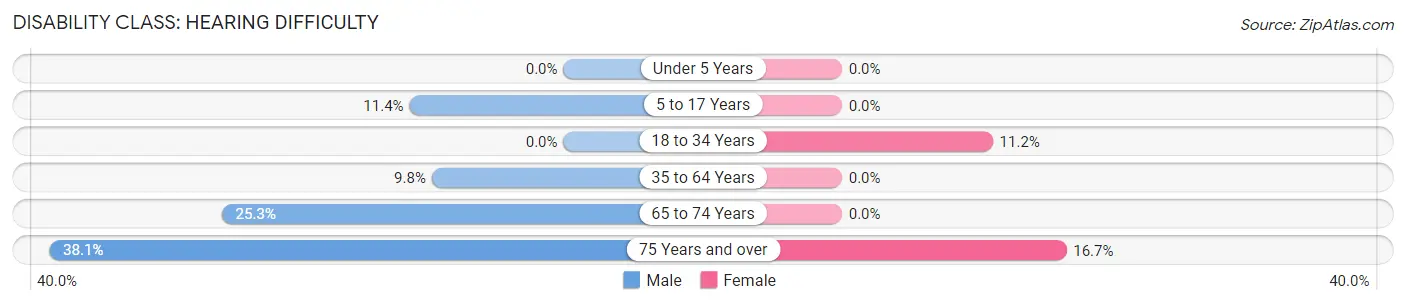
| Age Bracket | Male | Female |
| Under 5 Years | 0 (0.0%) | 0 (0.0%) |
| 5 to 17 Years | 8 (11.4%) | 0 (0.0%) |
| 18 to 34 Years | 0 (0.0%) | 14 (11.2%) |
| 35 to 64 Years | 21 (9.8%) | 0 (0.0%) |
| 65 to 74 Years | 21 (25.3%) | 0 (0.0%) |
| 75 Years and over | 8 (38.1%) | 6 (16.7%) |
Disability Class: Vision Difficulty
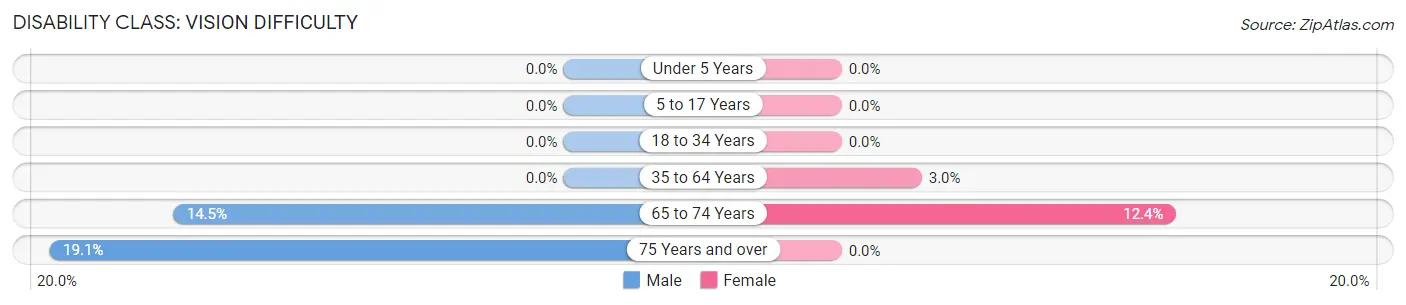
| Age Bracket | Male | Female |
| Under 5 Years | 0 (0.0%) | 0 (0.0%) |
| 5 to 17 Years | 0 (0.0%) | 0 (0.0%) |
| 18 to 34 Years | 0 (0.0%) | 0 (0.0%) |
| 35 to 64 Years | 0 (0.0%) | 6 (3.0%) |
| 65 to 74 Years | 12 (14.5%) | 13 (12.4%) |
| 75 Years and over | 4 (19.1%) | 0 (0.0%) |
Disability Class: Cognitive Difficulty
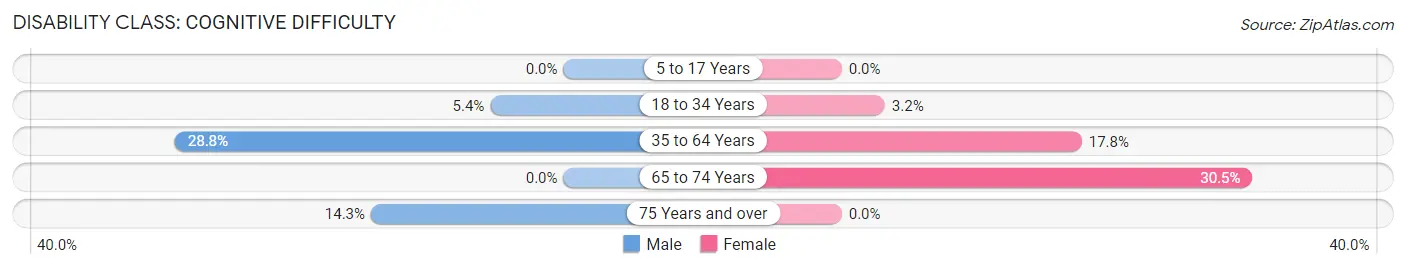
| Age Bracket | Male | Female |
| 5 to 17 Years | 0 (0.0%) | 0 (0.0%) |
| 18 to 34 Years | 5 (5.4%) | 4 (3.2%) |
| 35 to 64 Years | 62 (28.8%) | 36 (17.8%) |
| 65 to 74 Years | 0 (0.0%) | 32 (30.5%) |
| 75 Years and over | 3 (14.3%) | 0 (0.0%) |
Disability Class: Ambulatory Difficulty
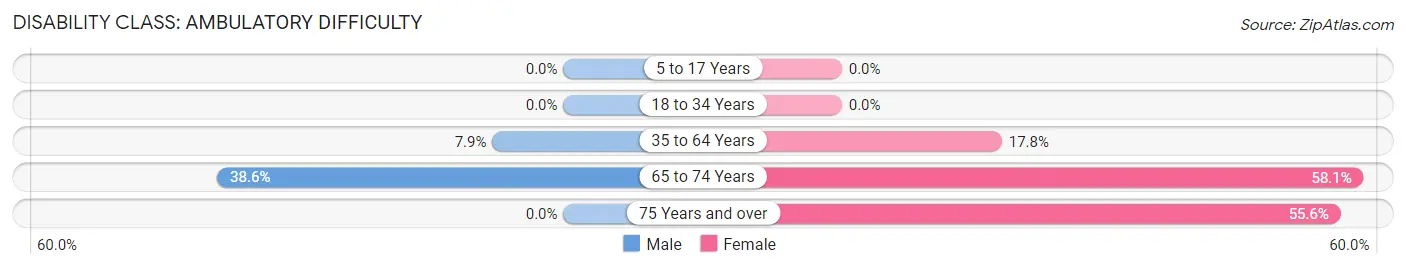
| Age Bracket | Male | Female |
| 5 to 17 Years | 0 (0.0%) | 0 (0.0%) |
| 18 to 34 Years | 0 (0.0%) | 0 (0.0%) |
| 35 to 64 Years | 17 (7.9%) | 36 (17.8%) |
| 65 to 74 Years | 32 (38.6%) | 61 (58.1%) |
| 75 Years and over | 0 (0.0%) | 20 (55.6%) |
Disability Class: Self-Care Difficulty
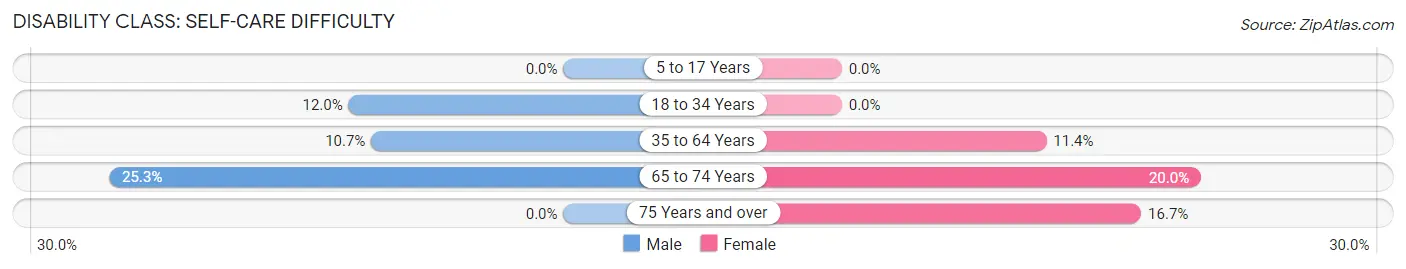
| Age Bracket | Male | Female |
| 5 to 17 Years | 0 (0.0%) | 0 (0.0%) |
| 18 to 34 Years | 11 (12.0%) | 0 (0.0%) |
| 35 to 64 Years | 23 (10.7%) | 23 (11.4%) |
| 65 to 74 Years | 21 (25.3%) | 21 (20.0%) |
| 75 Years and over | 0 (0.0%) | 6 (16.7%) |
Technology Access in Mount Hope
Computing Device Access in Mount Hope
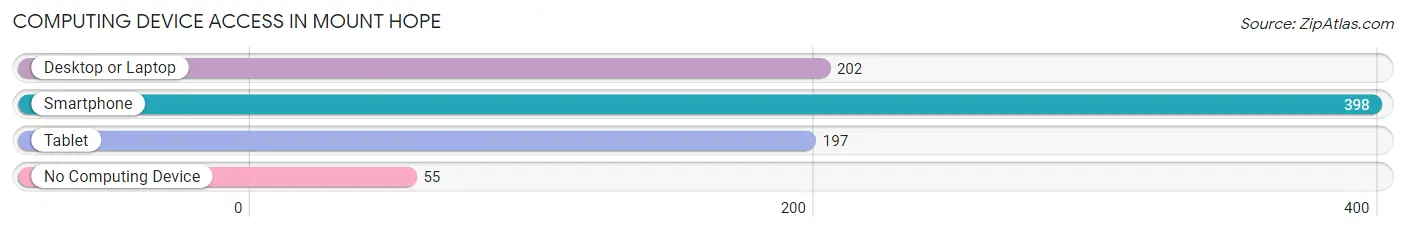
| Device Type | # Households | % Households |
| Desktop or Laptop | 202 | 41.8% |
| Smartphone | 398 | 82.4% |
| Tablet | 197 | 40.8% |
| No Computing Device | 55 | 11.4% |
| Total | 483 | 100.0% |
Internet Access in Mount Hope
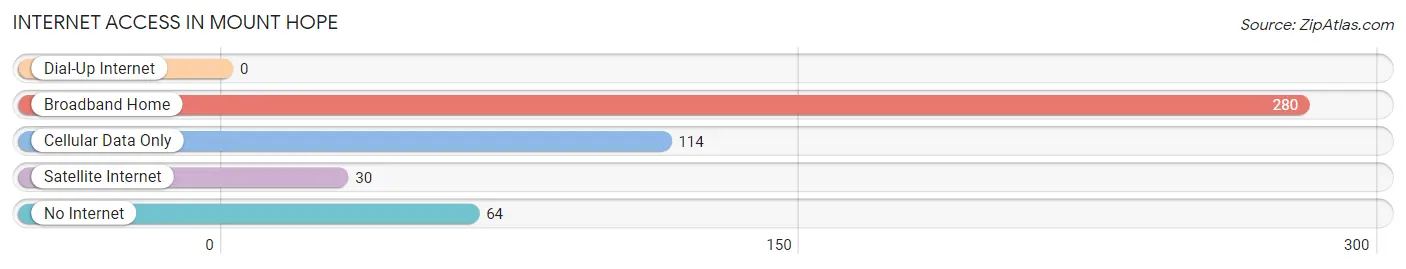
| Internet Type | # Households | % Households |
| Dial-Up Internet | 0 | 0.0% |
| Broadband Home | 280 | 58.0% |
| Cellular Data Only | 114 | 23.6% |
| Satellite Internet | 30 | 6.2% |
| No Internet | 64 | 13.3% |
| Total | 483 | 100.0% |
Mount Hope Summary
Mount Hope, West Virginia is a small town located in Fayette County, West Virginia. It is situated in the Appalachian Mountains and is part of the Beckley-Mount Hope-Oak Hill metropolitan area. The town has a population of 1,845 people, according to the 2010 census.
History
Mount Hope was founded in 1871 by the Chesapeake and Ohio Railway. The town was named after the nearby Mount Hope Church, which was built in 1845. The town was originally a coal mining town, and the coal industry was the main source of employment for the town’s residents. The town was also home to a number of other businesses, including a sawmill, a gristmill, and a general store.
In the early 1900s, the town experienced a period of growth and prosperity. The town was home to a number of businesses, including a hotel, a bank, a movie theater, and a number of stores. The town also had a number of churches, including the Mount Hope Methodist Church, which was built in 1871.
In the late 1950s, the coal industry began to decline, and the town’s economy suffered. The town’s population began to decline, and many of the businesses closed. In the late 1970s, the town began to experience a period of revitalization. The town was home to a number of new businesses, including a grocery store, a hardware store, and a restaurant.
Geography
Mount Hope is located in the Appalachian Mountains in Fayette County, West Virginia. The town is situated at an elevation of 1,845 feet above sea level. The town is located near the New River, which is a tributary of the Kanawha River. The town is also located near the Gauley River, which is a tributary of the Kanawha River.
The town is located in a mountainous region, and the terrain is mostly hilly. The town is located in a temperate climate, and the average temperature in the summer is around 75 degrees Fahrenheit. The average temperature in the winter is around 40 degrees Fahrenheit.
Economy
The economy of Mount Hope is largely based on the coal industry. The town is home to a number of coal mines, and the coal industry is the main source of employment for the town’s residents. The town is also home to a number of other businesses, including a grocery store, a hardware store, and a restaurant.
The town is also home to a number of tourist attractions, including the Mount Hope Church, which was built in 1845. The town is also home to a number of outdoor recreation areas, including the New River Gorge National River, which is a popular destination for whitewater rafting and kayaking.
Demographics
According to the 2010 census, the population of Mount Hope was 1,845 people. The town has a population that is predominantly white, with 95.3% of the population being white. The town also has a small African American population, with 2.2% of the population being African American. The town also has a small Hispanic population, with 1.2% of the population being Hispanic. The median household income in the town is $30,938, and the median home value is $90,000.
Common Questions
What is Per Capita Income in Mount Hope?
Per Capita income in Mount Hope is $17,035.
What is the Median Family Income in Mount Hope?
Median Family Income in Mount Hope is $38,214.
What is the Median Household income in Mount Hope?
Median Household Income in Mount Hope is $25,404.
What is Income or Wage Gap in Mount Hope?
Income or Wage Gap in Mount Hope is 19.3%.
Women in Mount Hope earn 80.7 cents for every dollar earned by a man.
What is Inequality or Gini Index in Mount Hope?
Inequality or Gini Index in Mount Hope is 0.45.
What is the Total Population of Mount Hope?
Total Population of Mount Hope is 1,032.
What is the Total Male Population of Mount Hope?
Total Male Population of Mount Hope is 507.
What is the Total Female Population of Mount Hope?
Total Female Population of Mount Hope is 525.
What is the Ratio of Males per 100 Females in Mount Hope?
There are 96.57 Males per 100 Females in Mount Hope.
What is the Ratio of Females per 100 Males in Mount Hope?
There are 103.55 Females per 100 Males in Mount Hope.
What is the Median Population Age in Mount Hope?
Median Population Age in Mount Hope is 46.0 Years.
What is the Average Family Size in Mount Hope
Average Family Size in Mount Hope is 3.2 People.
What is the Average Household Size in Mount Hope
Average Household Size in Mount Hope is 2.1 People.
How Large is the Labor Force in Mount Hope?
There are 362 People in the Labor Forcein in Mount Hope.
What is the Percentage of People in the Labor Force in Mount Hope?
40.2% of People are in the Labor Force in Mount Hope.
What is the Unemployment Rate in Mount Hope?
Unemployment Rate in Mount Hope is 11.9%.