Salem, WV Map & Demographics
Salem Map
Salem Overview
$20,236
PER CAPITA INCOME
$60,096
AVG FAMILY INCOME
$45,521
AVG HOUSEHOLD INCOME
0.1%
WAGE / INCOME GAP [ % ]
99.9¢/ $1
WAGE / INCOME GAP [ $ ]
0.45
INEQUALITY / GINI INDEX
1,873
TOTAL POPULATION
1,097
MALE POPULATION
776
FEMALE POPULATION
141.37
MALES / 100 FEMALES
70.74
FEMALES / 100 MALES
30.7
MEDIAN AGE
3.2
AVG FAMILY SIZE
2.6
AVG HOUSEHOLD SIZE
864
LABOR FORCE [ PEOPLE ]
51.7%
PERCENT IN LABOR FORCE
4.0%
UNEMPLOYMENT RATE
Salem Zip Codes
Income in Salem
Income Overview in Salem
Per Capita Income in Salem is $20,236, while median incomes of families and households are $60,096 and $45,521 respectively.
| Characteristic | Number | Measure |
| Per Capita Income | 1,873 | $20,236 |
| Median Family Income | 325 | $60,096 |
| Mean Family Income | 325 | $66,154 |
| Median Household Income | 599 | $45,521 |
| Mean Household Income | 599 | $57,194 |
| Income Deficit | 325 | $0 |
| Wage / Income Gap (%) | 1,873 | 0.12% |
| Wage / Income Gap ($) | 1,873 | 99.88¢ per $1 |
| Gini / Inequality Index | 1,873 | 0.45 |
Earnings by Sex in Salem
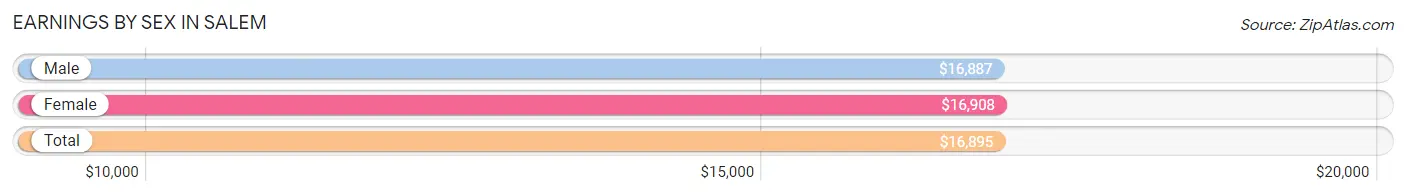
Average Earnings in Salem are $16,895, $16,887 for men and $16,908 for women, a difference of 0.1%.
| Sex | Number | Average Earnings |
| Male | 573 (57.9%) | $16,887 |
| Female | 416 (42.1%) | $16,908 |
| Total | 989 (100.0%) | $16,895 |
Earnings by Sex by Income Bracket in Salem
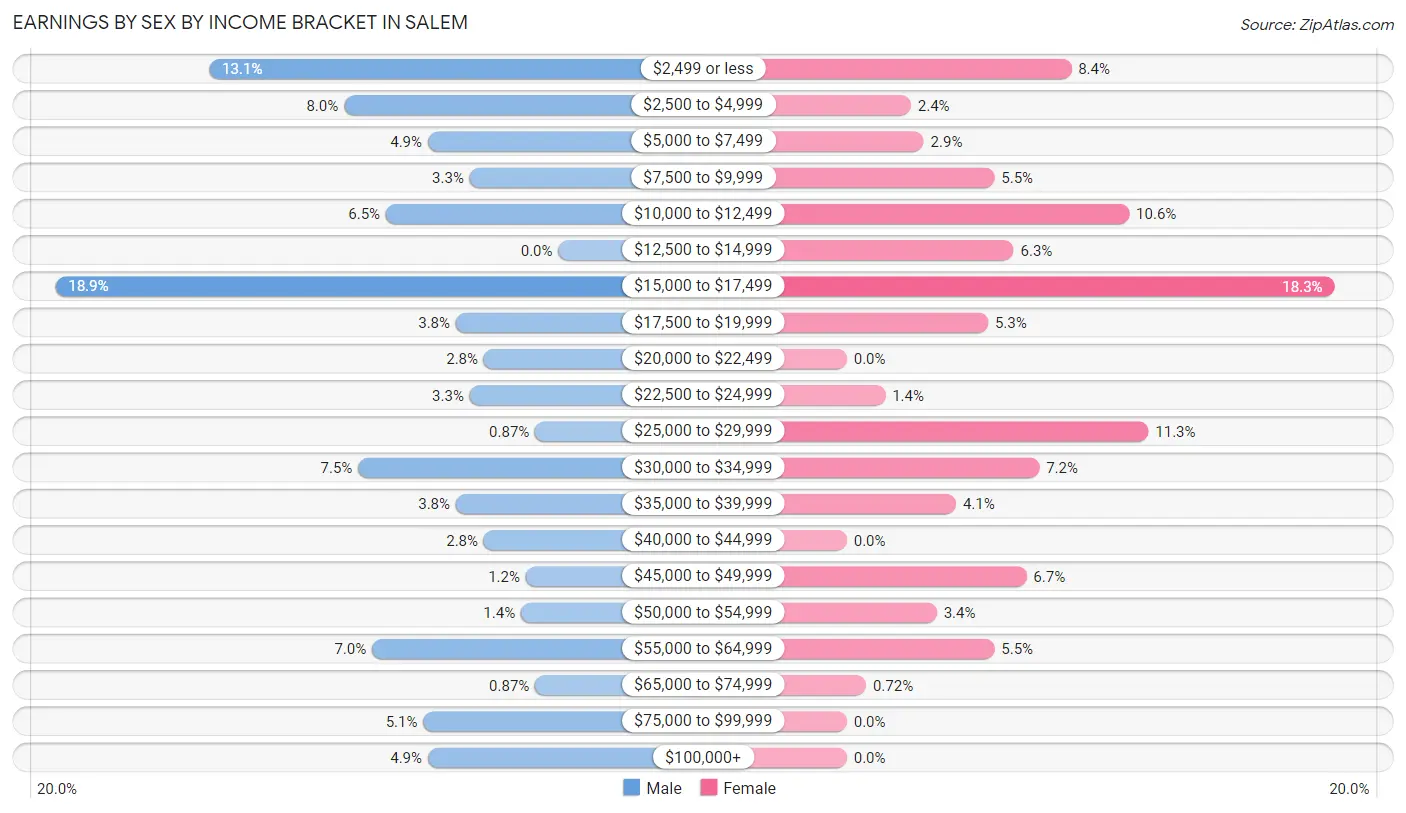
The most common earnings brackets in Salem are $15,000 to $17,499 for men (108 | 18.9%) and $15,000 to $17,499 for women (76 | 18.3%).
| Income | Male | Female |
| $2,499 or less | 75 (13.1%) | 35 (8.4%) |
| $2,500 to $4,999 | 46 (8.0%) | 10 (2.4%) |
| $5,000 to $7,499 | 28 (4.9%) | 12 (2.9%) |
| $7,500 to $9,999 | 19 (3.3%) | 23 (5.5%) |
| $10,000 to $12,499 | 37 (6.5%) | 44 (10.6%) |
| $12,500 to $14,999 | 0 (0.0%) | 26 (6.2%) |
| $15,000 to $17,499 | 108 (18.9%) | 76 (18.3%) |
| $17,500 to $19,999 | 22 (3.8%) | 22 (5.3%) |
| $20,000 to $22,499 | 16 (2.8%) | 0 (0.0%) |
| $22,500 to $24,999 | 19 (3.3%) | 6 (1.4%) |
| $25,000 to $29,999 | 5 (0.9%) | 47 (11.3%) |
| $30,000 to $34,999 | 43 (7.5%) | 30 (7.2%) |
| $35,000 to $39,999 | 22 (3.8%) | 17 (4.1%) |
| $40,000 to $44,999 | 16 (2.8%) | 0 (0.0%) |
| $45,000 to $49,999 | 7 (1.2%) | 28 (6.7%) |
| $50,000 to $54,999 | 8 (1.4%) | 14 (3.4%) |
| $55,000 to $64,999 | 40 (7.0%) | 23 (5.5%) |
| $65,000 to $74,999 | 5 (0.9%) | 3 (0.7%) |
| $75,000 to $99,999 | 29 (5.1%) | 0 (0.0%) |
| $100,000+ | 28 (4.9%) | 0 (0.0%) |
| Total | 573 (100.0%) | 416 (100.0%) |
Earnings by Sex by Educational Attainment in Salem
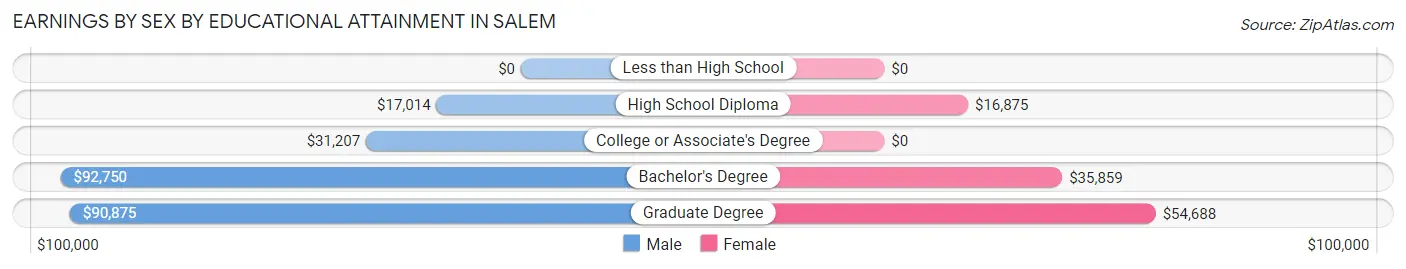
Average earnings in Salem are $29,000 for men and $18,542 for women, a difference of 36.1%. Men with an educational attainment of bachelor's degree enjoy the highest average annual earnings of $92,750, while those with high school diploma education earn the least with $17,014. Women with an educational attainment of graduate degree earn the most with the average annual earnings of $54,688, while those with high school diploma education have the smallest earnings of $16,875.
| Educational Attainment | Male Income | Female Income |
| Less than High School | - | - |
| High School Diploma | $17,014 | $16,875 |
| College or Associate's Degree | $31,207 | $0 |
| Bachelor's Degree | $92,750 | $35,859 |
| Graduate Degree | $90,875 | $54,688 |
| Total | $29,000 | $18,542 |
Family Income in Salem
Family Income Brackets in Salem
According to the Salem family income data, there are 86 families falling into the $50,000 to $74,999 income range, which is the most common income bracket and makes up 26.5% of all families. Conversely, the $200,000+ income bracket is the least frequent group with only 5 families (1.5%) belonging to this category.
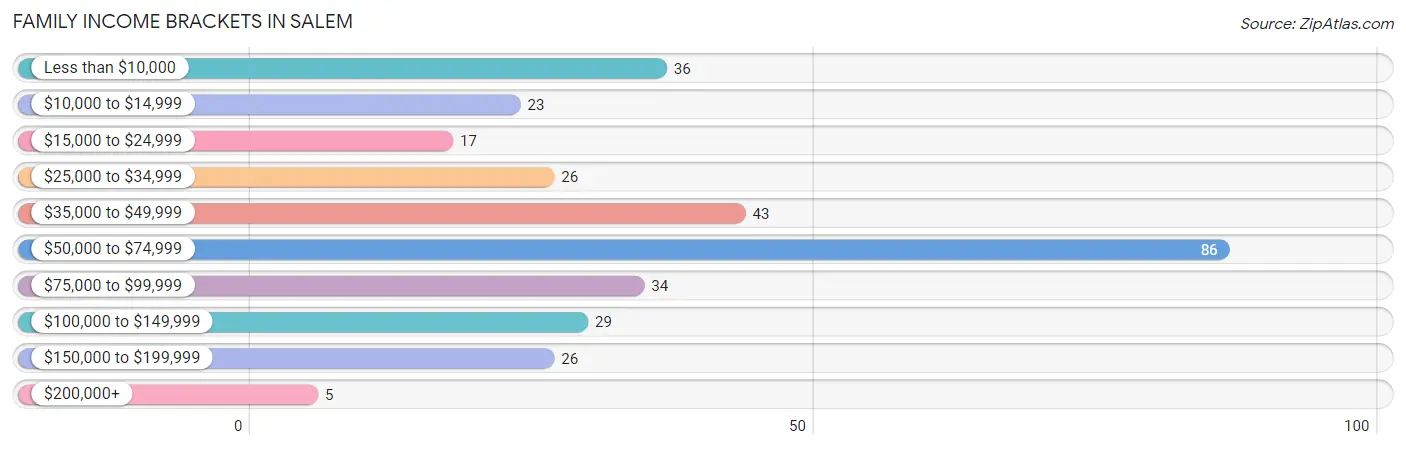
| Income Bracket | # Families | % Families |
| Less than $10,000 | 36 | 11.1% |
| $10,000 to $14,999 | 23 | 7.1% |
| $15,000 to $24,999 | 17 | 5.2% |
| $25,000 to $34,999 | 26 | 8.0% |
| $35,000 to $49,999 | 43 | 13.2% |
| $50,000 to $74,999 | 86 | 26.5% |
| $75,000 to $99,999 | 34 | 10.5% |
| $100,000 to $149,999 | 29 | 8.9% |
| $150,000 to $199,999 | 26 | 8.0% |
| $200,000+ | 5 | 1.5% |
Family Income by Famaliy Size in Salem
3-person families (71 | 21.8%) account for the highest median family income in Salem with $67,054 per family, while 2-person families (182 | 56.0%) have the highest median income of $24,166 per family member.
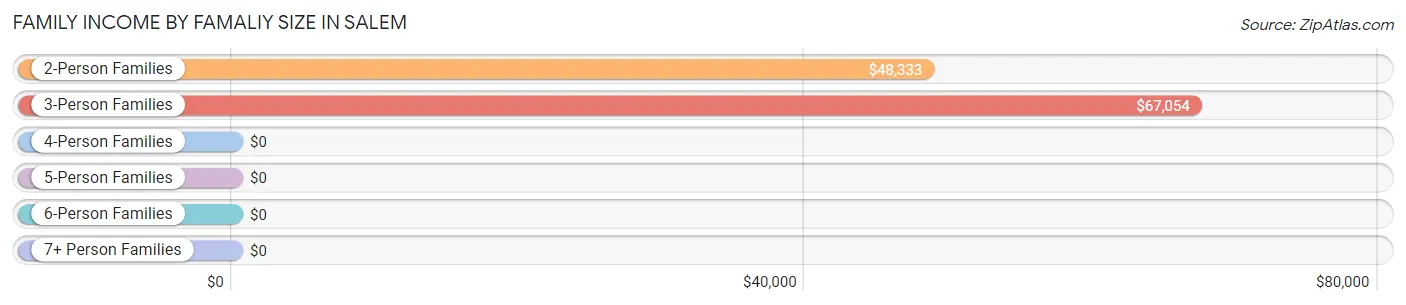
| Income Bracket | # Families | Median Income |
| 2-Person Families | 182 (56.0%) | $48,333 |
| 3-Person Families | 71 (21.8%) | $67,054 |
| 4-Person Families | 37 (11.4%) | $0 |
| 5-Person Families | 20 (6.1%) | $0 |
| 6-Person Families | 15 (4.6%) | $0 |
| 7+ Person Families | 0 (0.0%) | $0 |
| Total | 325 (100.0%) | $60,096 |
Family Income by Number of Earners in Salem
The median family income in Salem is $60,096, with families comprising 3+ earners (19) having the highest median family income of $69,792, while families with no earners (87) have the lowest median family income of $42,188, accounting for 5.9% and 26.8% of families, respectively.
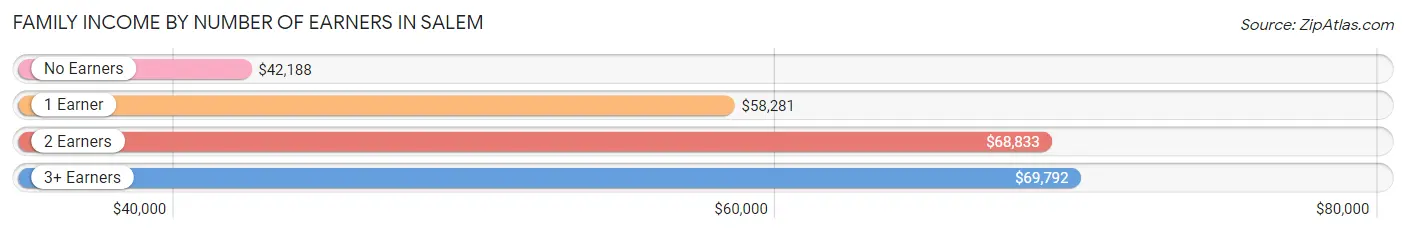
| Number of Earners | # Families | Median Income |
| No Earners | 87 (26.8%) | $42,188 |
| 1 Earner | 67 (20.6%) | $58,281 |
| 2 Earners | 152 (46.8%) | $68,833 |
| 3+ Earners | 19 (5.9%) | $69,792 |
| Total | 325 (100.0%) | $60,096 |
Household Income in Salem
Household Income Brackets in Salem
With 125 households falling in the category, the $50,000 to $74,999 income range is the most frequent in Salem, accounting for 20.9% of all households. In contrast, only 16 households (2.7%) fall into the $200,000+ income bracket, making it the least populous group.
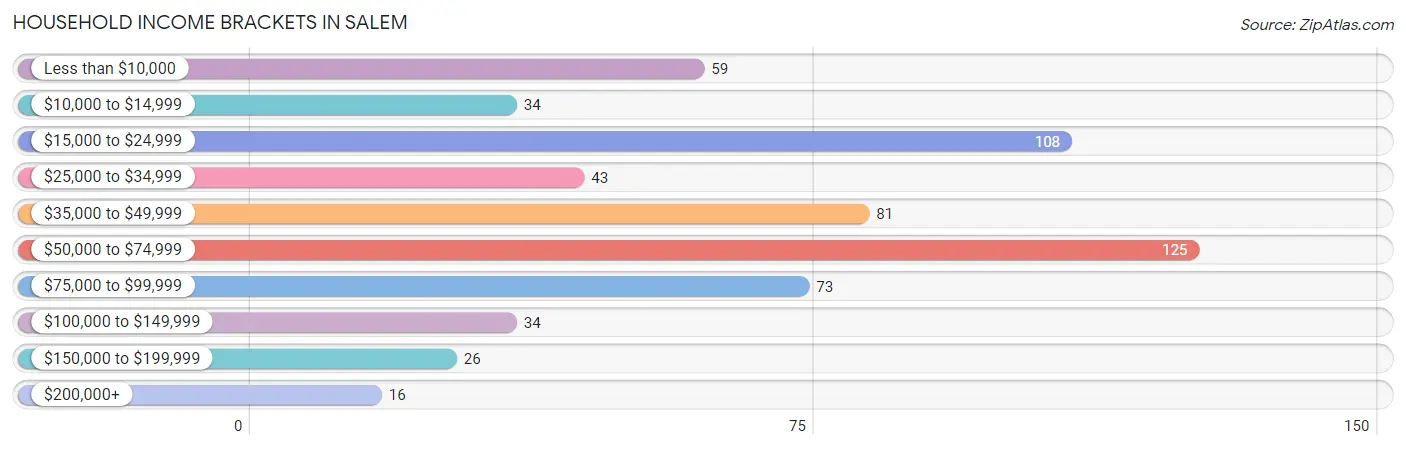
| Income Bracket | # Households | % Households |
| Less than $10,000 | 59 | 9.8% |
| $10,000 to $14,999 | 34 | 5.7% |
| $15,000 to $24,999 | 108 | 18.0% |
| $25,000 to $34,999 | 43 | 7.2% |
| $35,000 to $49,999 | 81 | 13.5% |
| $50,000 to $74,999 | 125 | 20.9% |
| $75,000 to $99,999 | 73 | 12.2% |
| $100,000 to $149,999 | 34 | 5.7% |
| $150,000 to $199,999 | 26 | 4.3% |
| $200,000+ | 16 | 2.7% |
Household Income by Householder Age in Salem
The median household income in Salem is $45,521, with the highest median household income of $68,125 found in the 45 to 64 years age bracket for the primary householder. A total of 217 households (36.2%) fall into this category. Meanwhile, the 15 to 24 years age bracket for the primary householder has the lowest median household income of $0, with 18 households (3.0%) in this group.
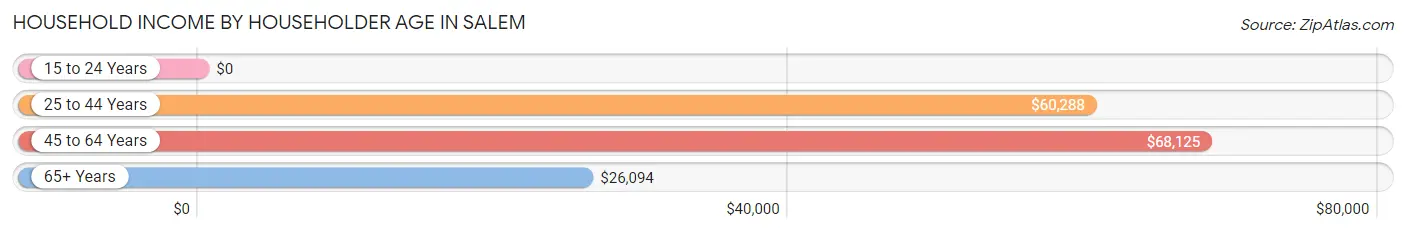
| Income Bracket | # Households | Median Income |
| 15 to 24 Years | 18 (3.0%) | $0 |
| 25 to 44 Years | 197 (32.9%) | $60,288 |
| 45 to 64 Years | 217 (36.2%) | $68,125 |
| 65+ Years | 167 (27.9%) | $26,094 |
| Total | 599 (100.0%) | $45,521 |
Poverty in Salem
Income Below Poverty by Sex and Age in Salem
With 16.5% poverty level for males and 18.1% for females among the residents of Salem, 16 and 17 year old males and 25 to 34 year old females are the most vulnerable to poverty, with 24 males (100.0%) and 39 females (47.6%) in their respective age groups living below the poverty level.
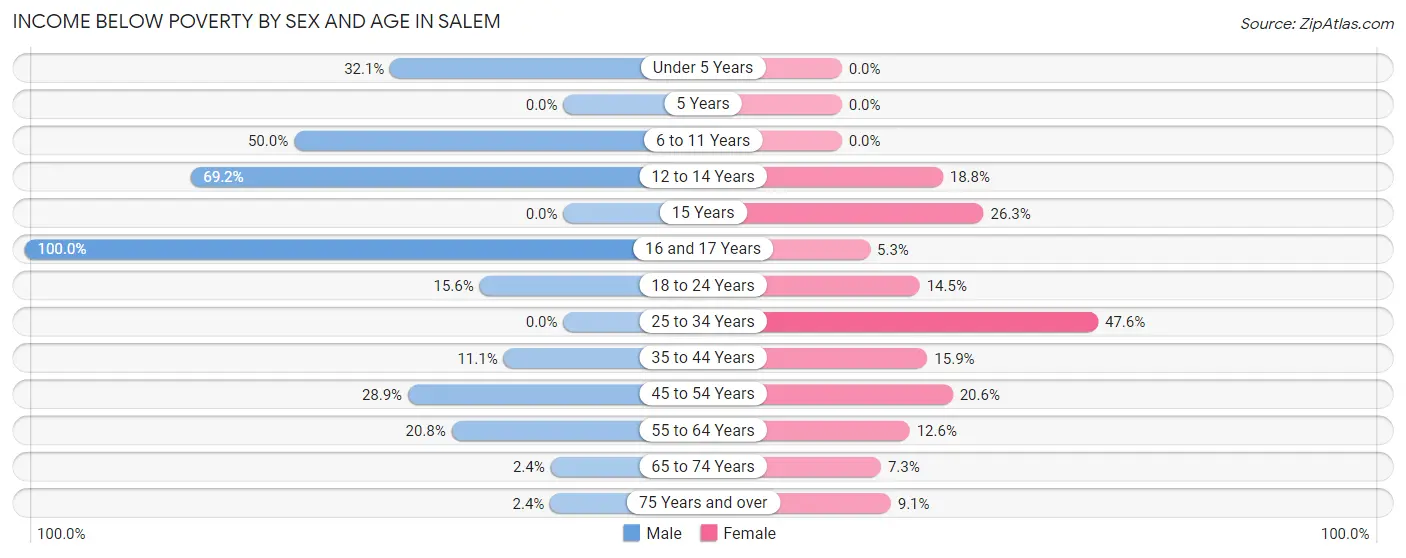
| Age Bracket | Male | Female |
| Under 5 Years | 9 (32.1%) | 0 (0.0%) |
| 5 Years | 0 (0.0%) | 0 (0.0%) |
| 6 to 11 Years | 29 (50.0%) | 0 (0.0%) |
| 12 to 14 Years | 9 (69.2%) | 6 (18.8%) |
| 15 Years | 0 (0.0%) | 5 (26.3%) |
| 16 and 17 Years | 24 (100.0%) | 1 (5.3%) |
| 18 to 24 Years | 14 (15.6%) | 11 (14.5%) |
| 25 to 34 Years | 0 (0.0%) | 39 (47.6%) |
| 35 to 44 Years | 14 (11.1%) | 17 (15.9%) |
| 45 to 54 Years | 15 (28.8%) | 28 (20.6%) |
| 55 to 64 Years | 22 (20.7%) | 14 (12.6%) |
| 65 to 74 Years | 2 (2.4%) | 4 (7.3%) |
| 75 Years and over | 2 (2.4%) | 3 (9.1%) |
| Total | 140 (16.5%) | 128 (18.1%) |
Income Above Poverty by Sex and Age in Salem
According to the poverty statistics in Salem, males aged 15 years and females aged under 5 years are the age groups that are most secure financially, with 100.0% of males and 100.0% of females in these age groups living above the poverty line.
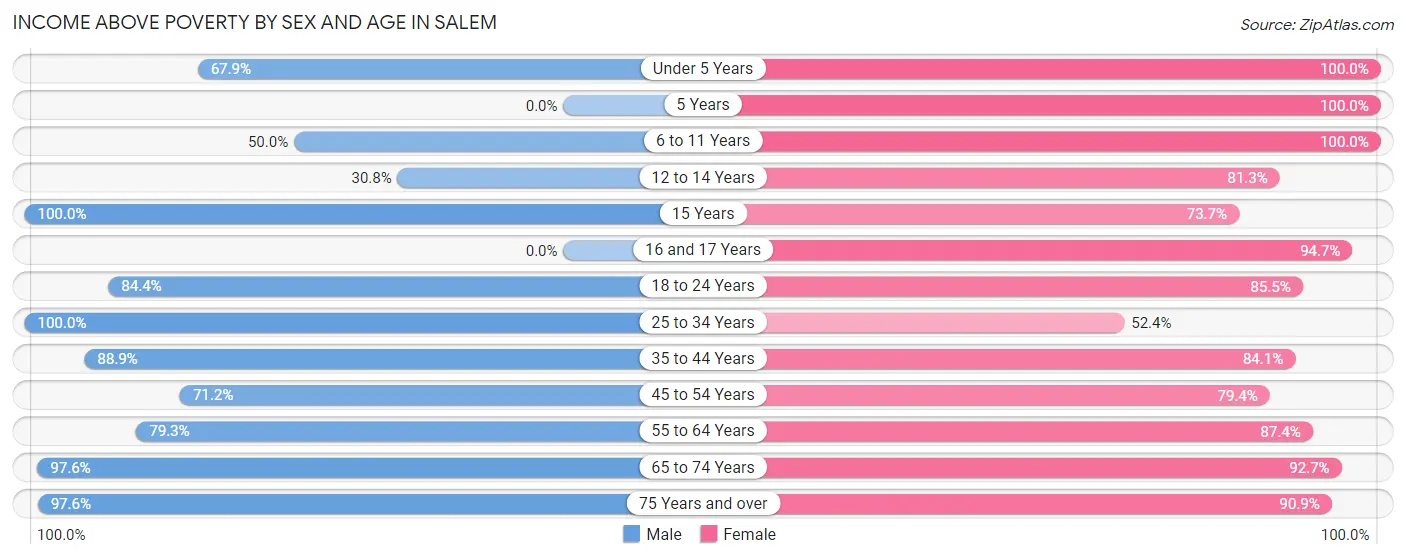
| Age Bracket | Male | Female |
| Under 5 Years | 19 (67.9%) | 11 (100.0%) |
| 5 Years | 0 (0.0%) | 7 (100.0%) |
| 6 to 11 Years | 29 (50.0%) | 18 (100.0%) |
| 12 to 14 Years | 4 (30.8%) | 26 (81.2%) |
| 15 Years | 15 (100.0%) | 14 (73.7%) |
| 16 and 17 Years | 0 (0.0%) | 18 (94.7%) |
| 18 to 24 Years | 76 (84.4%) | 65 (85.5%) |
| 25 to 34 Years | 170 (100.0%) | 43 (52.4%) |
| 35 to 44 Years | 112 (88.9%) | 90 (84.1%) |
| 45 to 54 Years | 37 (71.2%) | 108 (79.4%) |
| 55 to 64 Years | 84 (79.2%) | 97 (87.4%) |
| 65 to 74 Years | 82 (97.6%) | 51 (92.7%) |
| 75 Years and over | 80 (97.6%) | 30 (90.9%) |
| Total | 708 (83.5%) | 578 (81.9%) |
Income Below Poverty Among Married-Couple Families in Salem
The poverty statistics for married-couple families in Salem show that 9.9% or 21 of the total 212 families live below the poverty line. Families with no children have the highest poverty rate of 11.2%, comprising of 17 families. On the other hand, families with 1 or 2 children have the lowest poverty rate of 6.7%, which includes 4 families.
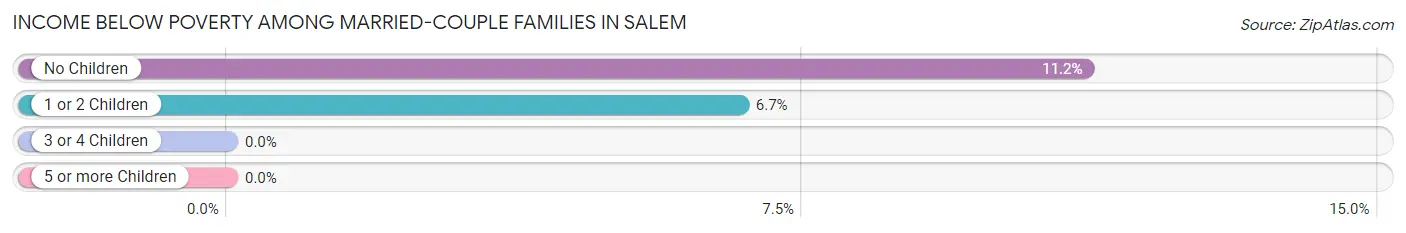
| Children | Above Poverty | Below Poverty |
| No Children | 135 (88.8%) | 17 (11.2%) |
| 1 or 2 Children | 56 (93.3%) | 4 (6.7%) |
| 3 or 4 Children | 0 (0.0%) | 0 (0.0%) |
| 5 or more Children | 0 (0.0%) | 0 (0.0%) |
| Total | 191 (90.1%) | 21 (9.9%) |
Income Below Poverty Among Single-Parent Households in Salem
According to the poverty data in Salem, 25.0% or 10 single-father households and 54.8% or 40 single-mother households are living below the poverty line. Among single-father households, those with 3 or 4 children have the highest poverty rate, with 6 households (100.0%) experiencing poverty. Likewise, among single-mother households, those with 3 or 4 children have the highest poverty rate, with 6 households (100.0%) falling below the poverty line.
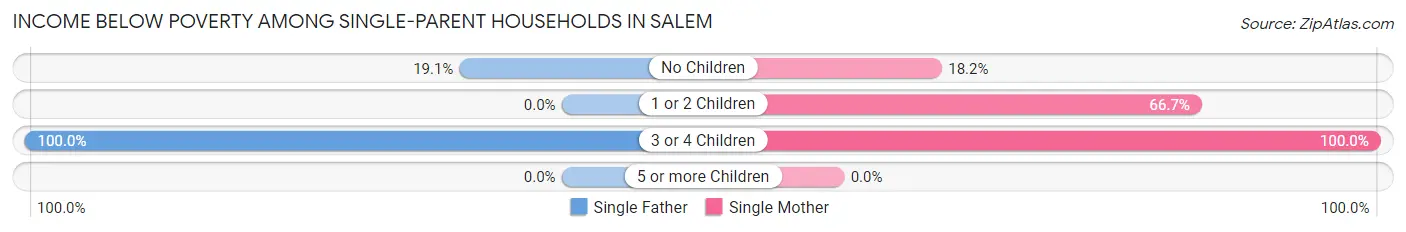
| Children | Single Father | Single Mother |
| No Children | 4 (19.1%) | 4 (18.2%) |
| 1 or 2 Children | 0 (0.0%) | 30 (66.7%) |
| 3 or 4 Children | 6 (100.0%) | 6 (100.0%) |
| 5 or more Children | 0 (0.0%) | 0 (0.0%) |
| Total | 10 (25.0%) | 40 (54.8%) |
Income Below Poverty Among Married-Couple vs Single-Parent Households in Salem
The poverty data for Salem shows that 21 of the married-couple family households (9.9%) and 50 of the single-parent households (44.3%) are living below the poverty level. Within the married-couple family households, those with no children have the highest poverty rate, with 17 households (11.2%) falling below the poverty line. Among the single-parent households, those with 3 or 4 children have the highest poverty rate, with 12 household (100.0%) living below poverty.
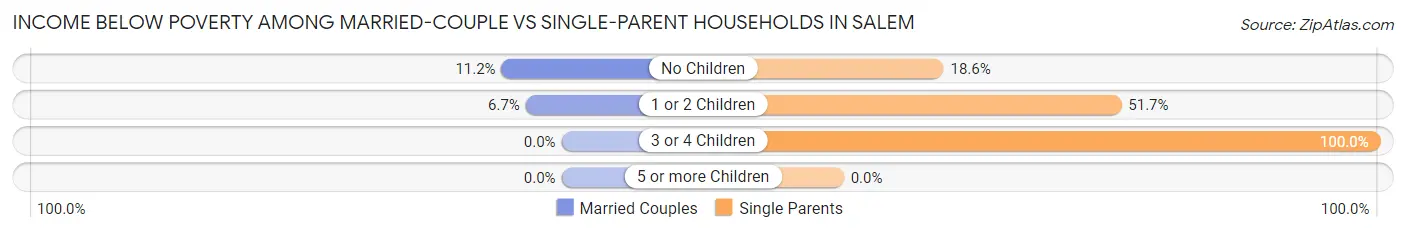
| Children | Married-Couple Families | Single-Parent Households |
| No Children | 17 (11.2%) | 8 (18.6%) |
| 1 or 2 Children | 4 (6.7%) | 30 (51.7%) |
| 3 or 4 Children | 0 (0.0%) | 12 (100.0%) |
| 5 or more Children | 0 (0.0%) | 0 (0.0%) |
| Total | 21 (9.9%) | 50 (44.3%) |
Race in Salem
The most populous races in Salem are White / Caucasian (1,791 | 95.6%), Black / African American (50 | 2.7%), and Hispanic or Latino (42 | 2.2%).
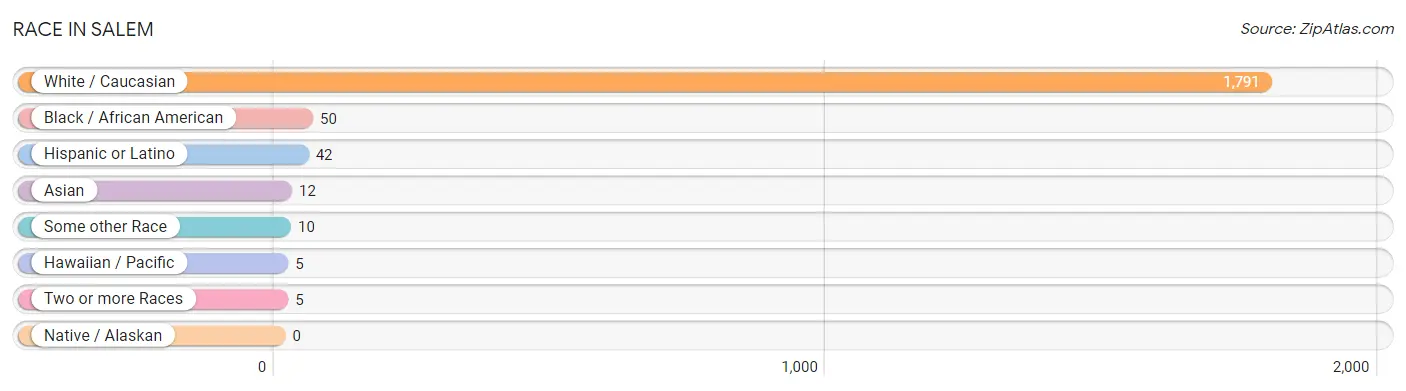
| Race | # Population | % Population |
| Asian | 12 | 0.6% |
| Black / African American | 50 | 2.7% |
| Hawaiian / Pacific | 5 | 0.3% |
| Hispanic or Latino | 42 | 2.2% |
| Native / Alaskan | 0 | 0.0% |
| White / Caucasian | 1,791 | 95.6% |
| Two or more Races | 5 | 0.3% |
| Some other Race | 10 | 0.5% |
| Total | 1,873 | 100.0% |
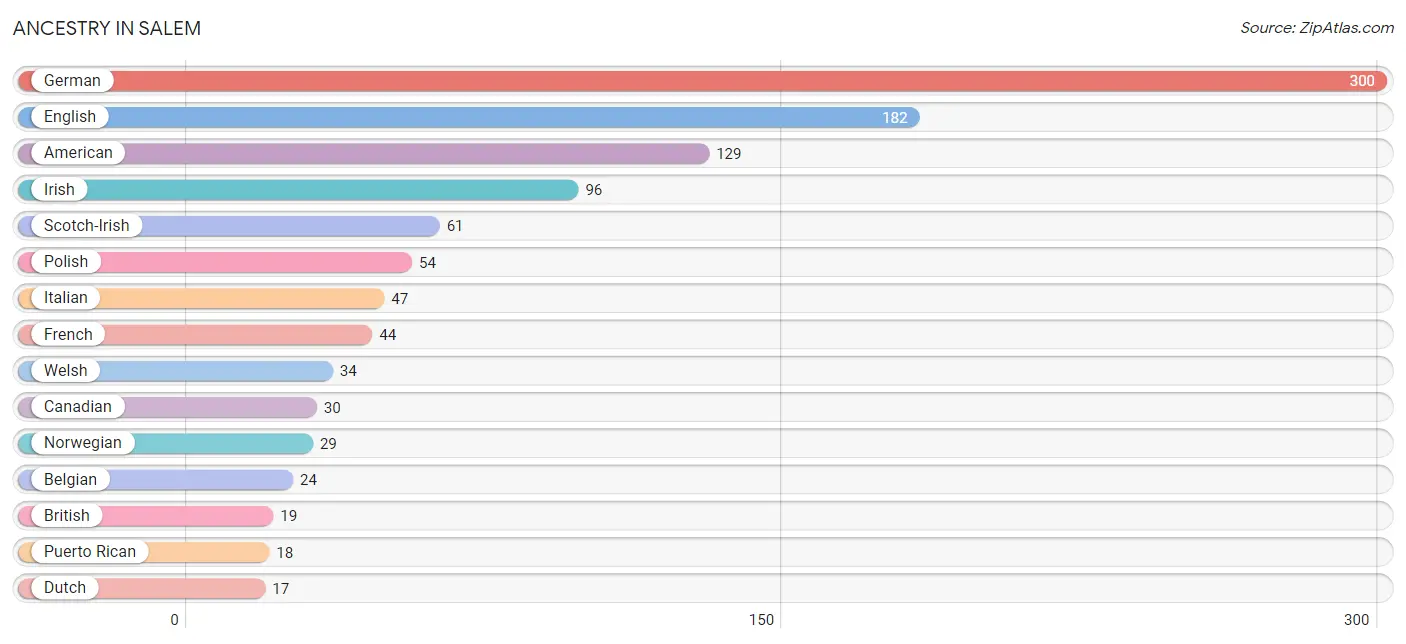
Ancestry in Salem
The most populous ancestries reported in Salem are German (300 | 16.0%), English (182 | 9.7%), American (129 | 6.9%), Irish (96 | 5.1%), and Scotch-Irish (61 | 3.3%), together accounting for 41.0% of all Salem residents.
| Ancestry | # Population | % Population |
| African | 2 | 0.1% |
| American | 129 | 6.9% |
| Belgian | 24 | 1.3% |
| British | 19 | 1.0% |
| Canadian | 30 | 1.6% |
| Cherokee | 3 | 0.2% |
| Czech | 3 | 0.2% |
| Dutch | 17 | 0.9% |
| English | 182 | 9.7% |
| European | 8 | 0.4% |
| French | 44 | 2.4% |
| German | 300 | 16.0% |
| Greek | 6 | 0.3% |
| Hungarian | 6 | 0.3% |
| Irish | 96 | 5.1% |
| Italian | 47 | 2.5% |
| Mexican | 10 | 0.5% |
| Native Hawaiian | 5 | 0.3% |
| Norwegian | 29 | 1.5% |
| Polish | 54 | 2.9% |
| Portuguese | 10 | 0.5% |
| Puerto Rican | 18 | 1.0% |
| Scotch-Irish | 61 | 3.3% |
| Scottish | 11 | 0.6% |
| Serbian | 10 | 0.5% |
| Slovak | 1 | 0.1% |
| Subsaharan African | 2 | 0.1% |
| Swedish | 9 | 0.5% |
| Swiss | 3 | 0.2% |
| Thai | 10 | 0.5% |
| Ukrainian | 3 | 0.2% |
| Welsh | 34 | 1.8% | View All 32 Rows |
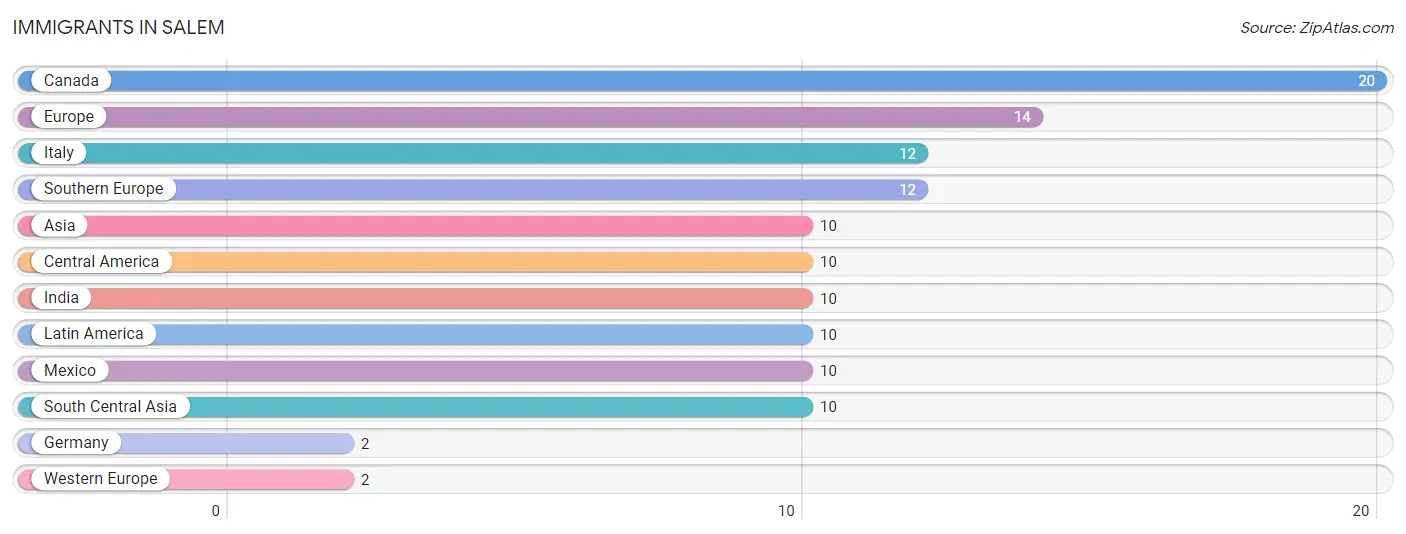
Immigrants in Salem
The most numerous immigrant groups reported in Salem came from Canada (20 | 1.1%), Europe (14 | 0.7%), Italy (12 | 0.6%), Southern Europe (12 | 0.6%), and Asia (10 | 0.5%), together accounting for 3.6% of all Salem residents.
| Immigration Origin | # Population | % Population |
| Asia | 10 | 0.5% |
| Canada | 20 | 1.1% |
| Central America | 10 | 0.5% |
| Europe | 14 | 0.7% |
| Germany | 2 | 0.1% |
| India | 10 | 0.5% |
| Italy | 12 | 0.6% |
| Latin America | 10 | 0.5% |
| Mexico | 10 | 0.5% |
| South Central Asia | 10 | 0.5% |
| Southern Europe | 12 | 0.6% |
| Western Europe | 2 | 0.1% | View All 12 Rows |
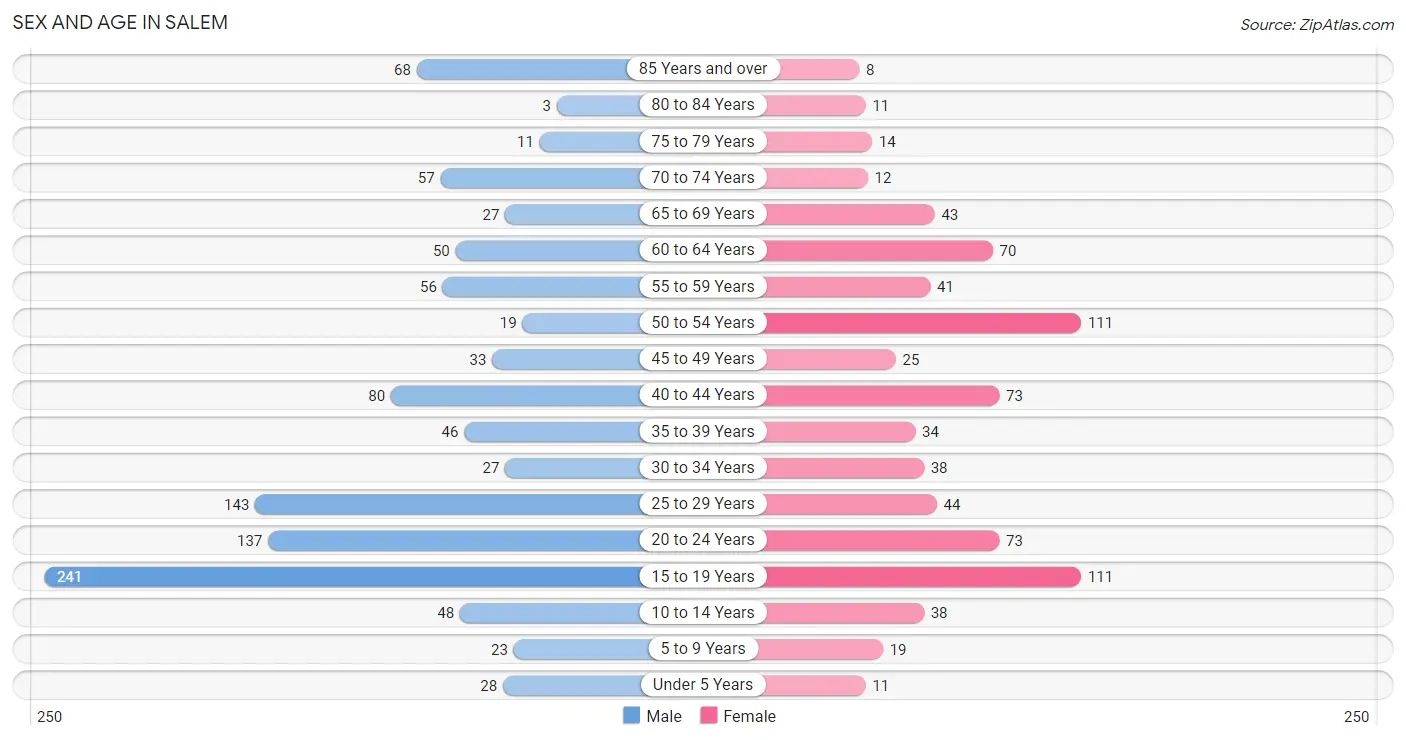
Sex and Age in Salem
Sex and Age in Salem
The most populous age groups in Salem are 15 to 19 Years (241 | 22.0%) for men and 15 to 19 Years (111 | 14.3%) for women.
| Age Bracket | Male | Female |
| Under 5 Years | 28 (2.5%) | 11 (1.4%) |
| 5 to 9 Years | 23 (2.1%) | 19 (2.5%) |
| 10 to 14 Years | 48 (4.4%) | 38 (4.9%) |
| 15 to 19 Years | 241 (22.0%) | 111 (14.3%) |
| 20 to 24 Years | 137 (12.5%) | 73 (9.4%) |
| 25 to 29 Years | 143 (13.0%) | 44 (5.7%) |
| 30 to 34 Years | 27 (2.5%) | 38 (4.9%) |
| 35 to 39 Years | 46 (4.2%) | 34 (4.4%) |
| 40 to 44 Years | 80 (7.3%) | 73 (9.4%) |
| 45 to 49 Years | 33 (3.0%) | 25 (3.2%) |
| 50 to 54 Years | 19 (1.7%) | 111 (14.3%) |
| 55 to 59 Years | 56 (5.1%) | 41 (5.3%) |
| 60 to 64 Years | 50 (4.6%) | 70 (9.0%) |
| 65 to 69 Years | 27 (2.5%) | 43 (5.5%) |
| 70 to 74 Years | 57 (5.2%) | 12 (1.5%) |
| 75 to 79 Years | 11 (1.0%) | 14 (1.8%) |
| 80 to 84 Years | 3 (0.3%) | 11 (1.4%) |
| 85 Years and over | 68 (6.2%) | 8 (1.0%) |
| Total | 1,097 (100.0%) | 776 (100.0%) |
Families and Households in Salem
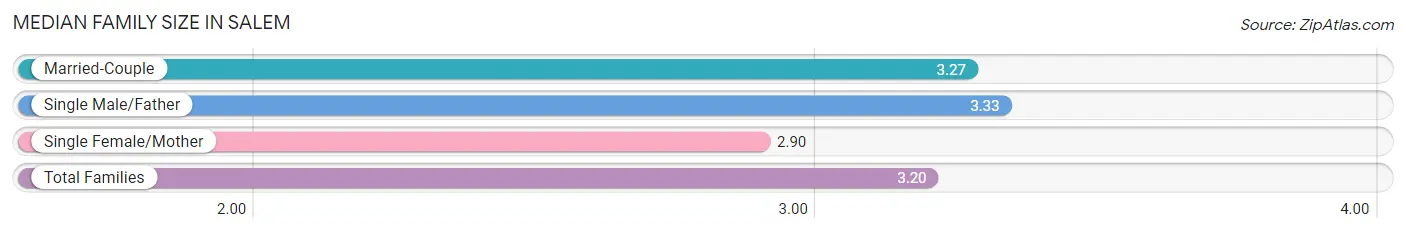
Median Family Size in Salem
The median family size in Salem is 3.20 persons per family, with single male/father families (40 | 12.3%) accounting for the largest median family size of 3.33 persons per family. On the other hand, single female/mother families (73 | 22.5%) represent the smallest median family size with 2.90 persons per family.
| Family Type | # Families | Family Size |
| Married-Couple | 212 (65.2%) | 3.27 |
| Single Male/Father | 40 (12.3%) | 3.33 |
| Single Female/Mother | 73 (22.5%) | 2.90 |
| Total Families | 325 (100.0%) | 3.20 |
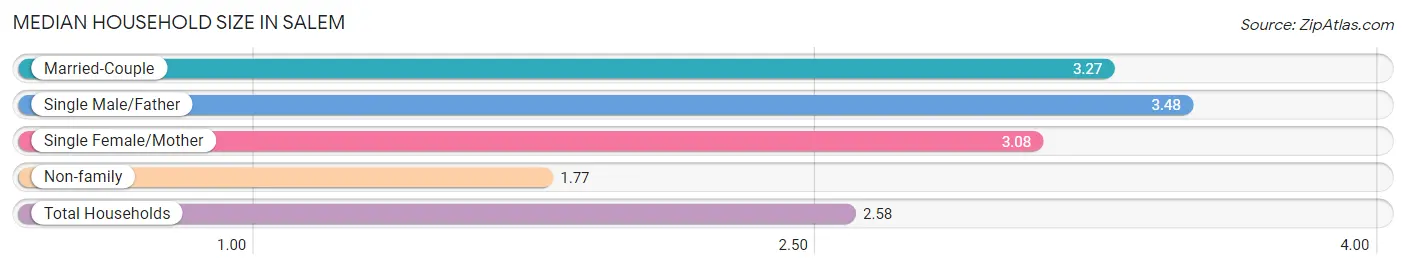
Median Household Size in Salem
The median household size in Salem is 2.58 persons per household, with single male/father households (40 | 6.7%) accounting for the largest median household size of 3.48 persons per household. non-family households (274 | 45.7%) represent the smallest median household size with 1.77 persons per household.
| Household Type | # Households | Household Size |
| Married-Couple | 212 (35.4%) | 3.27 |
| Single Male/Father | 40 (6.7%) | 3.48 |
| Single Female/Mother | 73 (12.2%) | 3.08 |
| Non-family | 274 (45.7%) | 1.77 |
| Total Households | 599 (100.0%) | 2.58 |
Household Size by Marriage Status in Salem
Out of a total of 599 households in Salem, 325 (54.3%) are family households, while 274 (45.7%) are nonfamily households. The most numerous type of family households are 2-person households, comprising 165, and the most common type of nonfamily households are 1-person households, comprising 210.
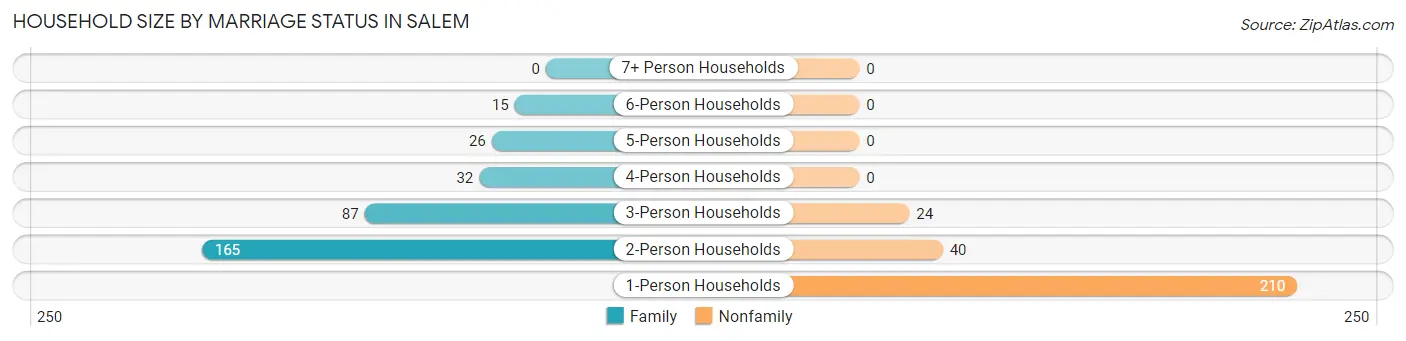
| Household Size | Family Households | Nonfamily Households |
| 1-Person Households | - | 210 (35.1%) |
| 2-Person Households | 165 (27.6%) | 40 (6.7%) |
| 3-Person Households | 87 (14.5%) | 24 (4.0%) |
| 4-Person Households | 32 (5.3%) | 0 (0.0%) |
| 5-Person Households | 26 (4.3%) | 0 (0.0%) |
| 6-Person Households | 15 (2.5%) | 0 (0.0%) |
| 7+ Person Households | 0 (0.0%) | 0 (0.0%) |
| Total | 325 (54.3%) | 274 (45.7%) |
Female Fertility in Salem
Fertility by Age in Salem
Average fertility rate in Salem is 35.0 births per 1,000 women. Women in the age bracket of 20 to 34 years have the highest fertility rate with 58.0 births per 1,000 women. Women in the age bracket of 20 to 34 years acount for 64.3% of all women with births.
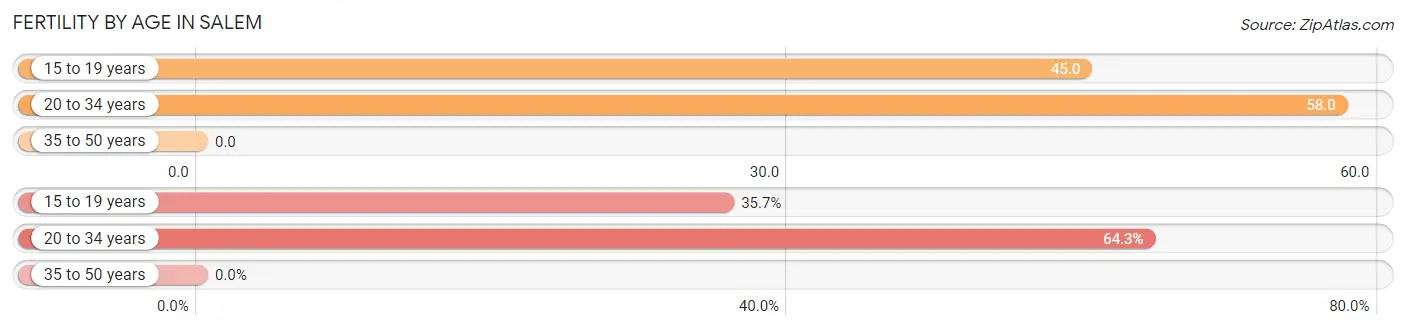
| Age Bracket | Women with Births | Births / 1,000 Women |
| 15 to 19 years | 5 (35.7%) | 45.0 |
| 20 to 34 years | 9 (64.3%) | 58.0 |
| 35 to 50 years | 0 (0.0%) | 0.0 |
| Total | 14 (100.0%) | 35.0 |
Fertility by Age by Marriage Status in Salem
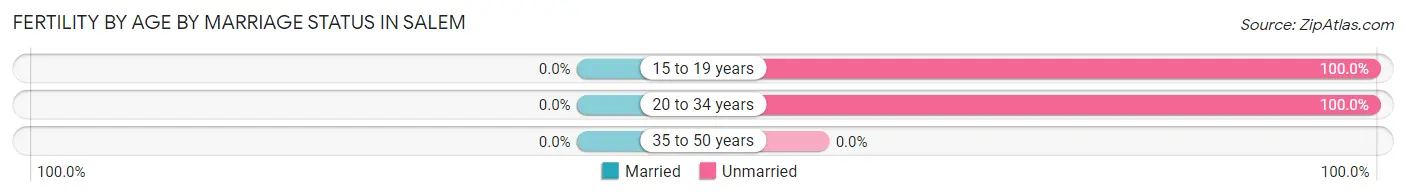
| Age Bracket | Married | Unmarried |
| 15 to 19 years | 0 (0.0%) | 5 (100.0%) |
| 20 to 34 years | 0 (0.0%) | 9 (100.0%) |
| 35 to 50 years | 0 (0.0%) | 0 (0.0%) |
| Total | 0 (0.0%) | 14 (100.0%) |
Fertility by Education in Salem
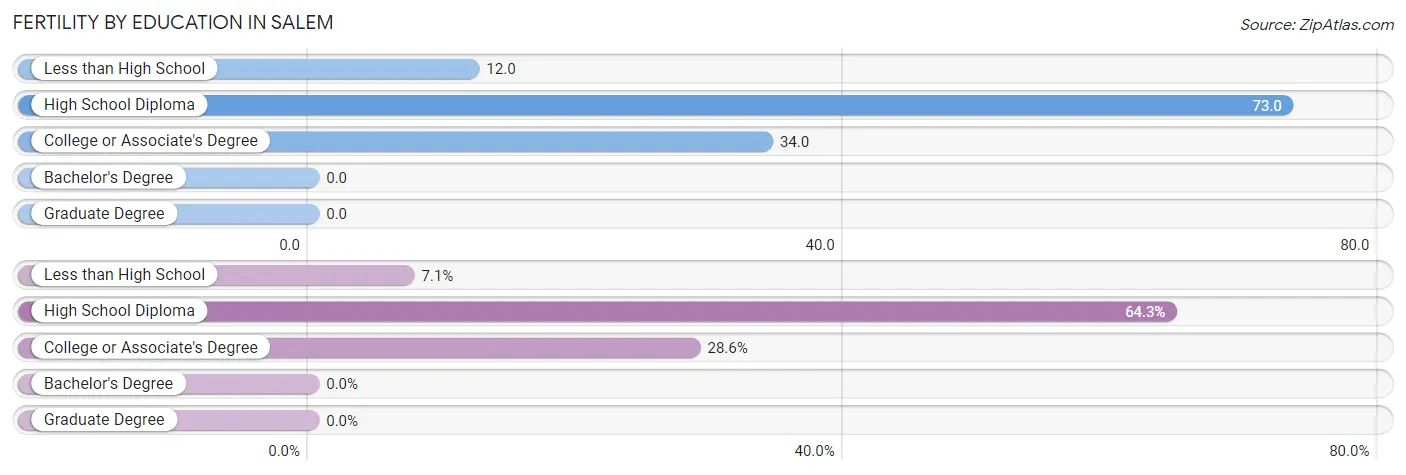
| Educational Attainment | Women with Births | Births / 1,000 Women |
| Less than High School | 1 (7.1%) | 12.0 |
| High School Diploma | 9 (64.3%) | 73.0 |
| College or Associate's Degree | 4 (28.6%) | 34.0 |
| Bachelor's Degree | 0 (0.0%) | 0.0 |
| Graduate Degree | 0 (0.0%) | 0.0 |
| Total | 14 (100.0%) | 35.0 |
Fertility by Education by Marriage Status in Salem
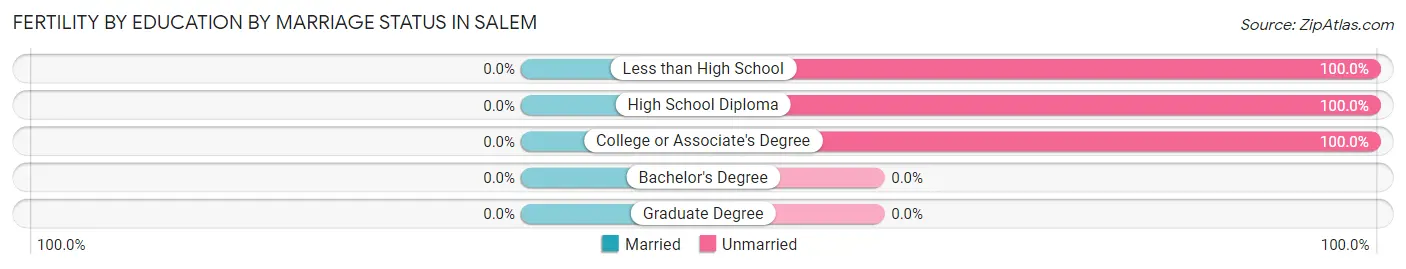
| Educational Attainment | Married | Unmarried |
| Less than High School | 0 (0.0%) | 1 (100.0%) |
| High School Diploma | 0 (0.0%) | 9 (100.0%) |
| College or Associate's Degree | 0 (0.0%) | 4 (100.0%) |
| Bachelor's Degree | 0 (0.0%) | 0 (0.0%) |
| Graduate Degree | 0 (0.0%) | 0 (0.0%) |
| Total | 0 (0.0%) | 14 (100.0%) |
Employment Characteristics in Salem
Employment by Class of Employer in Salem
Among the 830 employed individuals in Salem, private company employees (468 | 56.4%), not-for-profit organizations (199 | 24.0%), and state government employees (80 | 9.6%) make up the most common classes of employment.
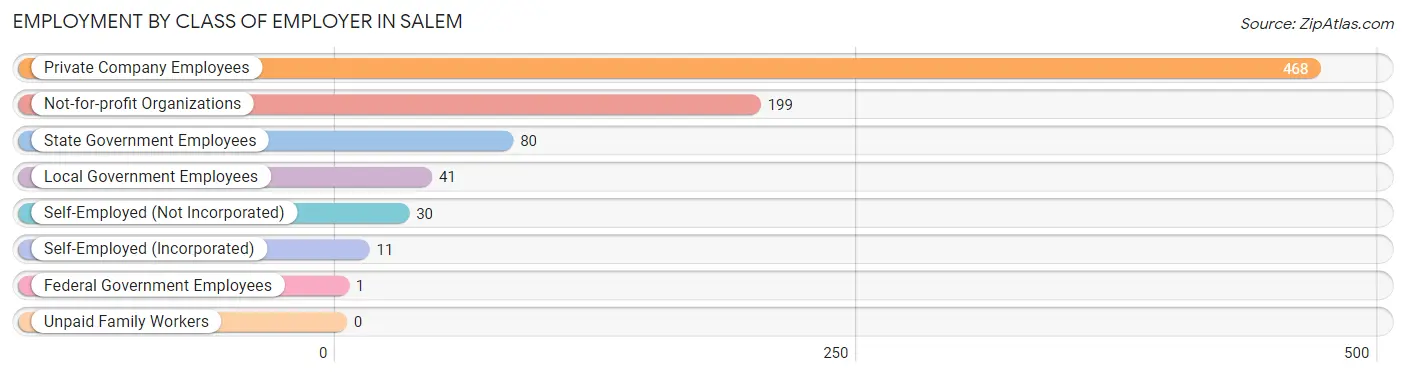
| Employer Class | # Employees | % Employees |
| Private Company Employees | 468 | 56.4% |
| Self-Employed (Incorporated) | 11 | 1.3% |
| Self-Employed (Not Incorporated) | 30 | 3.6% |
| Not-for-profit Organizations | 199 | 24.0% |
| Local Government Employees | 41 | 4.9% |
| State Government Employees | 80 | 9.6% |
| Federal Government Employees | 1 | 0.1% |
| Unpaid Family Workers | 0 | 0.0% |
| Total | 830 | 100.0% |
Employment Status by Age in Salem
According to the labor force statistics for Salem, out of the total population over 16 years of age (1,672), 51.7% or 864 individuals are in the labor force, with 4.0% or 35 of them unemployed. The age group with the highest labor force participation rate is 25 to 29 years, with 87.2% or 163 individuals in the labor force. Within the labor force, the 30 to 34 years age range has the highest percentage of unemployed individuals, with 30.4% or 17 of them being unemployed.
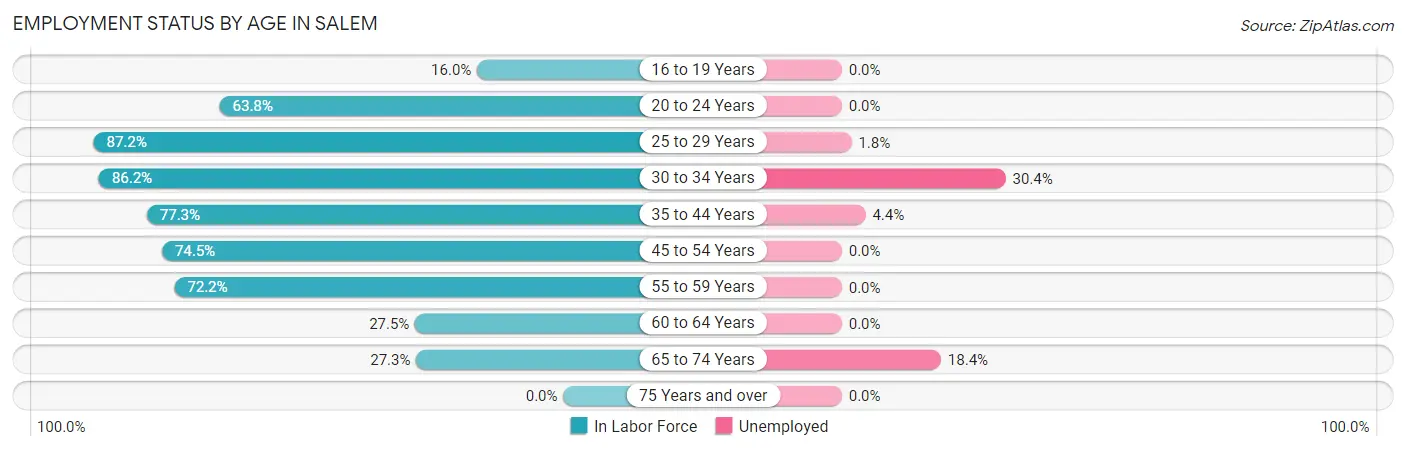
| Age Bracket | In Labor Force | Unemployed |
| 16 to 19 Years | 51 (16.0%) | 0 (0.0%) |
| 20 to 24 Years | 134 (63.8%) | 0 (0.0%) |
| 25 to 29 Years | 163 (87.2%) | 3 (1.8%) |
| 30 to 34 Years | 56 (86.2%) | 17 (30.4%) |
| 35 to 44 Years | 180 (77.3%) | 8 (4.4%) |
| 45 to 54 Years | 140 (74.5%) | 0 (0.0%) |
| 55 to 59 Years | 70 (72.2%) | 0 (0.0%) |
| 60 to 64 Years | 33 (27.5%) | 0 (0.0%) |
| 65 to 74 Years | 38 (27.3%) | 7 (18.4%) |
| 75 Years and over | 0 (0.0%) | 0 (0.0%) |
| Total | 864 (51.7%) | 35 (4.0%) |
Employment Status by Educational Attainment in Salem
According to labor force statistics for Salem, 72.1% of individuals (642) out of the total population between 25 and 64 years of age (890) are in the labor force, with 4.4% or 28 of them being unemployed. The group with the highest labor force participation rate are those with the educational attainment of bachelor's degree or higher, with 80.4% or 160 individuals in the labor force. Within the labor force, individuals with less than high school education have the highest percentage of unemployment, with 12.1% or 4 of them being unemployed.
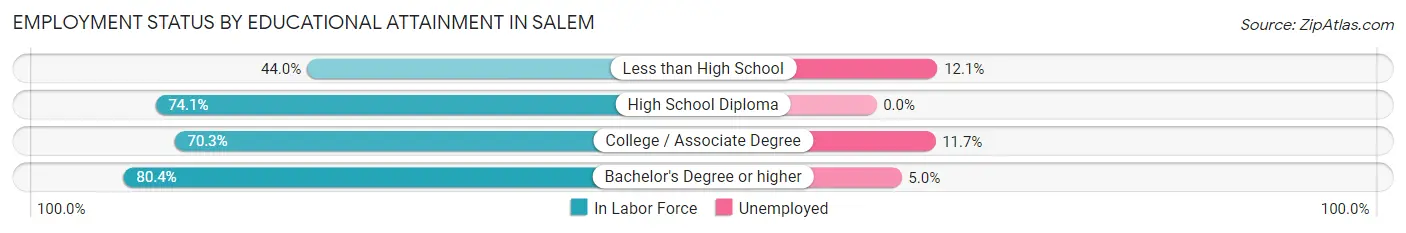
| Educational Attainment | In Labor Force | Unemployed |
| Less than High School | 33 (44.0%) | 9 (12.1%) |
| High School Diploma | 312 (74.1%) | 0 (0.0%) |
| College / Associate Degree | 137 (70.3%) | 23 (11.7%) |
| Bachelor's Degree or higher | 160 (80.4%) | 10 (5.0%) |
| Total | 642 (72.1%) | 39 (4.4%) |
Employment Occupations by Sex in Salem
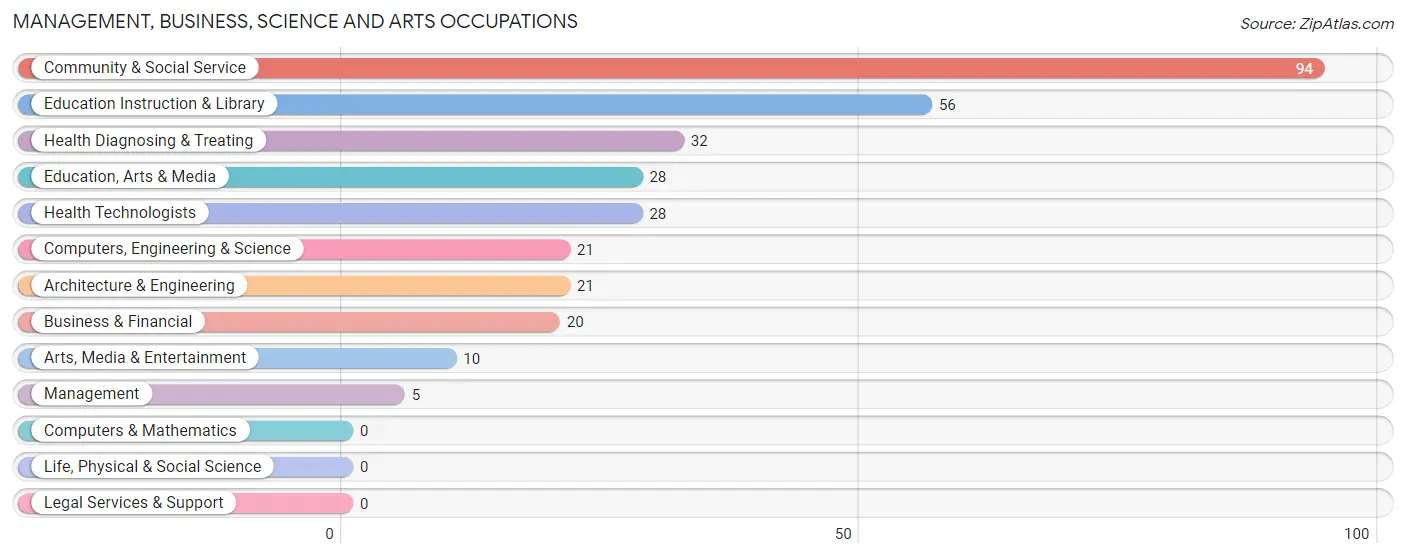
Management, Business, Science and Arts Occupations
The most common Management, Business, Science and Arts occupations in Salem are Community & Social Service (94 | 11.3%), Education Instruction & Library (56 | 6.8%), Health Diagnosing & Treating (32 | 3.9%), Education, Arts & Media (28 | 3.4%), and Health Technologists (28 | 3.4%).
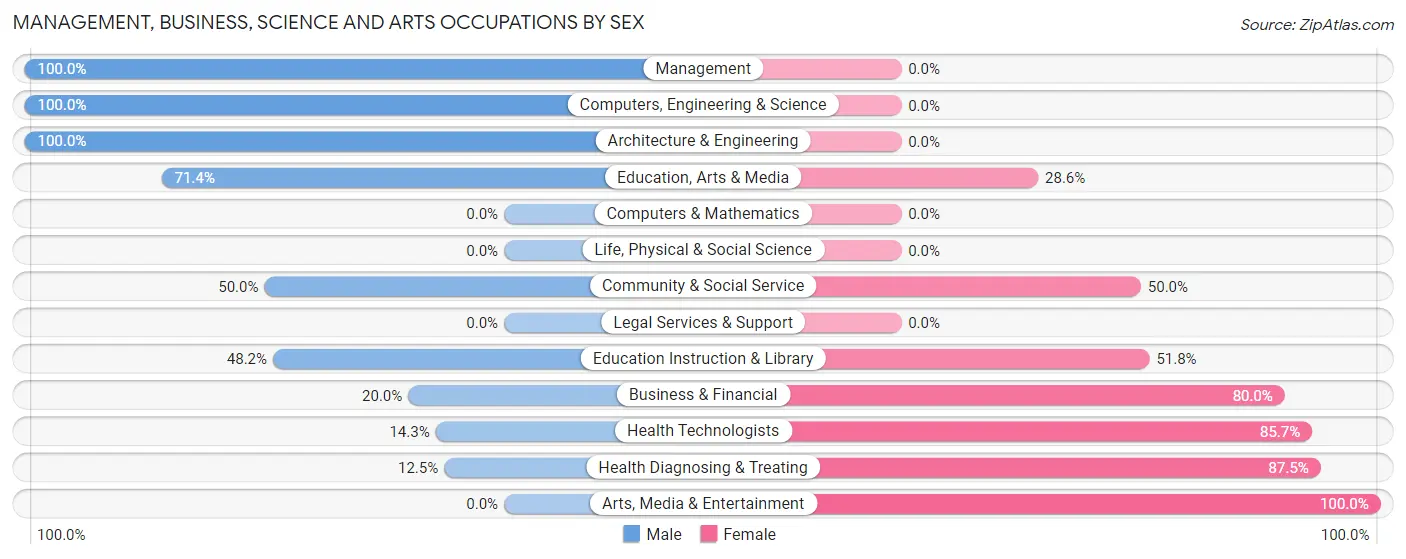
Management, Business, Science and Arts Occupations by Sex
Within the Management, Business, Science and Arts occupations in Salem, the most male-oriented occupations are Management (100.0%), Computers, Engineering & Science (100.0%), and Architecture & Engineering (100.0%), while the most female-oriented occupations are Arts, Media & Entertainment (100.0%), Health Diagnosing & Treating (87.5%), and Health Technologists (85.7%).
| Occupation | Male | Female |
| Management | 5 (100.0%) | 0 (0.0%) |
| Business & Financial | 4 (20.0%) | 16 (80.0%) |
| Computers, Engineering & Science | 21 (100.0%) | 0 (0.0%) |
| Computers & Mathematics | 0 (0.0%) | 0 (0.0%) |
| Architecture & Engineering | 21 (100.0%) | 0 (0.0%) |
| Life, Physical & Social Science | 0 (0.0%) | 0 (0.0%) |
| Community & Social Service | 47 (50.0%) | 47 (50.0%) |
| Education, Arts & Media | 20 (71.4%) | 8 (28.6%) |
| Legal Services & Support | 0 (0.0%) | 0 (0.0%) |
| Education Instruction & Library | 27 (48.2%) | 29 (51.8%) |
| Arts, Media & Entertainment | 0 (0.0%) | 10 (100.0%) |
| Health Diagnosing & Treating | 4 (12.5%) | 28 (87.5%) |
| Health Technologists | 4 (14.3%) | 24 (85.7%) |
| Total (Category) | 81 (47.1%) | 91 (52.9%) |
| Total (Overall) | 451 (54.3%) | 379 (45.7%) |
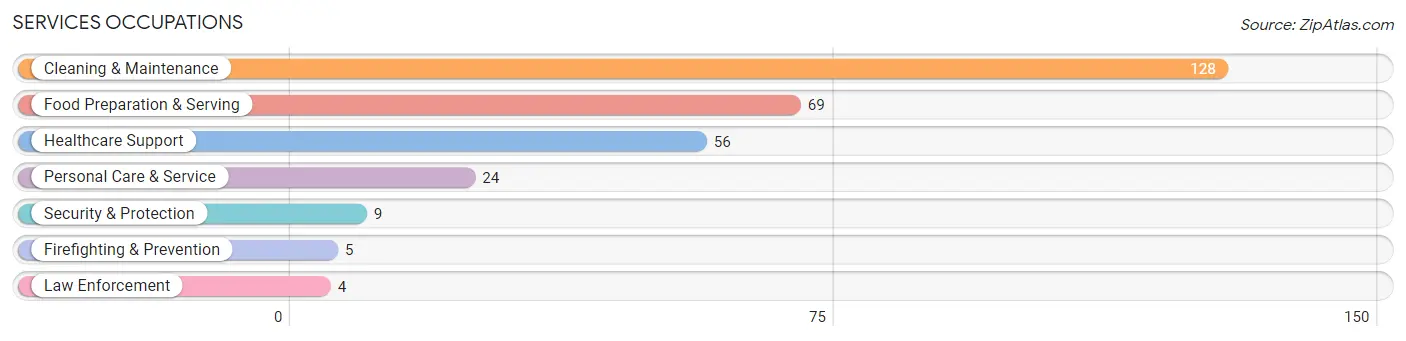
Services Occupations
The most common Services occupations in Salem are Cleaning & Maintenance (128 | 15.4%), Food Preparation & Serving (69 | 8.3%), Healthcare Support (56 | 6.8%), Personal Care & Service (24 | 2.9%), and Security & Protection (9 | 1.1%).
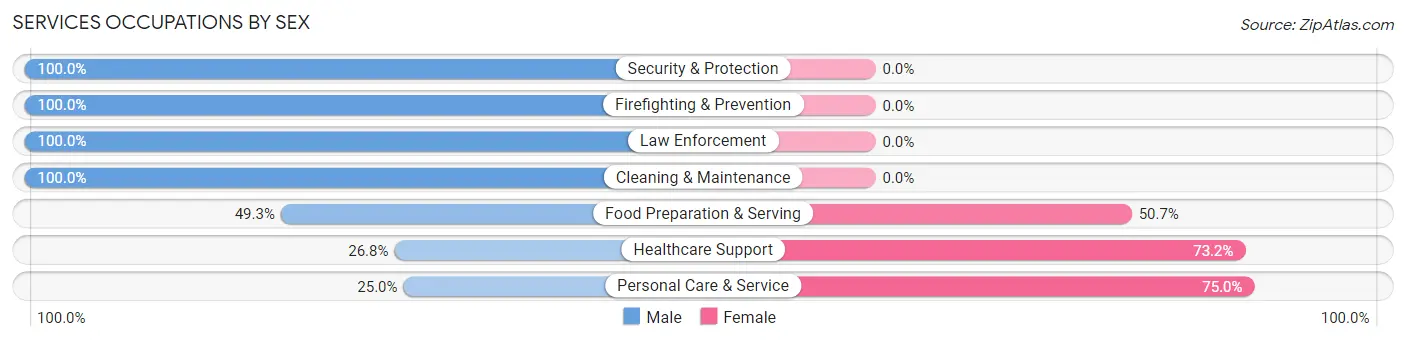
Services Occupations by Sex
Within the Services occupations in Salem, the most male-oriented occupations are Security & Protection (100.0%), Firefighting & Prevention (100.0%), and Law Enforcement (100.0%), while the most female-oriented occupations are Personal Care & Service (75.0%), Healthcare Support (73.2%), and Food Preparation & Serving (50.7%).
| Occupation | Male | Female |
| Healthcare Support | 15 (26.8%) | 41 (73.2%) |
| Security & Protection | 9 (100.0%) | 0 (0.0%) |
| Firefighting & Prevention | 5 (100.0%) | 0 (0.0%) |
| Law Enforcement | 4 (100.0%) | 0 (0.0%) |
| Food Preparation & Serving | 34 (49.3%) | 35 (50.7%) |
| Cleaning & Maintenance | 128 (100.0%) | 0 (0.0%) |
| Personal Care & Service | 6 (25.0%) | 18 (75.0%) |
| Total (Category) | 192 (67.1%) | 94 (32.9%) |
| Total (Overall) | 451 (54.3%) | 379 (45.7%) |
Sales and Office Occupations
The most common Sales and Office occupations in Salem are Sales & Related (133 | 16.0%), and Office & Administration (92 | 11.1%).
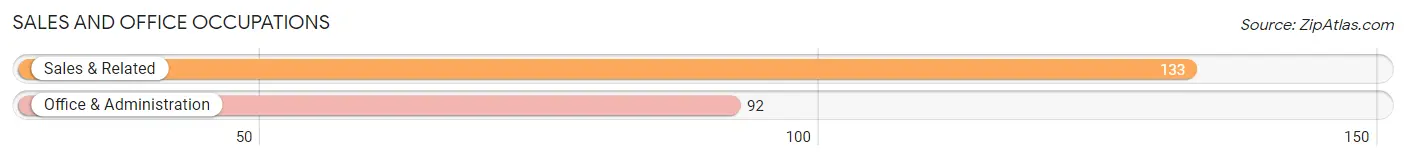
Sales and Office Occupations by Sex
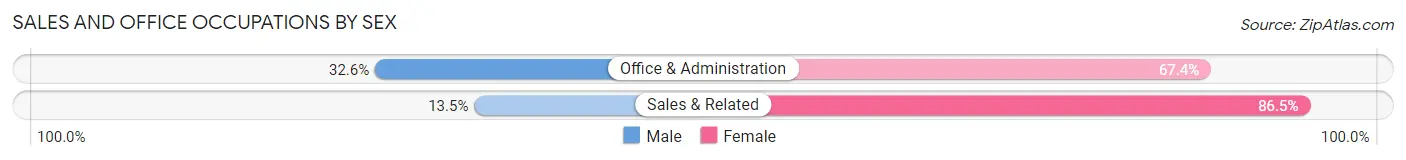
| Occupation | Male | Female |
| Sales & Related | 18 (13.5%) | 115 (86.5%) |
| Office & Administration | 30 (32.6%) | 62 (67.4%) |
| Total (Category) | 48 (21.3%) | 177 (78.7%) |
| Total (Overall) | 451 (54.3%) | 379 (45.7%) |
Natural Resources, Construction and Maintenance Occupations
The most common Natural Resources, Construction and Maintenance occupations in Salem are , and Construction & Extraction (21 | 2.5%).
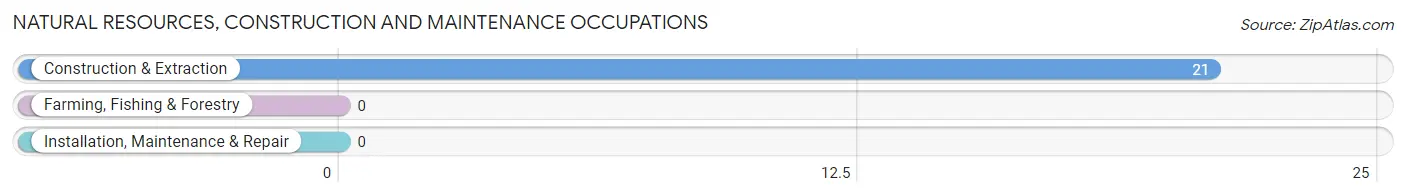
Natural Resources, Construction and Maintenance Occupations by Sex
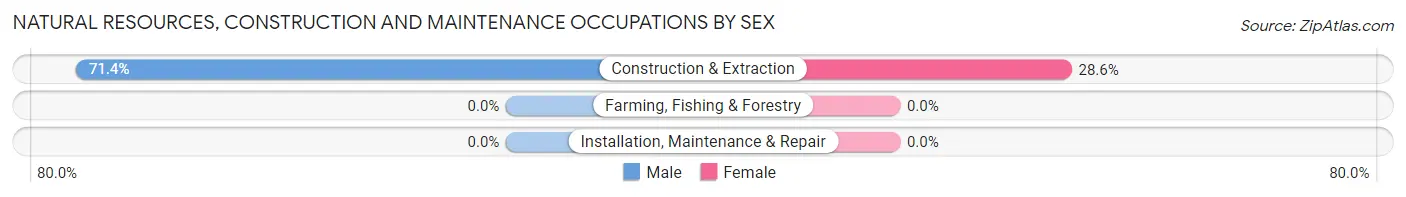
| Occupation | Male | Female |
| Farming, Fishing & Forestry | 0 (0.0%) | 0 (0.0%) |
| Construction & Extraction | 15 (71.4%) | 6 (28.6%) |
| Installation, Maintenance & Repair | 0 (0.0%) | 0 (0.0%) |
| Total (Category) | 15 (71.4%) | 6 (28.6%) |
| Total (Overall) | 451 (54.3%) | 379 (45.7%) |
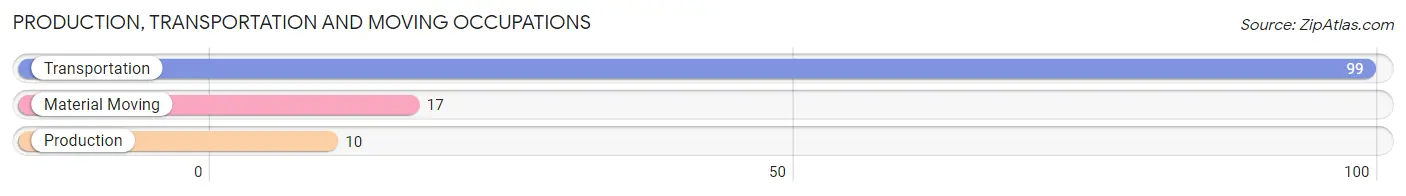
Production, Transportation and Moving Occupations
The most common Production, Transportation and Moving occupations in Salem are Transportation (99 | 11.9%), Material Moving (17 | 2.1%), and Production (10 | 1.2%).
Production, Transportation and Moving Occupations by Sex
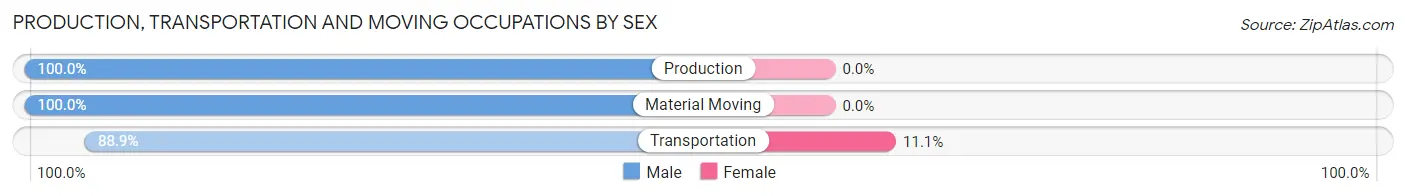
| Occupation | Male | Female |
| Production | 10 (100.0%) | 0 (0.0%) |
| Transportation | 88 (88.9%) | 11 (11.1%) |
| Material Moving | 17 (100.0%) | 0 (0.0%) |
| Total (Category) | 115 (91.3%) | 11 (8.7%) |
| Total (Overall) | 451 (54.3%) | 379 (45.7%) |
Employment Industries by Sex in Salem
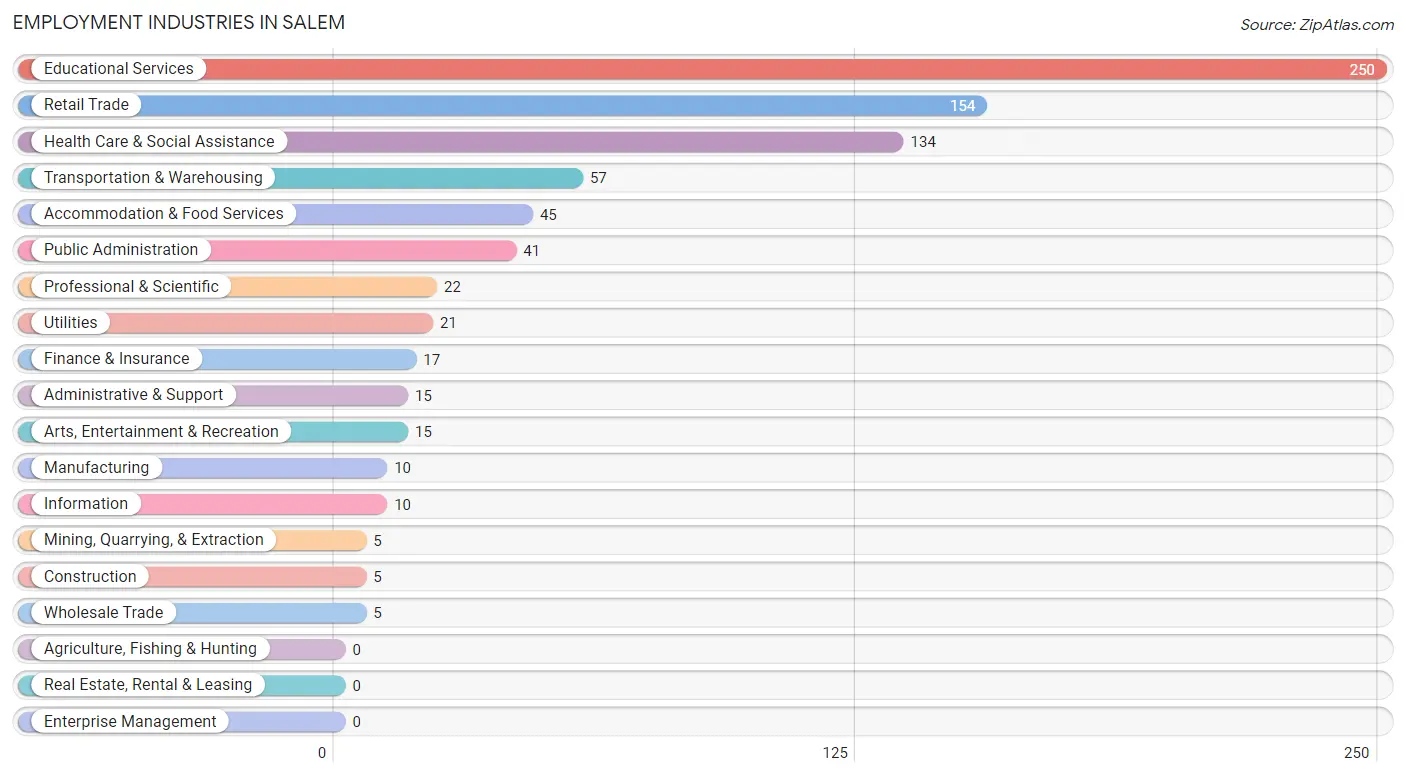
Employment Industries in Salem
The major employment industries in Salem include Educational Services (250 | 30.1%), Retail Trade (154 | 18.5%), Health Care & Social Assistance (134 | 16.1%), Transportation & Warehousing (57 | 6.9%), and Accommodation & Food Services (45 | 5.4%).
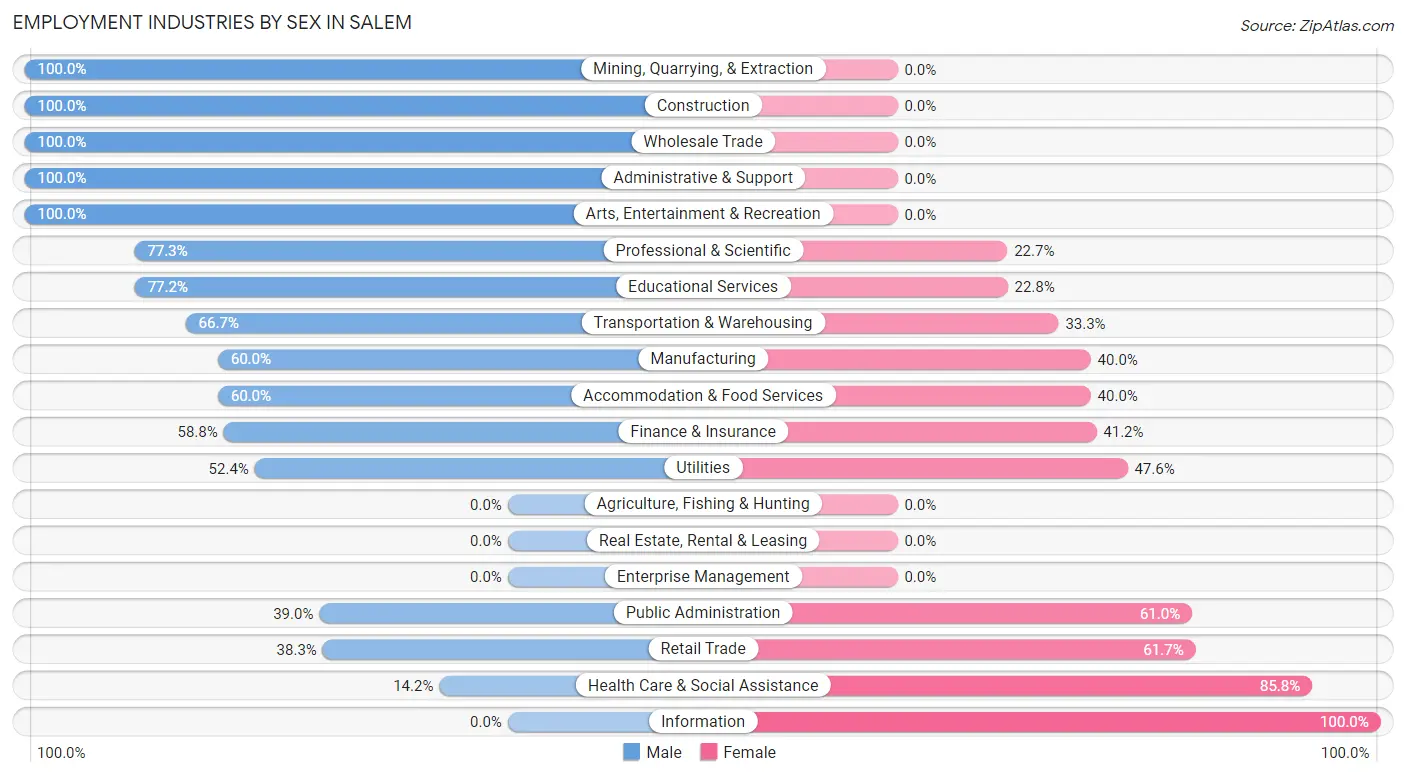
Employment Industries by Sex in Salem
The Salem industries that see more men than women are Mining, Quarrying, & Extraction (100.0%), Construction (100.0%), and Wholesale Trade (100.0%), whereas the industries that tend to have a higher number of women are Information (100.0%), Health Care & Social Assistance (85.8%), and Retail Trade (61.7%).
| Industry | Male | Female |
| Agriculture, Fishing & Hunting | 0 (0.0%) | 0 (0.0%) |
| Mining, Quarrying, & Extraction | 5 (100.0%) | 0 (0.0%) |
| Construction | 5 (100.0%) | 0 (0.0%) |
| Manufacturing | 6 (60.0%) | 4 (40.0%) |
| Wholesale Trade | 5 (100.0%) | 0 (0.0%) |
| Retail Trade | 59 (38.3%) | 95 (61.7%) |
| Transportation & Warehousing | 38 (66.7%) | 19 (33.3%) |
| Utilities | 11 (52.4%) | 10 (47.6%) |
| Information | 0 (0.0%) | 10 (100.0%) |
| Finance & Insurance | 10 (58.8%) | 7 (41.2%) |
| Real Estate, Rental & Leasing | 0 (0.0%) | 0 (0.0%) |
| Professional & Scientific | 17 (77.3%) | 5 (22.7%) |
| Enterprise Management | 0 (0.0%) | 0 (0.0%) |
| Administrative & Support | 15 (100.0%) | 0 (0.0%) |
| Educational Services | 193 (77.2%) | 57 (22.8%) |
| Health Care & Social Assistance | 19 (14.2%) | 115 (85.8%) |
| Arts, Entertainment & Recreation | 15 (100.0%) | 0 (0.0%) |
| Accommodation & Food Services | 27 (60.0%) | 18 (40.0%) |
| Public Administration | 16 (39.0%) | 25 (61.0%) |
| Total | 451 (54.3%) | 379 (45.7%) |
Education in Salem
School Enrollment in Salem
The most common levels of schooling among the 609 students in Salem are college / undergraduate (340 | 55.8%), high school (123 | 20.2%), and middle school (85 | 14.0%).
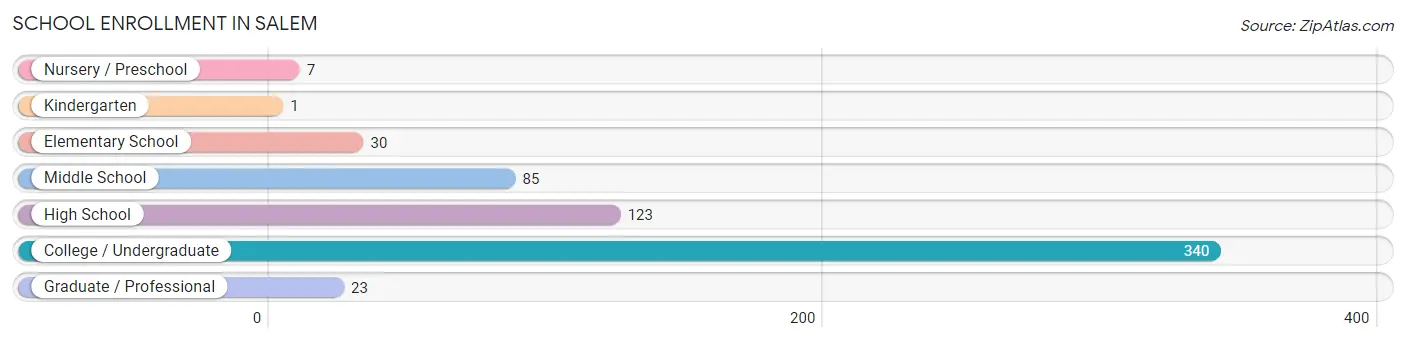
| School Level | # Students | % Students |
| Nursery / Preschool | 7 | 1.1% |
| Kindergarten | 1 | 0.2% |
| Elementary School | 30 | 4.9% |
| Middle School | 85 | 14.0% |
| High School | 123 | 20.2% |
| College / Undergraduate | 340 | 55.8% |
| Graduate / Professional | 23 | 3.8% |
| Total | 609 | 100.0% |
School Enrollment by Age by Funding Source in Salem
Out of a total of 609 students who are enrolled in schools in Salem, 237 (38.9%) attend a private institution, while the remaining 372 (61.1%) are enrolled in public schools. The age group of 35 years and over has the highest likelihood of being enrolled in private schools, with 3 (100.0% in the age bracket) enrolled. Conversely, the age group of 10 to 14 year olds has the lowest likelihood of being enrolled in a private school, with 86 (100.0% in the age bracket) attending a public institution.
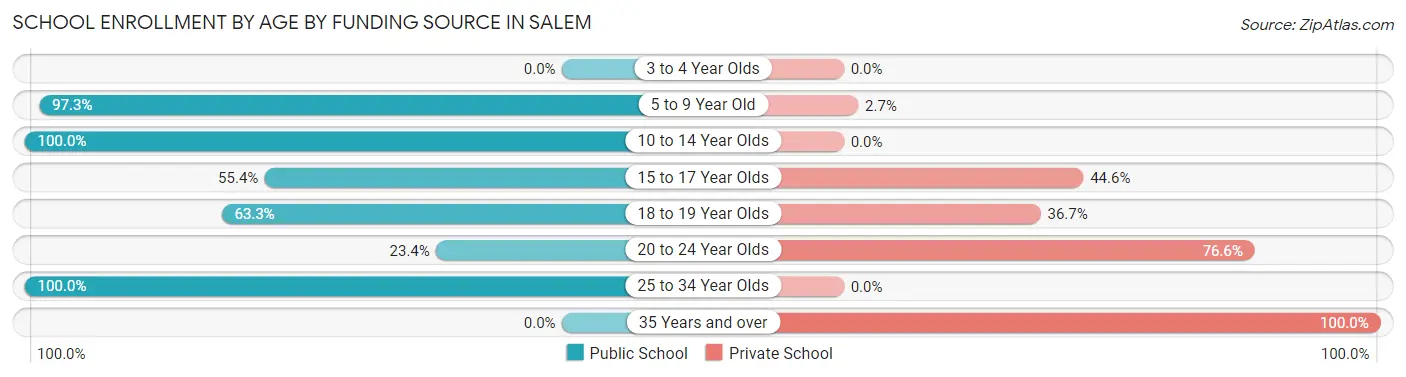
| Age Bracket | Public School | Private School |
| 3 to 4 Year Olds | 0 (0.0%) | 0 (0.0%) |
| 5 to 9 Year Old | 36 (97.3%) | 1 (2.7%) |
| 10 to 14 Year Olds | 86 (100.0%) | 0 (0.0%) |
| 15 to 17 Year Olds | 72 (55.4%) | 58 (44.6%) |
| 18 to 19 Year Olds | 133 (63.3%) | 77 (36.7%) |
| 20 to 24 Year Olds | 30 (23.4%) | 98 (76.6%) |
| 25 to 34 Year Olds | 15 (100.0%) | 0 (0.0%) |
| 35 Years and over | 0 (0.0%) | 3 (100.0%) |
| Total | 372 (61.1%) | 237 (38.9%) |
Educational Attainment by Field of Study in Salem
Education (89 | 34.0%), science & technology (51 | 19.5%), arts & humanities (32 | 12.2%), business (19 | 7.2%), and psychology (17 | 6.5%) are the most common fields of study among 262 individuals in Salem who have obtained a bachelor's degree or higher.
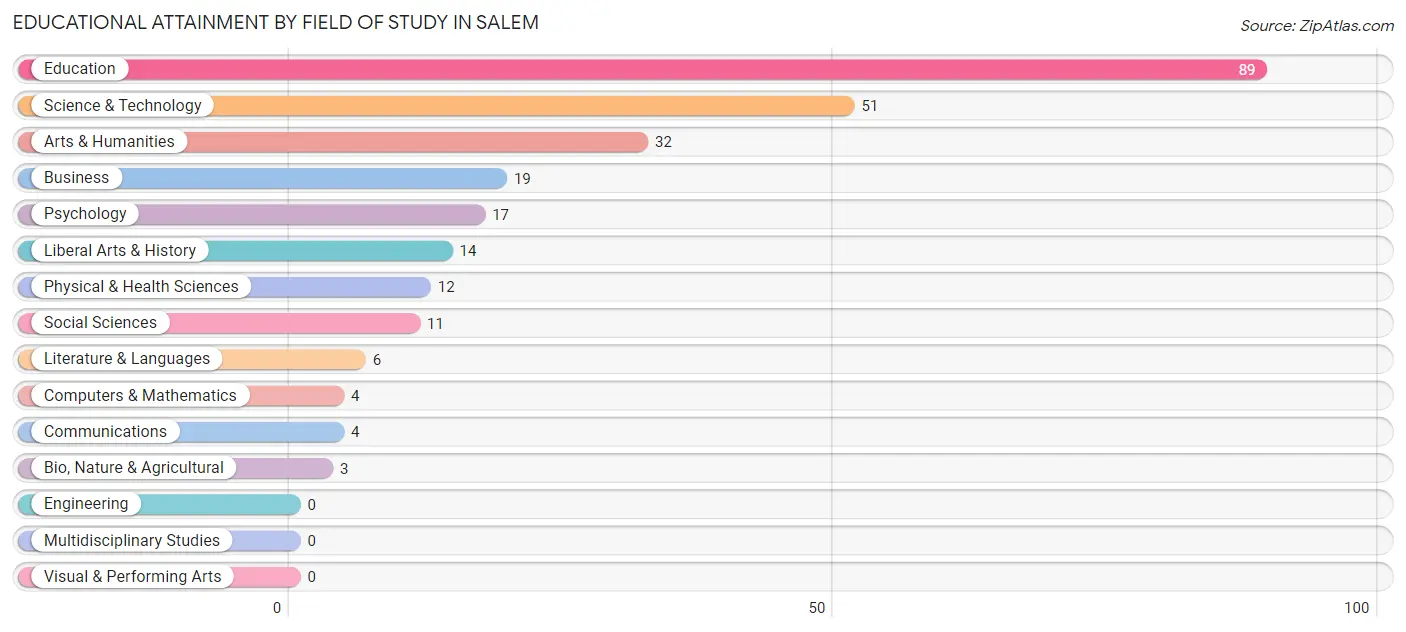
| Field of Study | # Graduates | % Graduates |
| Computers & Mathematics | 4 | 1.5% |
| Bio, Nature & Agricultural | 3 | 1.1% |
| Physical & Health Sciences | 12 | 4.6% |
| Psychology | 17 | 6.5% |
| Social Sciences | 11 | 4.2% |
| Engineering | 0 | 0.0% |
| Multidisciplinary Studies | 0 | 0.0% |
| Science & Technology | 51 | 19.5% |
| Business | 19 | 7.2% |
| Education | 89 | 34.0% |
| Literature & Languages | 6 | 2.3% |
| Liberal Arts & History | 14 | 5.3% |
| Visual & Performing Arts | 0 | 0.0% |
| Communications | 4 | 1.5% |
| Arts & Humanities | 32 | 12.2% |
| Total | 262 | 100.0% |
Transportation & Commute in Salem
Vehicle Availability by Sex in Salem
The most prevalent vehicle ownership categories in Salem are males with 3 vehicles (183, accounting for 45.8%) and females with 3 vehicles (140, making up 51.8%).
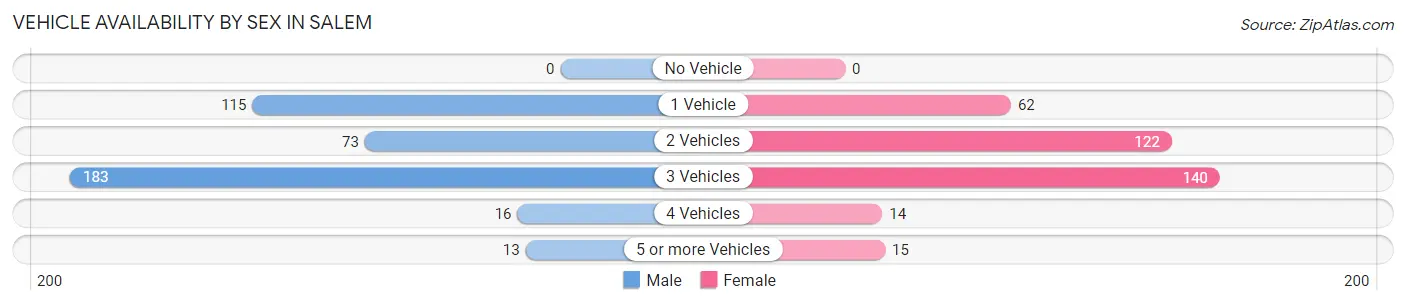
| Vehicles Available | Male | Female |
| No Vehicle | 0 (0.0%) | 0 (0.0%) |
| 1 Vehicle | 115 (28.7%) | 62 (17.6%) |
| 2 Vehicles | 73 (18.2%) | 122 (34.6%) |
| 3 Vehicles | 183 (45.8%) | 140 (39.7%) |
| 4 Vehicles | 16 (4.0%) | 14 (4.0%) |
| 5 or more Vehicles | 13 (3.3%) | 15 (4.3%) |
| Total | 400 (100.0%) | 353 (100.0%) |
Commute Time in Salem
The most frequently occuring commute durations in Salem are 5 to 9 minutes (178 commuters, 22.8%), 15 to 19 minutes (163 commuters, 20.9%), and 10 to 14 minutes (97 commuters, 12.4%).
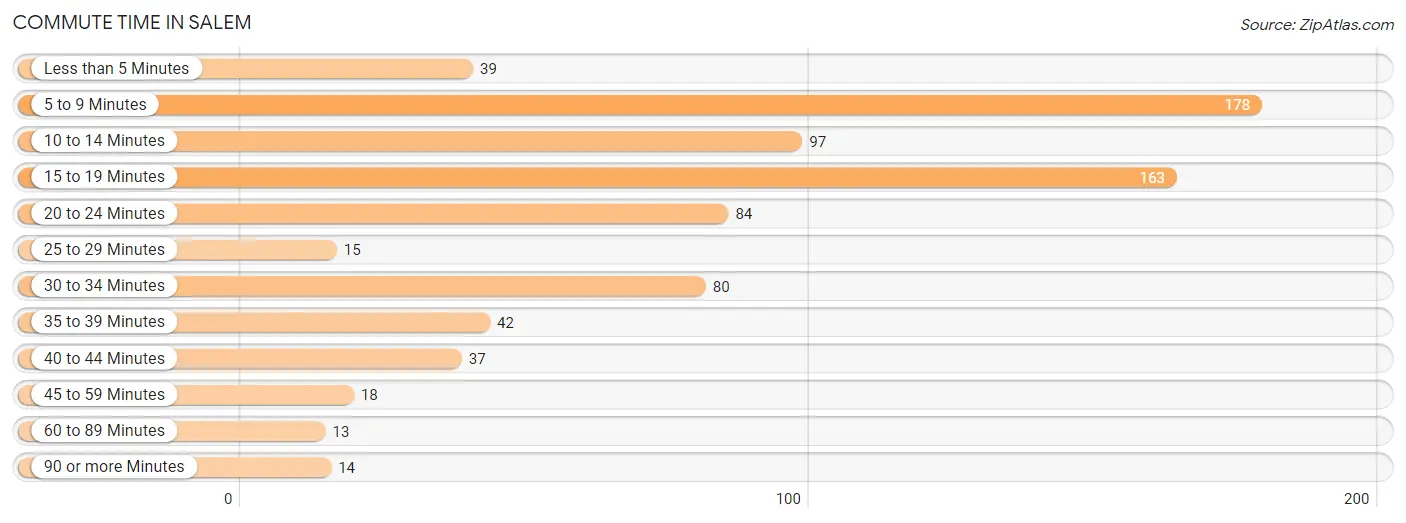
| Commute Time | # Commuters | % Commuters |
| Less than 5 Minutes | 39 | 5.0% |
| 5 to 9 Minutes | 178 | 22.8% |
| 10 to 14 Minutes | 97 | 12.4% |
| 15 to 19 Minutes | 163 | 20.9% |
| 20 to 24 Minutes | 84 | 10.8% |
| 25 to 29 Minutes | 15 | 1.9% |
| 30 to 34 Minutes | 80 | 10.3% |
| 35 to 39 Minutes | 42 | 5.4% |
| 40 to 44 Minutes | 37 | 4.7% |
| 45 to 59 Minutes | 18 | 2.3% |
| 60 to 89 Minutes | 13 | 1.7% |
| 90 or more Minutes | 14 | 1.8% |
Commute Time by Sex in Salem
The most common commute times in Salem are 15 to 19 minutes (163 commuters, 36.5%) for males and 10 to 14 minutes (72 commuters, 21.6%) for females.
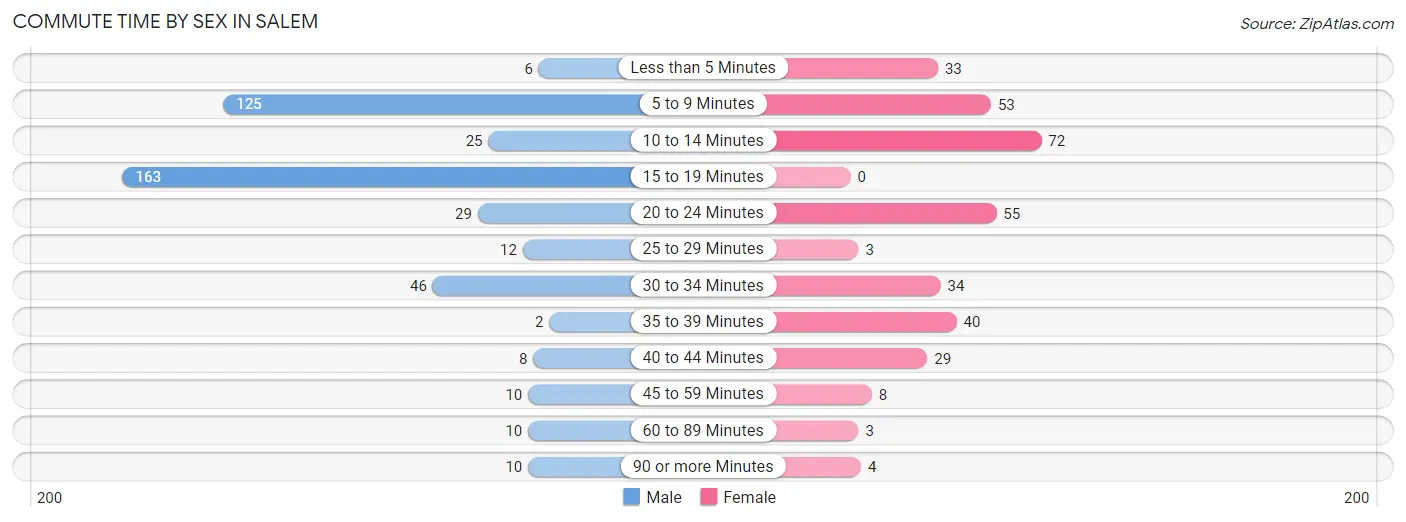
| Commute Time | Male | Female |
| Less than 5 Minutes | 6 (1.3%) | 33 (9.9%) |
| 5 to 9 Minutes | 125 (28.0%) | 53 (15.9%) |
| 10 to 14 Minutes | 25 (5.6%) | 72 (21.6%) |
| 15 to 19 Minutes | 163 (36.5%) | 0 (0.0%) |
| 20 to 24 Minutes | 29 (6.5%) | 55 (16.5%) |
| 25 to 29 Minutes | 12 (2.7%) | 3 (0.9%) |
| 30 to 34 Minutes | 46 (10.3%) | 34 (10.2%) |
| 35 to 39 Minutes | 2 (0.4%) | 40 (12.0%) |
| 40 to 44 Minutes | 8 (1.8%) | 29 (8.7%) |
| 45 to 59 Minutes | 10 (2.2%) | 8 (2.4%) |
| 60 to 89 Minutes | 10 (2.2%) | 3 (0.9%) |
| 90 or more Minutes | 10 (2.2%) | 4 (1.2%) |
Time of Departure to Work by Sex in Salem
The most frequent times of departure to work in Salem are 4:00 PM to 11:59 PM (129, 28.9%) for males and 7:00 AM to 7:29 AM (75, 22.5%) for females.
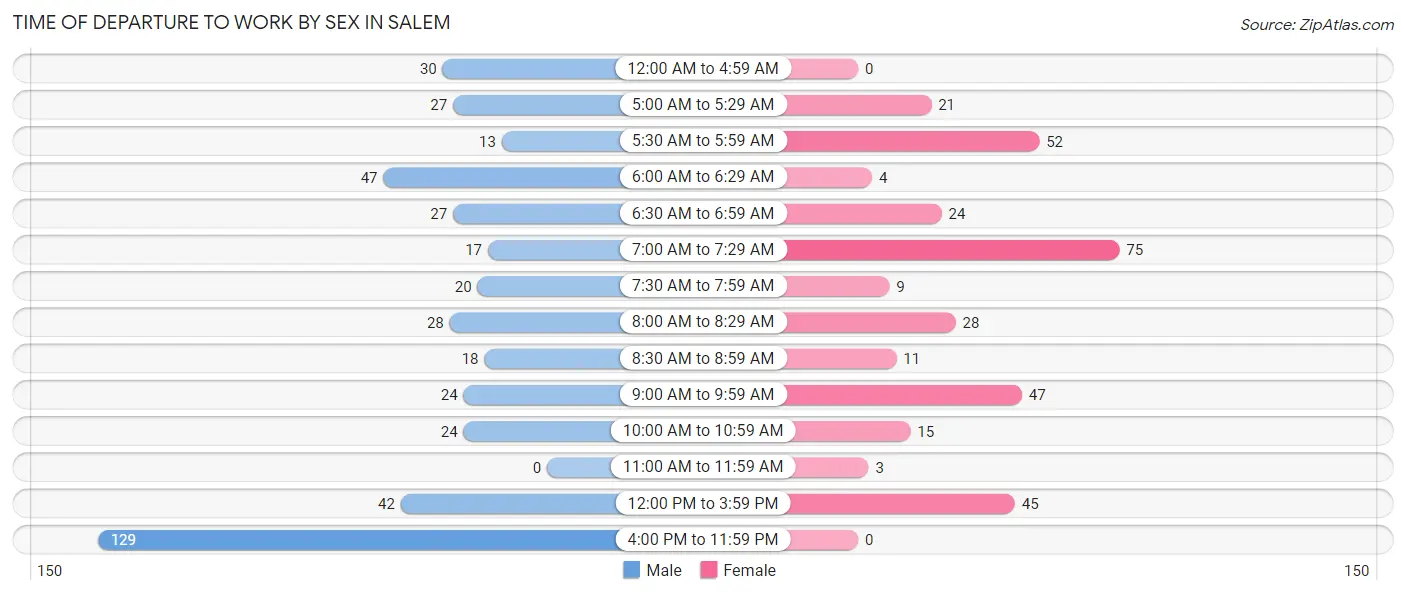
| Time of Departure | Male | Female |
| 12:00 AM to 4:59 AM | 30 (6.7%) | 0 (0.0%) |
| 5:00 AM to 5:29 AM | 27 (6.0%) | 21 (6.3%) |
| 5:30 AM to 5:59 AM | 13 (2.9%) | 52 (15.6%) |
| 6:00 AM to 6:29 AM | 47 (10.5%) | 4 (1.2%) |
| 6:30 AM to 6:59 AM | 27 (6.0%) | 24 (7.2%) |
| 7:00 AM to 7:29 AM | 17 (3.8%) | 75 (22.5%) |
| 7:30 AM to 7:59 AM | 20 (4.5%) | 9 (2.7%) |
| 8:00 AM to 8:29 AM | 28 (6.3%) | 28 (8.4%) |
| 8:30 AM to 8:59 AM | 18 (4.0%) | 11 (3.3%) |
| 9:00 AM to 9:59 AM | 24 (5.4%) | 47 (14.1%) |
| 10:00 AM to 10:59 AM | 24 (5.4%) | 15 (4.5%) |
| 11:00 AM to 11:59 AM | 0 (0.0%) | 3 (0.9%) |
| 12:00 PM to 3:59 PM | 42 (9.4%) | 45 (13.5%) |
| 4:00 PM to 11:59 PM | 129 (28.9%) | 0 (0.0%) |
| Total | 446 (100.0%) | 334 (100.0%) |
Housing Occupancy in Salem
Occupancy by Ownership in Salem
Of the total 599 dwellings in Salem, owner-occupied units account for 434 (72.5%), while renter-occupied units make up 165 (27.6%).
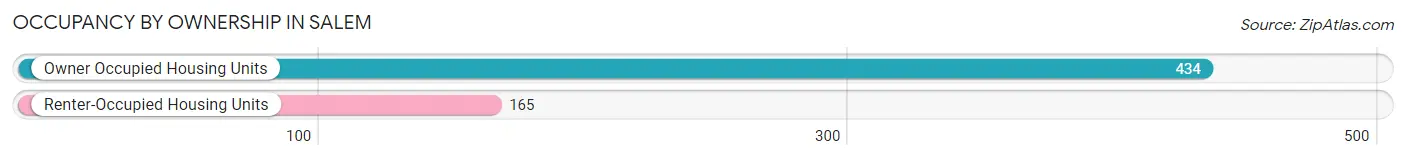
| Occupancy | # Housing Units | % Housing Units |
| Owner Occupied Housing Units | 434 | 72.5% |
| Renter-Occupied Housing Units | 165 | 27.6% |
| Total Occupied Housing Units | 599 | 100.0% |
Occupancy by Household Size in Salem
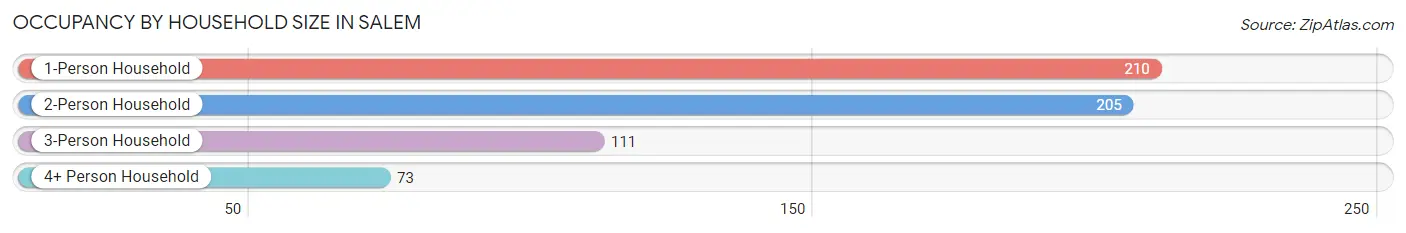
| Household Size | # Housing Units | % Housing Units |
| 1-Person Household | 210 | 35.1% |
| 2-Person Household | 205 | 34.2% |
| 3-Person Household | 111 | 18.5% |
| 4+ Person Household | 73 | 12.2% |
| Total Housing Units | 599 | 100.0% |
Occupancy by Ownership by Household Size in Salem
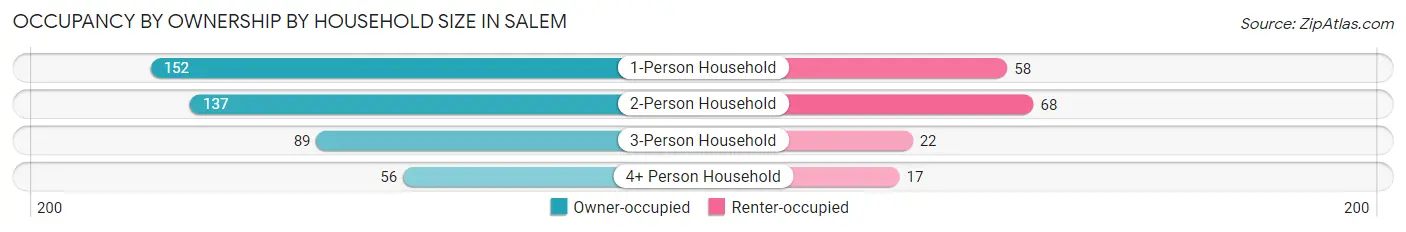
| Household Size | Owner-occupied | Renter-occupied |
| 1-Person Household | 152 (72.4%) | 58 (27.6%) |
| 2-Person Household | 137 (66.8%) | 68 (33.2%) |
| 3-Person Household | 89 (80.2%) | 22 (19.8%) |
| 4+ Person Household | 56 (76.7%) | 17 (23.3%) |
| Total Housing Units | 434 (72.5%) | 165 (27.6%) |
Occupancy by Educational Attainment in Salem
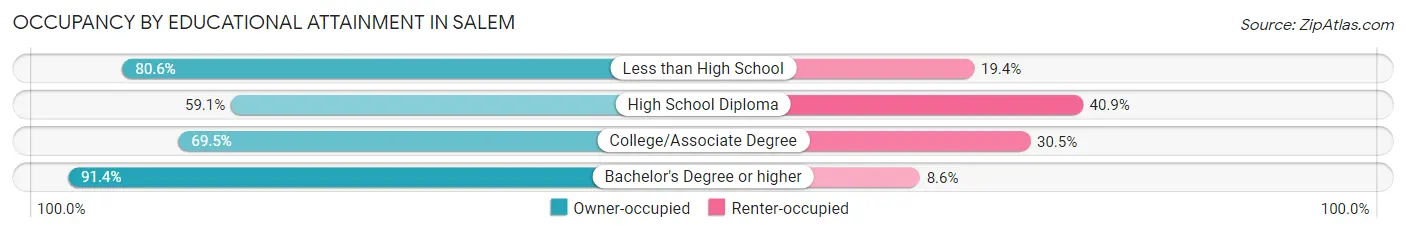
| Household Size | Owner-occupied | Renter-occupied |
| Less than High School | 54 (80.6%) | 13 (19.4%) |
| High School Diploma | 114 (59.1%) | 79 (40.9%) |
| College/Associate Degree | 139 (69.5%) | 61 (30.5%) |
| Bachelor's Degree or higher | 127 (91.4%) | 12 (8.6%) |
Occupancy by Age of Householder in Salem
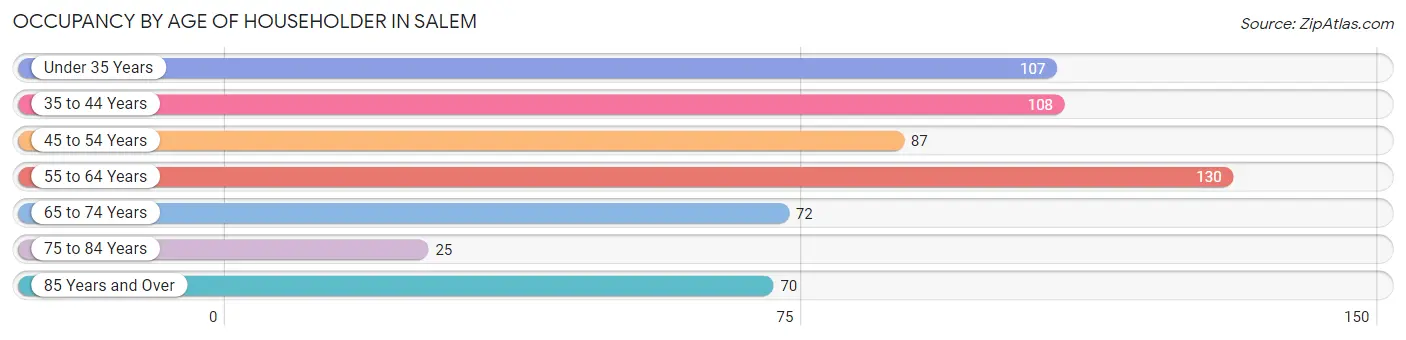
| Age Bracket | # Households | % Households |
| Under 35 Years | 107 | 17.9% |
| 35 to 44 Years | 108 | 18.0% |
| 45 to 54 Years | 87 | 14.5% |
| 55 to 64 Years | 130 | 21.7% |
| 65 to 74 Years | 72 | 12.0% |
| 75 to 84 Years | 25 | 4.2% |
| 85 Years and Over | 70 | 11.7% |
| Total | 599 | 100.0% |
Housing Finances in Salem
Median Income by Occupancy in Salem
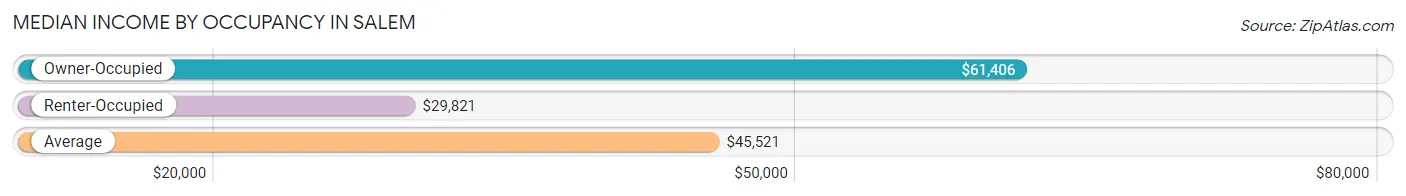
| Occupancy Type | # Households | Median Income |
| Owner-Occupied | 434 (72.5%) | $61,406 |
| Renter-Occupied | 165 (27.6%) | $29,821 |
| Average | 599 (100.0%) | $45,521 |
Occupancy by Householder Income Bracket in Salem
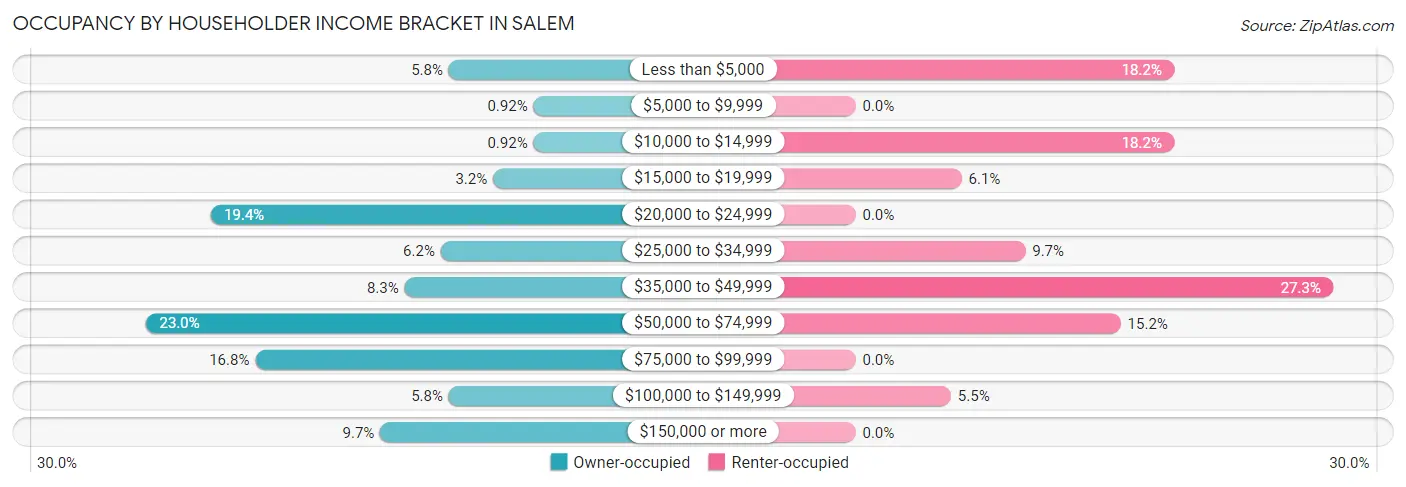
| Income Bracket | Owner-occupied | Renter-occupied |
| Less than $5,000 | 25 (5.8%) | 30 (18.2%) |
| $5,000 to $9,999 | 4 (0.9%) | 0 (0.0%) |
| $10,000 to $14,999 | 4 (0.9%) | 30 (18.2%) |
| $15,000 to $19,999 | 14 (3.2%) | 10 (6.1%) |
| $20,000 to $24,999 | 84 (19.4%) | 0 (0.0%) |
| $25,000 to $34,999 | 27 (6.2%) | 16 (9.7%) |
| $35,000 to $49,999 | 36 (8.3%) | 45 (27.3%) |
| $50,000 to $74,999 | 100 (23.0%) | 25 (15.1%) |
| $75,000 to $99,999 | 73 (16.8%) | 0 (0.0%) |
| $100,000 to $149,999 | 25 (5.8%) | 9 (5.4%) |
| $150,000 or more | 42 (9.7%) | 0 (0.0%) |
| Total | 434 (100.0%) | 165 (100.0%) |
Monthly Housing Cost Tiers in Salem
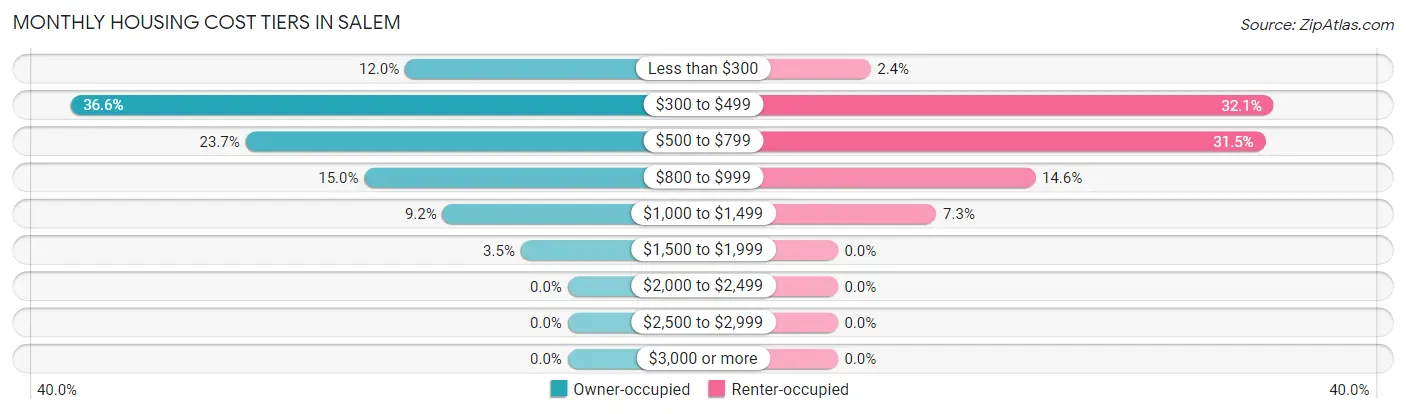
| Monthly Cost | Owner-occupied | Renter-occupied |
| Less than $300 | 52 (12.0%) | 4 (2.4%) |
| $300 to $499 | 159 (36.6%) | 53 (32.1%) |
| $500 to $799 | 103 (23.7%) | 52 (31.5%) |
| $800 to $999 | 65 (15.0%) | 24 (14.5%) |
| $1,000 to $1,499 | 40 (9.2%) | 12 (7.3%) |
| $1,500 to $1,999 | 15 (3.5%) | 0 (0.0%) |
| $2,000 to $2,499 | 0 (0.0%) | 0 (0.0%) |
| $2,500 to $2,999 | 0 (0.0%) | 0 (0.0%) |
| $3,000 or more | 0 (0.0%) | 0 (0.0%) |
| Total | 434 (100.0%) | 165 (100.0%) |
Physical Housing Characteristics in Salem
Housing Structures in Salem
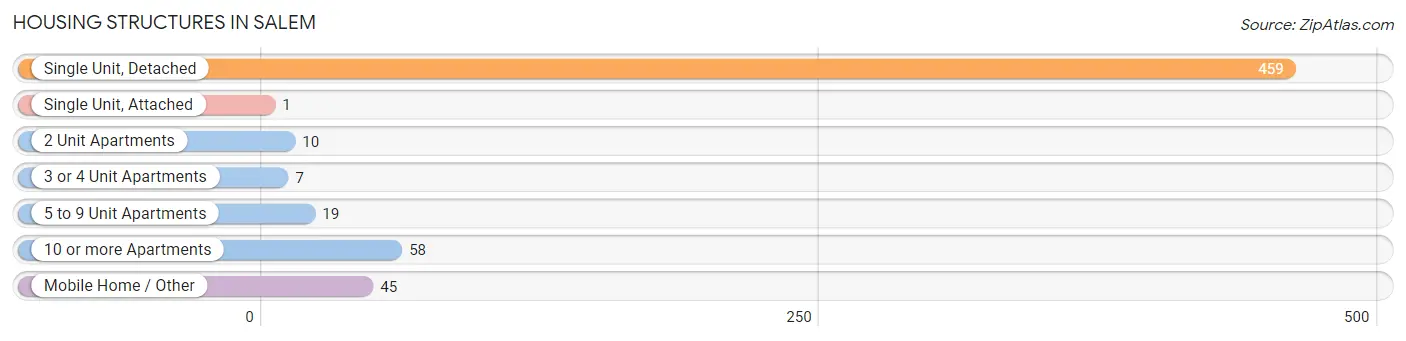
| Structure Type | # Housing Units | % Housing Units |
| Single Unit, Detached | 459 | 76.6% |
| Single Unit, Attached | 1 | 0.2% |
| 2 Unit Apartments | 10 | 1.7% |
| 3 or 4 Unit Apartments | 7 | 1.2% |
| 5 to 9 Unit Apartments | 19 | 3.2% |
| 10 or more Apartments | 58 | 9.7% |
| Mobile Home / Other | 45 | 7.5% |
| Total | 599 | 100.0% |
Housing Structures by Occupancy in Salem
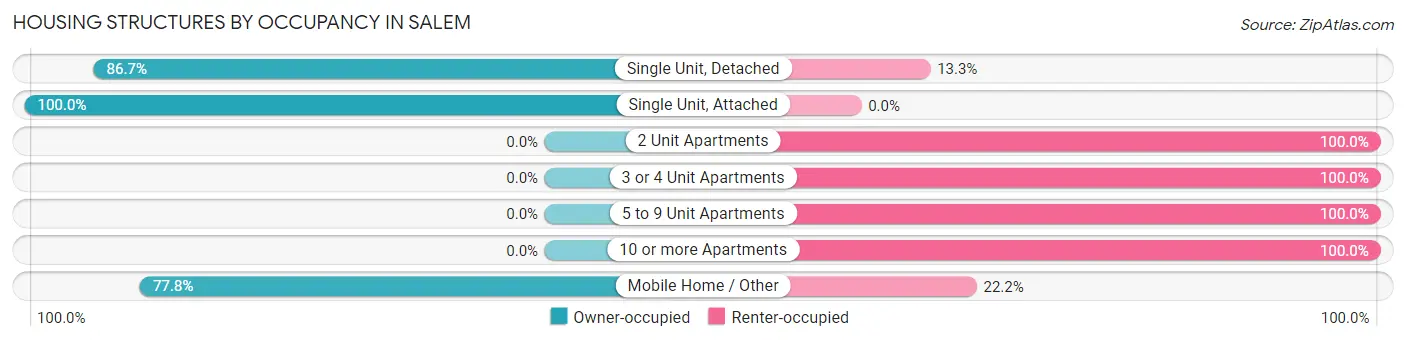
| Structure Type | Owner-occupied | Renter-occupied |
| Single Unit, Detached | 398 (86.7%) | 61 (13.3%) |
| Single Unit, Attached | 1 (100.0%) | 0 (0.0%) |
| 2 Unit Apartments | 0 (0.0%) | 10 (100.0%) |
| 3 or 4 Unit Apartments | 0 (0.0%) | 7 (100.0%) |
| 5 to 9 Unit Apartments | 0 (0.0%) | 19 (100.0%) |
| 10 or more Apartments | 0 (0.0%) | 58 (100.0%) |
| Mobile Home / Other | 35 (77.8%) | 10 (22.2%) |
| Total | 434 (72.5%) | 165 (27.6%) |
Housing Structures by Number of Rooms in Salem
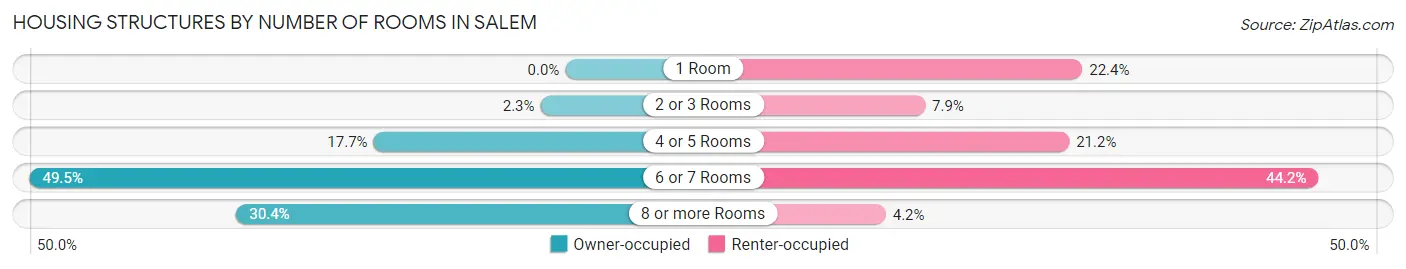
| Number of Rooms | Owner-occupied | Renter-occupied |
| 1 Room | 0 (0.0%) | 37 (22.4%) |
| 2 or 3 Rooms | 10 (2.3%) | 13 (7.9%) |
| 4 or 5 Rooms | 77 (17.7%) | 35 (21.2%) |
| 6 or 7 Rooms | 215 (49.5%) | 73 (44.2%) |
| 8 or more Rooms | 132 (30.4%) | 7 (4.2%) |
| Total | 434 (100.0%) | 165 (100.0%) |
Housing Structure by Heating Type in Salem
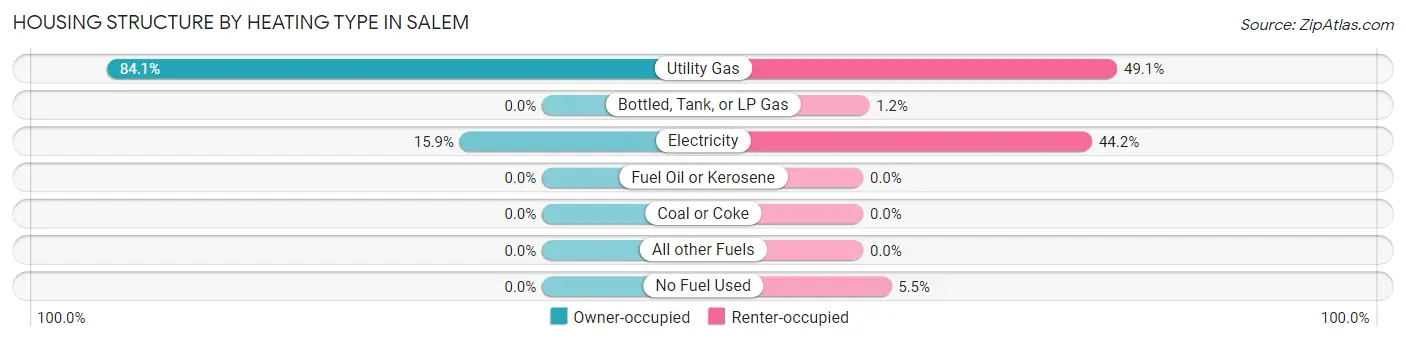
| Heating Type | Owner-occupied | Renter-occupied |
| Utility Gas | 365 (84.1%) | 81 (49.1%) |
| Bottled, Tank, or LP Gas | 0 (0.0%) | 2 (1.2%) |
| Electricity | 69 (15.9%) | 73 (44.2%) |
| Fuel Oil or Kerosene | 0 (0.0%) | 0 (0.0%) |
| Coal or Coke | 0 (0.0%) | 0 (0.0%) |
| All other Fuels | 0 (0.0%) | 0 (0.0%) |
| No Fuel Used | 0 (0.0%) | 9 (5.4%) |
| Total | 434 (100.0%) | 165 (100.0%) |
Household Vehicle Usage in Salem
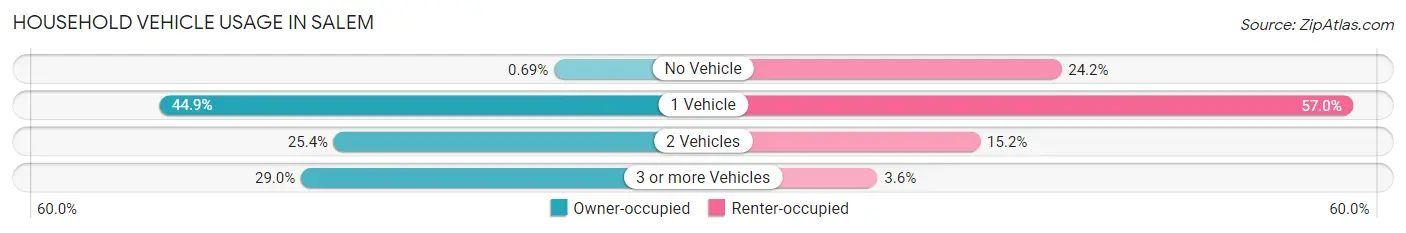
| Vehicles per Household | Owner-occupied | Renter-occupied |
| No Vehicle | 3 (0.7%) | 40 (24.2%) |
| 1 Vehicle | 195 (44.9%) | 94 (57.0%) |
| 2 Vehicles | 110 (25.4%) | 25 (15.1%) |
| 3 or more Vehicles | 126 (29.0%) | 6 (3.6%) |
| Total | 434 (100.0%) | 165 (100.0%) |
Real Estate & Mortgages in Salem
Real Estate and Mortgage Overview in Salem
| Characteristic | Without Mortgage | With Mortgage |
| Housing Units | 280 | 154 |
| Median Property Value | $39,500 | $94,500 |
| Median Household Income | - | - |
| Monthly Housing Costs | $355 | $0 |
| Real Estate Taxes | $329 | $0 |
Property Value by Mortgage Status in Salem
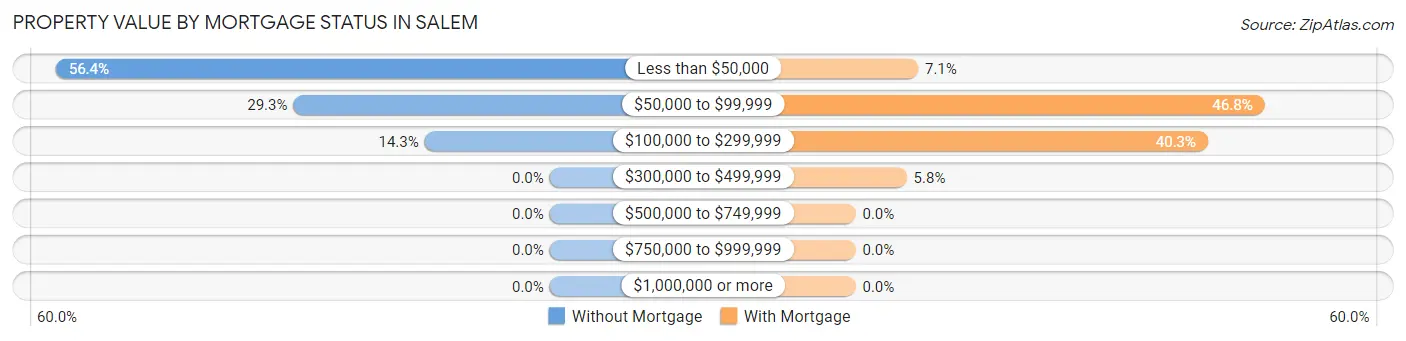
| Property Value | Without Mortgage | With Mortgage |
| Less than $50,000 | 158 (56.4%) | 11 (7.1%) |
| $50,000 to $99,999 | 82 (29.3%) | 72 (46.8%) |
| $100,000 to $299,999 | 40 (14.3%) | 62 (40.3%) |
| $300,000 to $499,999 | 0 (0.0%) | 9 (5.8%) |
| $500,000 to $749,999 | 0 (0.0%) | 0 (0.0%) |
| $750,000 to $999,999 | 0 (0.0%) | 0 (0.0%) |
| $1,000,000 or more | 0 (0.0%) | 0 (0.0%) |
| Total | 280 (100.0%) | 154 (100.0%) |
Household Income by Mortgage Status in Salem
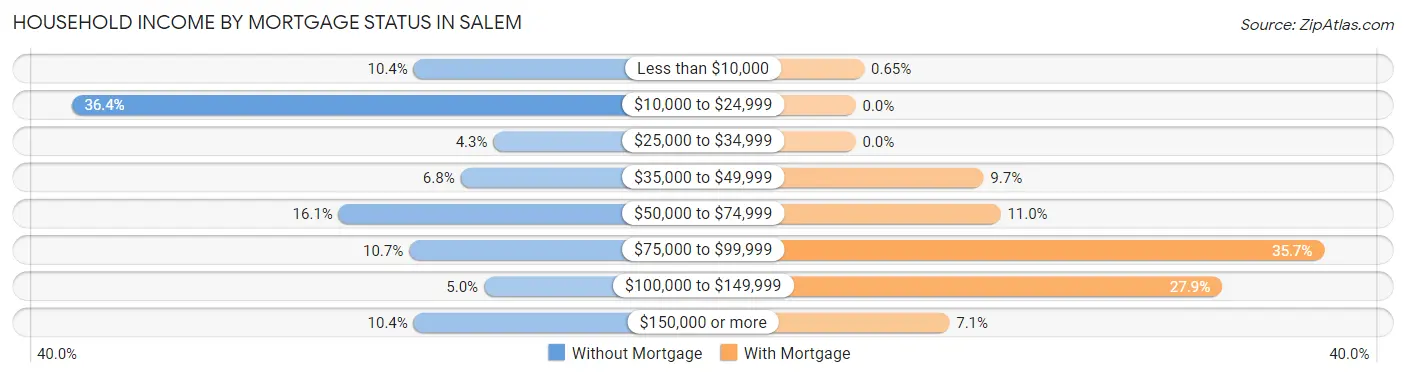
| Household Income | Without Mortgage | With Mortgage |
| Less than $10,000 | 29 (10.4%) | 1 (0.6%) |
| $10,000 to $24,999 | 102 (36.4%) | 0 (0.0%) |
| $25,000 to $34,999 | 12 (4.3%) | 0 (0.0%) |
| $35,000 to $49,999 | 19 (6.8%) | 15 (9.7%) |
| $50,000 to $74,999 | 45 (16.1%) | 17 (11.0%) |
| $75,000 to $99,999 | 30 (10.7%) | 55 (35.7%) |
| $100,000 to $149,999 | 14 (5.0%) | 43 (27.9%) |
| $150,000 or more | 29 (10.4%) | 11 (7.1%) |
| Total | 280 (100.0%) | 154 (100.0%) |
Property Value to Household Income Ratio in Salem
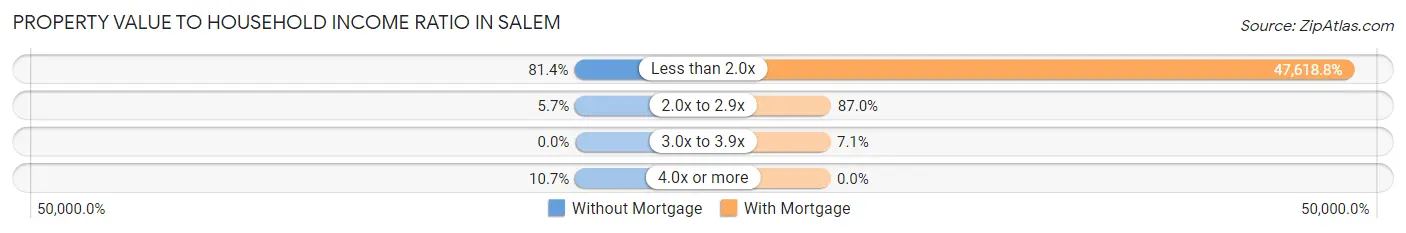
| Value-to-Income Ratio | Without Mortgage | With Mortgage |
| Less than 2.0x | 228 (81.4%) | 73,333 (47,618.8%) |
| 2.0x to 2.9x | 16 (5.7%) | 134 (87.0%) |
| 3.0x to 3.9x | 0 (0.0%) | 11 (7.1%) |
| 4.0x or more | 30 (10.7%) | 0 (0.0%) |
| Total | 280 (100.0%) | 154 (100.0%) |
Real Estate Taxes by Mortgage Status in Salem
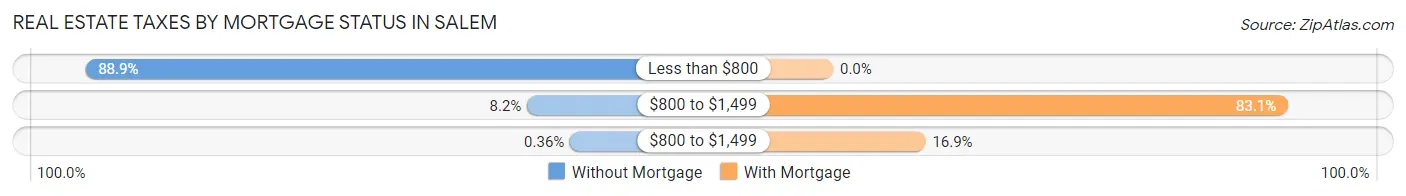
| Property Taxes | Without Mortgage | With Mortgage |
| Less than $800 | 249 (88.9%) | 0 (0.0%) |
| $800 to $1,499 | 23 (8.2%) | 128 (83.1%) |
| $800 to $1,499 | 1 (0.4%) | 26 (16.9%) |
| Total | 280 (100.0%) | 154 (100.0%) |
Health & Disability in Salem
Health Insurance Coverage by Age in Salem
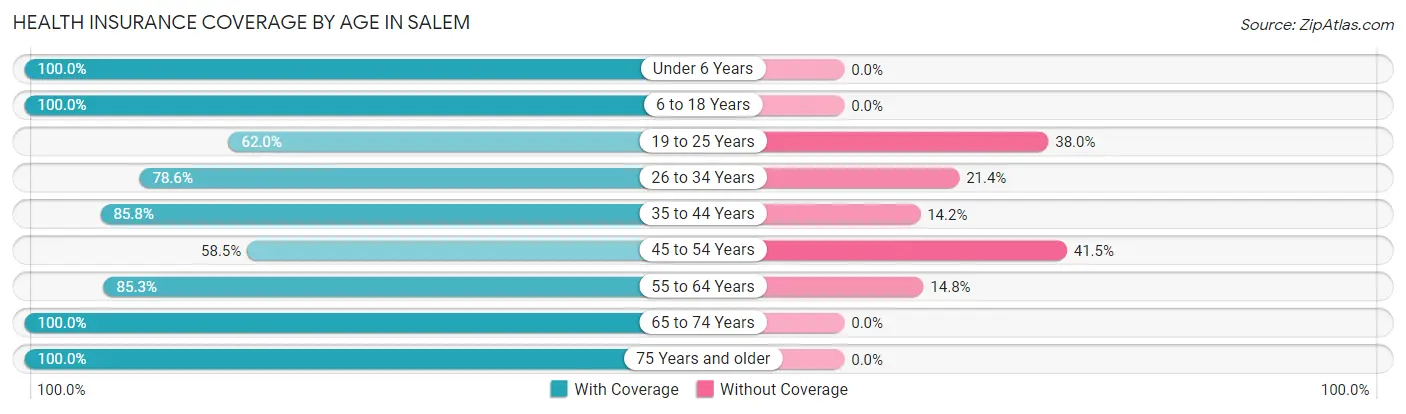
| Age Bracket | With Coverage | Without Coverage |
| Under 6 Years | 46 (100.0%) | 0 (0.0%) |
| 6 to 18 Years | 348 (100.0%) | 0 (0.0%) |
| 19 to 25 Years | 285 (62.0%) | 175 (38.0%) |
| 26 to 34 Years | 99 (78.6%) | 27 (21.4%) |
| 35 to 44 Years | 200 (85.8%) | 33 (14.2%) |
| 45 to 54 Years | 110 (58.5%) | 78 (41.5%) |
| 55 to 64 Years | 185 (85.3%) | 32 (14.7%) |
| 65 to 74 Years | 139 (100.0%) | 0 (0.0%) |
| 75 Years and older | 115 (100.0%) | 0 (0.0%) |
| Total | 1,527 (81.6%) | 345 (18.4%) |
Health Insurance Coverage by Citizenship Status in Salem
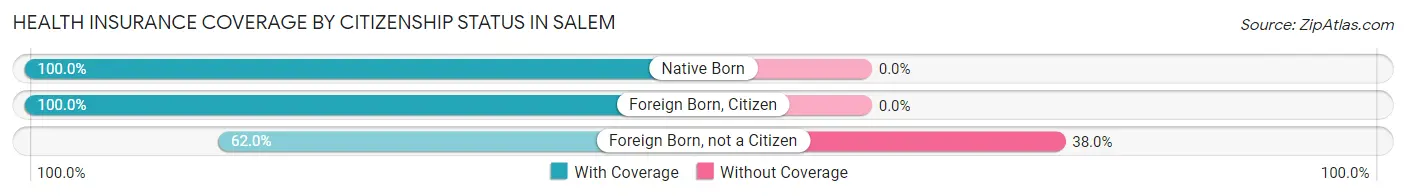
| Citizenship Status | With Coverage | Without Coverage |
| Native Born | 46 (100.0%) | 0 (0.0%) |
| Foreign Born, Citizen | 348 (100.0%) | 0 (0.0%) |
| Foreign Born, not a Citizen | 285 (62.0%) | 175 (38.0%) |
Health Insurance Coverage by Household Income in Salem
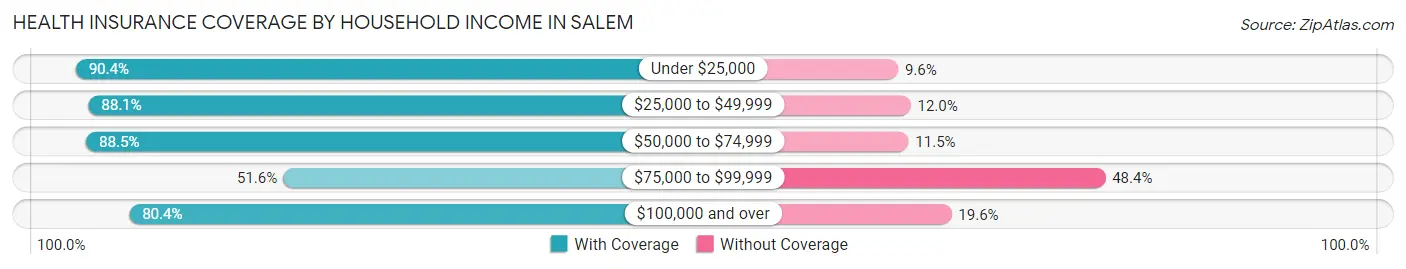
| Household Income | With Coverage | Without Coverage |
| Under $25,000 | 283 (90.4%) | 30 (9.6%) |
| $25,000 to $49,999 | 258 (88.0%) | 35 (11.9%) |
| $50,000 to $74,999 | 345 (88.5%) | 45 (11.5%) |
| $75,000 to $99,999 | 180 (51.6%) | 169 (48.4%) |
| $100,000 and over | 160 (80.4%) | 39 (19.6%) |
Public vs Private Health Insurance Coverage by Age in Salem
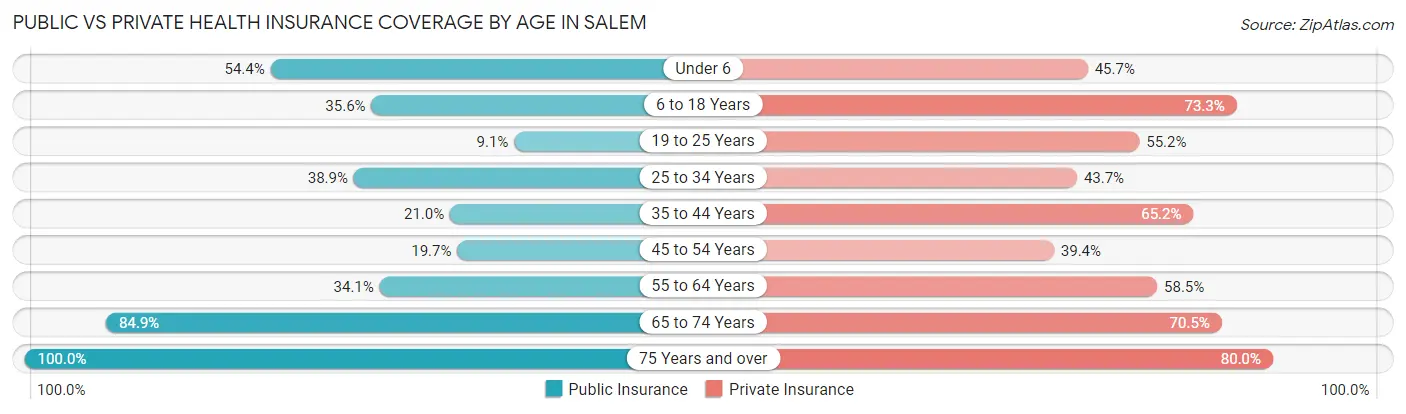
| Age Bracket | Public Insurance | Private Insurance |
| Under 6 | 25 (54.3%) | 21 (45.7%) |
| 6 to 18 Years | 124 (35.6%) | 255 (73.3%) |
| 19 to 25 Years | 42 (9.1%) | 254 (55.2%) |
| 25 to 34 Years | 49 (38.9%) | 55 (43.6%) |
| 35 to 44 Years | 49 (21.0%) | 152 (65.2%) |
| 45 to 54 Years | 37 (19.7%) | 74 (39.4%) |
| 55 to 64 Years | 74 (34.1%) | 127 (58.5%) |
| 65 to 74 Years | 118 (84.9%) | 98 (70.5%) |
| 75 Years and over | 115 (100.0%) | 92 (80.0%) |
| Total | 633 (33.8%) | 1,128 (60.3%) |
Disability Status by Sex by Age in Salem
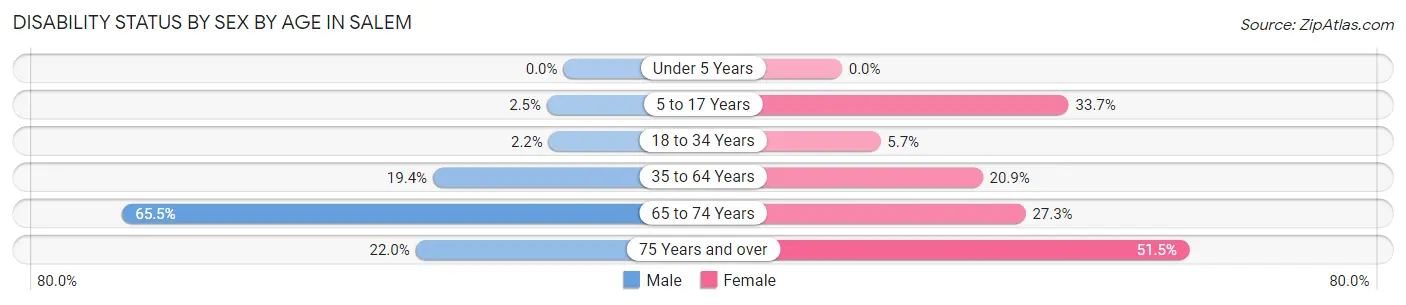
| Age Bracket | Male | Female |
| Under 5 Years | 0 (0.0%) | 0 (0.0%) |
| 5 to 17 Years | 4 (2.5%) | 32 (33.7%) |
| 18 to 34 Years | 10 (2.2%) | 13 (5.7%) |
| 35 to 64 Years | 55 (19.4%) | 74 (20.9%) |
| 65 to 74 Years | 55 (65.5%) | 15 (27.3%) |
| 75 Years and over | 18 (22.0%) | 17 (51.5%) |
Disability Class by Sex by Age in Salem
Disability Class: Hearing Difficulty
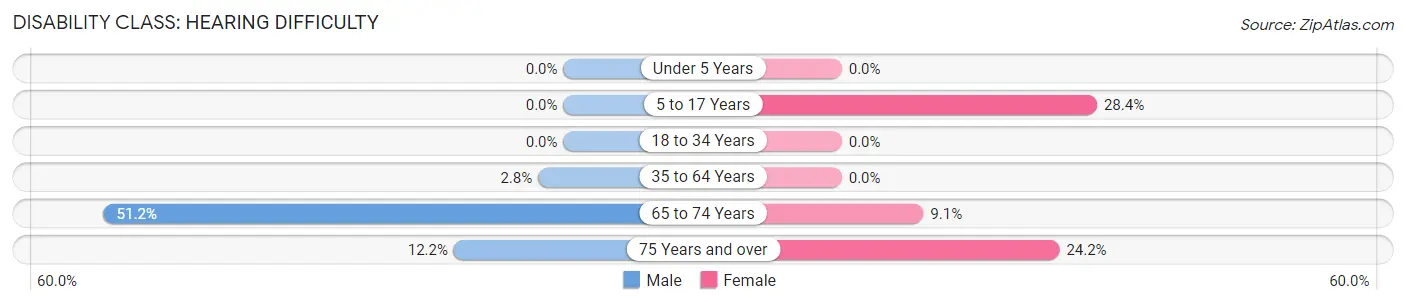
| Age Bracket | Male | Female |
| Under 5 Years | 0 (0.0%) | 0 (0.0%) |
| 5 to 17 Years | 0 (0.0%) | 27 (28.4%) |
| 18 to 34 Years | 0 (0.0%) | 0 (0.0%) |
| 35 to 64 Years | 8 (2.8%) | 0 (0.0%) |
| 65 to 74 Years | 43 (51.2%) | 5 (9.1%) |
| 75 Years and over | 10 (12.2%) | 8 (24.2%) |
Disability Class: Vision Difficulty
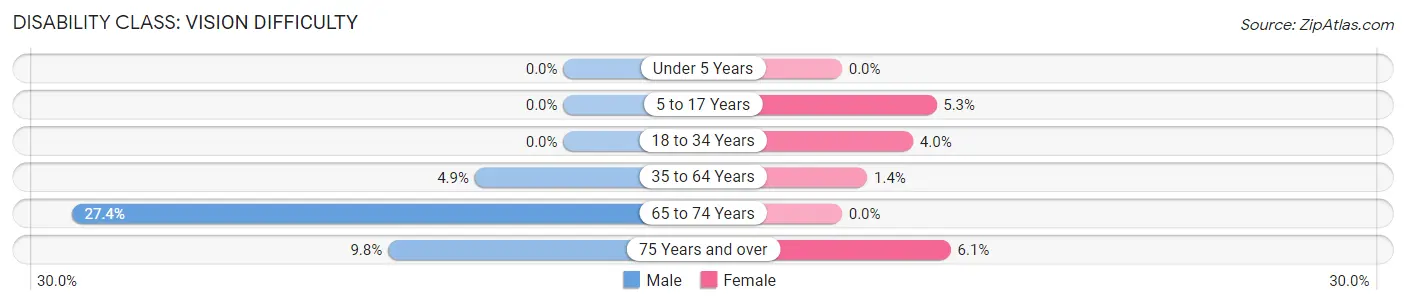
| Age Bracket | Male | Female |
| Under 5 Years | 0 (0.0%) | 0 (0.0%) |
| 5 to 17 Years | 0 (0.0%) | 5 (5.3%) |
| 18 to 34 Years | 0 (0.0%) | 9 (4.0%) |
| 35 to 64 Years | 14 (4.9%) | 5 (1.4%) |
| 65 to 74 Years | 23 (27.4%) | 0 (0.0%) |
| 75 Years and over | 8 (9.8%) | 2 (6.1%) |
Disability Class: Cognitive Difficulty
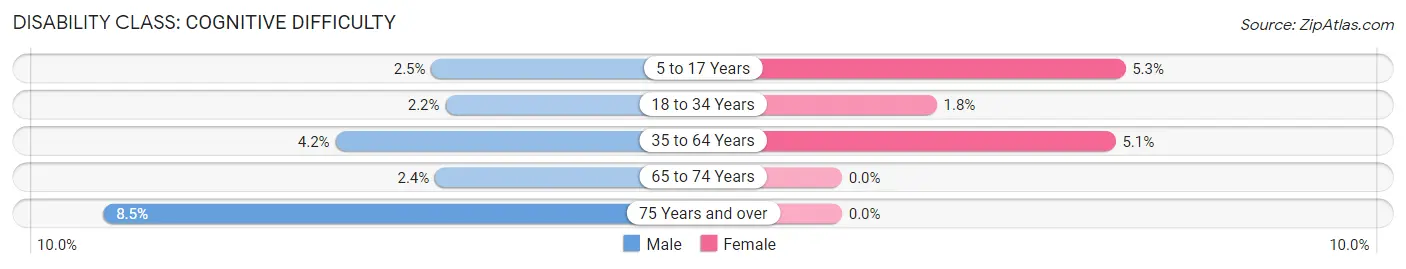
| Age Bracket | Male | Female |
| 5 to 17 Years | 4 (2.5%) | 5 (5.3%) |
| 18 to 34 Years | 10 (2.2%) | 4 (1.8%) |
| 35 to 64 Years | 12 (4.2%) | 18 (5.1%) |
| 65 to 74 Years | 2 (2.4%) | 0 (0.0%) |
| 75 Years and over | 7 (8.5%) | 0 (0.0%) |
Disability Class: Ambulatory Difficulty
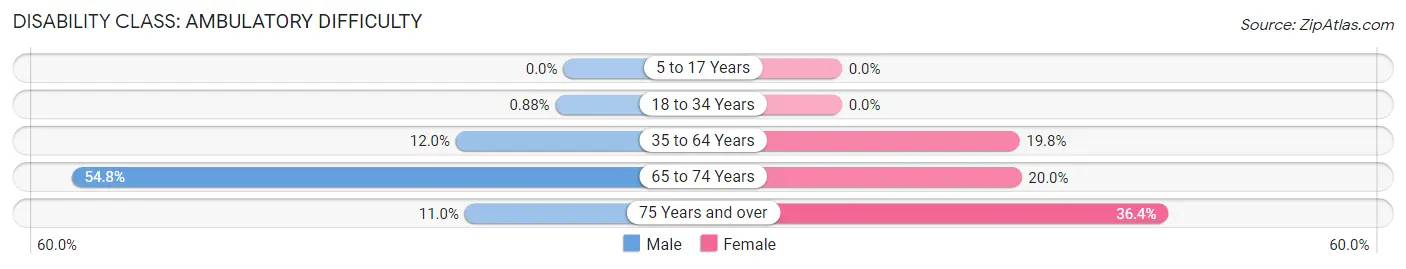
| Age Bracket | Male | Female |
| 5 to 17 Years | 0 (0.0%) | 0 (0.0%) |
| 18 to 34 Years | 4 (0.9%) | 0 (0.0%) |
| 35 to 64 Years | 34 (12.0%) | 70 (19.8%) |
| 65 to 74 Years | 46 (54.8%) | 11 (20.0%) |
| 75 Years and over | 9 (11.0%) | 12 (36.4%) |
Disability Class: Self-Care Difficulty
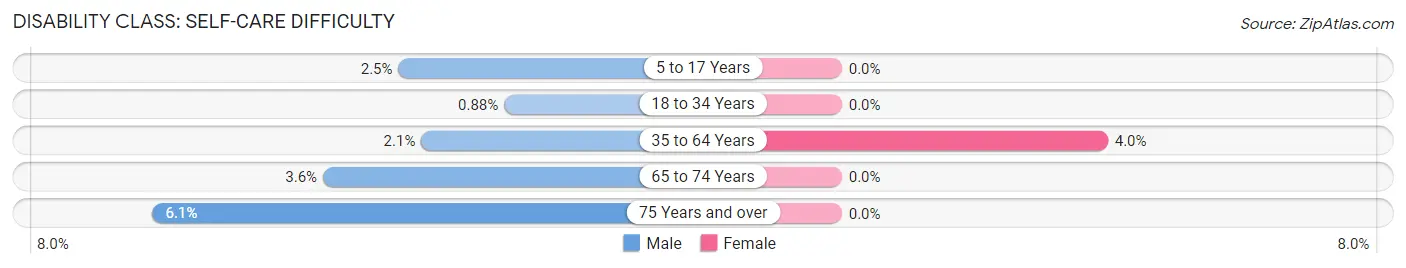
| Age Bracket | Male | Female |
| 5 to 17 Years | 4 (2.5%) | 0 (0.0%) |
| 18 to 34 Years | 4 (0.9%) | 0 (0.0%) |
| 35 to 64 Years | 6 (2.1%) | 14 (4.0%) |
| 65 to 74 Years | 3 (3.6%) | 0 (0.0%) |
| 75 Years and over | 5 (6.1%) | 0 (0.0%) |
Technology Access in Salem
Computing Device Access in Salem
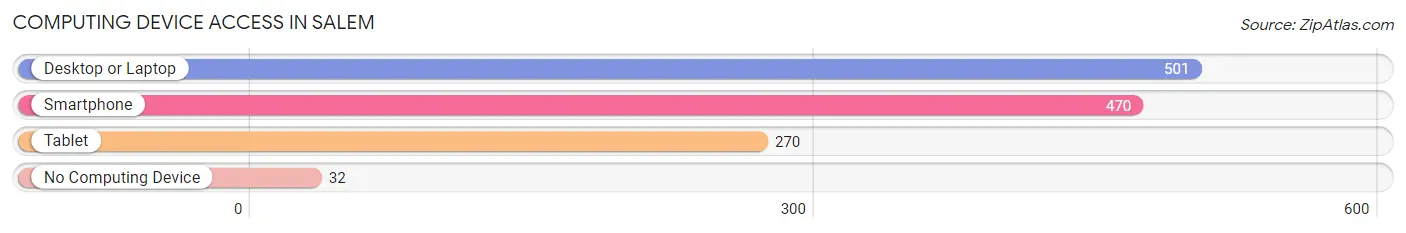
| Device Type | # Households | % Households |
| Desktop or Laptop | 501 | 83.6% |
| Smartphone | 470 | 78.5% |
| Tablet | 270 | 45.1% |
| No Computing Device | 32 | 5.3% |
| Total | 599 | 100.0% |
Internet Access in Salem
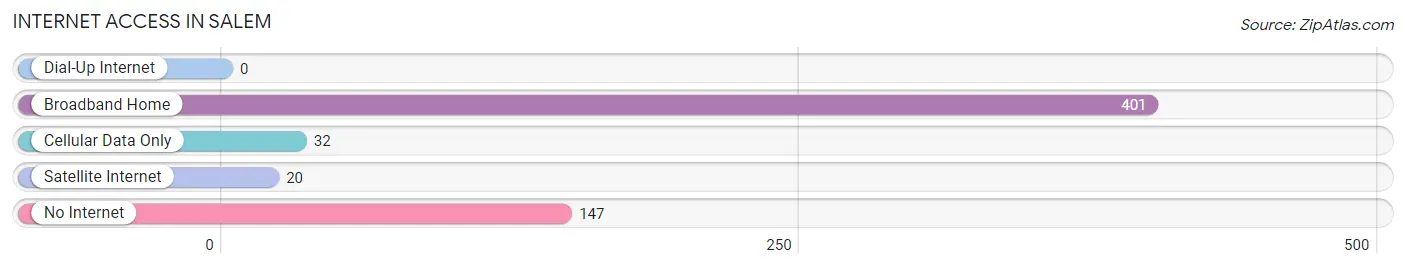
| Internet Type | # Households | % Households |
| Dial-Up Internet | 0 | 0.0% |
| Broadband Home | 401 | 66.9% |
| Cellular Data Only | 32 | 5.3% |
| Satellite Internet | 20 | 3.3% |
| No Internet | 147 | 24.5% |
| Total | 599 | 100.0% |
Salem Summary
Salem, West Virginia is a small city located in the northern part of the state, in Harrison County. It is situated along the West Fork River, and is part of the Clarksburg, WV Metropolitan Statistical Area. The city has a population of approximately 8,000 people, and is the county seat of Harrison County.
History
The area that is now Salem was first settled in 1790 by a group of settlers from Pennsylvania. The town was originally known as “Harrisonburg”, and was later renamed “Salem” in 1802. The name was chosen in honor of the biblical city of Salem. The town was officially incorporated in 1817, and was designated as the county seat of Harrison County in 1818.
In the early 19th century, Salem was a thriving agricultural community, with a variety of crops being grown in the area. The town was also home to several mills, including a grist mill, a saw mill, and a woolen mill. In the late 19th century, the town began to experience a period of industrial growth, with the establishment of several factories, including a glass factory, a brick factory, and a furniture factory.
Geography
Salem is located in the northern part of West Virginia, in Harrison County. The city is situated along the West Fork River, and is part of the Clarksburg, WV Metropolitan Statistical Area. The city has a total area of 2.3 square miles, all of which is land.
The city is located in the Appalachian Mountains, and is surrounded by rolling hills and forests. The climate in Salem is humid continental, with hot summers and cold winters. The average annual temperature is around 50 degrees Fahrenheit, and the average annual precipitation is around 40 inches.
Economy
The economy of Salem is largely based on manufacturing and services. The city is home to several factories, including a glass factory, a brick factory, and a furniture factory. The city is also home to several retail stores, restaurants, and other businesses.
The city is also home to several educational institutions, including Salem International University, Salem College, and Salem High School. The city is also home to several medical facilities, including Salem Regional Medical Center and Salem Veterans Affairs Medical Center.
Demographics
As of the 2010 census, the population of Salem was 8,094. The racial makeup of the city was 95.3% White, 1.7% African American, 0.3% Native American, 0.5% Asian, 0.1% Pacific Islander, 0.7% from other races, and 1.4% from two or more races. Hispanic or Latino of any race were 1.9% of the population.
The median income for a household in the city was $30,938, and the median income for a family was $37,917. The per capita income for the city was $17,845. About 16.2% of families and 19.2% of the population were below the poverty line, including 28.2% of those under age 18 and 11.2% of those age 65 or over.
Common Questions
What is Per Capita Income in Salem?
Per Capita income in Salem is $20,236.
What is the Median Family Income in Salem?
Median Family Income in Salem is $60,096.
What is the Median Household income in Salem?
Median Household Income in Salem is $45,521.
What is Income or Wage Gap in Salem?
Income or Wage Gap in Salem is 0.1%.
Women in Salem earn 99.9 cents for every dollar earned by a man.
What is Inequality or Gini Index in Salem?
Inequality or Gini Index in Salem is 0.45.
What is the Total Population of Salem?
Total Population of Salem is 1,873.
What is the Total Male Population of Salem?
Total Male Population of Salem is 1,097.
What is the Total Female Population of Salem?
Total Female Population of Salem is 776.
What is the Ratio of Males per 100 Females in Salem?
There are 141.37 Males per 100 Females in Salem.
What is the Ratio of Females per 100 Males in Salem?
There are 70.74 Females per 100 Males in Salem.
What is the Median Population Age in Salem?
Median Population Age in Salem is 30.7 Years.
What is the Average Family Size in Salem
Average Family Size in Salem is 3.2 People.
What is the Average Household Size in Salem
Average Household Size in Salem is 2.6 People.
How Large is the Labor Force in Salem?
There are 864 People in the Labor Forcein in Salem.
What is the Percentage of People in the Labor Force in Salem?
51.7% of People are in the Labor Force in Salem.
What is the Unemployment Rate in Salem?
Unemployment Rate in Salem is 4.0%.