Crab Orchard, WV Map & Demographics
Crab Orchard Map
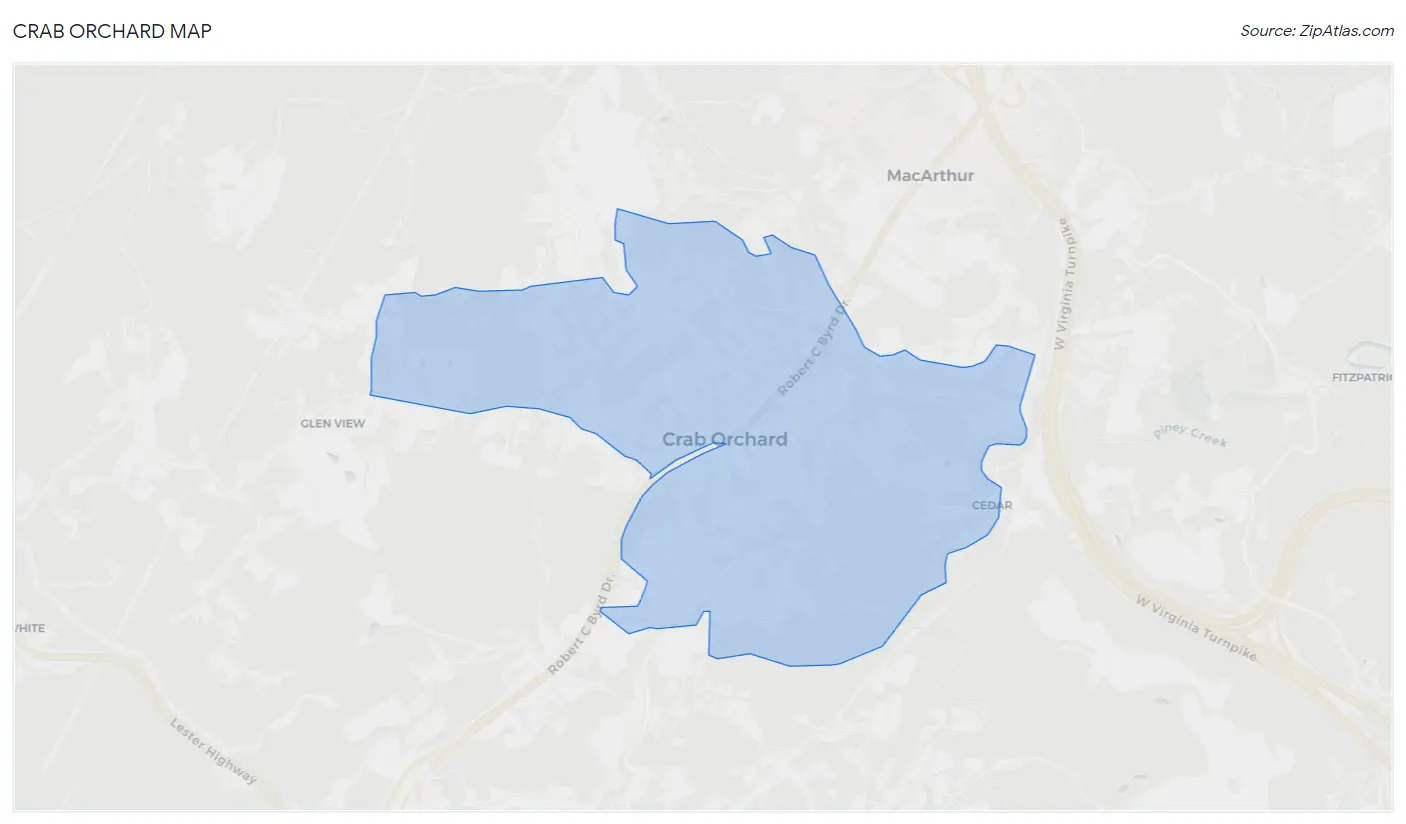
Crab Orchard Overview
$25,545
PER CAPITA INCOME
$76,492
AVG FAMILY INCOME
$48,438
AVG HOUSEHOLD INCOME
1.0%
WAGE / INCOME GAP [ % ]
99.0¢/ $1
WAGE / INCOME GAP [ $ ]
0.42
INEQUALITY / GINI INDEX
1,946
TOTAL POPULATION
813
MALE POPULATION
1,133
FEMALE POPULATION
71.76
MALES / 100 FEMALES
139.36
FEMALES / 100 MALES
39.9
MEDIAN AGE
3.6
AVG FAMILY SIZE
2.5
AVG HOUSEHOLD SIZE
868
LABOR FORCE [ PEOPLE ]
52.0%
PERCENT IN LABOR FORCE
23.3%
UNEMPLOYMENT RATE
Crab Orchard Zip Codes
Income in Crab Orchard
Income Overview in Crab Orchard
Per Capita Income in Crab Orchard is $25,545, while median incomes of families and households are $76,492 and $48,438 respectively.
| Characteristic | Number | Measure |
| Per Capita Income | 1,946 | $25,545 |
| Median Family Income | 358 | $76,492 |
| Mean Family Income | 358 | $82,843 |
| Median Household Income | 782 | $48,438 |
| Mean Household Income | 782 | $57,429 |
| Income Deficit | 358 | $0 |
| Wage / Income Gap (%) | 1,946 | 0.98% |
| Wage / Income Gap ($) | 1,946 | 99.02¢ per $1 |
| Gini / Inequality Index | 1,946 | 0.42 |
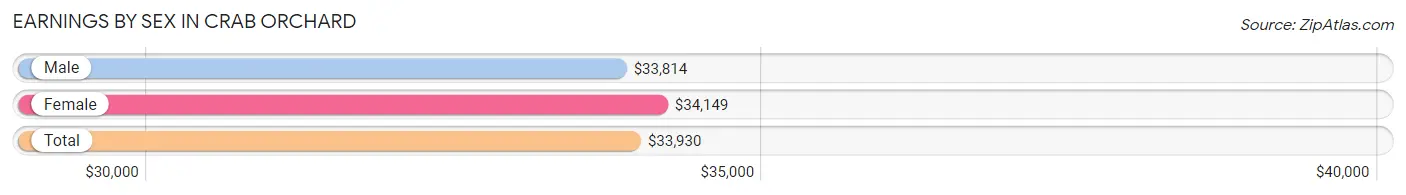
Earnings by Sex in Crab Orchard
Average Earnings in Crab Orchard are $33,930, $33,814 for men and $34,149 for women, a difference of 1.0%.
| Sex | Number | Average Earnings |
| Male | 377 (45.1%) | $33,814 |
| Female | 459 (54.9%) | $34,149 |
| Total | 836 (100.0%) | $33,930 |
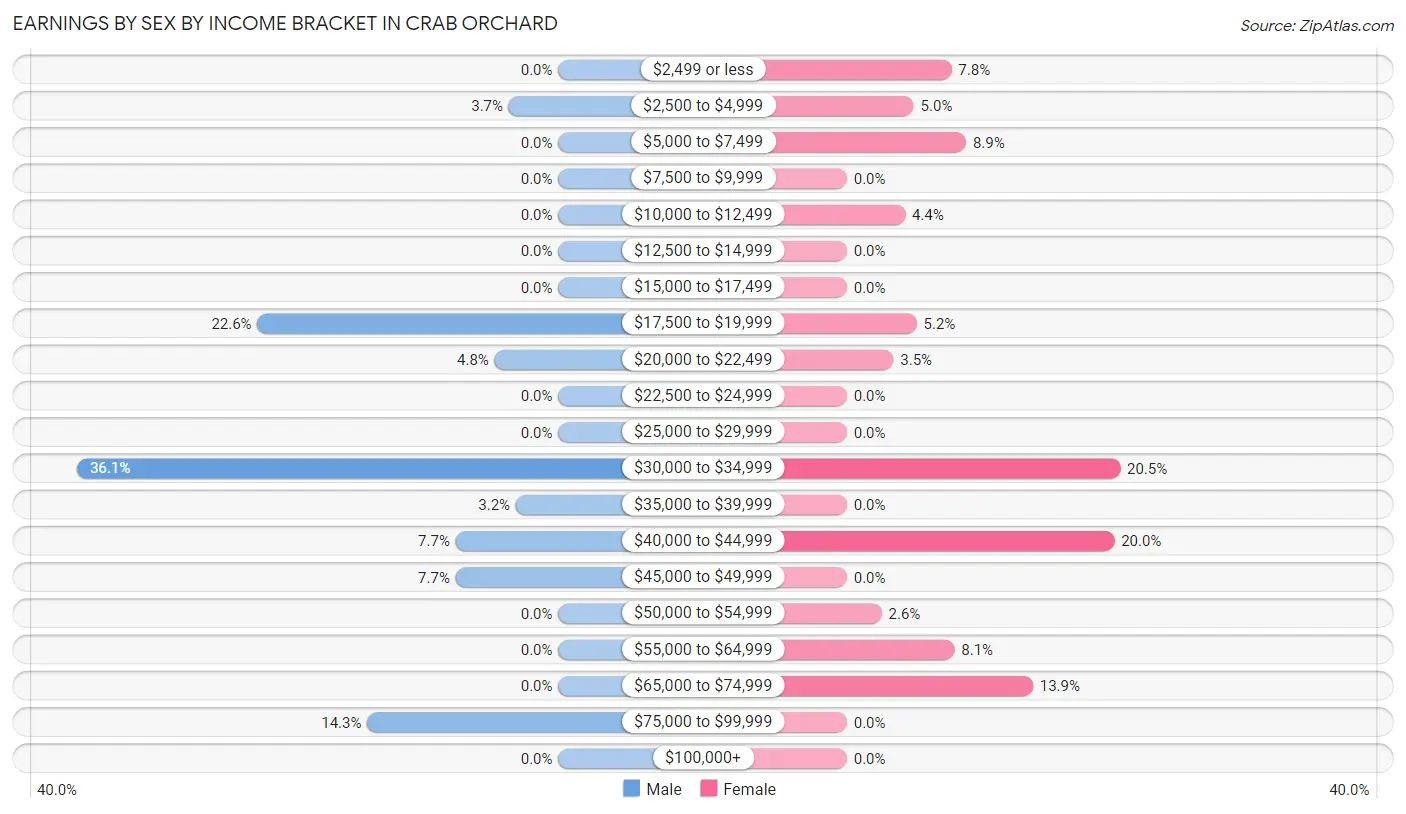
Earnings by Sex by Income Bracket in Crab Orchard
The most common earnings brackets in Crab Orchard are $30,000 to $34,999 for men (136 | 36.1%) and $30,000 to $34,999 for women (94 | 20.5%).
| Income | Male | Female |
| $2,499 or less | 0 (0.0%) | 36 (7.8%) |
| $2,500 to $4,999 | 14 (3.7%) | 23 (5.0%) |
| $5,000 to $7,499 | 0 (0.0%) | 41 (8.9%) |
| $7,500 to $9,999 | 0 (0.0%) | 0 (0.0%) |
| $10,000 to $12,499 | 0 (0.0%) | 20 (4.4%) |
| $12,500 to $14,999 | 0 (0.0%) | 0 (0.0%) |
| $15,000 to $17,499 | 0 (0.0%) | 0 (0.0%) |
| $17,500 to $19,999 | 85 (22.6%) | 24 (5.2%) |
| $20,000 to $22,499 | 18 (4.8%) | 16 (3.5%) |
| $22,500 to $24,999 | 0 (0.0%) | 0 (0.0%) |
| $25,000 to $29,999 | 0 (0.0%) | 0 (0.0%) |
| $30,000 to $34,999 | 136 (36.1%) | 94 (20.5%) |
| $35,000 to $39,999 | 12 (3.2%) | 0 (0.0%) |
| $40,000 to $44,999 | 29 (7.7%) | 92 (20.0%) |
| $45,000 to $49,999 | 29 (7.7%) | 0 (0.0%) |
| $50,000 to $54,999 | 0 (0.0%) | 12 (2.6%) |
| $55,000 to $64,999 | 0 (0.0%) | 37 (8.1%) |
| $65,000 to $74,999 | 0 (0.0%) | 64 (13.9%) |
| $75,000 to $99,999 | 54 (14.3%) | 0 (0.0%) |
| $100,000+ | 0 (0.0%) | 0 (0.0%) |
| Total | 377 (100.0%) | 459 (100.0%) |
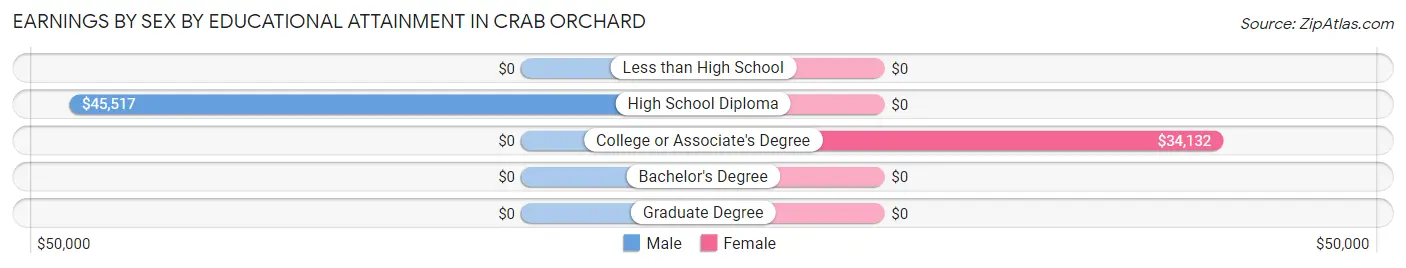
Earnings by Sex by Educational Attainment in Crab Orchard
Average earnings in Crab Orchard are $34,761 for men and $34,149 for women, a difference of 1.8%. Men with an educational attainment of high school diploma enjoy the highest average annual earnings of $45,517, while those with high school diploma education earn the least with $45,517. Women with an educational attainment of college or associate's degree earn the most with the average annual earnings of $34,132, while those with college or associate's degree education have the smallest earnings of $34,132.
| Educational Attainment | Male Income | Female Income |
| Less than High School | - | - |
| High School Diploma | $45,517 | $0 |
| College or Associate's Degree | - | - |
| Bachelor's Degree | - | - |
| Graduate Degree | - | - |
| Total | $34,761 | $34,149 |
Family Income in Crab Orchard
Family Income Brackets in Crab Orchard
According to the Crab Orchard family income data, there are 100 families falling into the $75,000 to $99,999 income range, which is the most common income bracket and makes up 27.9% of all families.
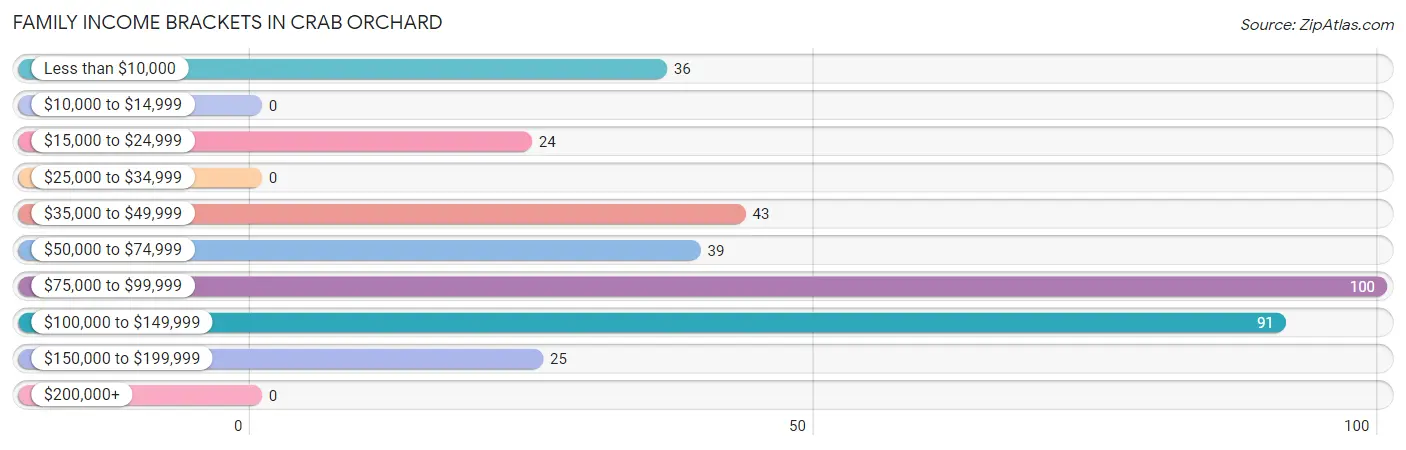
| Income Bracket | # Families | % Families |
| Less than $10,000 | 36 | 10.1% |
| $10,000 to $14,999 | 0 | 0.0% |
| $15,000 to $24,999 | 24 | 6.7% |
| $25,000 to $34,999 | 0 | 0.0% |
| $35,000 to $49,999 | 43 | 12.0% |
| $50,000 to $74,999 | 39 | 10.9% |
| $75,000 to $99,999 | 100 | 27.9% |
| $100,000 to $149,999 | 91 | 25.4% |
| $150,000 to $199,999 | 25 | 7.0% |
| $200,000+ | 0 | 0.0% |
Family Income by Famaliy Size in Crab Orchard
3-person families (63 | 17.6%) account for the highest median family income in Crab Orchard with $145,114 per family, while 3-person families (63 | 17.6%) have the highest median income of $48,371 per family member.
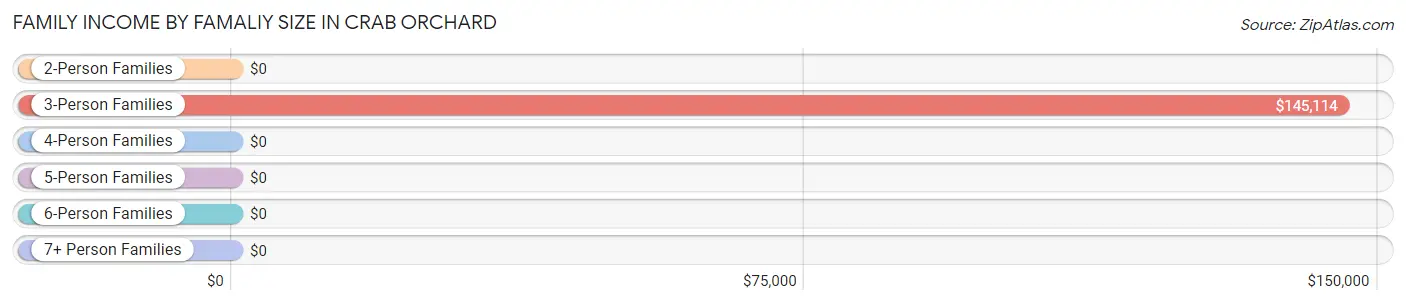
| Income Bracket | # Families | Median Income |
| 2-Person Families | 130 (36.3%) | $0 |
| 3-Person Families | 63 (17.6%) | $145,114 |
| 4-Person Families | 86 (24.0%) | $0 |
| 5-Person Families | 58 (16.2%) | $0 |
| 6-Person Families | 21 (5.9%) | $0 |
| 7+ Person Families | 0 (0.0%) | $0 |
| Total | 358 (100.0%) | $76,492 |
Family Income by Number of Earners in Crab Orchard
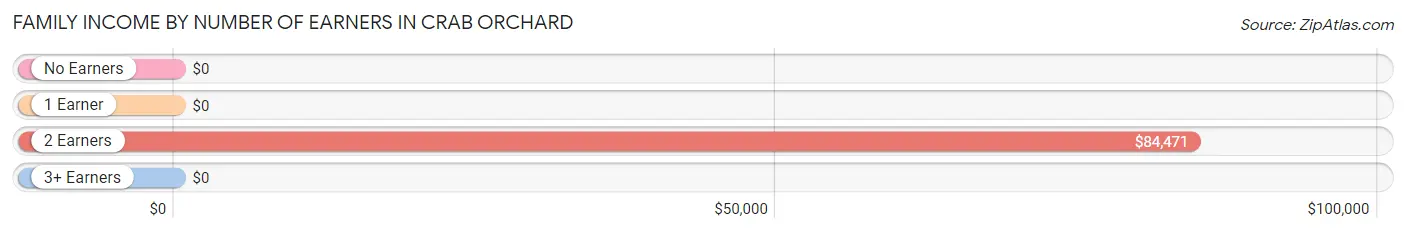
| Number of Earners | # Families | Median Income |
| No Earners | 60 (16.8%) | $0 |
| 1 Earner | 76 (21.2%) | $0 |
| 2 Earners | 201 (56.1%) | $84,471 |
| 3+ Earners | 21 (5.9%) | $0 |
| Total | 358 (100.0%) | $76,492 |
Household Income in Crab Orchard
Household Income Brackets in Crab Orchard
With 148 households falling in the category, the $75,000 to $99,999 income range is the most frequent in Crab Orchard, accounting for 18.9% of all households.
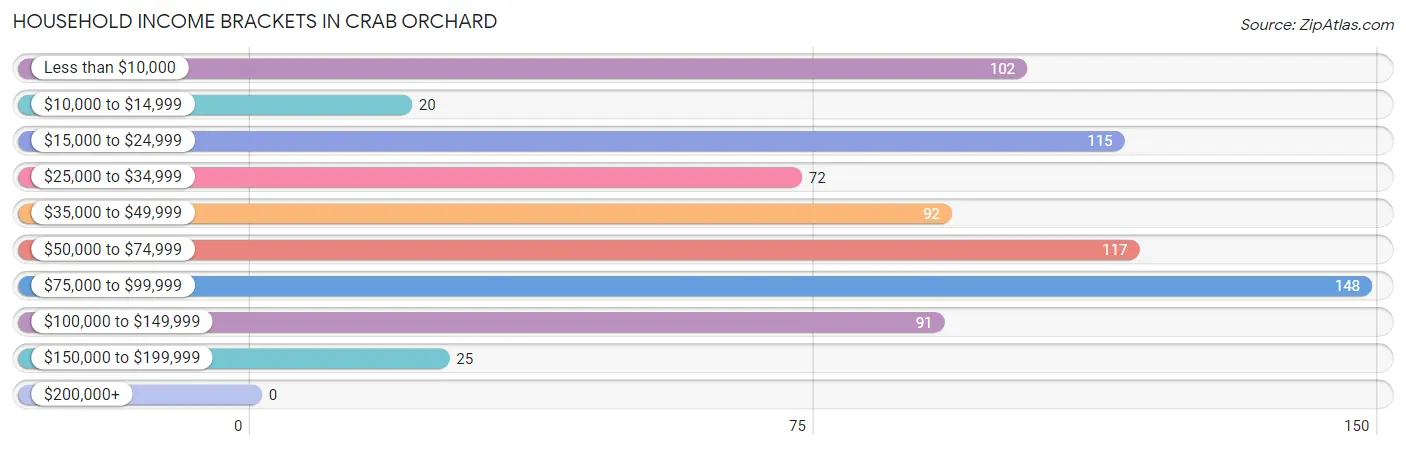
| Income Bracket | # Households | % Households |
| Less than $10,000 | 102 | 13.0% |
| $10,000 to $14,999 | 20 | 2.6% |
| $15,000 to $24,999 | 115 | 14.7% |
| $25,000 to $34,999 | 72 | 9.2% |
| $35,000 to $49,999 | 92 | 11.8% |
| $50,000 to $74,999 | 117 | 15.0% |
| $75,000 to $99,999 | 148 | 18.9% |
| $100,000 to $149,999 | 91 | 11.6% |
| $150,000 to $199,999 | 25 | 3.2% |
| $200,000+ | 0 | 0.0% |
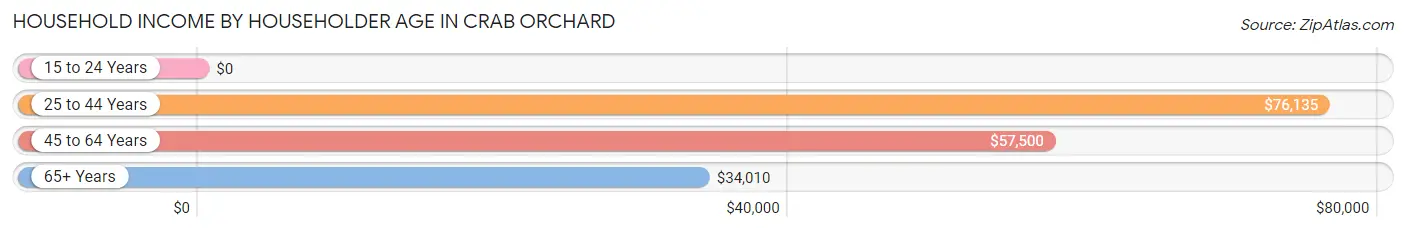
Household Income by Householder Age in Crab Orchard
The median household income in Crab Orchard is $48,438, with the highest median household income of $76,135 found in the 25 to 44 years age bracket for the primary householder. A total of 131 households (16.8%) fall into this category.
| Income Bracket | # Households | Median Income |
| 15 to 24 Years | 0 (0.0%) | $0 |
| 25 to 44 Years | 131 (16.8%) | $76,135 |
| 45 to 64 Years | 138 (17.6%) | $57,500 |
| 65+ Years | 513 (65.6%) | $34,010 |
| Total | 782 (100.0%) | $48,438 |
Poverty in Crab Orchard
Income Below Poverty by Sex and Age in Crab Orchard
With 17.1% poverty level for males and 25.7% for females among the residents of Crab Orchard, 12 to 14 year old males and 16 and 17 year old females are the most vulnerable to poverty, with 23 males (100.0%) and 101 females (100.0%) in their respective age groups living below the poverty level.
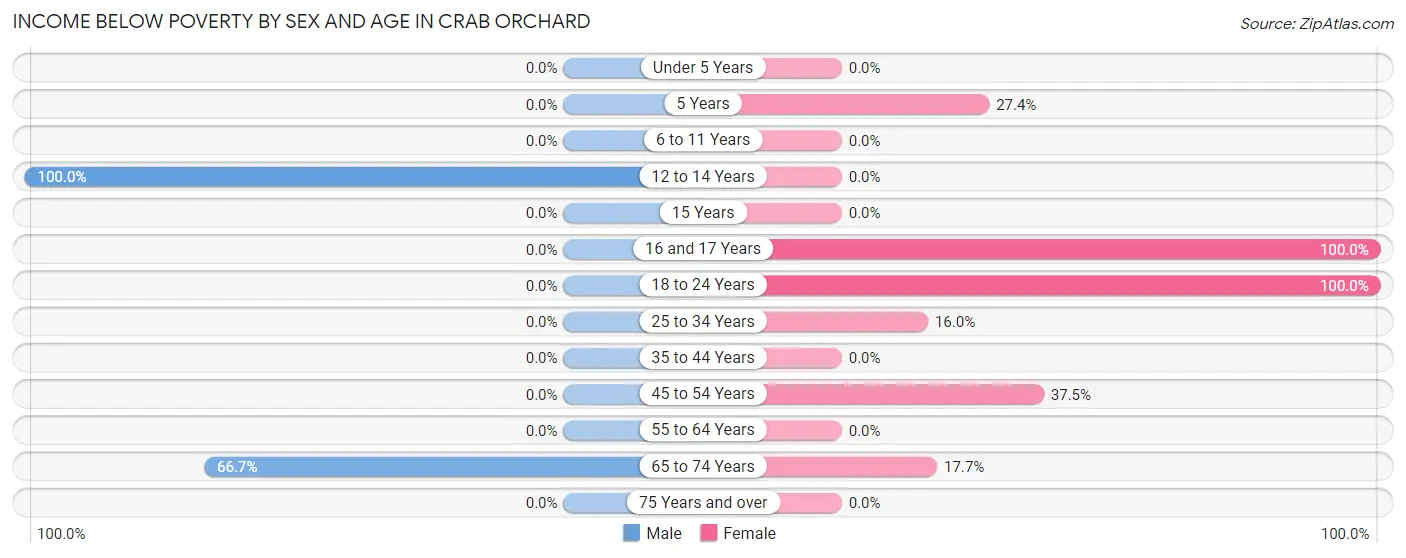
| Age Bracket | Male | Female |
| Under 5 Years | 0 (0.0%) | 0 (0.0%) |
| 5 Years | 0 (0.0%) | 29 (27.4%) |
| 6 to 11 Years | 0 (0.0%) | 0 (0.0%) |
| 12 to 14 Years | 23 (100.0%) | 0 (0.0%) |
| 15 Years | 0 (0.0%) | 0 (0.0%) |
| 16 and 17 Years | 0 (0.0%) | 101 (100.0%) |
| 18 to 24 Years | 0 (0.0%) | 81 (100.0%) |
| 25 to 34 Years | 0 (0.0%) | 36 (16.0%) |
| 35 to 44 Years | 0 (0.0%) | 0 (0.0%) |
| 45 to 54 Years | 0 (0.0%) | 24 (37.5%) |
| 55 to 64 Years | 0 (0.0%) | 0 (0.0%) |
| 65 to 74 Years | 116 (66.7%) | 20 (17.7%) |
| 75 Years and over | 0 (0.0%) | 0 (0.0%) |
| Total | 139 (17.1%) | 291 (25.7%) |
Income Above Poverty by Sex and Age in Crab Orchard
According to the poverty statistics in Crab Orchard, males aged under 5 years and females aged under 5 years are the age groups that are most secure financially, with 100.0% of males and 100.0% of females in these age groups living above the poverty line.
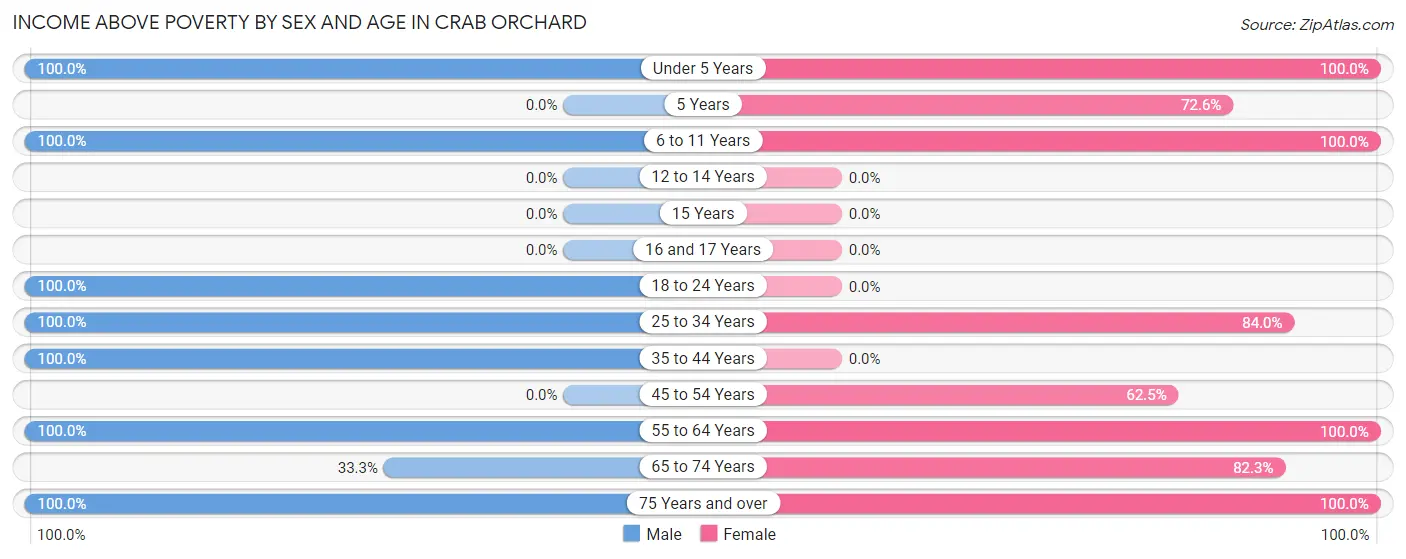
| Age Bracket | Male | Female |
| Under 5 Years | 21 (100.0%) | 36 (100.0%) |
| 5 Years | 0 (0.0%) | 77 (72.6%) |
| 6 to 11 Years | 74 (100.0%) | 17 (100.0%) |
| 12 to 14 Years | 0 (0.0%) | 0 (0.0%) |
| 15 Years | 0 (0.0%) | 0 (0.0%) |
| 16 and 17 Years | 0 (0.0%) | 0 (0.0%) |
| 18 to 24 Years | 103 (100.0%) | 0 (0.0%) |
| 25 to 34 Years | 41 (100.0%) | 189 (84.0%) |
| 35 to 44 Years | 223 (100.0%) | 0 (0.0%) |
| 45 to 54 Years | 0 (0.0%) | 40 (62.5%) |
| 55 to 64 Years | 99 (100.0%) | 150 (100.0%) |
| 65 to 74 Years | 58 (33.3%) | 93 (82.3%) |
| 75 Years and over | 55 (100.0%) | 240 (100.0%) |
| Total | 674 (82.9%) | 842 (74.3%) |
Income Below Poverty Among Married-Couple Families in Crab Orchard
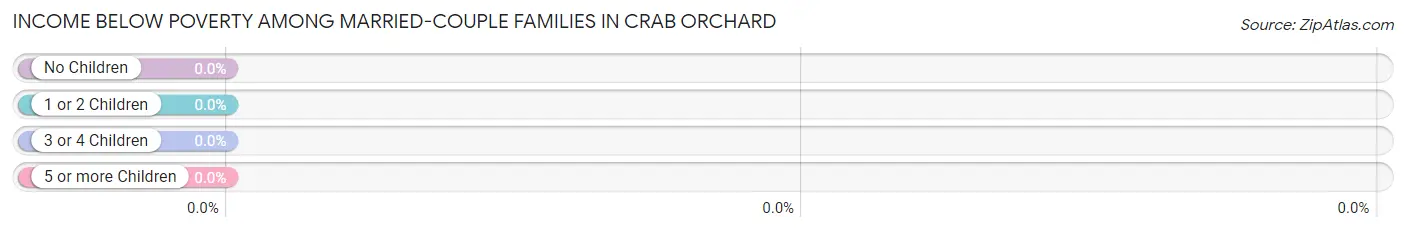
| Children | Above Poverty | Below Poverty |
| No Children | 185 (100.0%) | 0 (0.0%) |
| 1 or 2 Children | 74 (100.0%) | 0 (0.0%) |
| 3 or 4 Children | 21 (100.0%) | 0 (0.0%) |
| 5 or more Children | 0 (0.0%) | 0 (0.0%) |
| Total | 280 (100.0%) | 0 (0.0%) |
Income Below Poverty Among Single-Parent Households in Crab Orchard
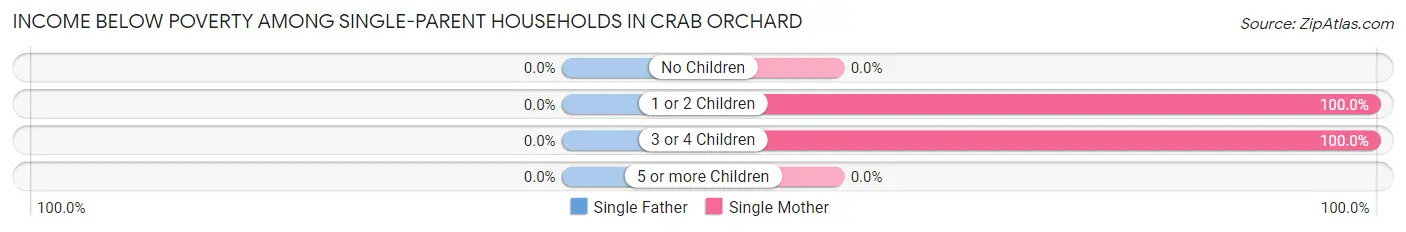
| Children | Single Father | Single Mother |
| No Children | 0 (0.0%) | 0 (0.0%) |
| 1 or 2 Children | 0 (0.0%) | 36 (100.0%) |
| 3 or 4 Children | 0 (0.0%) | 24 (100.0%) |
| 5 or more Children | 0 (0.0%) | 0 (0.0%) |
| Total | 0 (0.0%) | 60 (76.9%) |
Income Below Poverty Among Married-Couple vs Single-Parent Households in Crab Orchard
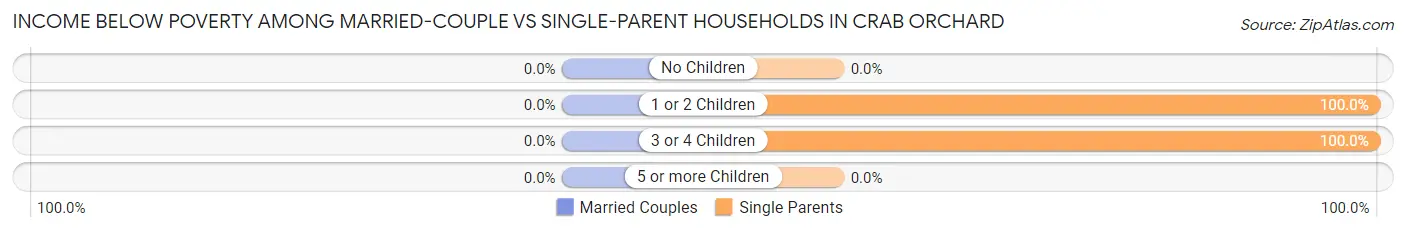
| Children | Married-Couple Families | Single-Parent Households |
| No Children | 0 (0.0%) | 0 (0.0%) |
| 1 or 2 Children | 0 (0.0%) | 36 (100.0%) |
| 3 or 4 Children | 0 (0.0%) | 24 (100.0%) |
| 5 or more Children | 0 (0.0%) | 0 (0.0%) |
| Total | 0 (0.0%) | 60 (76.9%) |
Race in Crab Orchard
The most populous races in Crab Orchard are White / Caucasian (1,817 | 93.4%), Asian (64 | 3.3%), and Black / African American (36 | 1.8%).
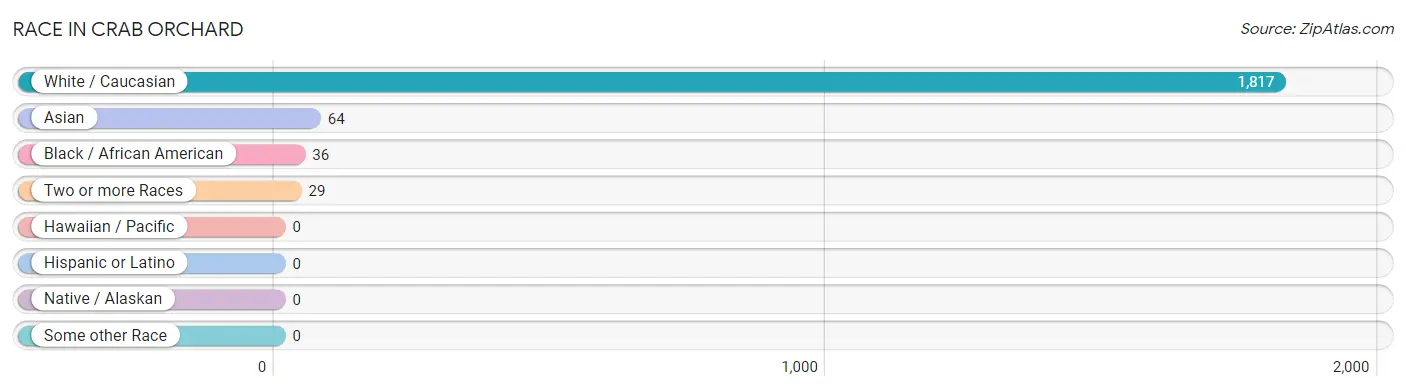
| Race | # Population | % Population |
| Asian | 64 | 3.3% |
| Black / African American | 36 | 1.8% |
| Hawaiian / Pacific | 0 | 0.0% |
| Hispanic or Latino | 0 | 0.0% |
| Native / Alaskan | 0 | 0.0% |
| White / Caucasian | 1,817 | 93.4% |
| Two or more Races | 29 | 1.5% |
| Some other Race | 0 | 0.0% |
| Total | 1,946 | 100.0% |
Ancestry in Crab Orchard
The most populous ancestries reported in Crab Orchard are English (519 | 26.7%), German (200 | 10.3%), Italian (190 | 9.8%), American (185 | 9.5%), and Sri Lankan (64 | 3.3%), together accounting for 59.5% of all Crab Orchard residents.
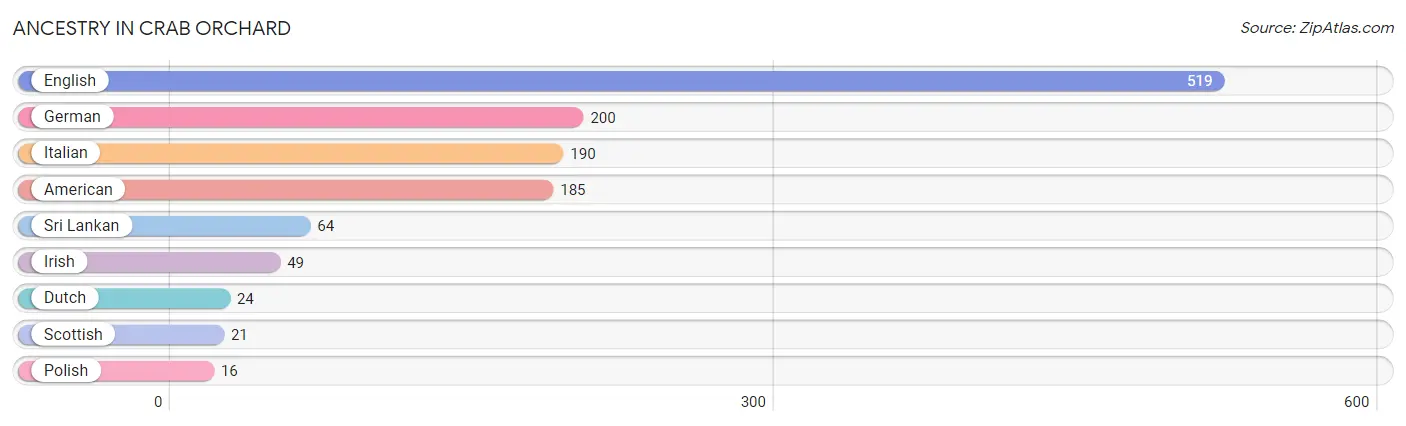
| Ancestry | # Population | % Population |
| American | 185 | 9.5% |
| Dutch | 24 | 1.2% |
| English | 519 | 26.7% |
| German | 200 | 10.3% |
| Irish | 49 | 2.5% |
| Italian | 190 | 9.8% |
| Polish | 16 | 0.8% |
| Scottish | 21 | 1.1% |
| Sri Lankan | 64 | 3.3% | View All 9 Rows |
Immigrants in Crab Orchard

| Immigration Origin | # Population | % Population | View All 0 Rows |
Sex and Age in Crab Orchard
Sex and Age in Crab Orchard
The most populous age groups in Crab Orchard are 70 to 74 Years (160 | 19.7%) for men and 30 to 34 Years (177 | 15.6%) for women.
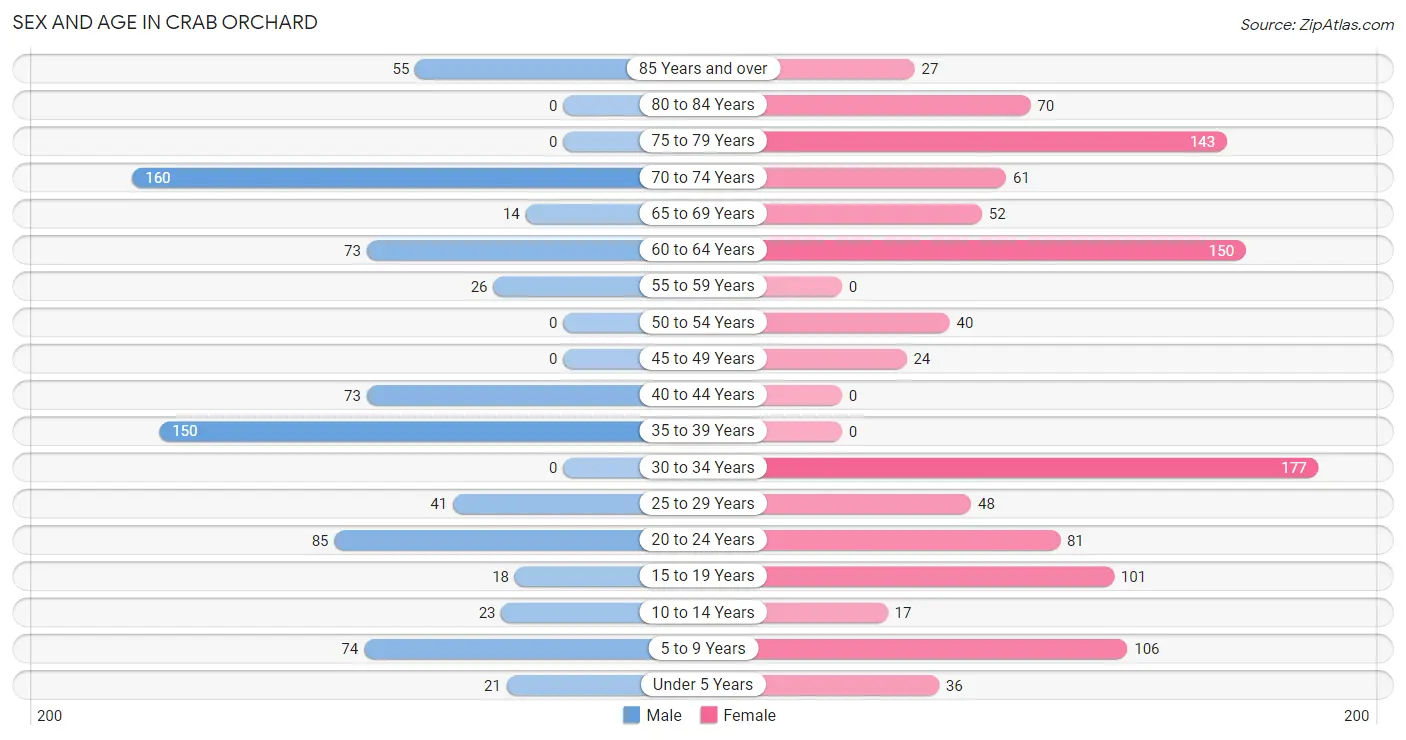
| Age Bracket | Male | Female |
| Under 5 Years | 21 (2.6%) | 36 (3.2%) |
| 5 to 9 Years | 74 (9.1%) | 106 (9.4%) |
| 10 to 14 Years | 23 (2.8%) | 17 (1.5%) |
| 15 to 19 Years | 18 (2.2%) | 101 (8.9%) |
| 20 to 24 Years | 85 (10.5%) | 81 (7.1%) |
| 25 to 29 Years | 41 (5.0%) | 48 (4.2%) |
| 30 to 34 Years | 0 (0.0%) | 177 (15.6%) |
| 35 to 39 Years | 150 (18.4%) | 0 (0.0%) |
| 40 to 44 Years | 73 (9.0%) | 0 (0.0%) |
| 45 to 49 Years | 0 (0.0%) | 24 (2.1%) |
| 50 to 54 Years | 0 (0.0%) | 40 (3.5%) |
| 55 to 59 Years | 26 (3.2%) | 0 (0.0%) |
| 60 to 64 Years | 73 (9.0%) | 150 (13.2%) |
| 65 to 69 Years | 14 (1.7%) | 52 (4.6%) |
| 70 to 74 Years | 160 (19.7%) | 61 (5.4%) |
| 75 to 79 Years | 0 (0.0%) | 143 (12.6%) |
| 80 to 84 Years | 0 (0.0%) | 70 (6.2%) |
| 85 Years and over | 55 (6.8%) | 27 (2.4%) |
| Total | 813 (100.0%) | 1,133 (100.0%) |
Families and Households in Crab Orchard
Median Family Size in Crab Orchard
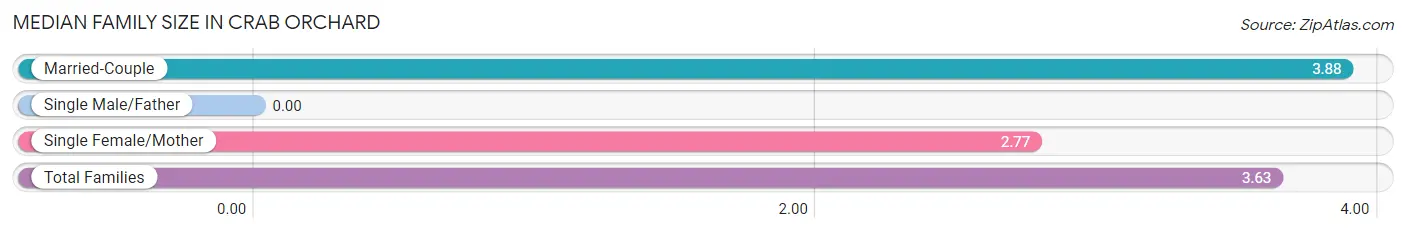
| Family Type | # Families | Family Size |
| Married-Couple | 280 (78.2%) | 3.88 |
| Single Male/Father | 0 (0.0%) | - |
| Single Female/Mother | 78 (21.8%) | 2.77 |
| Total Families | 358 (100.0%) | 3.63 |
Median Household Size in Crab Orchard
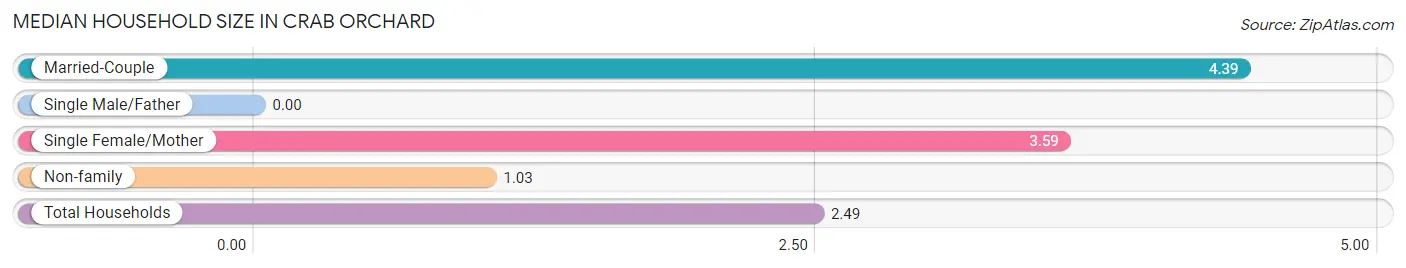
| Household Type | # Households | Household Size |
| Married-Couple | 280 (35.8%) | 4.39 |
| Single Male/Father | 0 (0.0%) | - |
| Single Female/Mother | 78 (10.0%) | 3.59 |
| Non-family | 424 (54.2%) | 1.03 |
| Total Households | 782 (100.0%) | 2.49 |
Household Size by Marriage Status in Crab Orchard
Out of a total of 782 households in Crab Orchard, 358 (45.8%) are family households, while 424 (54.2%) are nonfamily households. The most numerous type of family households are 3-person households, comprising 99, and the most common type of nonfamily households are 1-person households, comprising 412.
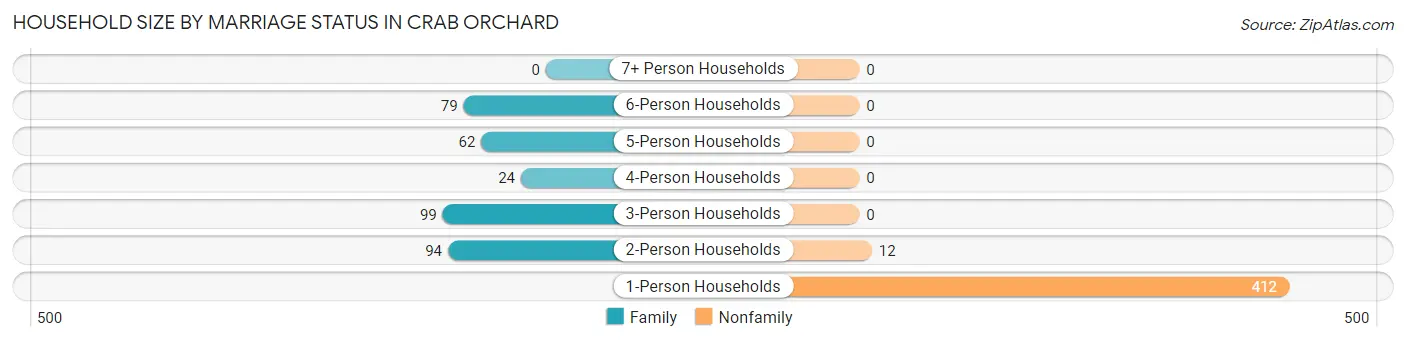
| Household Size | Family Households | Nonfamily Households |
| 1-Person Households | - | 412 (52.7%) |
| 2-Person Households | 94 (12.0%) | 12 (1.5%) |
| 3-Person Households | 99 (12.7%) | 0 (0.0%) |
| 4-Person Households | 24 (3.1%) | 0 (0.0%) |
| 5-Person Households | 62 (7.9%) | 0 (0.0%) |
| 6-Person Households | 79 (10.1%) | 0 (0.0%) |
| 7+ Person Households | 0 (0.0%) | 0 (0.0%) |
| Total | 358 (45.8%) | 424 (54.2%) |
Female Fertility in Crab Orchard
Fertility by Age in Crab Orchard
| Age Bracket | Women with Births | Births / 1,000 Women |
| 15 to 19 years | 0 (0.0%) | 0.0 |
| 20 to 34 years | 0 (0.0%) | 0.0 |
| 35 to 50 years | 0 (0.0%) | 0.0 |
| Total | 0 (0.0%) | 0.0 |
Fertility by Age by Marriage Status in Crab Orchard
| Age Bracket | Married | Unmarried |
| 15 to 19 years | 0 (0.0%) | 0 (0.0%) |
| 20 to 34 years | 0 (0.0%) | 0 (0.0%) |
| 35 to 50 years | 0 (0.0%) | 0 (0.0%) |
| Total | 0 (0.0%) | 0 (0.0%) |
Fertility by Education in Crab Orchard
| Educational Attainment | Women with Births | Births / 1,000 Women |
| Less than High School | 0 (0.0%) | 0.0 |
| High School Diploma | 0 (0.0%) | 0.0 |
| College or Associate's Degree | 0 (0.0%) | 0.0 |
| Bachelor's Degree | 0 (0.0%) | 0.0 |
| Graduate Degree | 0 (0.0%) | 0.0 |
| Total | 0 (0.0%) | 0.0 |
Fertility by Education by Marriage Status in Crab Orchard
| Educational Attainment | Married | Unmarried |
| Less than High School | 0 (0.0%) | 0 (0.0%) |
| High School Diploma | 0 (0.0%) | 0 (0.0%) |
| College or Associate's Degree | 0 (0.0%) | 0 (0.0%) |
| Bachelor's Degree | 0 (0.0%) | 0 (0.0%) |
| Graduate Degree | 0 (0.0%) | 0 (0.0%) |
| Total | 0 (0.0%) | 0 (0.0%) |
Employment Characteristics in Crab Orchard
Employment by Class of Employer in Crab Orchard
Among the 642 employed individuals in Crab Orchard, private company employees (333 | 51.9%), local government employees (100 | 15.6%), and state government employees (92 | 14.3%) make up the most common classes of employment.
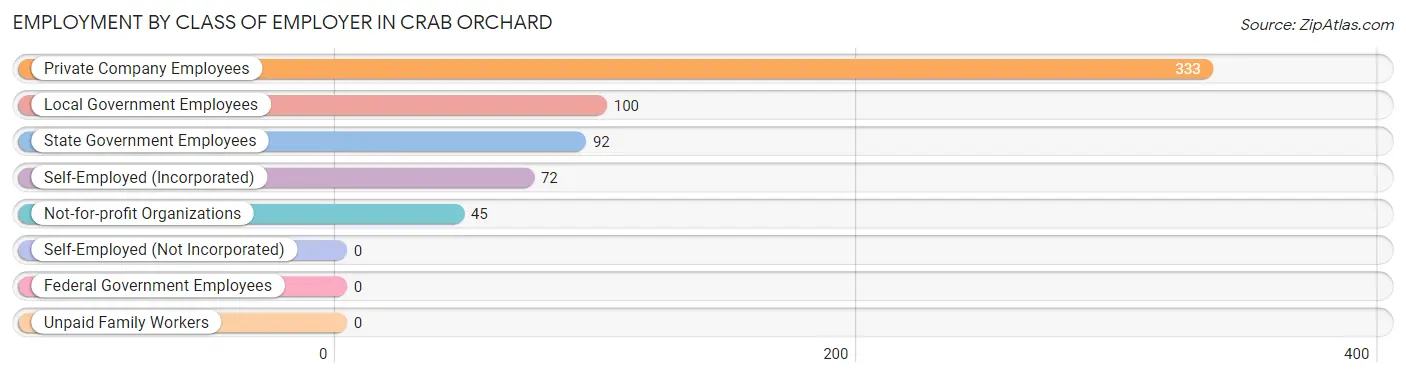
| Employer Class | # Employees | % Employees |
| Private Company Employees | 333 | 51.9% |
| Self-Employed (Incorporated) | 72 | 11.2% |
| Self-Employed (Not Incorporated) | 0 | 0.0% |
| Not-for-profit Organizations | 45 | 7.0% |
| Local Government Employees | 100 | 15.6% |
| State Government Employees | 92 | 14.3% |
| Federal Government Employees | 0 | 0.0% |
| Unpaid Family Workers | 0 | 0.0% |
| Total | 642 | 100.0% |
Employment Status by Age in Crab Orchard
According to the labor force statistics for Crab Orchard, out of the total population over 16 years of age (1,669), 52.0% or 868 individuals are in the labor force, with 23.3% or 202 of them unemployed. The age group with the highest labor force participation rate is 20 to 24 years, with 100.0% or 166 individuals in the labor force. Within the labor force, the 20 to 24 years age range has the highest percentage of unemployed individuals, with 100.0% or 166 of them being unemployed.
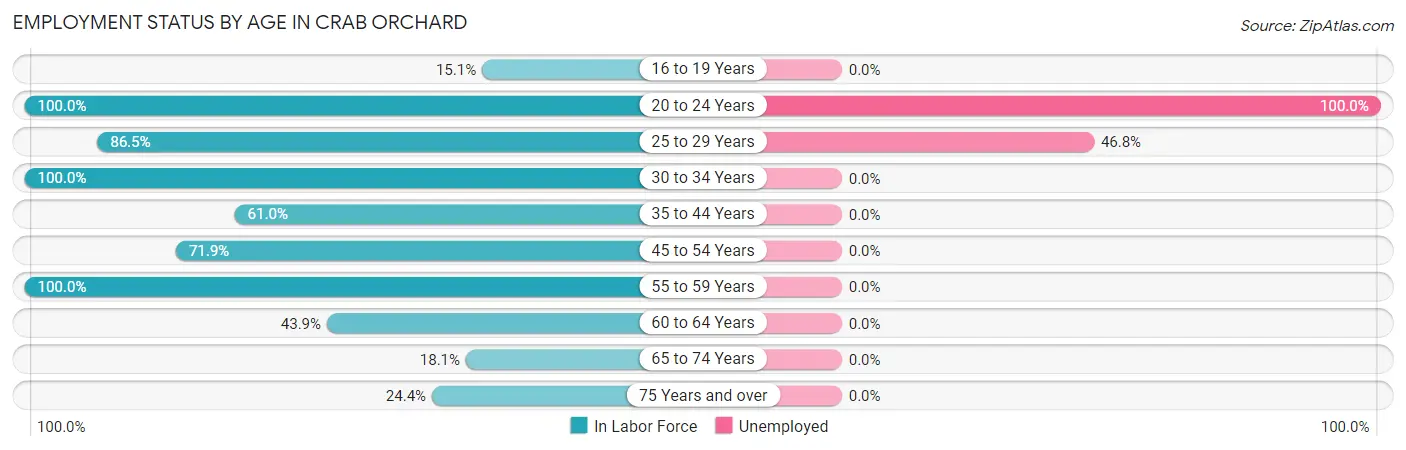
| Age Bracket | In Labor Force | Unemployed |
| 16 to 19 Years | 18 (15.1%) | 0 (0.0%) |
| 20 to 24 Years | 166 (100.0%) | 166 (100.0%) |
| 25 to 29 Years | 77 (86.5%) | 36 (46.8%) |
| 30 to 34 Years | 177 (100.0%) | 0 (0.0%) |
| 35 to 44 Years | 136 (61.0%) | 0 (0.0%) |
| 45 to 54 Years | 46 (71.9%) | 0 (0.0%) |
| 55 to 59 Years | 26 (100.0%) | 0 (0.0%) |
| 60 to 64 Years | 98 (43.9%) | 0 (0.0%) |
| 65 to 74 Years | 52 (18.1%) | 0 (0.0%) |
| 75 Years and over | 72 (24.4%) | 0 (0.0%) |
| Total | 868 (52.0%) | 202 (23.3%) |
Employment Status by Educational Attainment in Crab Orchard
According to labor force statistics for Crab Orchard, 69.8% of individuals (560) out of the total population between 25 and 64 years of age (802) are in the labor force, with 6.4% or 36 of them being unemployed. The group with the highest labor force participation rate are those with the educational attainment of bachelor's degree or higher, with 100.0% or 178 individuals in the labor force. Within the labor force, individuals with college / associate degree education have the highest percentage of unemployment, with 12.8% or 36 of them being unemployed.
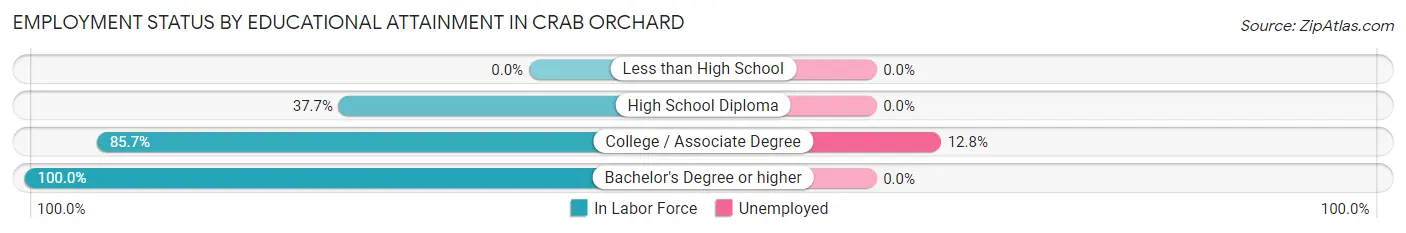
| Educational Attainment | In Labor Force | Unemployed |
| Less than High School | 0 (0.0%) | 0 (0.0%) |
| High School Diploma | 100 (37.7%) | 0 (0.0%) |
| College / Associate Degree | 282 (85.7%) | 42 (12.8%) |
| Bachelor's Degree or higher | 178 (100.0%) | 0 (0.0%) |
| Total | 560 (69.8%) | 51 (6.4%) |
Employment Occupations by Sex in Crab Orchard
Management, Business, Science and Arts Occupations
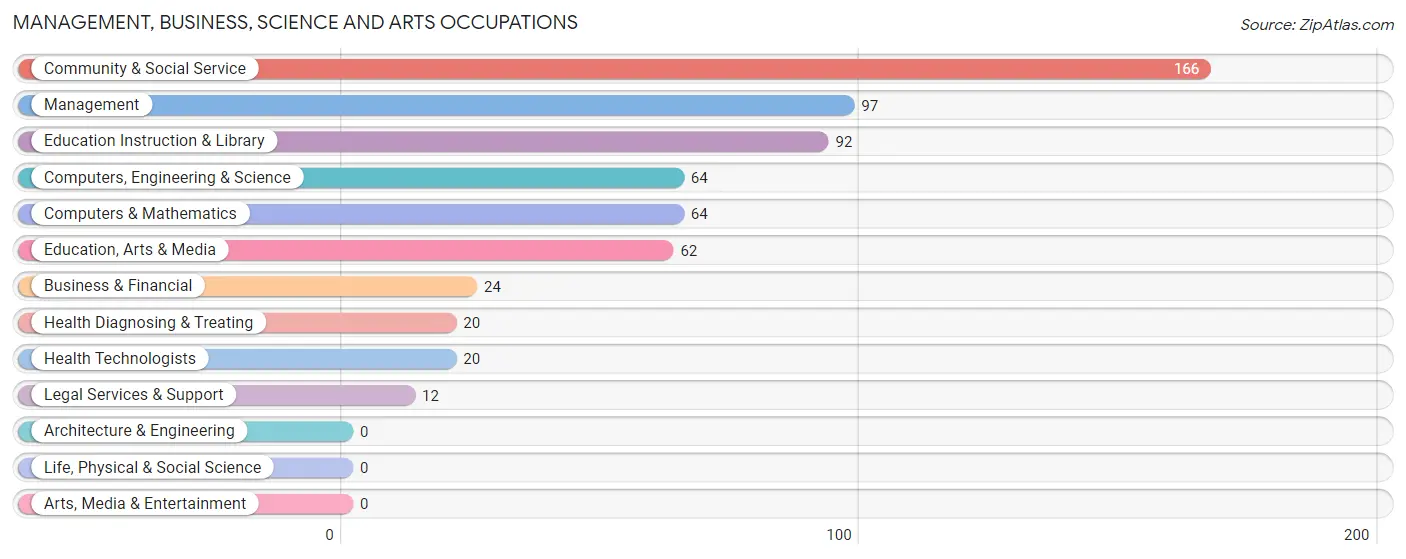
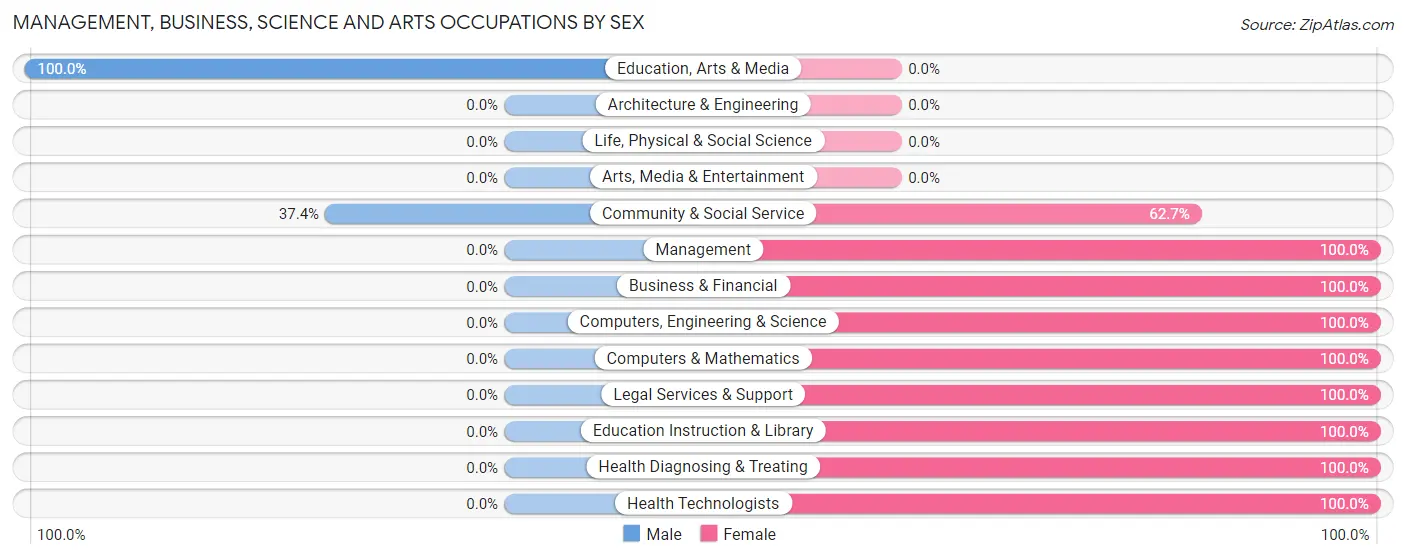
The most common Management, Business, Science and Arts occupations in Crab Orchard are Community & Social Service (166 | 24.9%), Management (97 | 14.6%), Education Instruction & Library (92 | 13.8%), Computers, Engineering & Science (64 | 9.6%), and Computers & Mathematics (64 | 9.6%).
Management, Business, Science and Arts Occupations by Sex
Within the Management, Business, Science and Arts occupations in Crab Orchard, the most male-oriented occupations are Education, Arts & Media (100.0%), and Community & Social Service (37.3%), while the most female-oriented occupations are Management (100.0%), Business & Financial (100.0%), and Computers, Engineering & Science (100.0%).
| Occupation | Male | Female |
| Management | 0 (0.0%) | 97 (100.0%) |
| Business & Financial | 0 (0.0%) | 24 (100.0%) |
| Computers, Engineering & Science | 0 (0.0%) | 64 (100.0%) |
| Computers & Mathematics | 0 (0.0%) | 64 (100.0%) |
| Architecture & Engineering | 0 (0.0%) | 0 (0.0%) |
| Life, Physical & Social Science | 0 (0.0%) | 0 (0.0%) |
| Community & Social Service | 62 (37.3%) | 104 (62.6%) |
| Education, Arts & Media | 62 (100.0%) | 0 (0.0%) |
| Legal Services & Support | 0 (0.0%) | 12 (100.0%) |
| Education Instruction & Library | 0 (0.0%) | 92 (100.0%) |
| Arts, Media & Entertainment | 0 (0.0%) | 0 (0.0%) |
| Health Diagnosing & Treating | 0 (0.0%) | 20 (100.0%) |
| Health Technologists | 0 (0.0%) | 20 (100.0%) |
| Total (Category) | 62 (16.7%) | 309 (83.3%) |
| Total (Overall) | 278 (41.7%) | 388 (58.3%) |
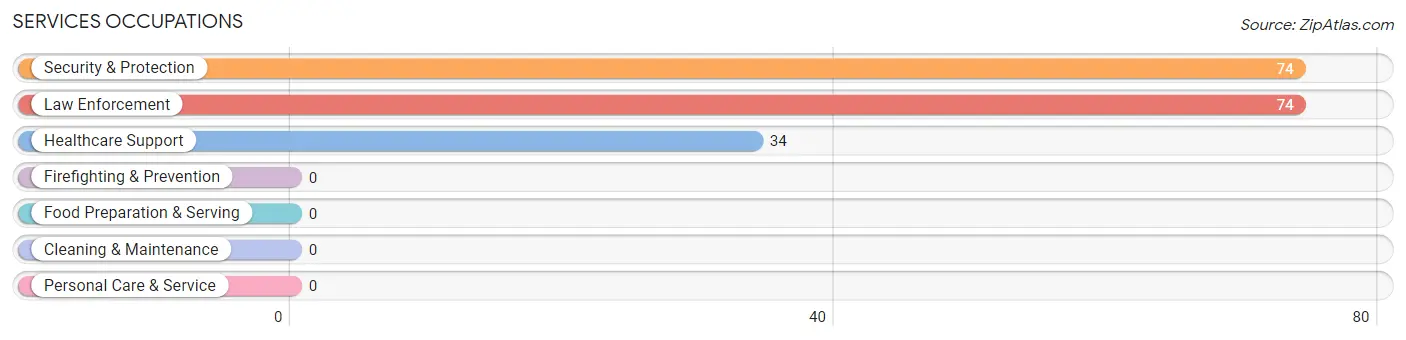
Services Occupations
The most common Services occupations in Crab Orchard are Security & Protection (74 | 11.1%), Law Enforcement (74 | 11.1%), and Healthcare Support (34 | 5.1%).
Services Occupations by Sex
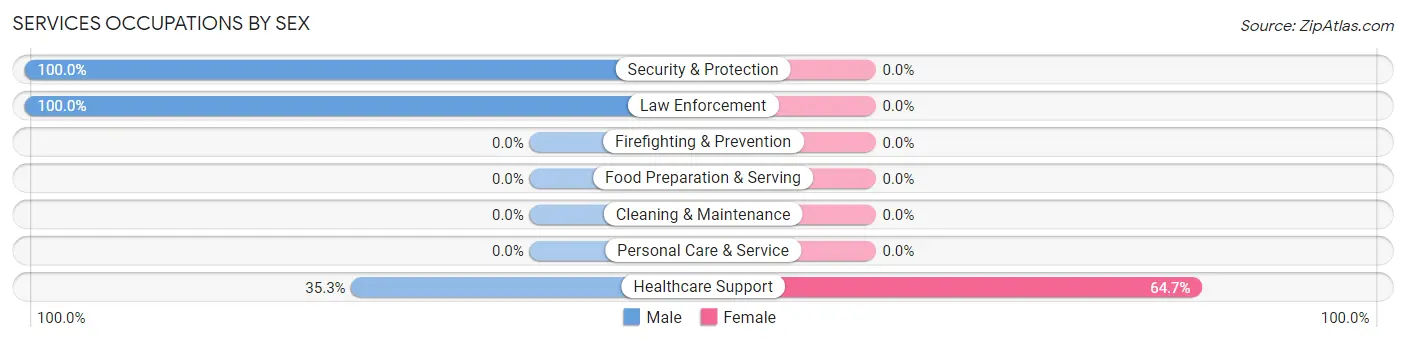
| Occupation | Male | Female |
| Healthcare Support | 12 (35.3%) | 22 (64.7%) |
| Security & Protection | 74 (100.0%) | 0 (0.0%) |
| Firefighting & Prevention | 0 (0.0%) | 0 (0.0%) |
| Law Enforcement | 74 (100.0%) | 0 (0.0%) |
| Food Preparation & Serving | 0 (0.0%) | 0 (0.0%) |
| Cleaning & Maintenance | 0 (0.0%) | 0 (0.0%) |
| Personal Care & Service | 0 (0.0%) | 0 (0.0%) |
| Total (Category) | 86 (79.6%) | 22 (20.4%) |
| Total (Overall) | 278 (41.7%) | 388 (58.3%) |
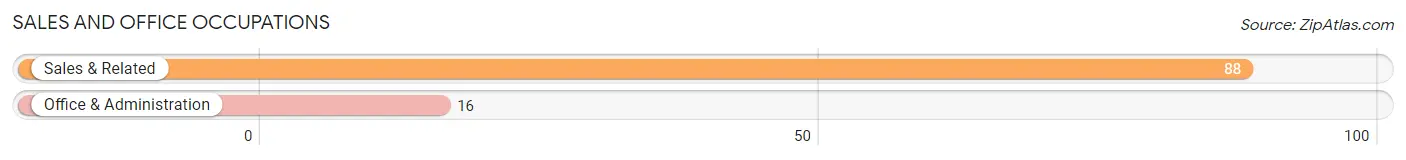
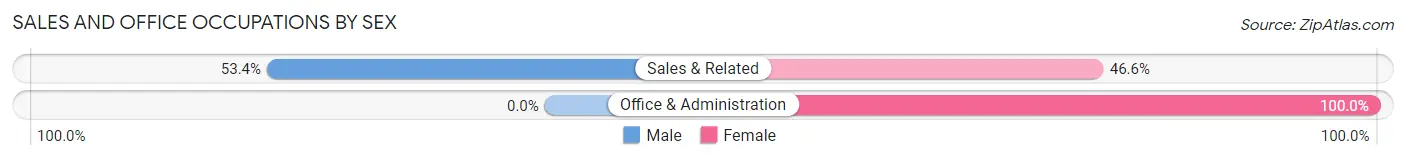
Sales and Office Occupations
The most common Sales and Office occupations in Crab Orchard are Sales & Related (88 | 13.2%), and Office & Administration (16 | 2.4%).
Sales and Office Occupations by Sex
| Occupation | Male | Female |
| Sales & Related | 47 (53.4%) | 41 (46.6%) |
| Office & Administration | 0 (0.0%) | 16 (100.0%) |
| Total (Category) | 47 (45.2%) | 57 (54.8%) |
| Total (Overall) | 278 (41.7%) | 388 (58.3%) |
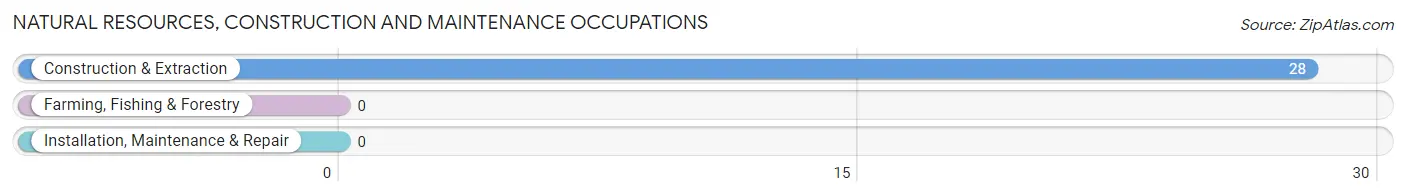
Natural Resources, Construction and Maintenance Occupations
The most common Natural Resources, Construction and Maintenance occupations in Crab Orchard are , and Construction & Extraction (28 | 4.2%).
Natural Resources, Construction and Maintenance Occupations by Sex
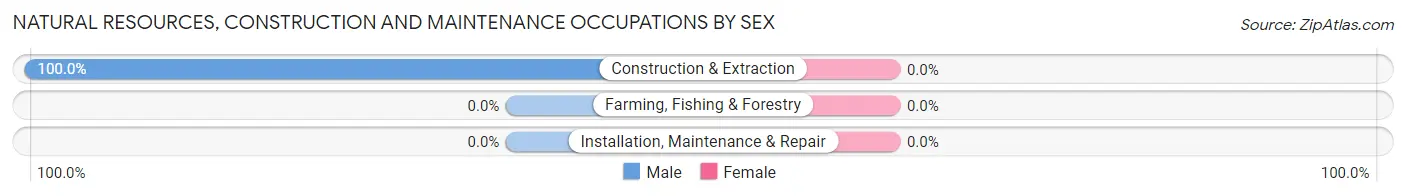
| Occupation | Male | Female |
| Farming, Fishing & Forestry | 0 (0.0%) | 0 (0.0%) |
| Construction & Extraction | 28 (100.0%) | 0 (0.0%) |
| Installation, Maintenance & Repair | 0 (0.0%) | 0 (0.0%) |
| Total (Category) | 28 (100.0%) | 0 (0.0%) |
| Total (Overall) | 278 (41.7%) | 388 (58.3%) |
Production, Transportation and Moving Occupations
The most common Production, Transportation and Moving occupations in Crab Orchard are , and Production (55 | 8.3%).
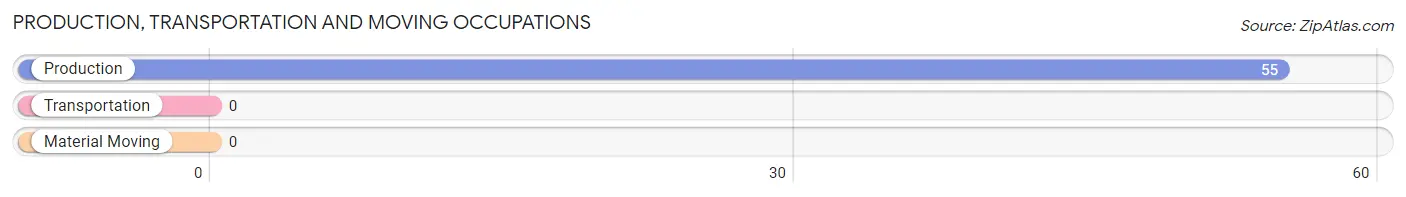
Production, Transportation and Moving Occupations by Sex
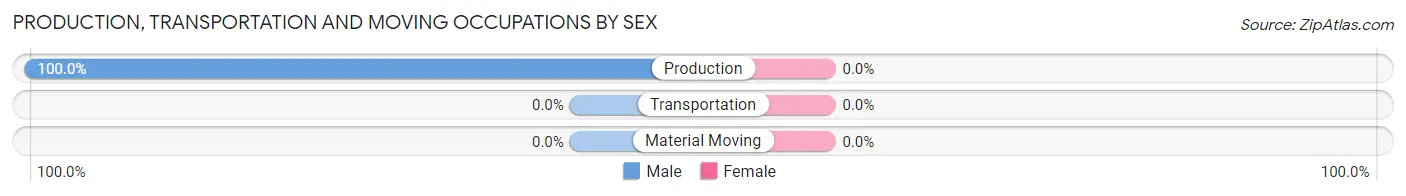
| Occupation | Male | Female |
| Production | 55 (100.0%) | 0 (0.0%) |
| Transportation | 0 (0.0%) | 0 (0.0%) |
| Material Moving | 0 (0.0%) | 0 (0.0%) |
| Total (Category) | 55 (100.0%) | 0 (0.0%) |
| Total (Overall) | 278 (41.7%) | 388 (58.3%) |
Employment Industries by Sex in Crab Orchard
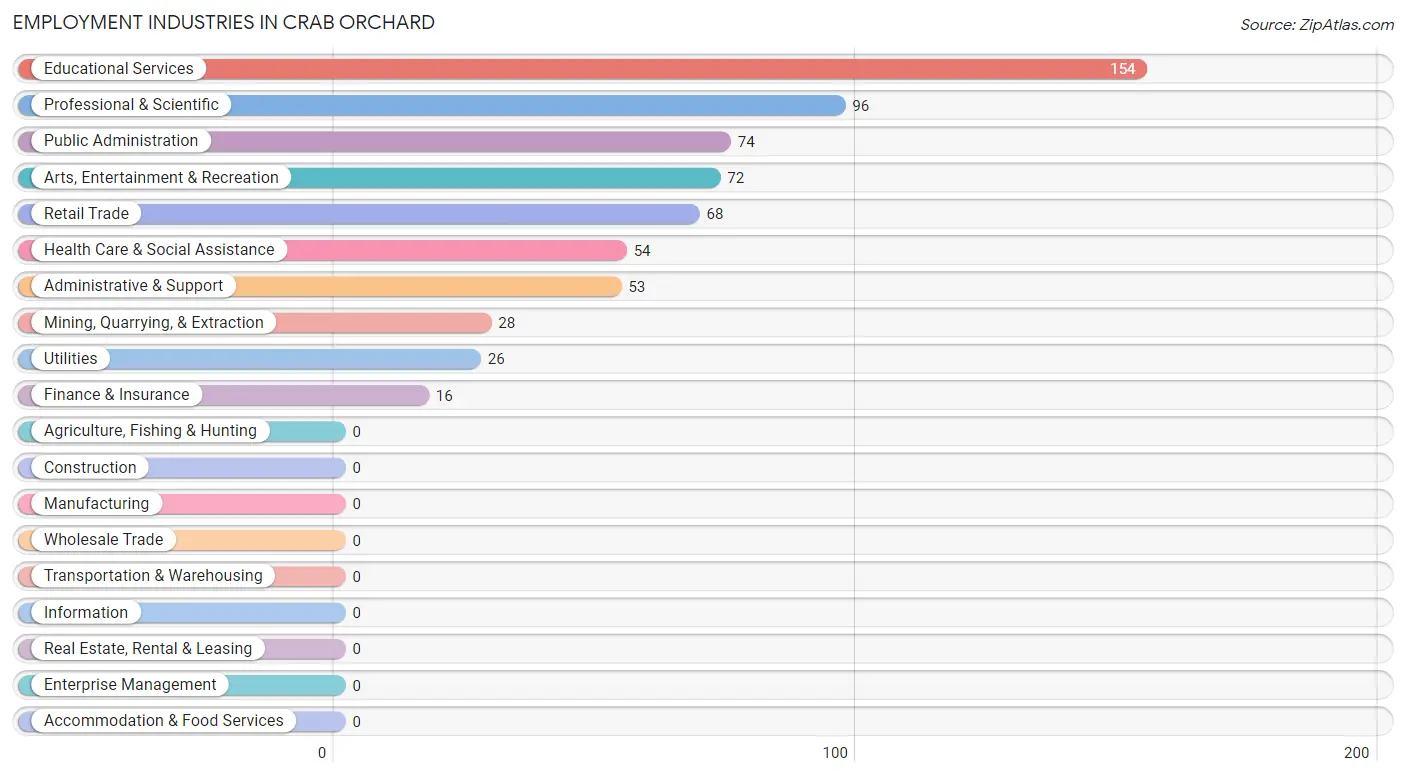
Employment Industries in Crab Orchard
The major employment industries in Crab Orchard include Educational Services (154 | 23.1%), Professional & Scientific (96 | 14.4%), Public Administration (74 | 11.1%), Arts, Entertainment & Recreation (72 | 10.8%), and Retail Trade (68 | 10.2%).
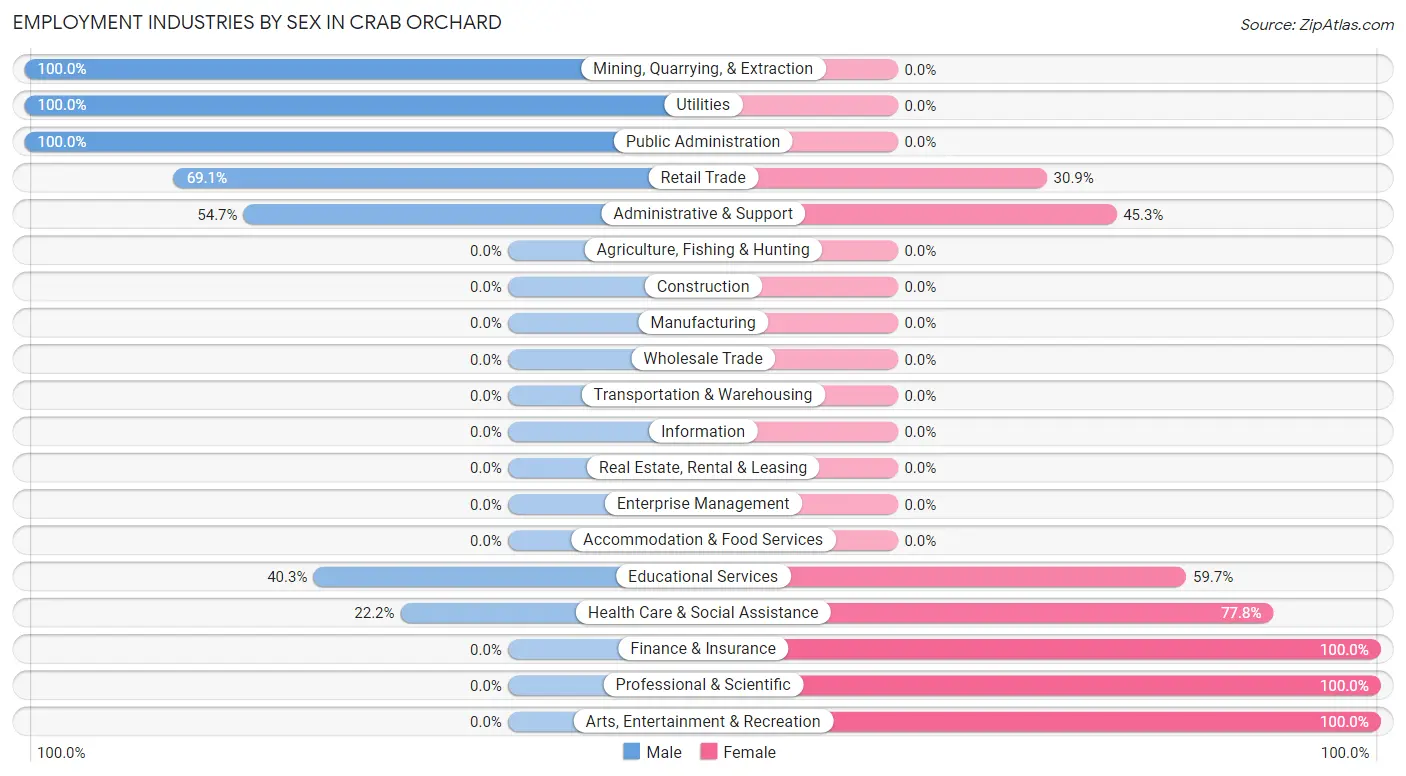
Employment Industries by Sex in Crab Orchard
The Crab Orchard industries that see more men than women are Mining, Quarrying, & Extraction (100.0%), Utilities (100.0%), and Public Administration (100.0%), whereas the industries that tend to have a higher number of women are Finance & Insurance (100.0%), Professional & Scientific (100.0%), and Arts, Entertainment & Recreation (100.0%).
| Industry | Male | Female |
| Agriculture, Fishing & Hunting | 0 (0.0%) | 0 (0.0%) |
| Mining, Quarrying, & Extraction | 28 (100.0%) | 0 (0.0%) |
| Construction | 0 (0.0%) | 0 (0.0%) |
| Manufacturing | 0 (0.0%) | 0 (0.0%) |
| Wholesale Trade | 0 (0.0%) | 0 (0.0%) |
| Retail Trade | 47 (69.1%) | 21 (30.9%) |
| Transportation & Warehousing | 0 (0.0%) | 0 (0.0%) |
| Utilities | 26 (100.0%) | 0 (0.0%) |
| Information | 0 (0.0%) | 0 (0.0%) |
| Finance & Insurance | 0 (0.0%) | 16 (100.0%) |
| Real Estate, Rental & Leasing | 0 (0.0%) | 0 (0.0%) |
| Professional & Scientific | 0 (0.0%) | 96 (100.0%) |
| Enterprise Management | 0 (0.0%) | 0 (0.0%) |
| Administrative & Support | 29 (54.7%) | 24 (45.3%) |
| Educational Services | 62 (40.3%) | 92 (59.7%) |
| Health Care & Social Assistance | 12 (22.2%) | 42 (77.8%) |
| Arts, Entertainment & Recreation | 0 (0.0%) | 72 (100.0%) |
| Accommodation & Food Services | 0 (0.0%) | 0 (0.0%) |
| Public Administration | 74 (100.0%) | 0 (0.0%) |
| Total | 278 (41.7%) | 388 (58.3%) |
Education in Crab Orchard
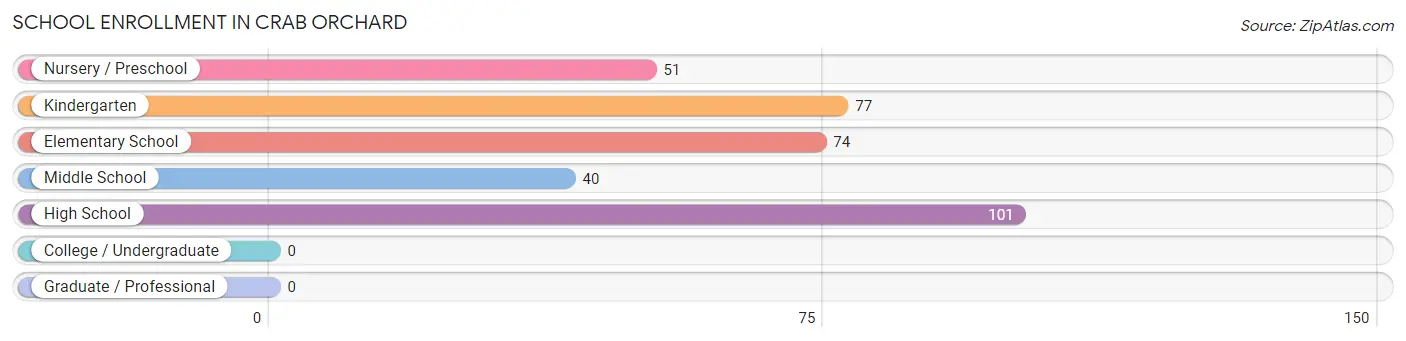
School Enrollment in Crab Orchard
The most common levels of schooling among the 343 students in Crab Orchard are high school (101 | 29.4%), kindergarten (77 | 22.5%), and elementary school (74 | 21.6%).
| School Level | # Students | % Students |
| Nursery / Preschool | 51 | 14.9% |
| Kindergarten | 77 | 22.5% |
| Elementary School | 74 | 21.6% |
| Middle School | 40 | 11.7% |
| High School | 101 | 29.4% |
| College / Undergraduate | 0 | 0.0% |
| Graduate / Professional | 0 | 0.0% |
| Total | 343 | 100.0% |
School Enrollment by Age by Funding Source in Crab Orchard
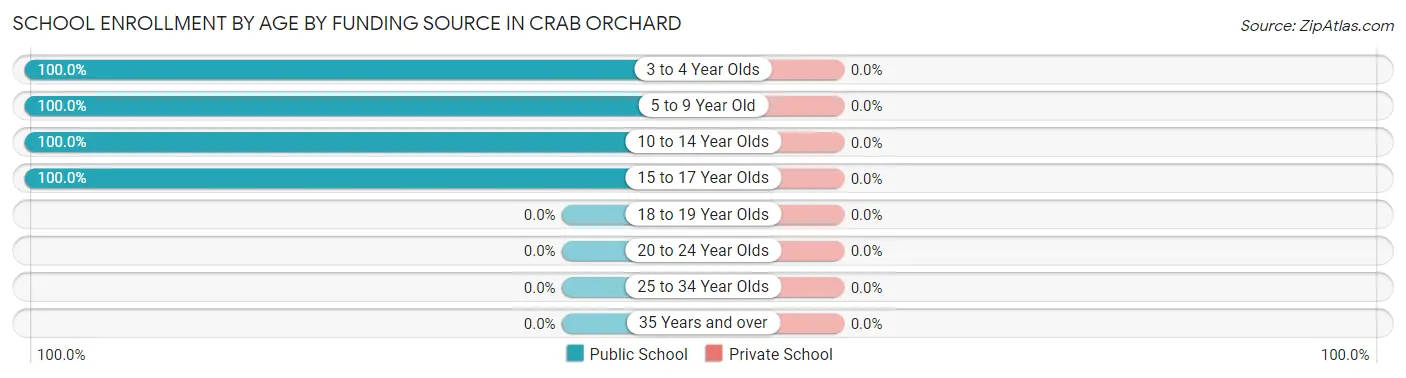
| Age Bracket | Public School | Private School |
| 3 to 4 Year Olds | 22 (100.0%) | 0 (0.0%) |
| 5 to 9 Year Old | 180 (100.0%) | 0 (0.0%) |
| 10 to 14 Year Olds | 40 (100.0%) | 0 (0.0%) |
| 15 to 17 Year Olds | 101 (100.0%) | 0 (0.0%) |
| 18 to 19 Year Olds | 0 (0.0%) | 0 (0.0%) |
| 20 to 24 Year Olds | 0 (0.0%) | 0 (0.0%) |
| 25 to 34 Year Olds | 0 (0.0%) | 0 (0.0%) |
| 35 Years and over | 0 (0.0%) | 0 (0.0%) |
| Total | 343 (100.0%) | 0 (0.0%) |
Educational Attainment by Field of Study in Crab Orchard
Bio, nature & agricultural (92 | 34.6%), liberal arts & history (62 | 23.3%), psychology (24 | 9.0%), business (24 | 9.0%), and arts & humanities (24 | 9.0%) are the most common fields of study among 266 individuals in Crab Orchard who have obtained a bachelor's degree or higher.
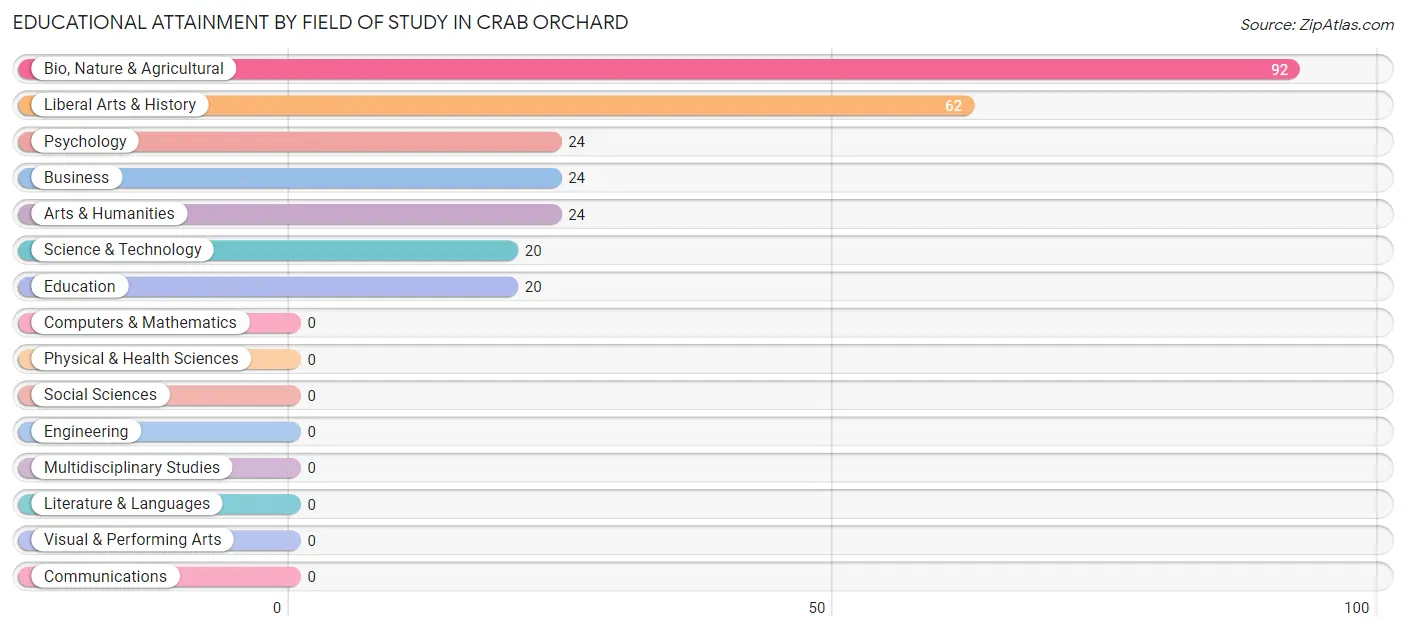
| Field of Study | # Graduates | % Graduates |
| Computers & Mathematics | 0 | 0.0% |
| Bio, Nature & Agricultural | 92 | 34.6% |
| Physical & Health Sciences | 0 | 0.0% |
| Psychology | 24 | 9.0% |
| Social Sciences | 0 | 0.0% |
| Engineering | 0 | 0.0% |
| Multidisciplinary Studies | 0 | 0.0% |
| Science & Technology | 20 | 7.5% |
| Business | 24 | 9.0% |
| Education | 20 | 7.5% |
| Literature & Languages | 0 | 0.0% |
| Liberal Arts & History | 62 | 23.3% |
| Visual & Performing Arts | 0 | 0.0% |
| Communications | 0 | 0.0% |
| Arts & Humanities | 24 | 9.0% |
| Total | 266 | 100.0% |
Transportation & Commute in Crab Orchard
Vehicle Availability by Sex in Crab Orchard
The most prevalent vehicle ownership categories in Crab Orchard are males with 2 vehicles (100, accounting for 36.0%) and females with 2 vehicles (235, making up 27.5%).
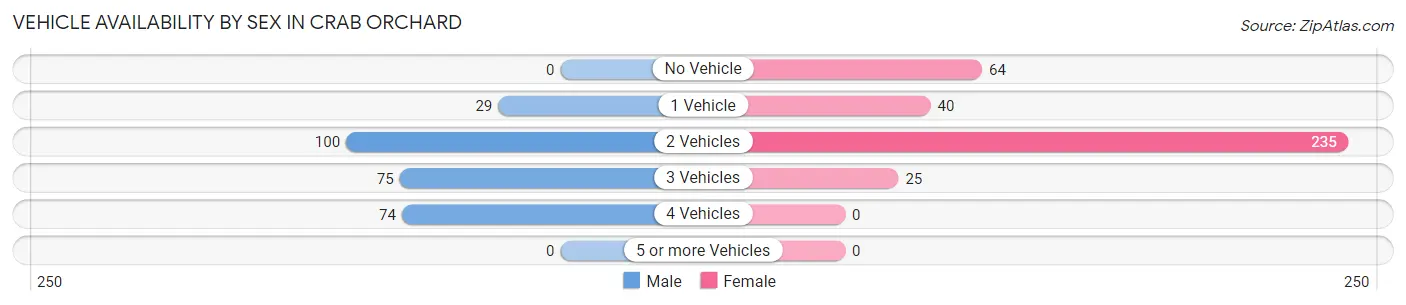
| Vehicles Available | Male | Female |
| No Vehicle | 0 (0.0%) | 64 (17.6%) |
| 1 Vehicle | 29 (10.4%) | 40 (11.0%) |
| 2 Vehicles | 100 (36.0%) | 235 (64.6%) |
| 3 Vehicles | 75 (27.0%) | 25 (6.9%) |
| 4 Vehicles | 74 (26.6%) | 0 (0.0%) |
| 5 or more Vehicles | 0 (0.0%) | 0 (0.0%) |
| Total | 278 (100.0%) | 364 (100.0%) |
Commute Time in Crab Orchard
The most frequently occuring commute durations in Crab Orchard are 15 to 19 minutes (143 commuters, 25.4%), 10 to 14 minutes (100 commuters, 17.8%), and 20 to 24 minutes (100 commuters, 17.8%).
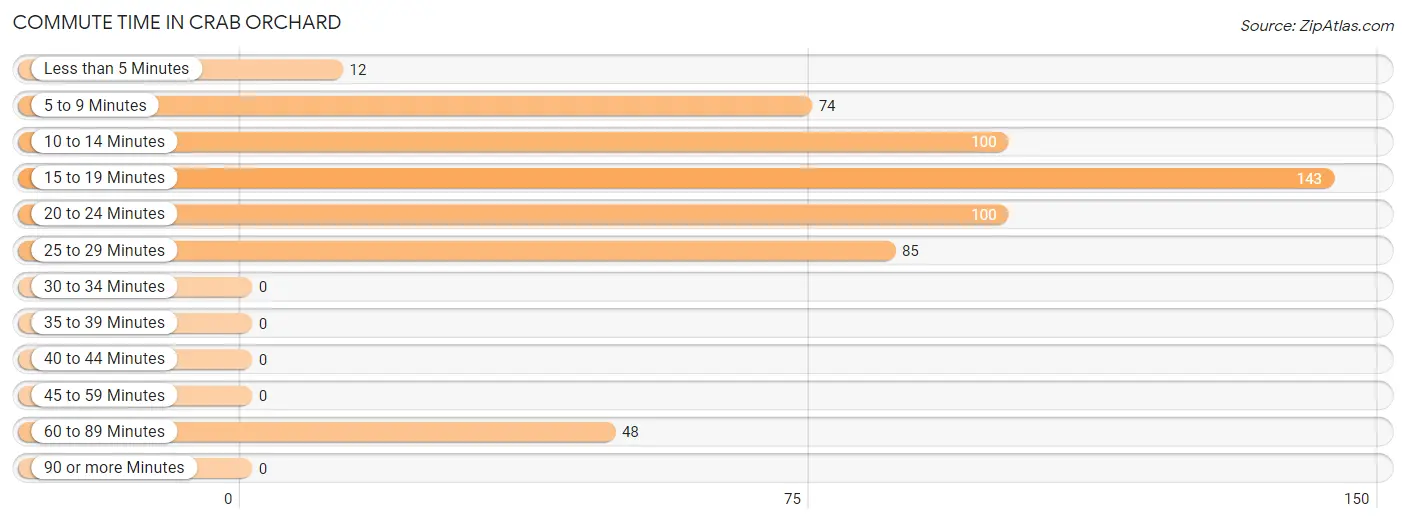
| Commute Time | # Commuters | % Commuters |
| Less than 5 Minutes | 12 | 2.1% |
| 5 to 9 Minutes | 74 | 13.2% |
| 10 to 14 Minutes | 100 | 17.8% |
| 15 to 19 Minutes | 143 | 25.4% |
| 20 to 24 Minutes | 100 | 17.8% |
| 25 to 29 Minutes | 85 | 15.1% |
| 30 to 34 Minutes | 0 | 0.0% |
| 35 to 39 Minutes | 0 | 0.0% |
| 40 to 44 Minutes | 0 | 0.0% |
| 45 to 59 Minutes | 0 | 0.0% |
| 60 to 89 Minutes | 48 | 8.5% |
| 90 or more Minutes | 0 | 0.0% |
Commute Time by Sex in Crab Orchard
The most common commute times in Crab Orchard are 5 to 9 minutes (74 commuters, 37.4%) for males and 15 to 19 minutes (117 commuters, 32.1%) for females.
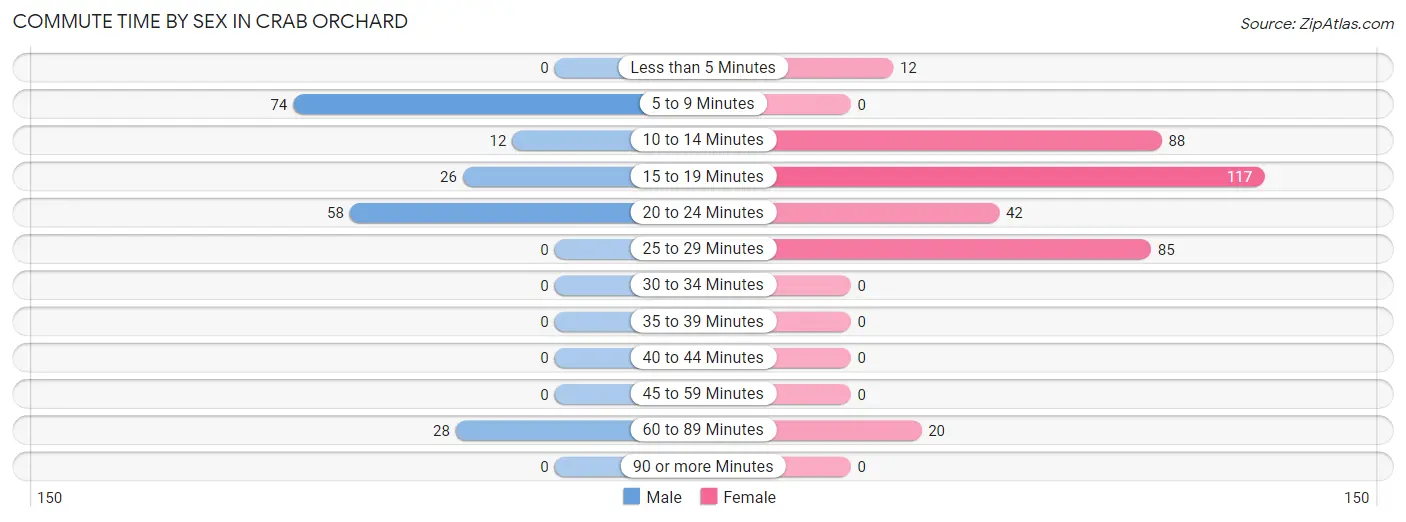
| Commute Time | Male | Female |
| Less than 5 Minutes | 0 (0.0%) | 12 (3.3%) |
| 5 to 9 Minutes | 74 (37.4%) | 0 (0.0%) |
| 10 to 14 Minutes | 12 (6.1%) | 88 (24.2%) |
| 15 to 19 Minutes | 26 (13.1%) | 117 (32.1%) |
| 20 to 24 Minutes | 58 (29.3%) | 42 (11.5%) |
| 25 to 29 Minutes | 0 (0.0%) | 85 (23.4%) |
| 30 to 34 Minutes | 0 (0.0%) | 0 (0.0%) |
| 35 to 39 Minutes | 0 (0.0%) | 0 (0.0%) |
| 40 to 44 Minutes | 0 (0.0%) | 0 (0.0%) |
| 45 to 59 Minutes | 0 (0.0%) | 0 (0.0%) |
| 60 to 89 Minutes | 28 (14.1%) | 20 (5.5%) |
| 90 or more Minutes | 0 (0.0%) | 0 (0.0%) |
Time of Departure to Work by Sex in Crab Orchard
The most frequent times of departure to work in Crab Orchard are 5:30 AM to 5:59 AM (102, 51.5%) for males and 6:30 AM to 6:59 AM (92, 25.3%) for females.
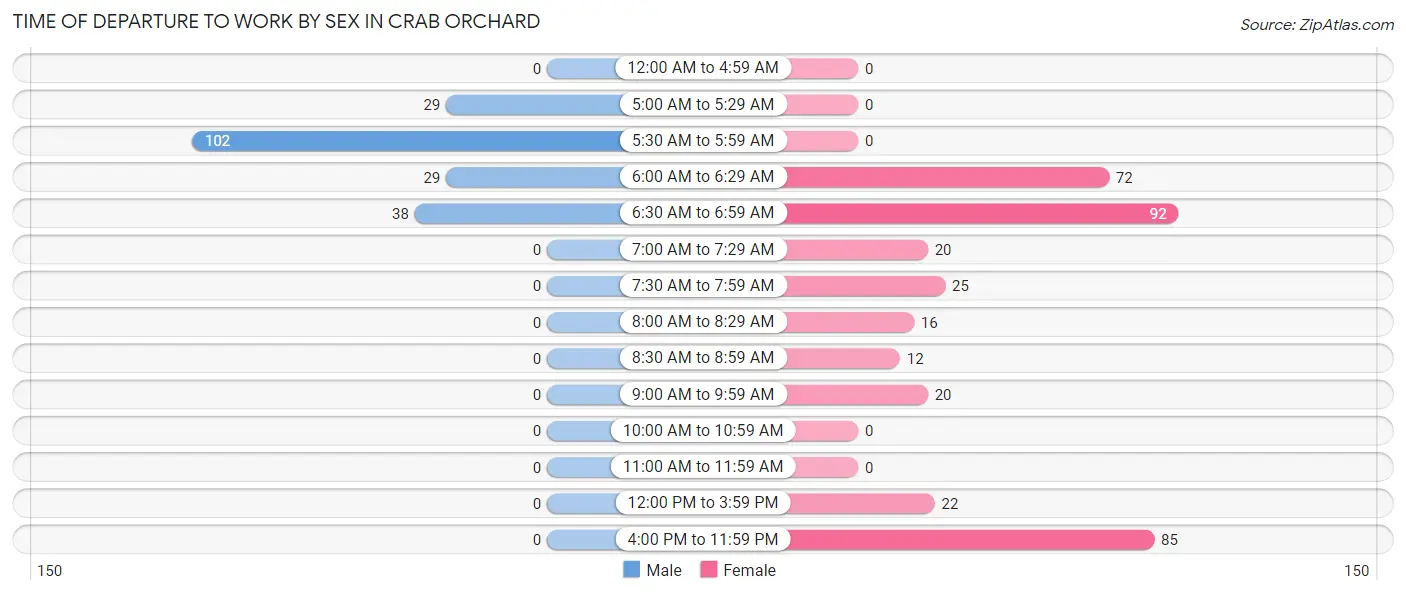
| Time of Departure | Male | Female |
| 12:00 AM to 4:59 AM | 0 (0.0%) | 0 (0.0%) |
| 5:00 AM to 5:29 AM | 29 (14.6%) | 0 (0.0%) |
| 5:30 AM to 5:59 AM | 102 (51.5%) | 0 (0.0%) |
| 6:00 AM to 6:29 AM | 29 (14.6%) | 72 (19.8%) |
| 6:30 AM to 6:59 AM | 38 (19.2%) | 92 (25.3%) |
| 7:00 AM to 7:29 AM | 0 (0.0%) | 20 (5.5%) |
| 7:30 AM to 7:59 AM | 0 (0.0%) | 25 (6.9%) |
| 8:00 AM to 8:29 AM | 0 (0.0%) | 16 (4.4%) |
| 8:30 AM to 8:59 AM | 0 (0.0%) | 12 (3.3%) |
| 9:00 AM to 9:59 AM | 0 (0.0%) | 20 (5.5%) |
| 10:00 AM to 10:59 AM | 0 (0.0%) | 0 (0.0%) |
| 11:00 AM to 11:59 AM | 0 (0.0%) | 0 (0.0%) |
| 12:00 PM to 3:59 PM | 0 (0.0%) | 22 (6.0%) |
| 4:00 PM to 11:59 PM | 0 (0.0%) | 85 (23.4%) |
| Total | 198 (100.0%) | 364 (100.0%) |
Housing Occupancy in Crab Orchard
Occupancy by Ownership in Crab Orchard
Of the total 782 dwellings in Crab Orchard, owner-occupied units account for 655 (83.8%), while renter-occupied units make up 127 (16.2%).
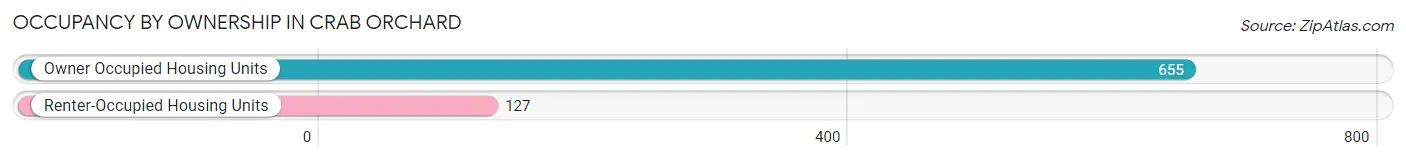
| Occupancy | # Housing Units | % Housing Units |
| Owner Occupied Housing Units | 655 | 83.8% |
| Renter-Occupied Housing Units | 127 | 16.2% |
| Total Occupied Housing Units | 782 | 100.0% |
Occupancy by Household Size in Crab Orchard
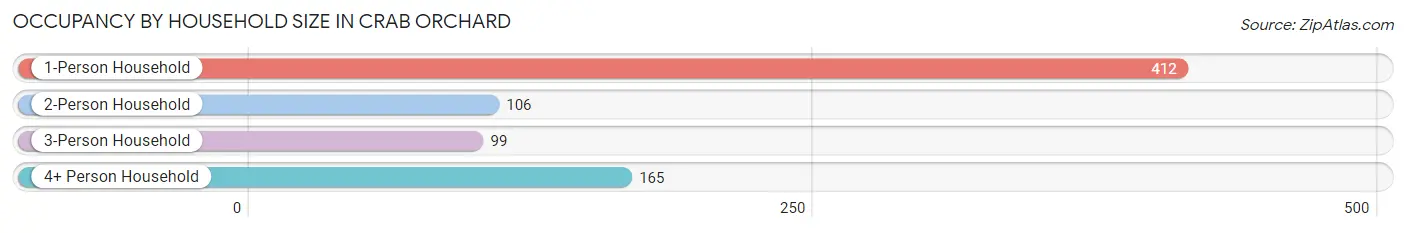
| Household Size | # Housing Units | % Housing Units |
| 1-Person Household | 412 | 52.7% |
| 2-Person Household | 106 | 13.6% |
| 3-Person Household | 99 | 12.7% |
| 4+ Person Household | 165 | 21.1% |
| Total Housing Units | 782 | 100.0% |
Occupancy by Ownership by Household Size in Crab Orchard
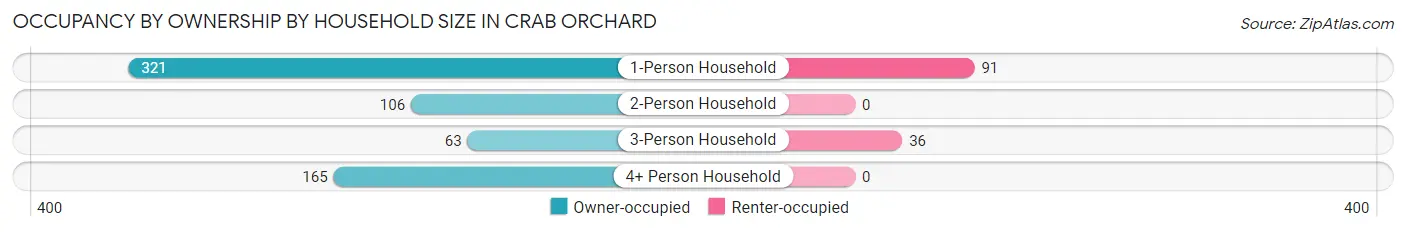
| Household Size | Owner-occupied | Renter-occupied |
| 1-Person Household | 321 (77.9%) | 91 (22.1%) |
| 2-Person Household | 106 (100.0%) | 0 (0.0%) |
| 3-Person Household | 63 (63.6%) | 36 (36.4%) |
| 4+ Person Household | 165 (100.0%) | 0 (0.0%) |
| Total Housing Units | 655 (83.8%) | 127 (16.2%) |
Occupancy by Educational Attainment in Crab Orchard
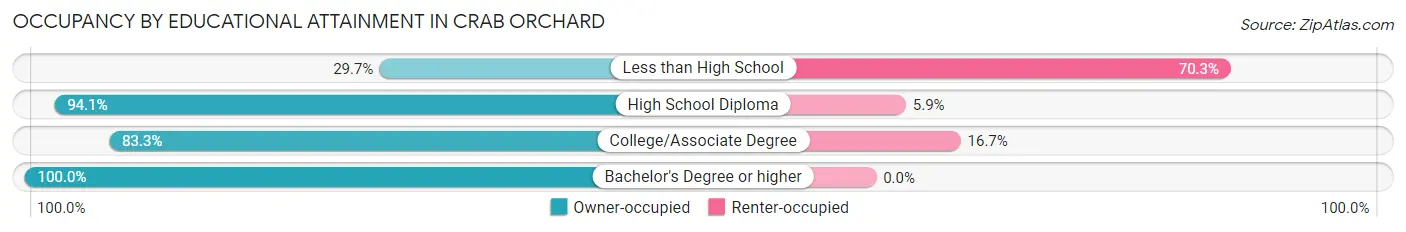
| Household Size | Owner-occupied | Renter-occupied |
| Less than High School | 30 (29.7%) | 71 (70.3%) |
| High School Diploma | 320 (94.1%) | 20 (5.9%) |
| College/Associate Degree | 179 (83.3%) | 36 (16.7%) |
| Bachelor's Degree or higher | 126 (100.0%) | 0 (0.0%) |
Occupancy by Age of Householder in Crab Orchard
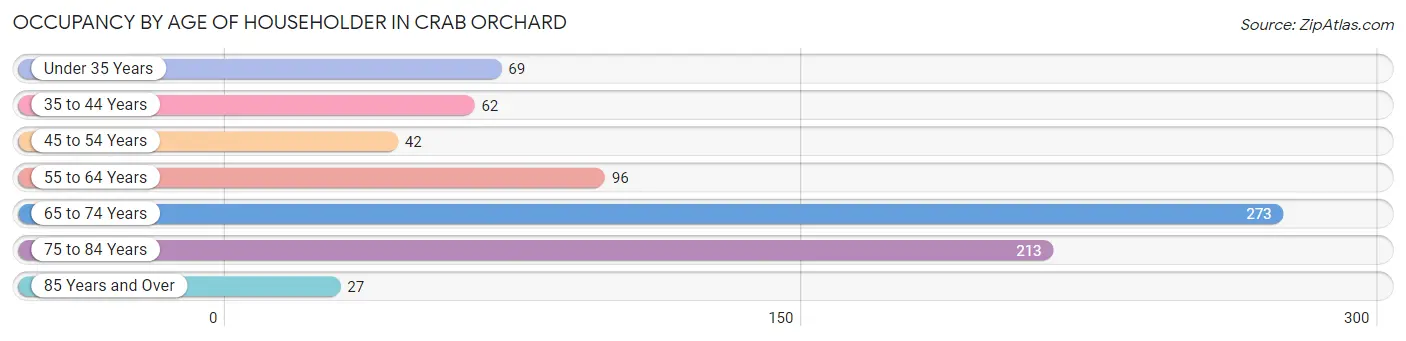
| Age Bracket | # Households | % Households |
| Under 35 Years | 69 | 8.8% |
| 35 to 44 Years | 62 | 7.9% |
| 45 to 54 Years | 42 | 5.4% |
| 55 to 64 Years | 96 | 12.3% |
| 65 to 74 Years | 273 | 34.9% |
| 75 to 84 Years | 213 | 27.2% |
| 85 Years and Over | 27 | 3.5% |
| Total | 782 | 100.0% |
Housing Finances in Crab Orchard
Median Income by Occupancy in Crab Orchard
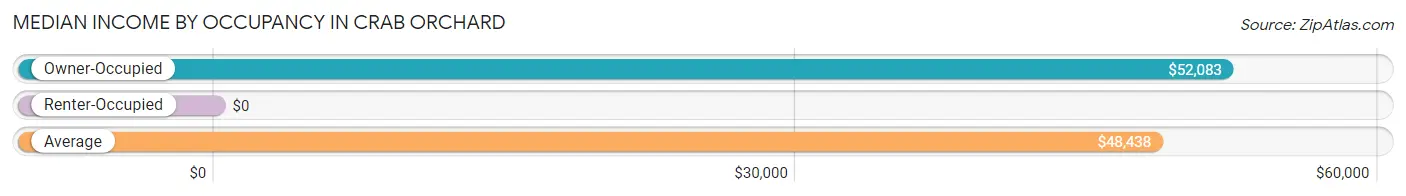
| Occupancy Type | # Households | Median Income |
| Owner-Occupied | 655 (83.8%) | $52,083 |
| Renter-Occupied | 127 (16.2%) | $0 |
| Average | 782 (100.0%) | $48,438 |
Occupancy by Householder Income Bracket in Crab Orchard
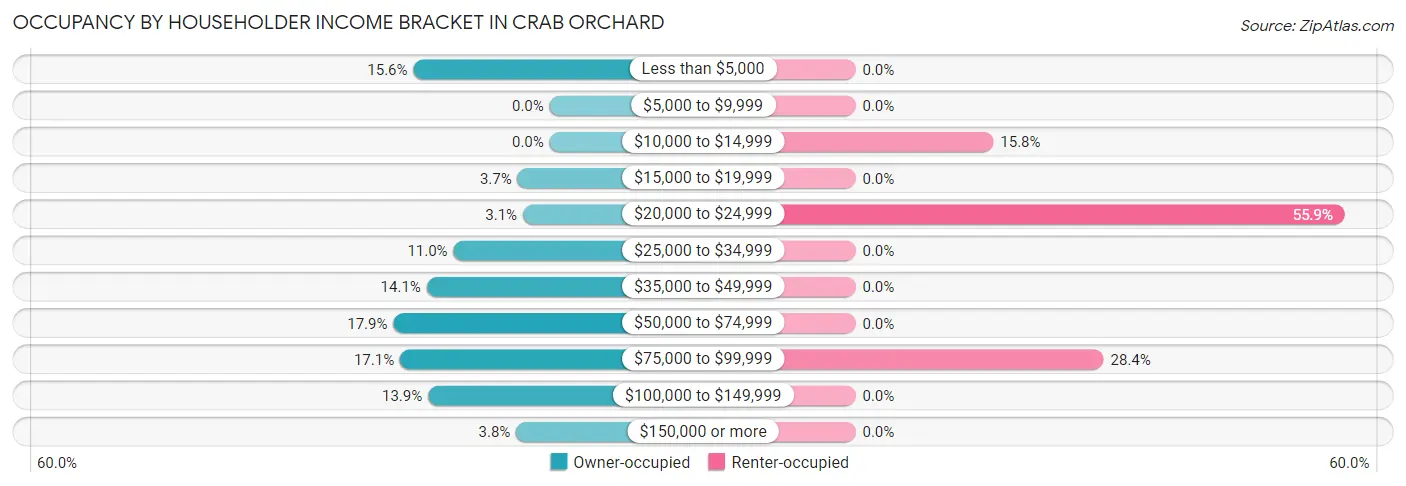
| Income Bracket | Owner-occupied | Renter-occupied |
| Less than $5,000 | 102 (15.6%) | 0 (0.0%) |
| $5,000 to $9,999 | 0 (0.0%) | 0 (0.0%) |
| $10,000 to $14,999 | 0 (0.0%) | 20 (15.8%) |
| $15,000 to $19,999 | 24 (3.7%) | 0 (0.0%) |
| $20,000 to $24,999 | 20 (3.0%) | 71 (55.9%) |
| $25,000 to $34,999 | 72 (11.0%) | 0 (0.0%) |
| $35,000 to $49,999 | 92 (14.1%) | 0 (0.0%) |
| $50,000 to $74,999 | 117 (17.9%) | 0 (0.0%) |
| $75,000 to $99,999 | 112 (17.1%) | 36 (28.3%) |
| $100,000 to $149,999 | 91 (13.9%) | 0 (0.0%) |
| $150,000 or more | 25 (3.8%) | 0 (0.0%) |
| Total | 655 (100.0%) | 127 (100.0%) |
Monthly Housing Cost Tiers in Crab Orchard
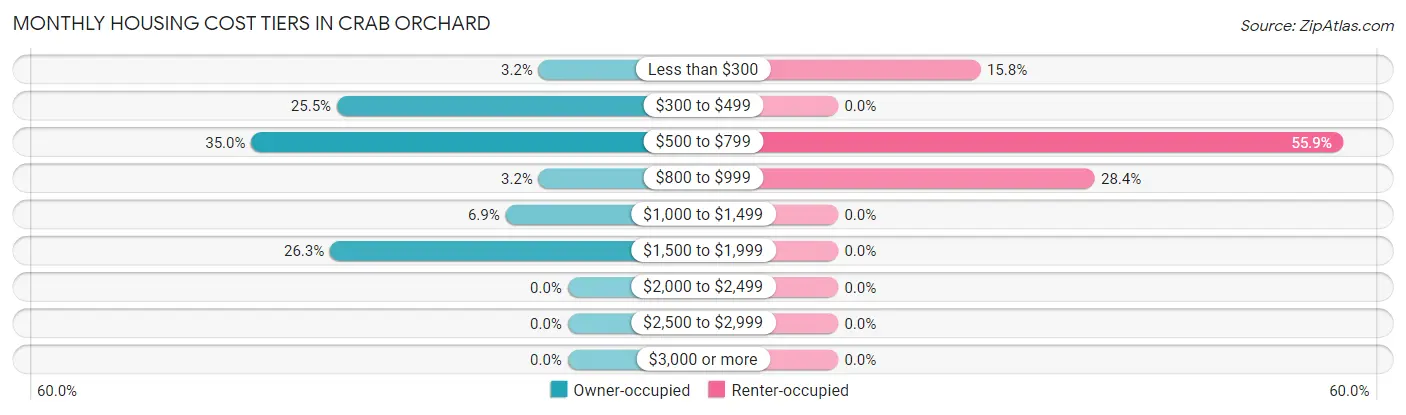
| Monthly Cost | Owner-occupied | Renter-occupied |
| Less than $300 | 21 (3.2%) | 20 (15.8%) |
| $300 to $499 | 167 (25.5%) | 0 (0.0%) |
| $500 to $799 | 229 (35.0%) | 71 (55.9%) |
| $800 to $999 | 21 (3.2%) | 36 (28.3%) |
| $1,000 to $1,499 | 45 (6.9%) | 0 (0.0%) |
| $1,500 to $1,999 | 172 (26.3%) | 0 (0.0%) |
| $2,000 to $2,499 | 0 (0.0%) | 0 (0.0%) |
| $2,500 to $2,999 | 0 (0.0%) | 0 (0.0%) |
| $3,000 or more | 0 (0.0%) | 0 (0.0%) |
| Total | 655 (100.0%) | 127 (100.0%) |
Physical Housing Characteristics in Crab Orchard
Housing Structures in Crab Orchard
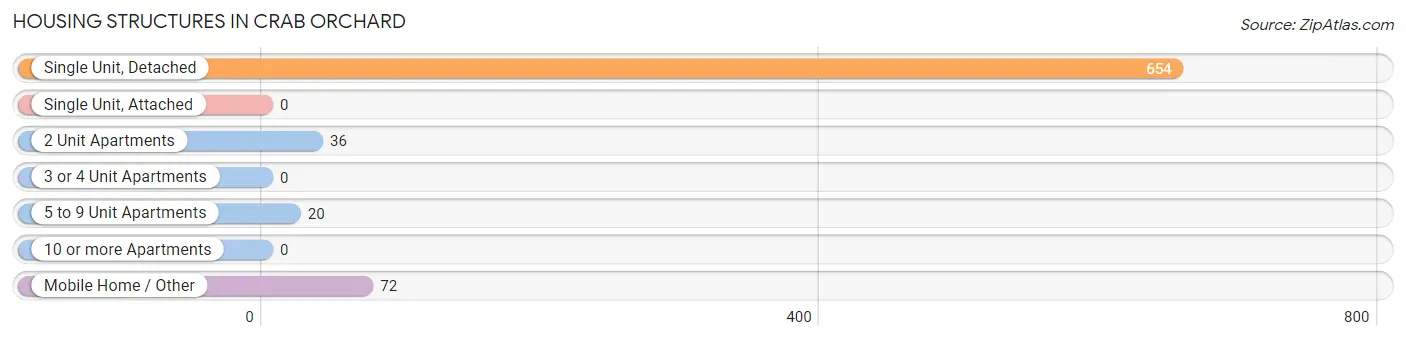
| Structure Type | # Housing Units | % Housing Units |
| Single Unit, Detached | 654 | 83.6% |
| Single Unit, Attached | 0 | 0.0% |
| 2 Unit Apartments | 36 | 4.6% |
| 3 or 4 Unit Apartments | 0 | 0.0% |
| 5 to 9 Unit Apartments | 20 | 2.6% |
| 10 or more Apartments | 0 | 0.0% |
| Mobile Home / Other | 72 | 9.2% |
| Total | 782 | 100.0% |
Housing Structures by Occupancy in Crab Orchard
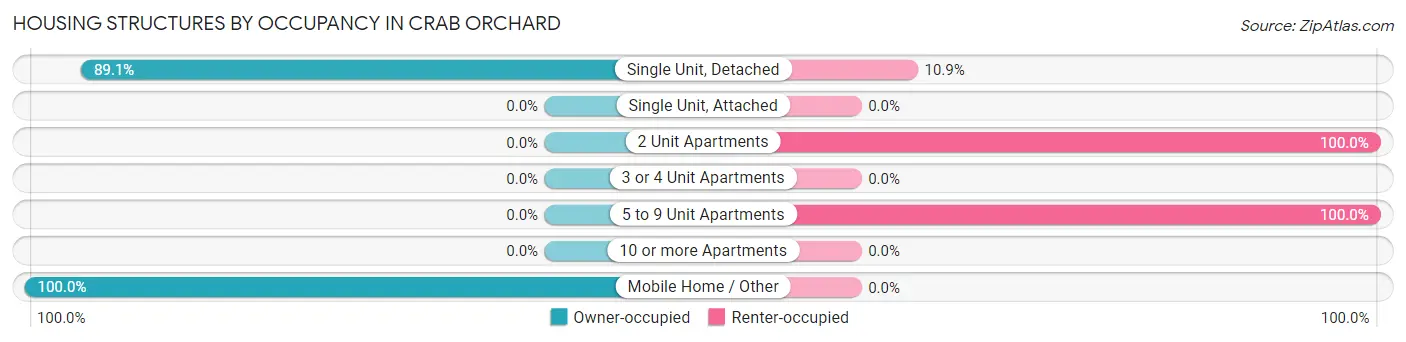
| Structure Type | Owner-occupied | Renter-occupied |
| Single Unit, Detached | 583 (89.1%) | 71 (10.9%) |
| Single Unit, Attached | 0 (0.0%) | 0 (0.0%) |
| 2 Unit Apartments | 0 (0.0%) | 36 (100.0%) |
| 3 or 4 Unit Apartments | 0 (0.0%) | 0 (0.0%) |
| 5 to 9 Unit Apartments | 0 (0.0%) | 20 (100.0%) |
| 10 or more Apartments | 0 (0.0%) | 0 (0.0%) |
| Mobile Home / Other | 72 (100.0%) | 0 (0.0%) |
| Total | 655 (83.8%) | 127 (16.2%) |
Housing Structures by Number of Rooms in Crab Orchard
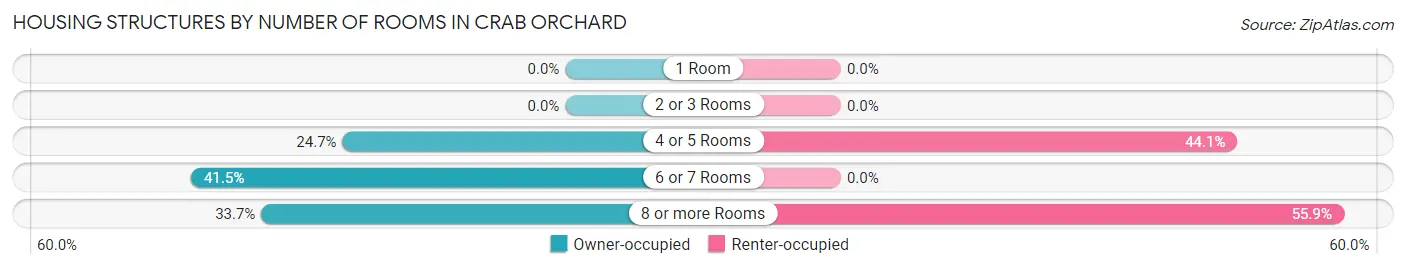
| Number of Rooms | Owner-occupied | Renter-occupied |
| 1 Room | 0 (0.0%) | 0 (0.0%) |
| 2 or 3 Rooms | 0 (0.0%) | 0 (0.0%) |
| 4 or 5 Rooms | 162 (24.7%) | 56 (44.1%) |
| 6 or 7 Rooms | 272 (41.5%) | 0 (0.0%) |
| 8 or more Rooms | 221 (33.7%) | 71 (55.9%) |
| Total | 655 (100.0%) | 127 (100.0%) |
Housing Structure by Heating Type in Crab Orchard
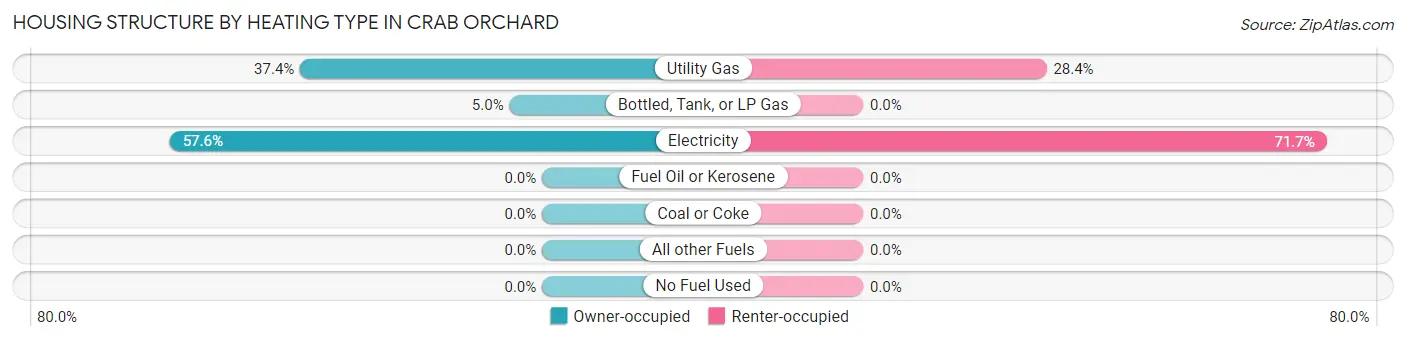
| Heating Type | Owner-occupied | Renter-occupied |
| Utility Gas | 245 (37.4%) | 36 (28.3%) |
| Bottled, Tank, or LP Gas | 33 (5.0%) | 0 (0.0%) |
| Electricity | 377 (57.6%) | 91 (71.7%) |
| Fuel Oil or Kerosene | 0 (0.0%) | 0 (0.0%) |
| Coal or Coke | 0 (0.0%) | 0 (0.0%) |
| All other Fuels | 0 (0.0%) | 0 (0.0%) |
| No Fuel Used | 0 (0.0%) | 0 (0.0%) |
| Total | 655 (100.0%) | 127 (100.0%) |
Household Vehicle Usage in Crab Orchard
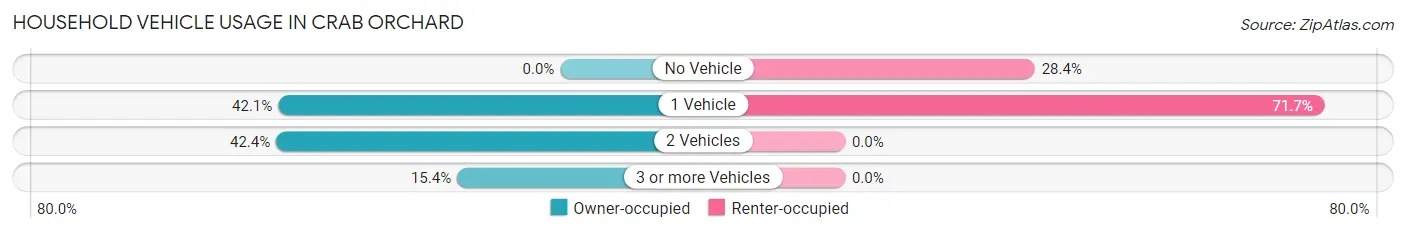
| Vehicles per Household | Owner-occupied | Renter-occupied |
| No Vehicle | 0 (0.0%) | 36 (28.3%) |
| 1 Vehicle | 276 (42.1%) | 91 (71.7%) |
| 2 Vehicles | 278 (42.4%) | 0 (0.0%) |
| 3 or more Vehicles | 101 (15.4%) | 0 (0.0%) |
| Total | 655 (100.0%) | 127 (100.0%) |
Real Estate & Mortgages in Crab Orchard
Real Estate and Mortgage Overview in Crab Orchard
| Characteristic | Without Mortgage | With Mortgage |
| Housing Units | 375 | 280 |
| Median Property Value | $172,700 | $207,400 |
| Median Household Income | - | - |
| Monthly Housing Costs | $497 | $0 |
| Real Estate Taxes | $587 | $12 |
Property Value by Mortgage Status in Crab Orchard
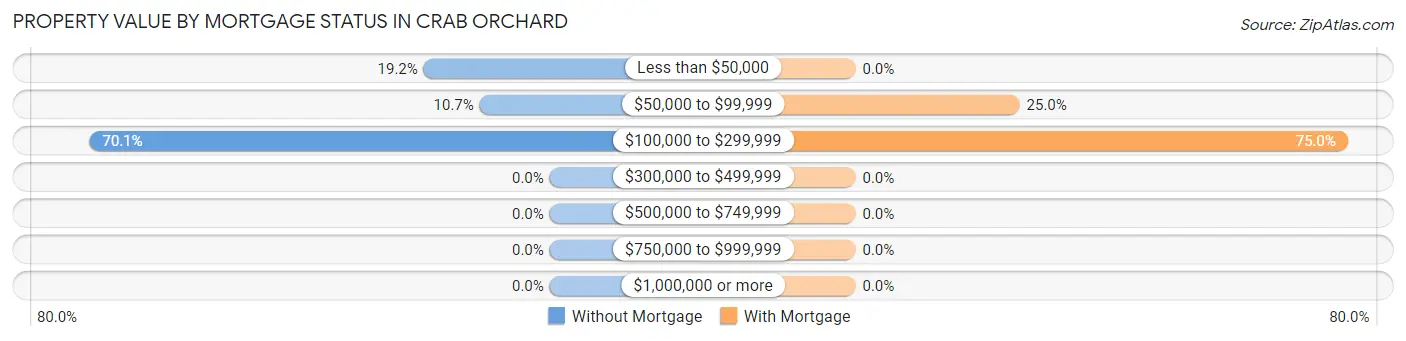
| Property Value | Without Mortgage | With Mortgage |
| Less than $50,000 | 72 (19.2%) | 0 (0.0%) |
| $50,000 to $99,999 | 40 (10.7%) | 70 (25.0%) |
| $100,000 to $299,999 | 263 (70.1%) | 210 (75.0%) |
| $300,000 to $499,999 | 0 (0.0%) | 0 (0.0%) |
| $500,000 to $749,999 | 0 (0.0%) | 0 (0.0%) |
| $750,000 to $999,999 | 0 (0.0%) | 0 (0.0%) |
| $1,000,000 or more | 0 (0.0%) | 0 (0.0%) |
| Total | 375 (100.0%) | 280 (100.0%) |
Household Income by Mortgage Status in Crab Orchard
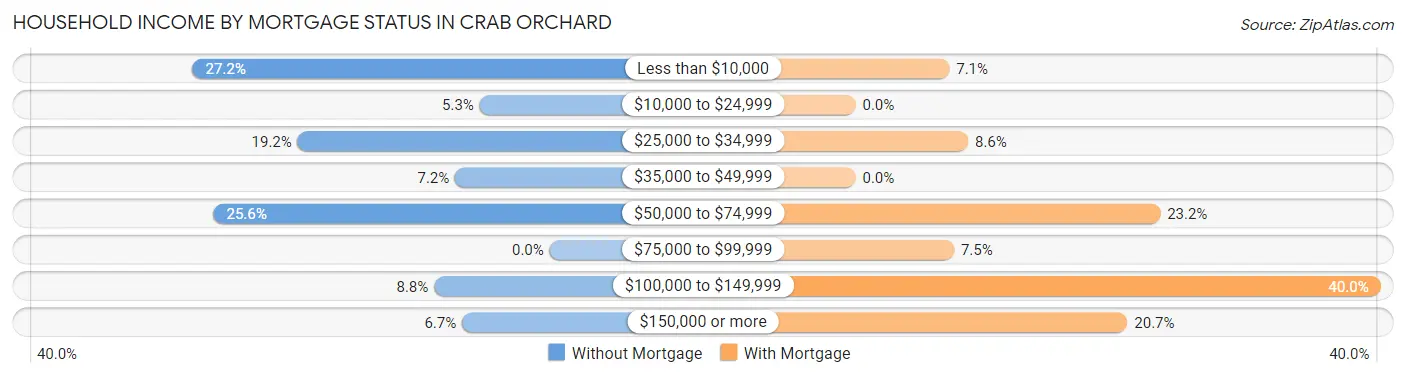
| Household Income | Without Mortgage | With Mortgage |
| Less than $10,000 | 102 (27.2%) | 20 (7.1%) |
| $10,000 to $24,999 | 20 (5.3%) | 0 (0.0%) |
| $25,000 to $34,999 | 72 (19.2%) | 24 (8.6%) |
| $35,000 to $49,999 | 27 (7.2%) | 0 (0.0%) |
| $50,000 to $74,999 | 96 (25.6%) | 65 (23.2%) |
| $75,000 to $99,999 | 0 (0.0%) | 21 (7.5%) |
| $100,000 to $149,999 | 33 (8.8%) | 112 (40.0%) |
| $150,000 or more | 25 (6.7%) | 58 (20.7%) |
| Total | 375 (100.0%) | 280 (100.0%) |
Property Value to Household Income Ratio in Crab Orchard
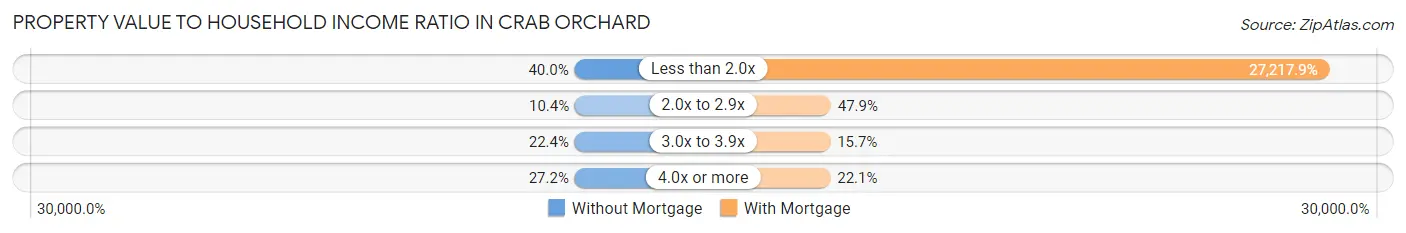
| Value-to-Income Ratio | Without Mortgage | With Mortgage |
| Less than 2.0x | 150 (40.0%) | 76,210 (27,217.9%) |
| 2.0x to 2.9x | 39 (10.4%) | 134 (47.9%) |
| 3.0x to 3.9x | 84 (22.4%) | 44 (15.7%) |
| 4.0x or more | 102 (27.2%) | 62 (22.1%) |
| Total | 375 (100.0%) | 280 (100.0%) |
Real Estate Taxes by Mortgage Status in Crab Orchard
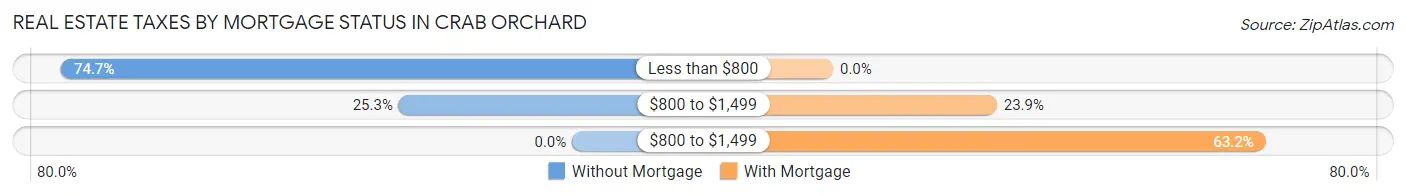
| Property Taxes | Without Mortgage | With Mortgage |
| Less than $800 | 280 (74.7%) | 0 (0.0%) |
| $800 to $1,499 | 95 (25.3%) | 67 (23.9%) |
| $800 to $1,499 | 0 (0.0%) | 177 (63.2%) |
| Total | 375 (100.0%) | 280 (100.0%) |
Health & Disability in Crab Orchard
Health Insurance Coverage by Age in Crab Orchard
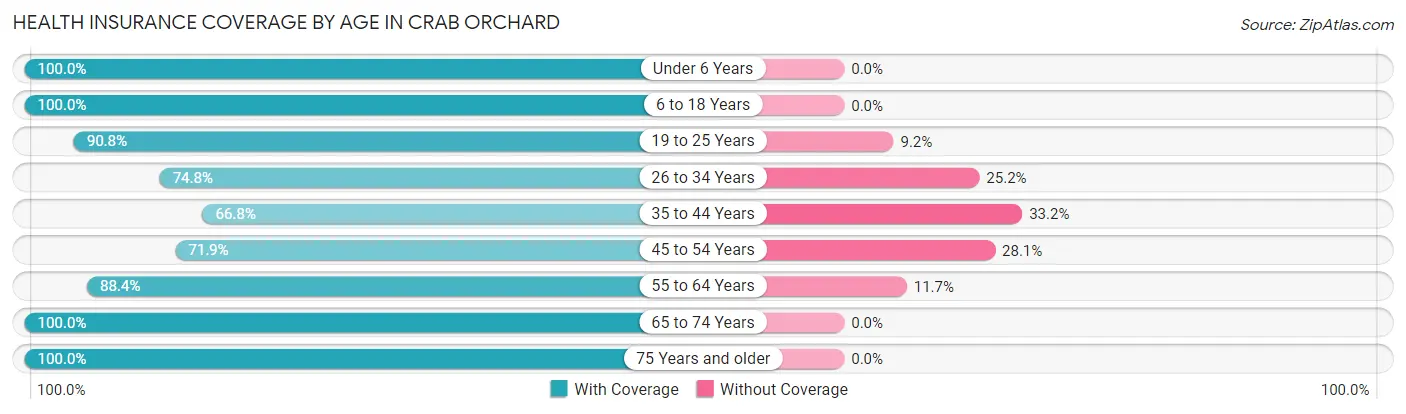
| Age Bracket | With Coverage | Without Coverage |
| Under 6 Years | 163 (100.0%) | 0 (0.0%) |
| 6 to 18 Years | 215 (100.0%) | 0 (0.0%) |
| 19 to 25 Years | 178 (90.8%) | 18 (9.2%) |
| 26 to 34 Years | 190 (74.8%) | 64 (25.2%) |
| 35 to 44 Years | 149 (66.8%) | 74 (33.2%) |
| 45 to 54 Years | 46 (71.9%) | 18 (28.1%) |
| 55 to 64 Years | 220 (88.3%) | 29 (11.7%) |
| 65 to 74 Years | 287 (100.0%) | 0 (0.0%) |
| 75 Years and older | 295 (100.0%) | 0 (0.0%) |
| Total | 1,743 (89.6%) | 203 (10.4%) |
Health Insurance Coverage by Citizenship Status in Crab Orchard
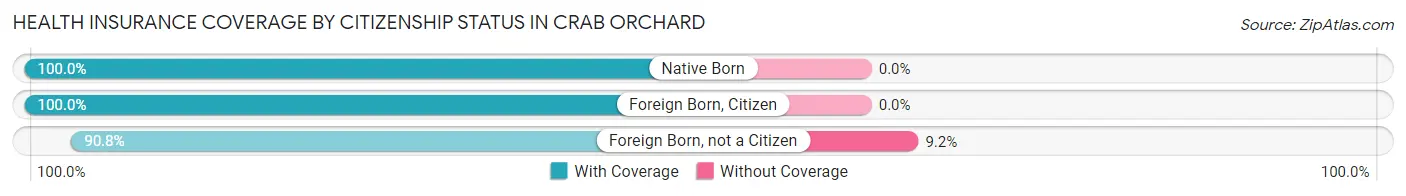
| Citizenship Status | With Coverage | Without Coverage |
| Native Born | 163 (100.0%) | 0 (0.0%) |
| Foreign Born, Citizen | 215 (100.0%) | 0 (0.0%) |
| Foreign Born, not a Citizen | 178 (90.8%) | 18 (9.2%) |
Health Insurance Coverage by Household Income in Crab Orchard
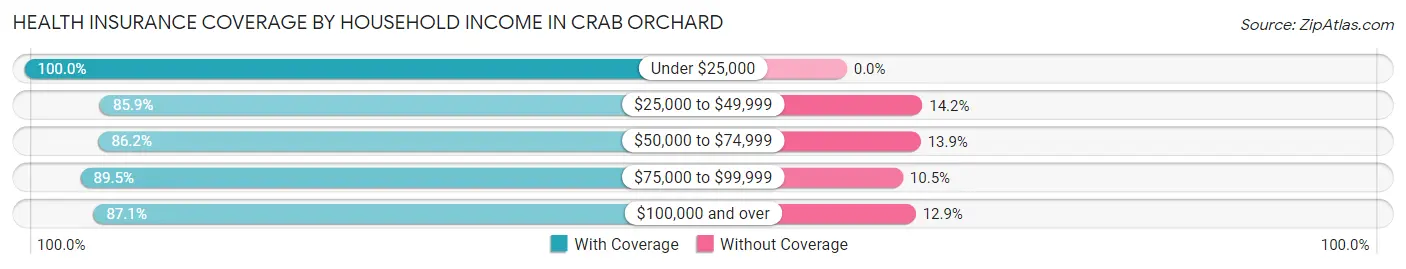
| Household Income | With Coverage | Without Coverage |
| Under $25,000 | 299 (100.0%) | 0 (0.0%) |
| $25,000 to $49,999 | 176 (85.9%) | 29 (14.1%) |
| $50,000 to $74,999 | 224 (86.2%) | 36 (13.9%) |
| $75,000 to $99,999 | 545 (89.5%) | 64 (10.5%) |
| $100,000 and over | 499 (87.1%) | 74 (12.9%) |
Public vs Private Health Insurance Coverage by Age in Crab Orchard
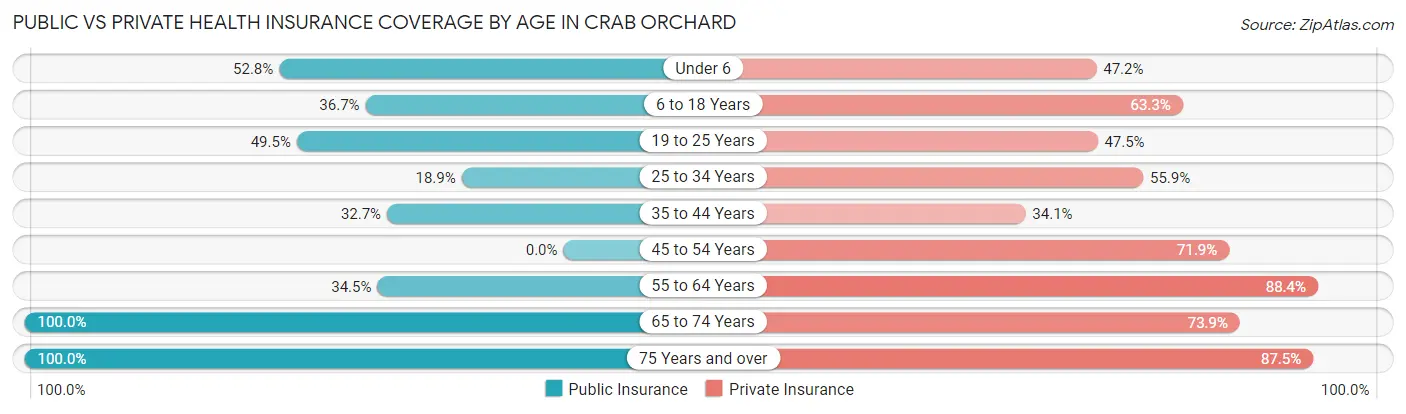
| Age Bracket | Public Insurance | Private Insurance |
| Under 6 | 86 (52.8%) | 77 (47.2%) |
| 6 to 18 Years | 79 (36.7%) | 136 (63.3%) |
| 19 to 25 Years | 97 (49.5%) | 93 (47.4%) |
| 25 to 34 Years | 48 (18.9%) | 142 (55.9%) |
| 35 to 44 Years | 73 (32.7%) | 76 (34.1%) |
| 45 to 54 Years | 0 (0.0%) | 46 (71.9%) |
| 55 to 64 Years | 86 (34.5%) | 220 (88.3%) |
| 65 to 74 Years | 287 (100.0%) | 212 (73.9%) |
| 75 Years and over | 295 (100.0%) | 258 (87.5%) |
| Total | 1,051 (54.0%) | 1,260 (64.7%) |
Disability Status by Sex by Age in Crab Orchard
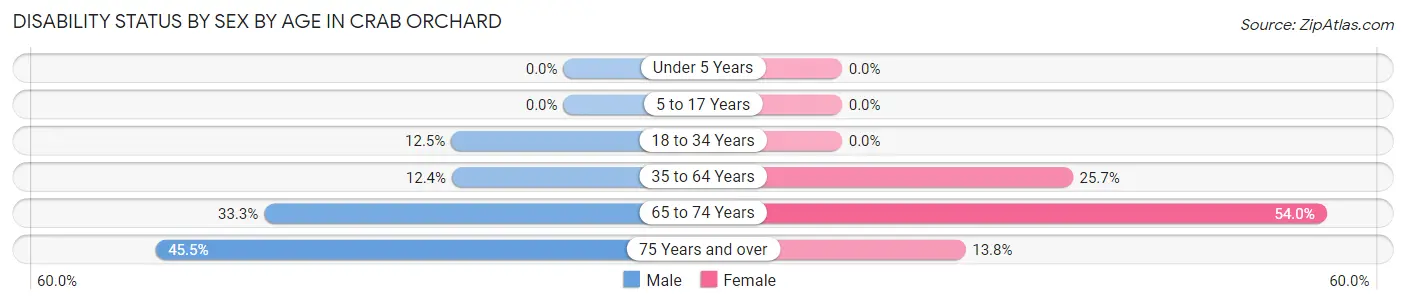
| Age Bracket | Male | Female |
| Under 5 Years | 0 (0.0%) | 0 (0.0%) |
| 5 to 17 Years | 0 (0.0%) | 0 (0.0%) |
| 18 to 34 Years | 18 (12.5%) | 0 (0.0%) |
| 35 to 64 Years | 40 (12.4%) | 55 (25.7%) |
| 65 to 74 Years | 58 (33.3%) | 61 (54.0%) |
| 75 Years and over | 25 (45.5%) | 33 (13.8%) |
Disability Class by Sex by Age in Crab Orchard
Disability Class: Hearing Difficulty
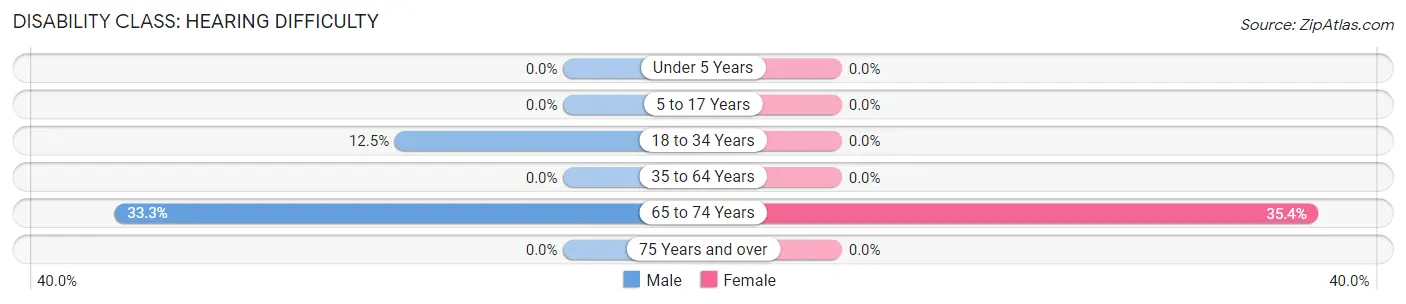
| Age Bracket | Male | Female |
| Under 5 Years | 0 (0.0%) | 0 (0.0%) |
| 5 to 17 Years | 0 (0.0%) | 0 (0.0%) |
| 18 to 34 Years | 18 (12.5%) | 0 (0.0%) |
| 35 to 64 Years | 0 (0.0%) | 0 (0.0%) |
| 65 to 74 Years | 58 (33.3%) | 40 (35.4%) |
| 75 Years and over | 0 (0.0%) | 0 (0.0%) |
Disability Class: Vision Difficulty
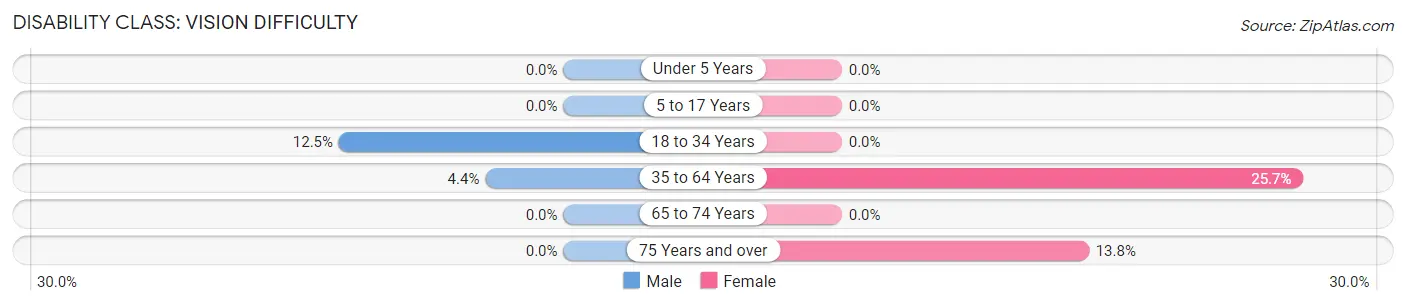
| Age Bracket | Male | Female |
| Under 5 Years | 0 (0.0%) | 0 (0.0%) |
| 5 to 17 Years | 0 (0.0%) | 0 (0.0%) |
| 18 to 34 Years | 18 (12.5%) | 0 (0.0%) |
| 35 to 64 Years | 14 (4.3%) | 55 (25.7%) |
| 65 to 74 Years | 0 (0.0%) | 0 (0.0%) |
| 75 Years and over | 0 (0.0%) | 33 (13.8%) |
Disability Class: Cognitive Difficulty

| Age Bracket | Male | Female |
| 5 to 17 Years | 0 (0.0%) | 0 (0.0%) |
| 18 to 34 Years | 18 (12.5%) | 0 (0.0%) |
| 35 to 64 Years | 0 (0.0%) | 0 (0.0%) |
| 65 to 74 Years | 0 (0.0%) | 0 (0.0%) |
| 75 Years and over | 0 (0.0%) | 0 (0.0%) |
Disability Class: Ambulatory Difficulty
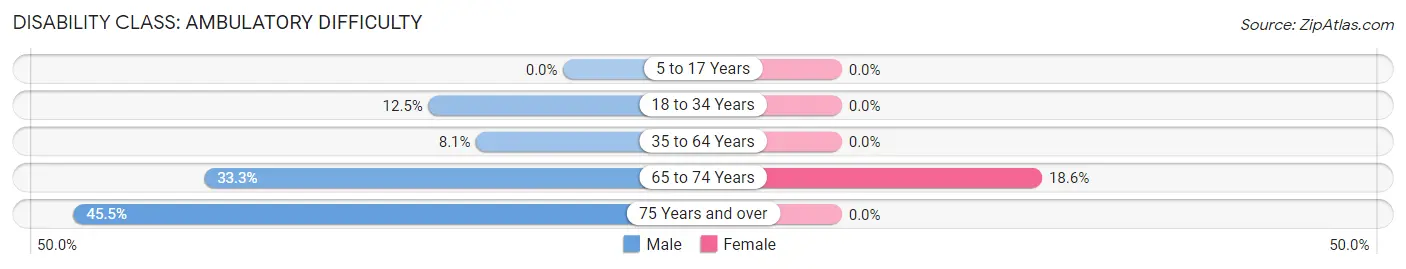
| Age Bracket | Male | Female |
| 5 to 17 Years | 0 (0.0%) | 0 (0.0%) |
| 18 to 34 Years | 18 (12.5%) | 0 (0.0%) |
| 35 to 64 Years | 26 (8.1%) | 0 (0.0%) |
| 65 to 74 Years | 58 (33.3%) | 21 (18.6%) |
| 75 Years and over | 25 (45.5%) | 0 (0.0%) |
Disability Class: Self-Care Difficulty
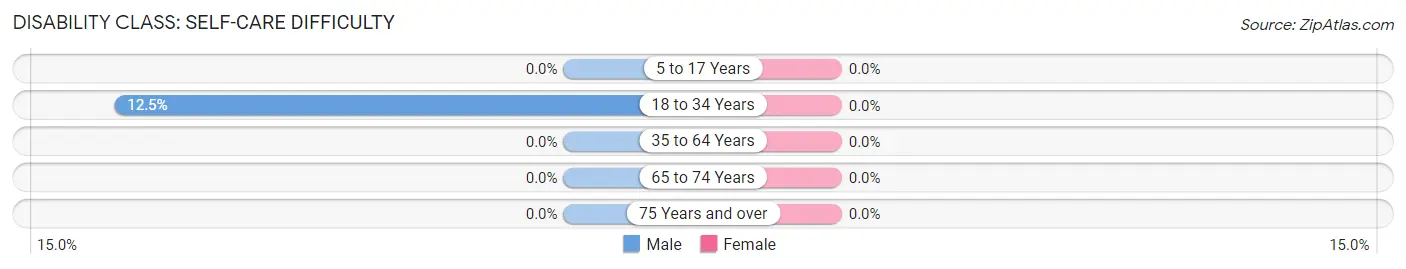
| Age Bracket | Male | Female |
| 5 to 17 Years | 0 (0.0%) | 0 (0.0%) |
| 18 to 34 Years | 18 (12.5%) | 0 (0.0%) |
| 35 to 64 Years | 0 (0.0%) | 0 (0.0%) |
| 65 to 74 Years | 0 (0.0%) | 0 (0.0%) |
| 75 Years and over | 0 (0.0%) | 0 (0.0%) |
Technology Access in Crab Orchard
Computing Device Access in Crab Orchard
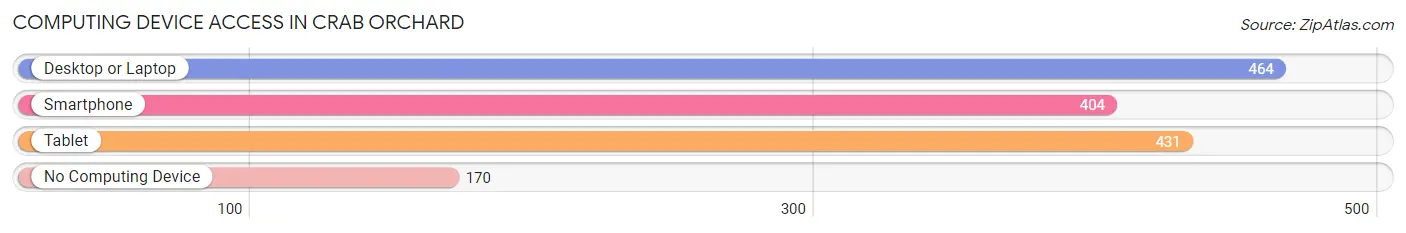
| Device Type | # Households | % Households |
| Desktop or Laptop | 464 | 59.3% |
| Smartphone | 404 | 51.7% |
| Tablet | 431 | 55.1% |
| No Computing Device | 170 | 21.7% |
| Total | 782 | 100.0% |
Internet Access in Crab Orchard
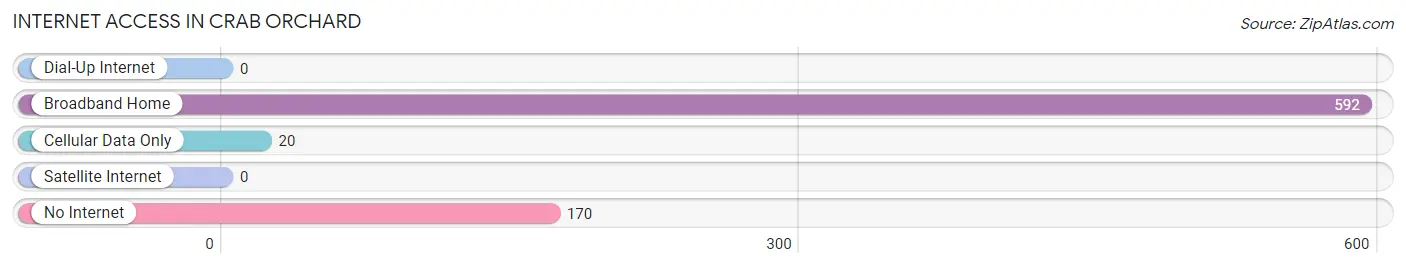
| Internet Type | # Households | % Households |
| Dial-Up Internet | 0 | 0.0% |
| Broadband Home | 592 | 75.7% |
| Cellular Data Only | 20 | 2.6% |
| Satellite Internet | 0 | 0.0% |
| No Internet | 170 | 21.7% |
| Total | 782 | 100.0% |
Crab Orchard Summary
Crab Orchard is a small unincorporated community located in the eastern panhandle of West Virginia. It is situated in the northern part of Berkeley County, near the Potomac River. The community is located approximately 10 miles south of Martinsburg and about 25 miles northwest of Washington, D.C.
History
Crab Orchard was first settled in the late 1700s by German immigrants. The community was named after the abundance of crabapple trees in the area. The first post office was established in 1820.
In the early 1800s, Crab Orchard was a thriving agricultural community. The area was known for its apple orchards, as well as its production of wheat, corn, and other grains. The community also had a number of mills, including a grist mill, a saw mill, and a woolen mill.
In the late 1800s, the Baltimore and Ohio Railroad built a line through the area, connecting Crab Orchard to Martinsburg and other nearby towns. This allowed the community to become more connected to the outside world and helped to spur economic growth.
Geography
Crab Orchard is located in the northern part of Berkeley County, near the Potomac River. The community is situated at an elevation of 1,000 feet above sea level. The area is mostly rural, with rolling hills and farmland.
The climate in Crab Orchard is temperate, with hot summers and cold winters. The average annual temperature is around 50 degrees Fahrenheit. The average annual precipitation is around 40 inches.
Economy
Crab Orchard’s economy is largely based on agriculture. The area is known for its apple orchards, as well as its production of wheat, corn, and other grains. The community also has a number of small businesses, including restaurants, stores, and service providers.
The community is also home to a number of manufacturing companies, including a furniture factory and a plastics factory. The area is also home to a number of government agencies, including the Berkeley County Sheriff’s Office and the West Virginia State Police.
Demographics
As of the 2010 census, the population of Crab Orchard was 1,845. The racial makeup of the community was 94.3% White, 2.7% African American, 0.3% Native American, 0.3% Asian, 0.1% Pacific Islander, and 2.3% from other races.
The median household income in Crab Orchard was $41,250, and the median family income was $50,000. The per capita income was $20,845. About 11.3% of the population was below the poverty line.
Conclusion
Crab Orchard is a small unincorporated community located in the eastern panhandle of West Virginia. It is situated in the northern part of Berkeley County, near the Potomac River. The community was first settled in the late 1700s by German immigrants and was named after the abundance of crabapple trees in the area. The economy of Crab Orchard is largely based on agriculture, with apple orchards, wheat, corn, and other grains being produced in the area. The community also has a number of small businesses, manufacturing companies, and government agencies. As of the 2010 census, the population of Crab Orchard was 1,845. The median household income in Crab Orchard was $41,250, and the median family income was $50,000.
Common Questions
What is Per Capita Income in Crab Orchard?
Per Capita income in Crab Orchard is $25,545.
What is the Median Family Income in Crab Orchard?
Median Family Income in Crab Orchard is $76,492.
What is the Median Household income in Crab Orchard?
Median Household Income in Crab Orchard is $48,438.
What is Income or Wage Gap in Crab Orchard?
Income or Wage Gap in Crab Orchard is 1.0%.
Women in Crab Orchard earn 99.0 cents for every dollar earned by a man.
What is Inequality or Gini Index in Crab Orchard?
Inequality or Gini Index in Crab Orchard is 0.42.
What is the Total Population of Crab Orchard?
Total Population of Crab Orchard is 1,946.
What is the Total Male Population of Crab Orchard?
Total Male Population of Crab Orchard is 813.
What is the Total Female Population of Crab Orchard?
Total Female Population of Crab Orchard is 1,133.
What is the Ratio of Males per 100 Females in Crab Orchard?
There are 71.76 Males per 100 Females in Crab Orchard.
What is the Ratio of Females per 100 Males in Crab Orchard?
There are 139.36 Females per 100 Males in Crab Orchard.
What is the Median Population Age in Crab Orchard?
Median Population Age in Crab Orchard is 39.9 Years.
What is the Average Family Size in Crab Orchard
Average Family Size in Crab Orchard is 3.6 People.
What is the Average Household Size in Crab Orchard
Average Household Size in Crab Orchard is 2.5 People.
How Large is the Labor Force in Crab Orchard?
There are 868 People in the Labor Forcein in Crab Orchard.
What is the Percentage of People in the Labor Force in Crab Orchard?
52.0% of People are in the Labor Force in Crab Orchard.
What is the Unemployment Rate in Crab Orchard?
Unemployment Rate in Crab Orchard is 23.3%.