Montgomery, WV Map & Demographics
Montgomery Map
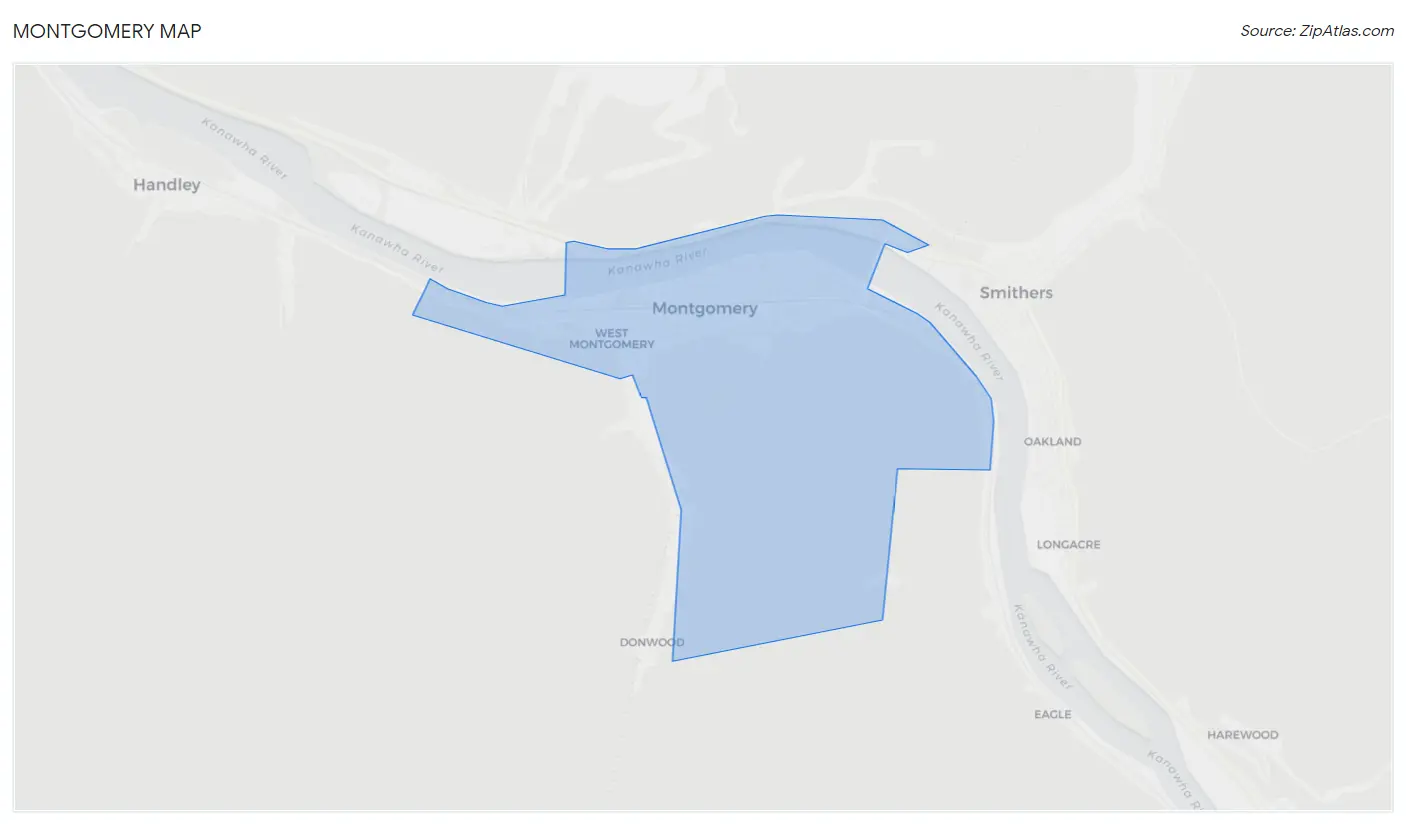
Montgomery Overview
$17,841
PER CAPITA INCOME
$38,393
AVG FAMILY INCOME
$27,174
AVG HOUSEHOLD INCOME
37.3%
WAGE / INCOME GAP [ % ]
62.7¢/ $1
WAGE / INCOME GAP [ $ ]
$17,364
FAMILY INCOME DEFICIT
0.52
INEQUALITY / GINI INDEX
1,706
TOTAL POPULATION
656
MALE POPULATION
1,050
FEMALE POPULATION
62.48
MALES / 100 FEMALES
160.06
FEMALES / 100 MALES
38.9
MEDIAN AGE
3.6
AVG FAMILY SIZE
2.3
AVG HOUSEHOLD SIZE
582
LABOR FORCE [ PEOPLE ]
42.2%
PERCENT IN LABOR FORCE
8.3%
UNEMPLOYMENT RATE
Montgomery Zip Codes
Montgomery Area Codes
Income in Montgomery
Income Overview in Montgomery
Per Capita Income in Montgomery is $17,841, while median incomes of families and households are $38,393 and $27,174 respectively.
| Characteristic | Number | Measure |
| Per Capita Income | 1,706 | $17,841 |
| Median Family Income | 285 | $38,393 |
| Mean Family Income | 285 | $57,279 |
| Median Household Income | 650 | $27,174 |
| Mean Household Income | 650 | $41,573 |
| Income Deficit | 285 | $17,364 |
| Wage / Income Gap (%) | 1,706 | 37.27% |
| Wage / Income Gap ($) | 1,706 | 62.73¢ per $1 |
| Gini / Inequality Index | 1,706 | 0.52 |
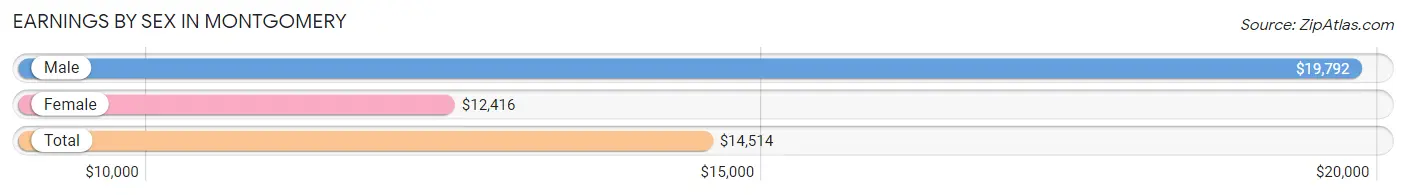
Earnings by Sex in Montgomery
Average Earnings in Montgomery are $14,514, $19,792 for men and $12,416 for women, a difference of 37.3%.
| Sex | Number | Average Earnings |
| Male | 261 (42.2%) | $19,792 |
| Female | 358 (57.8%) | $12,416 |
| Total | 619 (100.0%) | $14,514 |
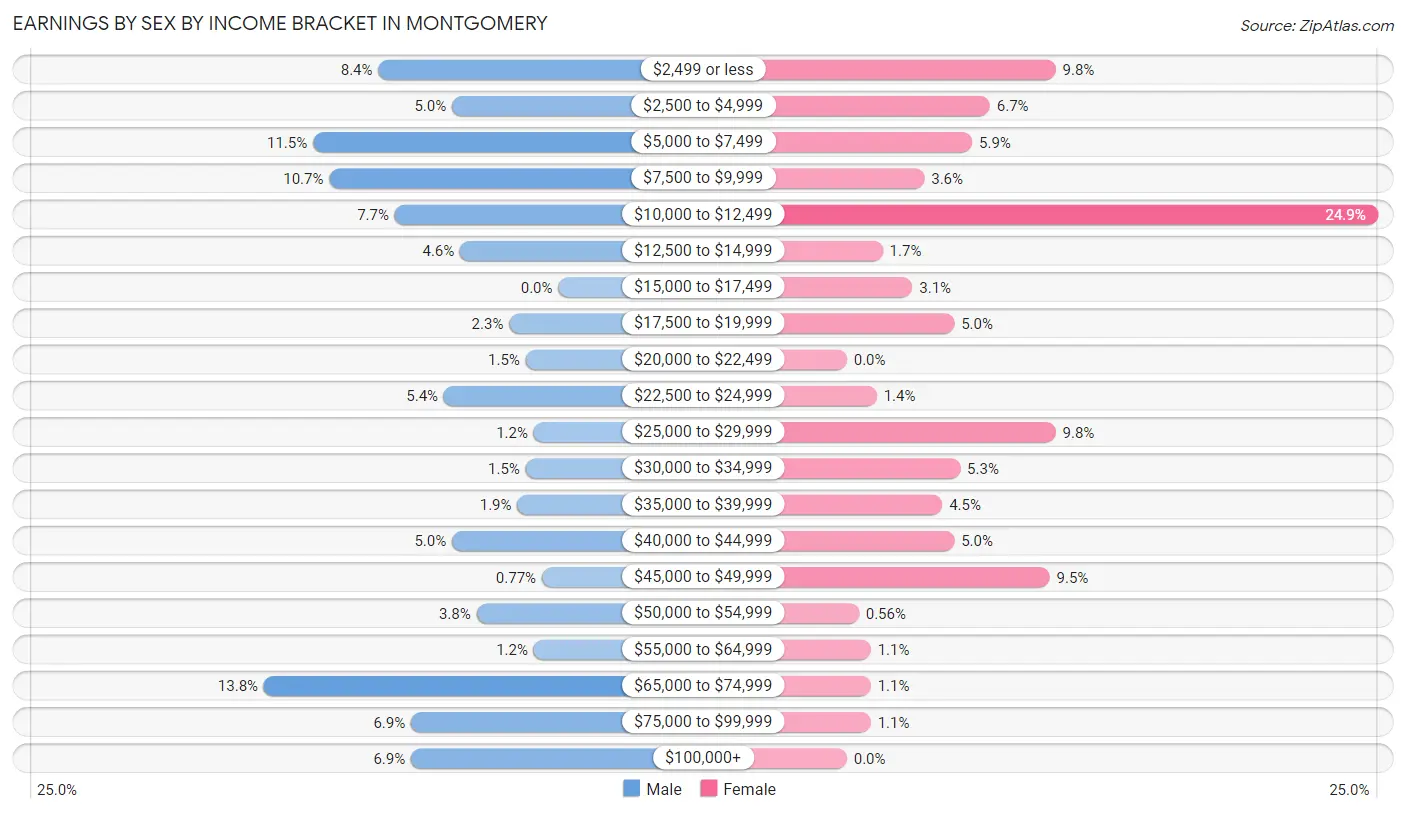
Earnings by Sex by Income Bracket in Montgomery
The most common earnings brackets in Montgomery are $65,000 to $74,999 for men (36 | 13.8%) and $10,000 to $12,499 for women (89 | 24.9%).
| Income | Male | Female |
| $2,499 or less | 22 (8.4%) | 35 (9.8%) |
| $2,500 to $4,999 | 13 (5.0%) | 24 (6.7%) |
| $5,000 to $7,499 | 30 (11.5%) | 21 (5.9%) |
| $7,500 to $9,999 | 28 (10.7%) | 13 (3.6%) |
| $10,000 to $12,499 | 20 (7.7%) | 89 (24.9%) |
| $12,500 to $14,999 | 12 (4.6%) | 6 (1.7%) |
| $15,000 to $17,499 | 0 (0.0%) | 11 (3.1%) |
| $17,500 to $19,999 | 6 (2.3%) | 18 (5.0%) |
| $20,000 to $22,499 | 4 (1.5%) | 0 (0.0%) |
| $22,500 to $24,999 | 14 (5.4%) | 5 (1.4%) |
| $25,000 to $29,999 | 3 (1.1%) | 35 (9.8%) |
| $30,000 to $34,999 | 4 (1.5%) | 19 (5.3%) |
| $35,000 to $39,999 | 5 (1.9%) | 16 (4.5%) |
| $40,000 to $44,999 | 13 (5.0%) | 18 (5.0%) |
| $45,000 to $49,999 | 2 (0.8%) | 34 (9.5%) |
| $50,000 to $54,999 | 10 (3.8%) | 2 (0.6%) |
| $55,000 to $64,999 | 3 (1.1%) | 4 (1.1%) |
| $65,000 to $74,999 | 36 (13.8%) | 4 (1.1%) |
| $75,000 to $99,999 | 18 (6.9%) | 4 (1.1%) |
| $100,000+ | 18 (6.9%) | 0 (0.0%) |
| Total | 261 (100.0%) | 358 (100.0%) |
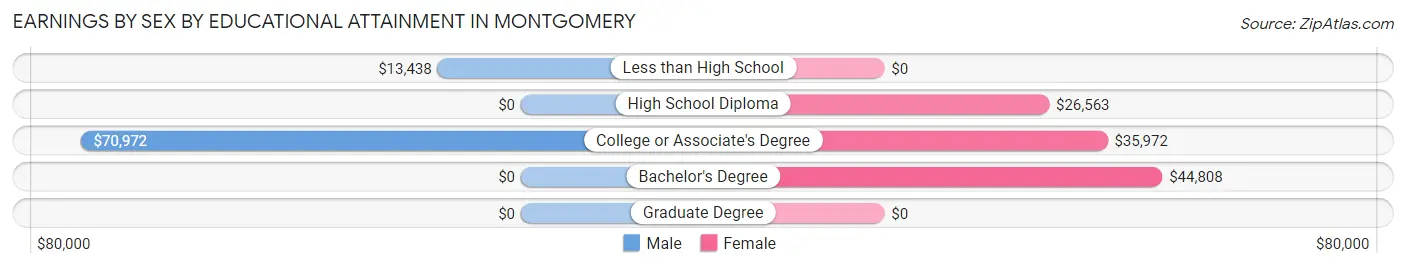
Earnings by Sex by Educational Attainment in Montgomery
Average earnings in Montgomery are $44,615 for men and $31,797 for women, a difference of 28.7%. Men with an educational attainment of college or associate's degree enjoy the highest average annual earnings of $70,972, while those with less than high school education earn the least with $13,438. Women with an educational attainment of bachelor's degree earn the most with the average annual earnings of $44,808, while those with high school diploma education have the smallest earnings of $26,563.
| Educational Attainment | Male Income | Female Income |
| Less than High School | $13,438 | $0 |
| High School Diploma | - | - |
| College or Associate's Degree | $70,972 | $35,972 |
| Bachelor's Degree | - | - |
| Graduate Degree | - | - |
| Total | $44,615 | $31,797 |
Family Income in Montgomery
Family Income Brackets in Montgomery
According to the Montgomery family income data, there are 59 families falling into the $50,000 to $74,999 income range, which is the most common income bracket and makes up 20.7% of all families. Conversely, the $25,000 to $34,999 income bracket is the least frequent group with only 3 families (1.1%) belonging to this category.
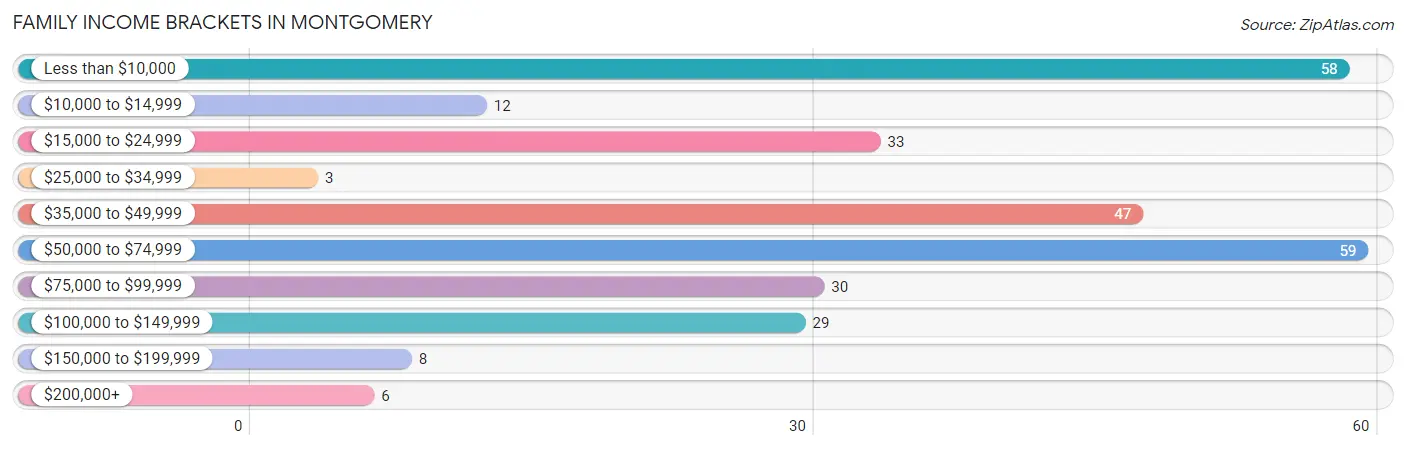
| Income Bracket | # Families | % Families |
| Less than $10,000 | 58 | 20.4% |
| $10,000 to $14,999 | 12 | 4.2% |
| $15,000 to $24,999 | 33 | 11.6% |
| $25,000 to $34,999 | 3 | 1.1% |
| $35,000 to $49,999 | 47 | 16.5% |
| $50,000 to $74,999 | 59 | 20.7% |
| $75,000 to $99,999 | 30 | 10.5% |
| $100,000 to $149,999 | 29 | 10.2% |
| $150,000 to $199,999 | 8 | 2.8% |
| $200,000+ | 6 | 2.1% |
Family Income by Famaliy Size in Montgomery
2-person families (117 | 41.0%) account for the highest median family income in Montgomery with $81,875 per family, while 2-person families (117 | 41.0%) have the highest median income of $40,938 per family member.
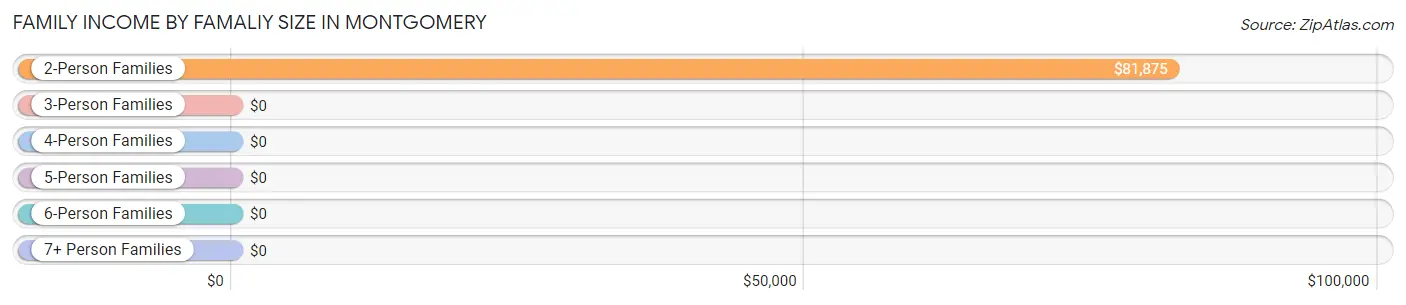
| Income Bracket | # Families | Median Income |
| 2-Person Families | 117 (41.0%) | $81,875 |
| 3-Person Families | 83 (29.1%) | $0 |
| 4-Person Families | 43 (15.1%) | $0 |
| 5-Person Families | 28 (9.8%) | $0 |
| 6-Person Families | 14 (4.9%) | $0 |
| 7+ Person Families | 0 (0.0%) | $0 |
| Total | 285 (100.0%) | $38,393 |
Family Income by Number of Earners in Montgomery
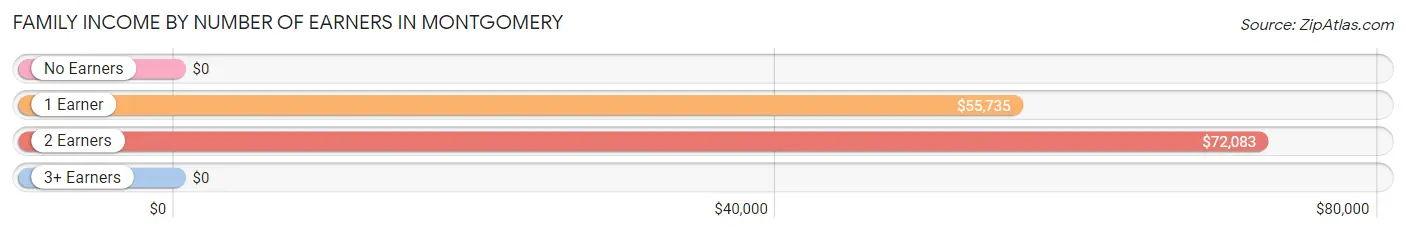
| Number of Earners | # Families | Median Income |
| No Earners | 114 (40.0%) | $0 |
| 1 Earner | 116 (40.7%) | $55,735 |
| 2 Earners | 55 (19.3%) | $72,083 |
| 3+ Earners | 0 (0.0%) | $0 |
| Total | 285 (100.0%) | $38,393 |
Household Income in Montgomery
Household Income Brackets in Montgomery
With 111 households falling in the category, the $50,000 to $74,999 income range is the most frequent in Montgomery, accounting for 17.1% of all households. In contrast, only 6 households (0.9%) fall into the $200,000+ income bracket, making it the least populous group.
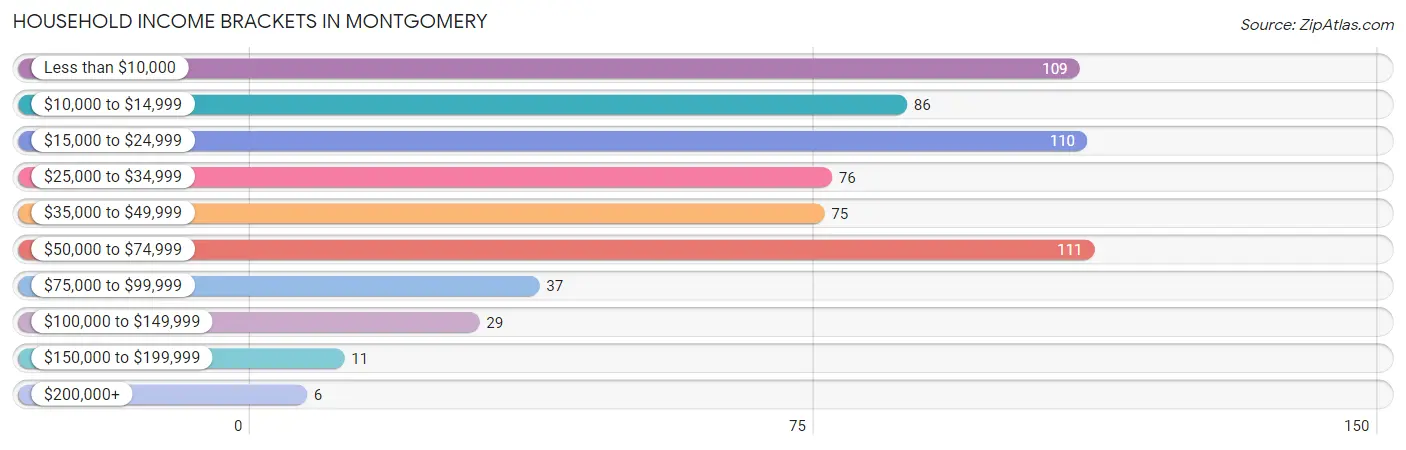
| Income Bracket | # Households | % Households |
| Less than $10,000 | 109 | 16.8% |
| $10,000 to $14,999 | 86 | 13.2% |
| $15,000 to $24,999 | 110 | 16.9% |
| $25,000 to $34,999 | 76 | 11.7% |
| $35,000 to $49,999 | 75 | 11.5% |
| $50,000 to $74,999 | 111 | 17.1% |
| $75,000 to $99,999 | 37 | 5.7% |
| $100,000 to $149,999 | 29 | 4.5% |
| $150,000 to $199,999 | 11 | 1.7% |
| $200,000+ | 6 | 0.9% |
Household Income by Householder Age in Montgomery
The median household income in Montgomery is $27,174, with the highest median household income of $22,228 found in the 65+ years age bracket for the primary householder. A total of 221 households (34.0%) fall into this category. Meanwhile, the 15 to 24 years age bracket for the primary householder has the lowest median household income of $0, with 36 households (5.5%) in this group.
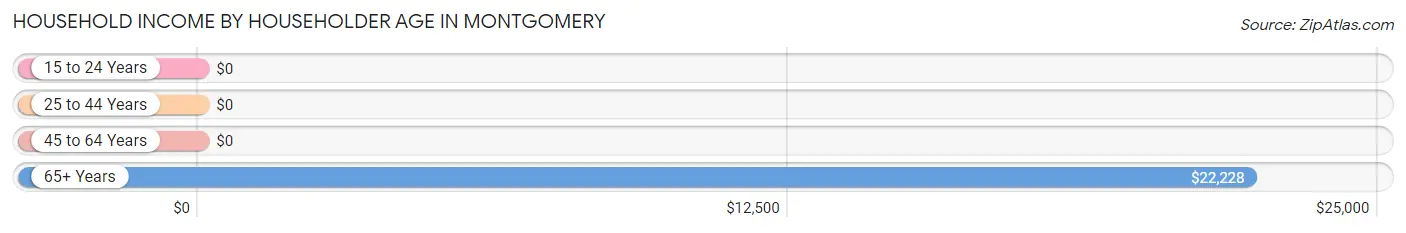
| Income Bracket | # Households | Median Income |
| 15 to 24 Years | 36 (5.5%) | $0 |
| 25 to 44 Years | 181 (27.9%) | $0 |
| 45 to 64 Years | 212 (32.6%) | $0 |
| 65+ Years | 221 (34.0%) | $22,228 |
| Total | 650 (100.0%) | $27,174 |
Poverty in Montgomery
Income Below Poverty by Sex and Age in Montgomery
With 48.1% poverty level for males and 31.8% for females among the residents of Montgomery, 12 to 14 year old males and 5 year old females are the most vulnerable to poverty, with 10 males (100.0%) and 9 females (100.0%) in their respective age groups living below the poverty level.
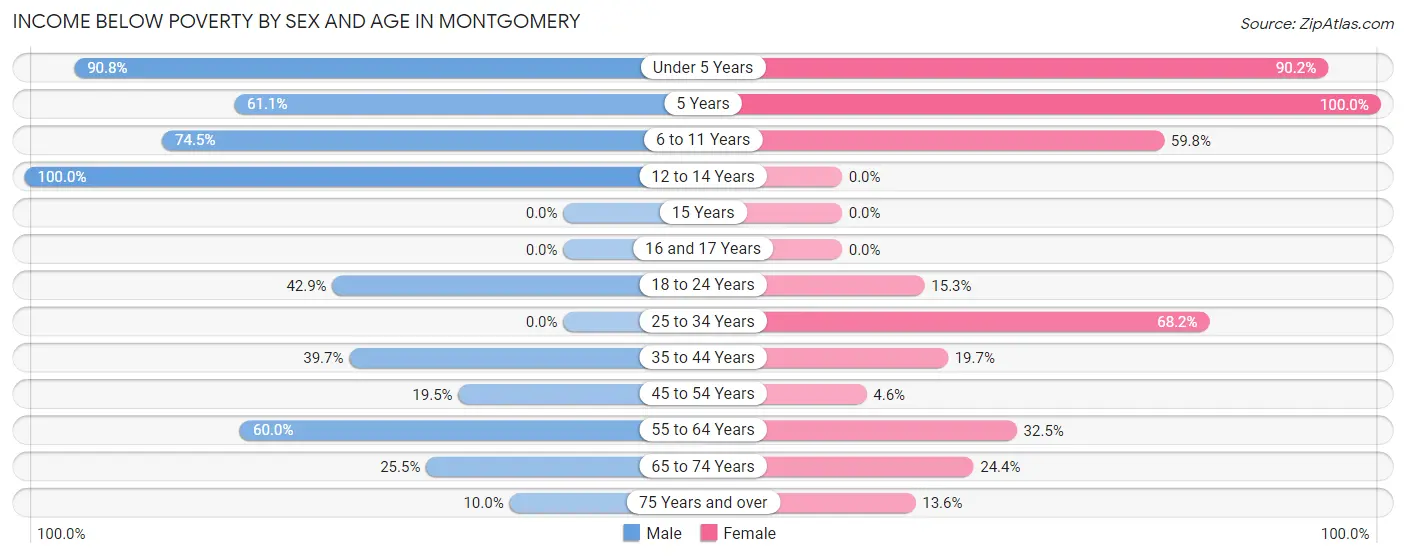
| Age Bracket | Male | Female |
| Under 5 Years | 69 (90.8%) | 37 (90.2%) |
| 5 Years | 11 (61.1%) | 9 (100.0%) |
| 6 to 11 Years | 35 (74.5%) | 49 (59.8%) |
| 12 to 14 Years | 10 (100.0%) | 0 (0.0%) |
| 15 Years | 0 (0.0%) | 0 (0.0%) |
| 16 and 17 Years | 0 (0.0%) | 0 (0.0%) |
| 18 to 24 Years | 21 (42.9%) | 21 (15.3%) |
| 25 to 34 Years | 0 (0.0%) | 73 (68.2%) |
| 35 to 44 Years | 31 (39.7%) | 23 (19.7%) |
| 45 to 54 Years | 15 (19.5%) | 4 (4.5%) |
| 55 to 64 Years | 54 (60.0%) | 37 (32.5%) |
| 65 to 74 Years | 14 (25.5%) | 31 (24.4%) |
| 75 Years and over | 2 (10.0%) | 9 (13.6%) |
| Total | 262 (48.1%) | 293 (31.8%) |
Income Above Poverty by Sex and Age in Montgomery
According to the poverty statistics in Montgomery, males aged 25 to 34 years and females aged 15 years are the age groups that are most secure financially, with 100.0% of males and 100.0% of females in these age groups living above the poverty line.
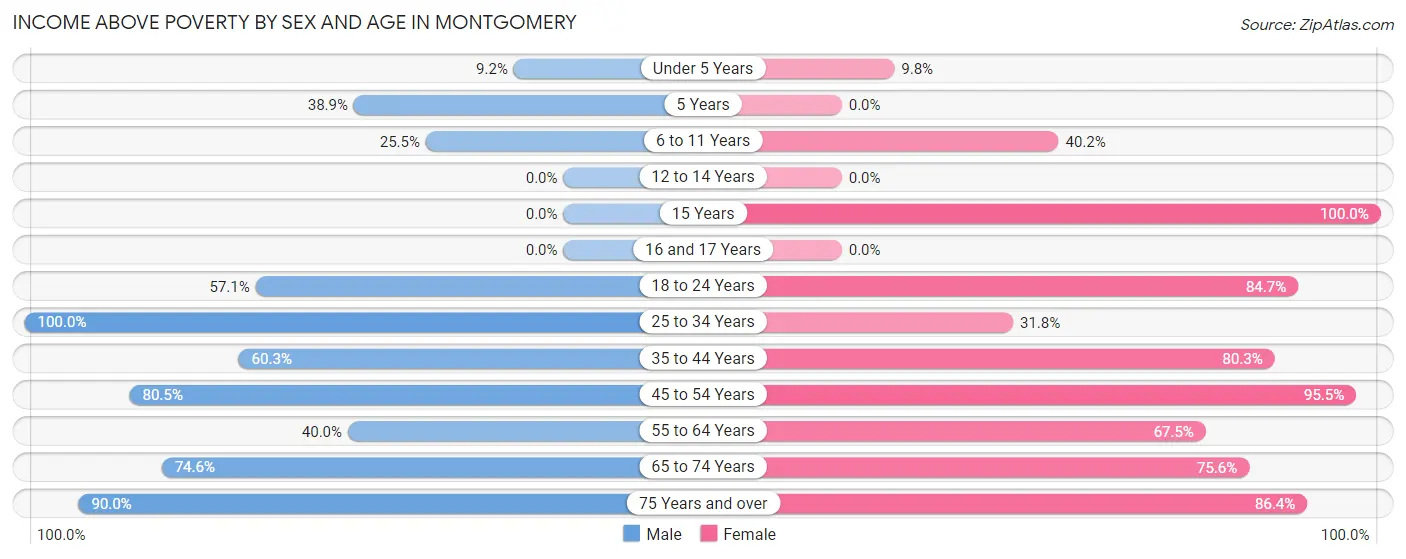
| Age Bracket | Male | Female |
| Under 5 Years | 7 (9.2%) | 4 (9.8%) |
| 5 Years | 7 (38.9%) | 0 (0.0%) |
| 6 to 11 Years | 12 (25.5%) | 33 (40.2%) |
| 12 to 14 Years | 0 (0.0%) | 0 (0.0%) |
| 15 Years | 0 (0.0%) | 33 (100.0%) |
| 16 and 17 Years | 0 (0.0%) | 0 (0.0%) |
| 18 to 24 Years | 28 (57.1%) | 116 (84.7%) |
| 25 to 34 Years | 25 (100.0%) | 34 (31.8%) |
| 35 to 44 Years | 47 (60.3%) | 94 (80.3%) |
| 45 to 54 Years | 62 (80.5%) | 84 (95.5%) |
| 55 to 64 Years | 36 (40.0%) | 77 (67.5%) |
| 65 to 74 Years | 41 (74.6%) | 96 (75.6%) |
| 75 Years and over | 18 (90.0%) | 57 (86.4%) |
| Total | 283 (51.9%) | 628 (68.2%) |
Income Below Poverty Among Married-Couple Families in Montgomery
The poverty statistics for married-couple families in Montgomery show that 14.7% or 16 of the total 109 families live below the poverty line. Families with 3 or 4 children have the highest poverty rate of 100.0%, comprising of 9 families. On the other hand, families with 1 or 2 children have the lowest poverty rate of 0.0%, which includes 0 families.
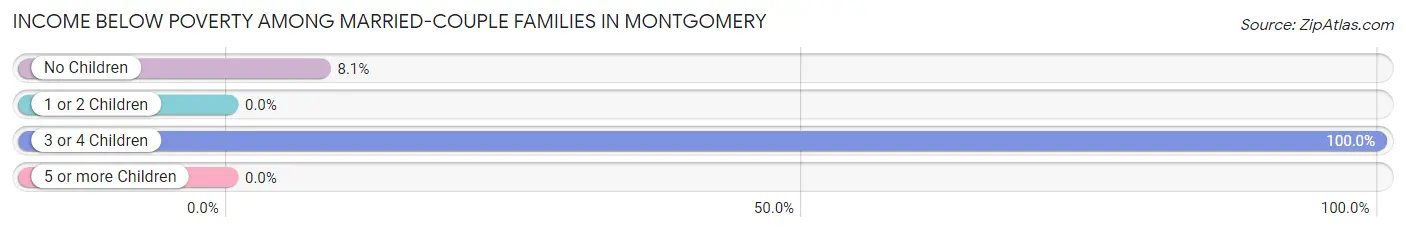
| Children | Above Poverty | Below Poverty |
| No Children | 80 (91.9%) | 7 (8.1%) |
| 1 or 2 Children | 13 (100.0%) | 0 (0.0%) |
| 3 or 4 Children | 0 (0.0%) | 9 (100.0%) |
| 5 or more Children | 0 (0.0%) | 0 (0.0%) |
| Total | 93 (85.3%) | 16 (14.7%) |
Income Below Poverty Among Single-Parent Households in Montgomery
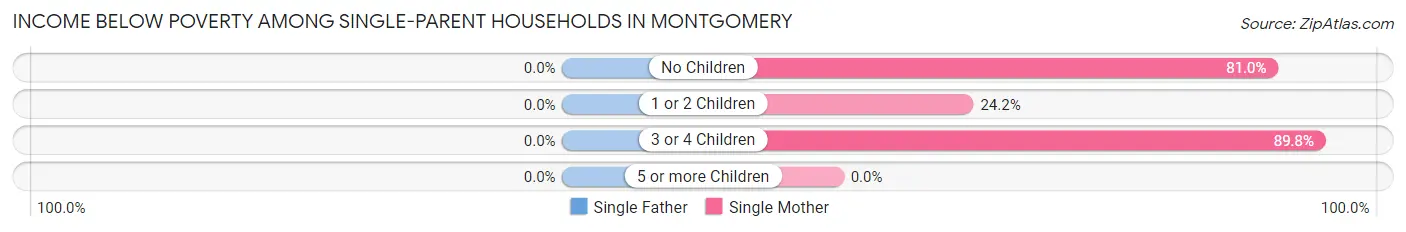
| Children | Single Father | Single Mother |
| No Children | 0 (0.0%) | 17 (80.9%) |
| 1 or 2 Children | 0 (0.0%) | 22 (24.2%) |
| 3 or 4 Children | 0 (0.0%) | 44 (89.8%) |
| 5 or more Children | 0 (0.0%) | 0 (0.0%) |
| Total | 0 (0.0%) | 83 (51.5%) |
Income Below Poverty Among Married-Couple vs Single-Parent Households in Montgomery
The poverty data for Montgomery shows that 16 of the married-couple family households (14.7%) and 83 of the single-parent households (47.2%) are living below the poverty level. Within the married-couple family households, those with 3 or 4 children have the highest poverty rate, with 9 households (100.0%) falling below the poverty line. Among the single-parent households, those with 3 or 4 children have the highest poverty rate, with 44 household (89.8%) living below poverty.
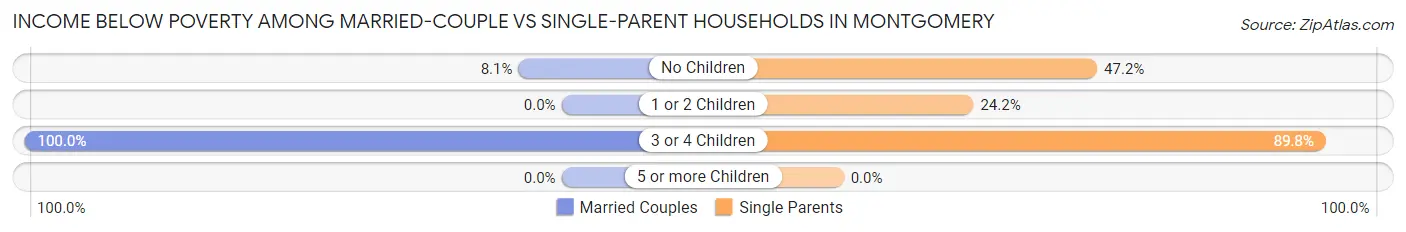
| Children | Married-Couple Families | Single-Parent Households |
| No Children | 7 (8.1%) | 17 (47.2%) |
| 1 or 2 Children | 0 (0.0%) | 22 (24.2%) |
| 3 or 4 Children | 9 (100.0%) | 44 (89.8%) |
| 5 or more Children | 0 (0.0%) | 0 (0.0%) |
| Total | 16 (14.7%) | 83 (47.2%) |
Race in Montgomery
The most populous races in Montgomery are White / Caucasian (1,207 | 70.8%), Two or more Races (355 | 20.8%), and Black / African American (134 | 7.9%).
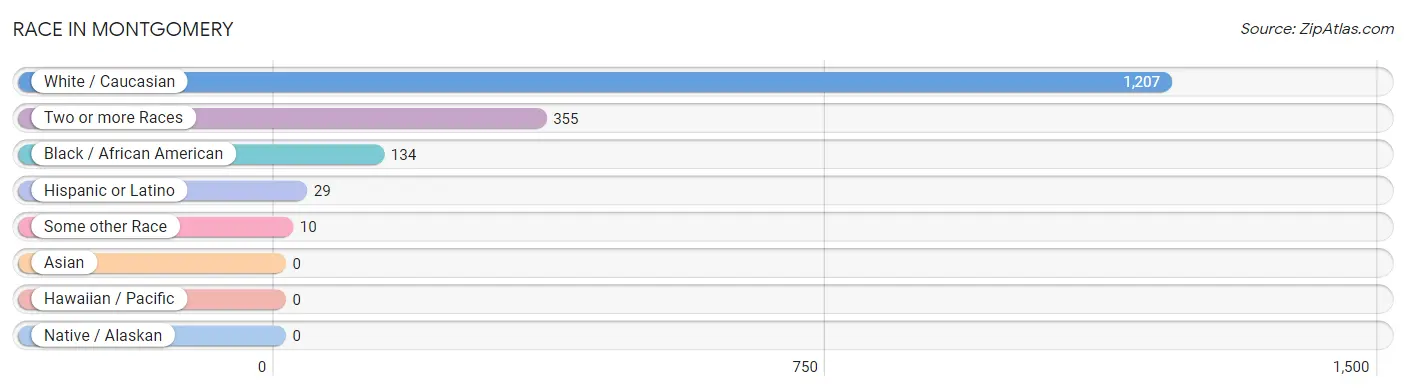
| Race | # Population | % Population |
| Asian | 0 | 0.0% |
| Black / African American | 134 | 7.9% |
| Hawaiian / Pacific | 0 | 0.0% |
| Hispanic or Latino | 29 | 1.7% |
| Native / Alaskan | 0 | 0.0% |
| White / Caucasian | 1,207 | 70.8% |
| Two or more Races | 355 | 20.8% |
| Some other Race | 10 | 0.6% |
| Total | 1,706 | 100.0% |
Ancestry in Montgomery
The most populous ancestries reported in Montgomery are Irish (424 | 24.8%), English (311 | 18.2%), German (127 | 7.4%), Italian (87 | 5.1%), and Scotch-Irish (69 | 4.0%), together accounting for 59.7% of all Montgomery residents.
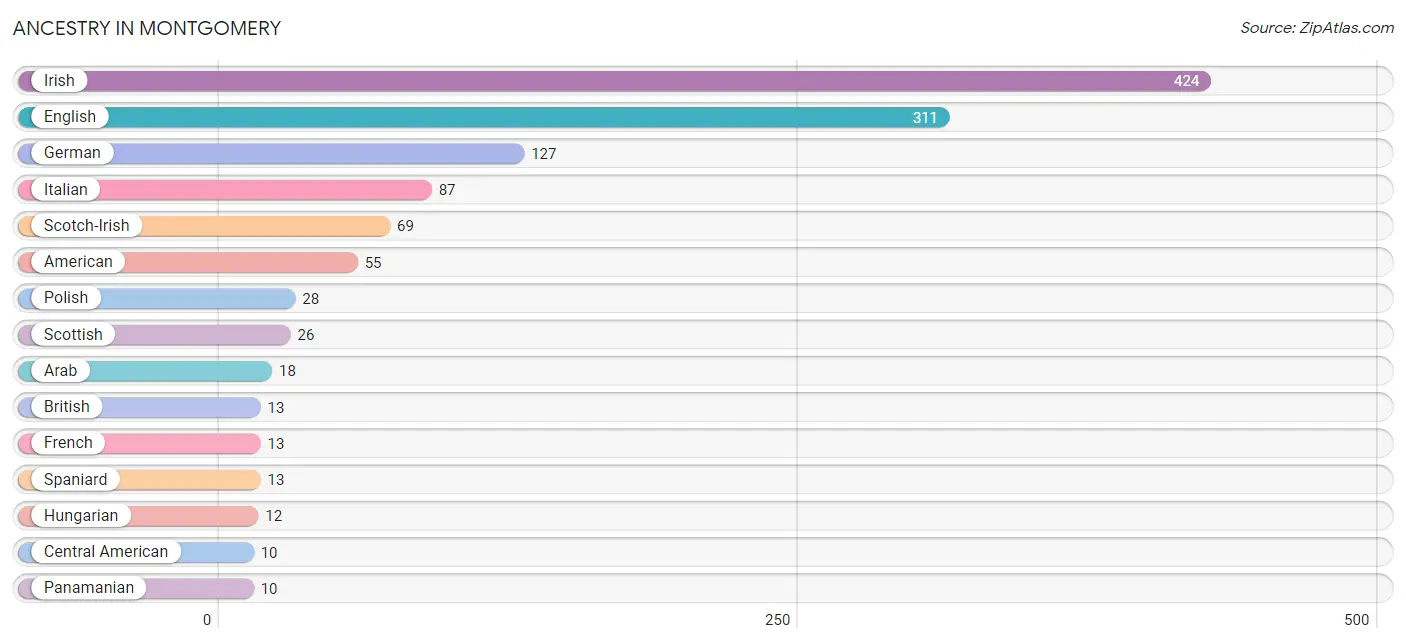
| Ancestry | # Population | % Population |
| American | 55 | 3.2% |
| Arab | 18 | 1.1% |
| Belgian | 8 | 0.5% |
| British | 13 | 0.8% |
| Central American | 10 | 0.6% |
| Cherokee | 2 | 0.1% |
| Czechoslovakian | 2 | 0.1% |
| Dutch | 2 | 0.1% |
| English | 311 | 18.2% |
| French | 13 | 0.8% |
| German | 127 | 7.4% |
| Hungarian | 12 | 0.7% |
| Irish | 424 | 24.8% |
| Israeli | 2 | 0.1% |
| Italian | 87 | 5.1% |
| Lebanese | 7 | 0.4% |
| Mexican | 6 | 0.4% |
| Moroccan | 8 | 0.5% |
| Northern European | 4 | 0.2% |
| Panamanian | 10 | 0.6% |
| Polish | 28 | 1.6% |
| Russian | 5 | 0.3% |
| Scotch-Irish | 69 | 4.0% |
| Scottish | 26 | 1.5% |
| Spaniard | 13 | 0.8% |
| Swedish | 8 | 0.5% |
| Syrian | 3 | 0.2% | View All 27 Rows |
Immigrants in Montgomery
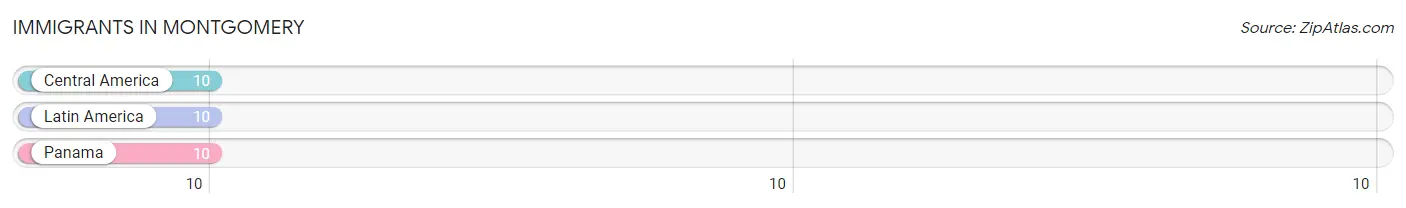
The most numerous immigrant groups reported in Montgomery came from Central America (10 | 0.6%), Latin America (10 | 0.6%), and Panama (10 | 0.6%), together accounting for 1.8% of all Montgomery residents.
| Immigration Origin | # Population | % Population |
| Central America | 10 | 0.6% |
| Latin America | 10 | 0.6% |
| Panama | 10 | 0.6% | View All 3 Rows |
Sex and Age in Montgomery
Sex and Age in Montgomery
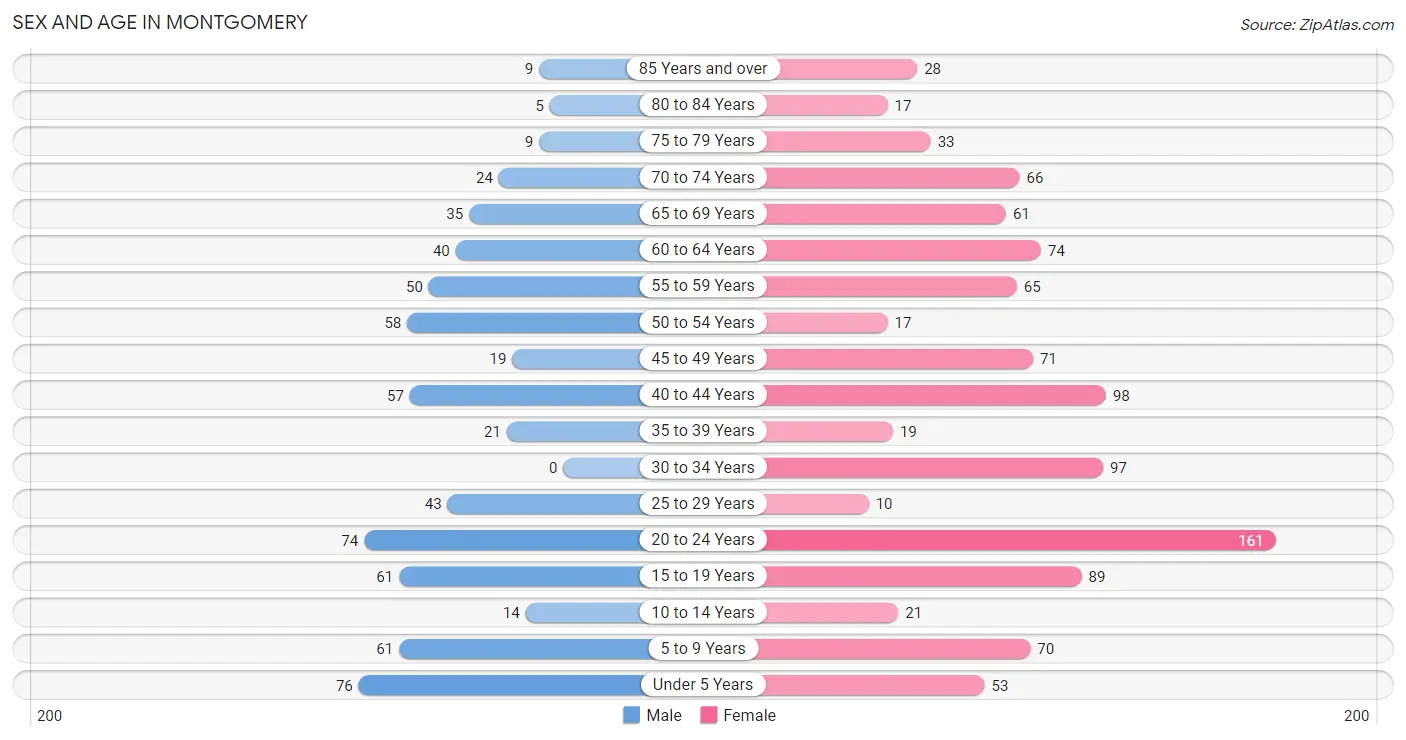
The most populous age groups in Montgomery are Under 5 Years (76 | 11.6%) for men and 20 to 24 Years (161 | 15.3%) for women.
| Age Bracket | Male | Female |
| Under 5 Years | 76 (11.6%) | 53 (5.1%) |
| 5 to 9 Years | 61 (9.3%) | 70 (6.7%) |
| 10 to 14 Years | 14 (2.1%) | 21 (2.0%) |
| 15 to 19 Years | 61 (9.3%) | 89 (8.5%) |
| 20 to 24 Years | 74 (11.3%) | 161 (15.3%) |
| 25 to 29 Years | 43 (6.6%) | 10 (0.9%) |
| 30 to 34 Years | 0 (0.0%) | 97 (9.2%) |
| 35 to 39 Years | 21 (3.2%) | 19 (1.8%) |
| 40 to 44 Years | 57 (8.7%) | 98 (9.3%) |
| 45 to 49 Years | 19 (2.9%) | 71 (6.8%) |
| 50 to 54 Years | 58 (8.8%) | 17 (1.6%) |
| 55 to 59 Years | 50 (7.6%) | 65 (6.2%) |
| 60 to 64 Years | 40 (6.1%) | 74 (7.0%) |
| 65 to 69 Years | 35 (5.3%) | 61 (5.8%) |
| 70 to 74 Years | 24 (3.7%) | 66 (6.3%) |
| 75 to 79 Years | 9 (1.4%) | 33 (3.1%) |
| 80 to 84 Years | 5 (0.8%) | 17 (1.6%) |
| 85 Years and over | 9 (1.4%) | 28 (2.7%) |
| Total | 656 (100.0%) | 1,050 (100.0%) |
Families and Households in Montgomery
Median Family Size in Montgomery
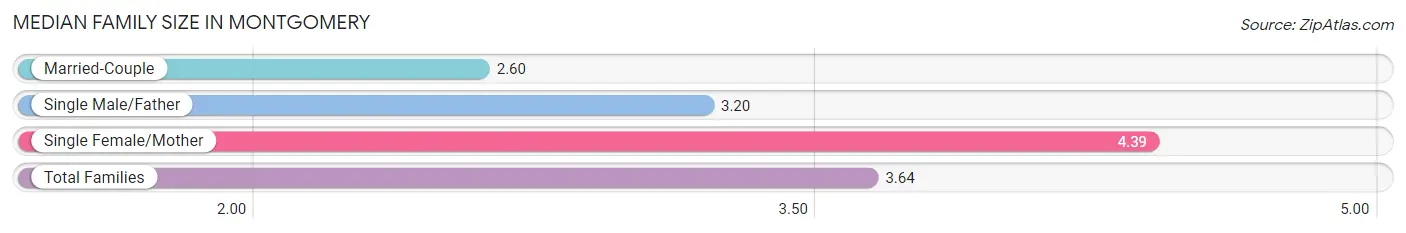
The median family size in Montgomery is 3.64 persons per family, with single female/mother families (161 | 56.5%) accounting for the largest median family size of 4.39 persons per family. On the other hand, married-couple families (109 | 38.3%) represent the smallest median family size with 2.60 persons per family.
| Family Type | # Families | Family Size |
| Married-Couple | 109 (38.3%) | 2.60 |
| Single Male/Father | 15 (5.3%) | 3.20 |
| Single Female/Mother | 161 (56.5%) | 4.39 |
| Total Families | 285 (100.0%) | 3.64 |
Median Household Size in Montgomery
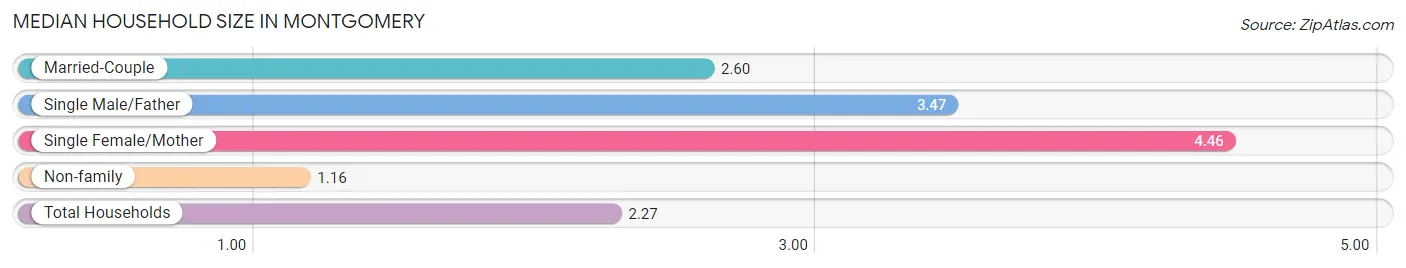
The median household size in Montgomery is 2.27 persons per household, with single female/mother households (161 | 24.8%) accounting for the largest median household size of 4.46 persons per household. non-family households (365 | 56.1%) represent the smallest median household size with 1.16 persons per household.
| Household Type | # Households | Household Size |
| Married-Couple | 109 (16.8%) | 2.60 |
| Single Male/Father | 15 (2.3%) | 3.47 |
| Single Female/Mother | 161 (24.8%) | 4.46 |
| Non-family | 365 (56.1%) | 1.16 |
| Total Households | 650 (100.0%) | 2.27 |
Household Size by Marriage Status in Montgomery
Out of a total of 650 households in Montgomery, 285 (43.9%) are family households, while 365 (56.1%) are nonfamily households. The most numerous type of family households are 2-person households, comprising 105, and the most common type of nonfamily households are 1-person households, comprising 324.
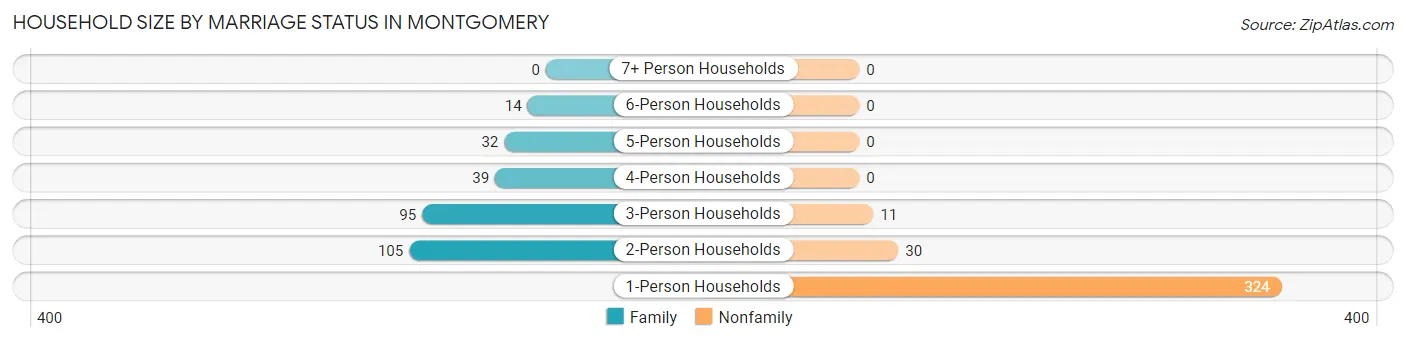
| Household Size | Family Households | Nonfamily Households |
| 1-Person Households | - | 324 (49.8%) |
| 2-Person Households | 105 (16.2%) | 30 (4.6%) |
| 3-Person Households | 95 (14.6%) | 11 (1.7%) |
| 4-Person Households | 39 (6.0%) | 0 (0.0%) |
| 5-Person Households | 32 (4.9%) | 0 (0.0%) |
| 6-Person Households | 14 (2.1%) | 0 (0.0%) |
| 7+ Person Households | 0 (0.0%) | 0 (0.0%) |
| Total | 285 (43.9%) | 365 (56.1%) |
Female Fertility in Montgomery
Fertility by Age in Montgomery
Average fertility rate in Montgomery is 9.0 births per 1,000 women. Women in the age bracket of 20 to 34 years have the highest fertility rate with 19.0 births per 1,000 women. Women in the age bracket of 20 to 34 years acount for 100.0% of all women with births.
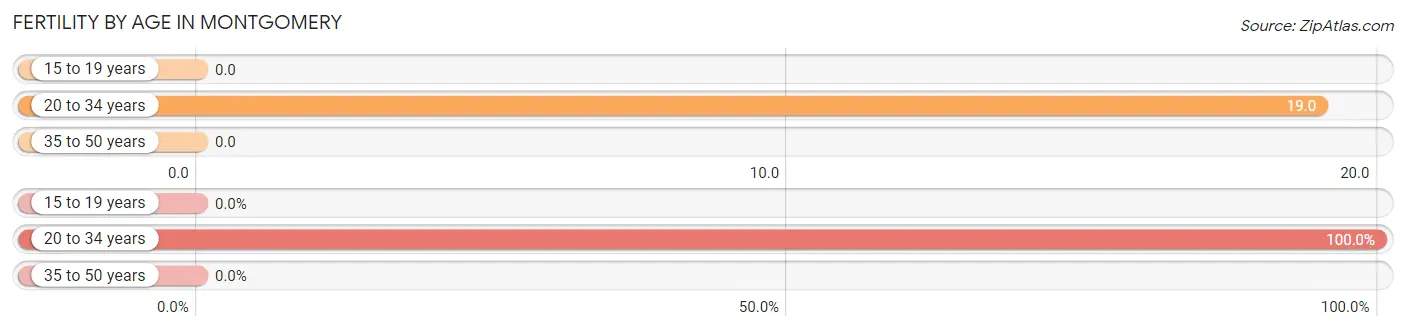
| Age Bracket | Women with Births | Births / 1,000 Women |
| 15 to 19 years | 0 (0.0%) | 0.0 |
| 20 to 34 years | 5 (100.0%) | 19.0 |
| 35 to 50 years | 0 (0.0%) | 0.0 |
| Total | 5 (100.0%) | 9.0 |
Fertility by Age by Marriage Status in Montgomery
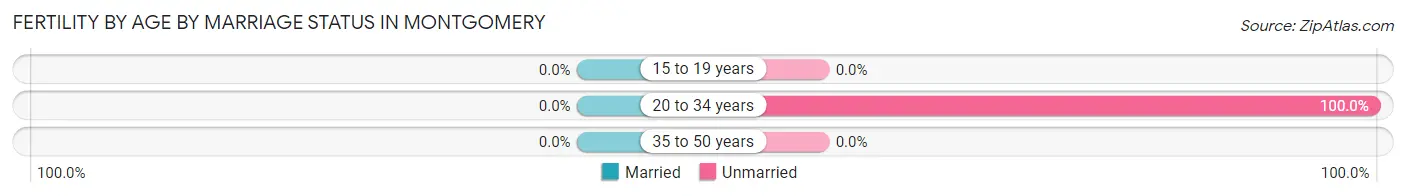
| Age Bracket | Married | Unmarried |
| 15 to 19 years | 0 (0.0%) | 0 (0.0%) |
| 20 to 34 years | 0 (0.0%) | 5 (100.0%) |
| 35 to 50 years | 0 (0.0%) | 0 (0.0%) |
| Total | 0 (0.0%) | 5 (100.0%) |
Fertility by Education in Montgomery
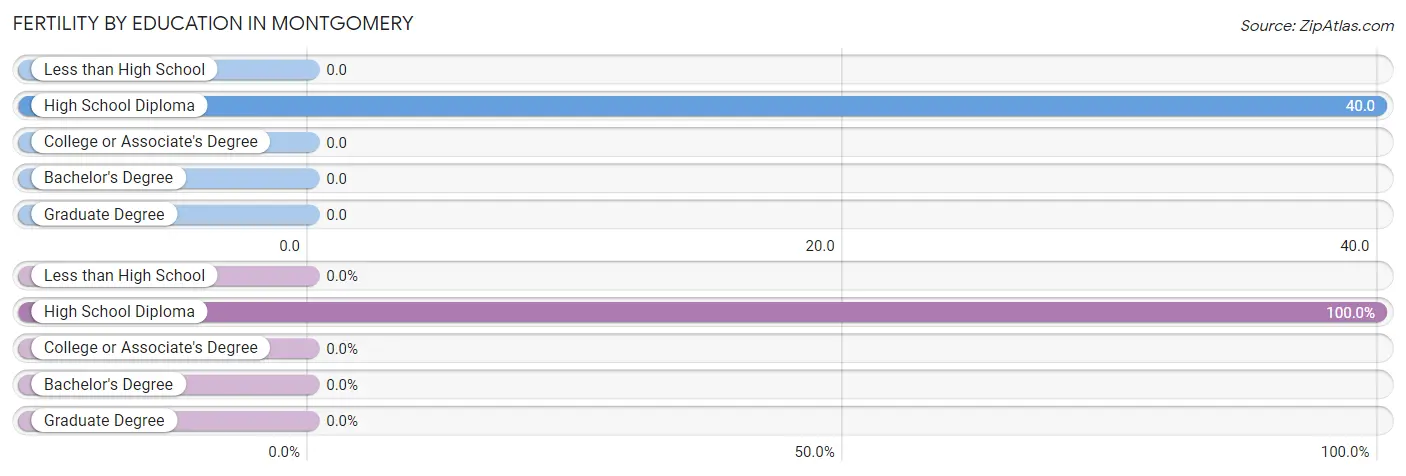
| Educational Attainment | Women with Births | Births / 1,000 Women |
| Less than High School | 0 (0.0%) | 0.0 |
| High School Diploma | 5 (100.0%) | 40.0 |
| College or Associate's Degree | 0 (0.0%) | 0.0 |
| Bachelor's Degree | 0 (0.0%) | 0.0 |
| Graduate Degree | 0 (0.0%) | 0.0 |
| Total | 5 (100.0%) | 9.0 |
Fertility by Education by Marriage Status in Montgomery
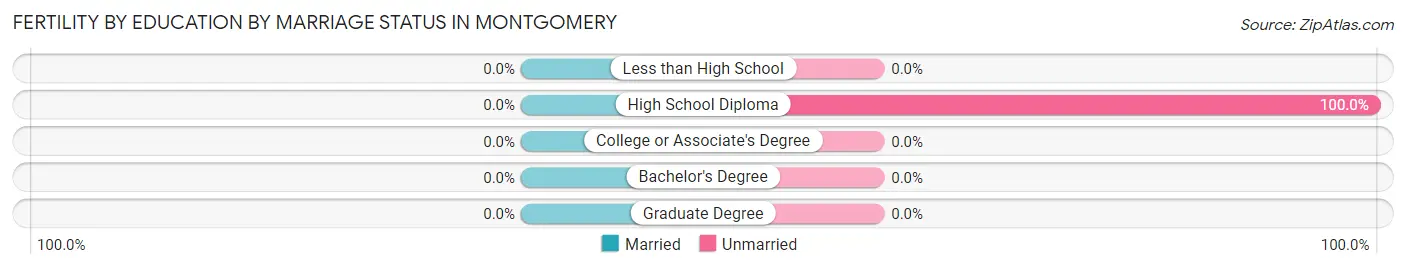
| Educational Attainment | Married | Unmarried |
| Less than High School | 0 (0.0%) | 0 (0.0%) |
| High School Diploma | 0 (0.0%) | 5 (100.0%) |
| College or Associate's Degree | 0 (0.0%) | 0 (0.0%) |
| Bachelor's Degree | 0 (0.0%) | 0 (0.0%) |
| Graduate Degree | 0 (0.0%) | 0 (0.0%) |
| Total | 0 (0.0%) | 5 (100.0%) |
Employment Characteristics in Montgomery
Employment by Class of Employer in Montgomery
Among the 495 employed individuals in Montgomery, private company employees (308 | 62.2%), not-for-profit organizations (115 | 23.2%), and state government employees (35 | 7.1%) make up the most common classes of employment.
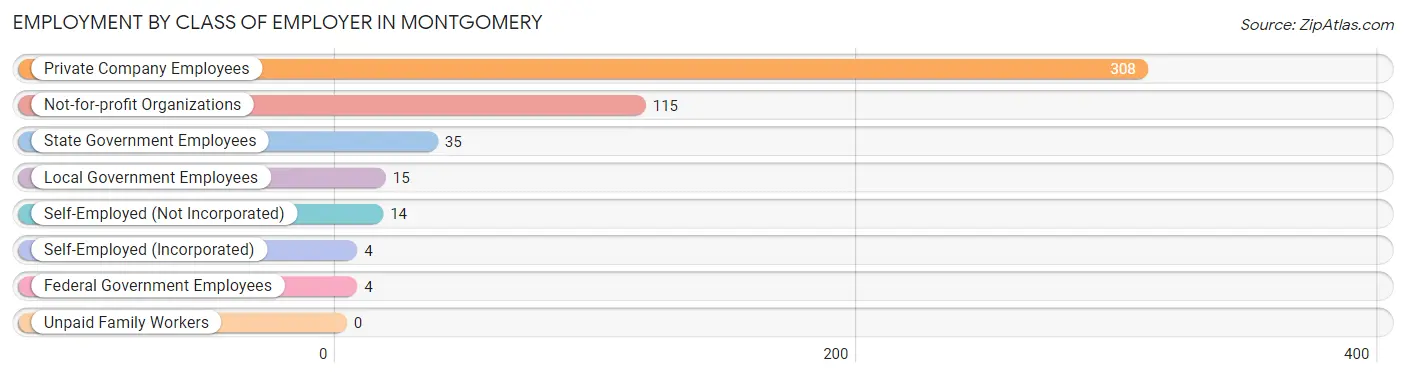
| Employer Class | # Employees | % Employees |
| Private Company Employees | 308 | 62.2% |
| Self-Employed (Incorporated) | 4 | 0.8% |
| Self-Employed (Not Incorporated) | 14 | 2.8% |
| Not-for-profit Organizations | 115 | 23.2% |
| Local Government Employees | 15 | 3.0% |
| State Government Employees | 35 | 7.1% |
| Federal Government Employees | 4 | 0.8% |
| Unpaid Family Workers | 0 | 0.0% |
| Total | 495 | 100.0% |
Employment Status by Age in Montgomery
According to the labor force statistics for Montgomery, out of the total population over 16 years of age (1,378), 42.2% or 582 individuals are in the labor force, with 8.3% or 48 of them unemployed. The age group with the highest labor force participation rate is 20 to 24 years, with 77.4% or 182 individuals in the labor force. Within the labor force, the 30 to 34 years age range has the highest percentage of unemployed individuals, with 40.3% or 27 of them being unemployed.
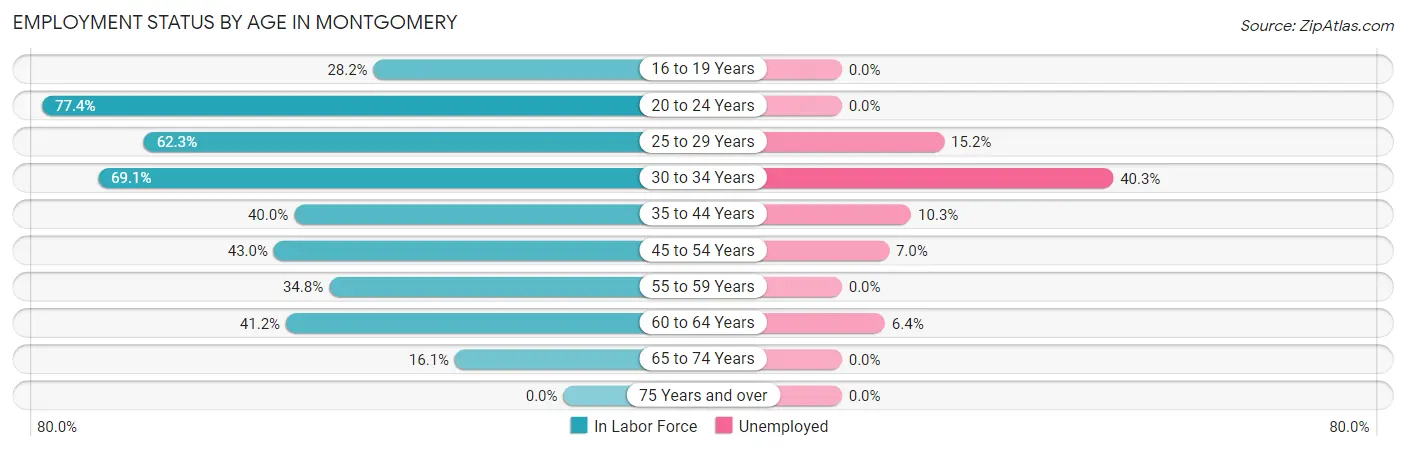
| Age Bracket | In Labor Force | Unemployed |
| 16 to 19 Years | 33 (28.2%) | 0 (0.0%) |
| 20 to 24 Years | 182 (77.4%) | 0 (0.0%) |
| 25 to 29 Years | 33 (62.3%) | 5 (15.2%) |
| 30 to 34 Years | 67 (69.1%) | 27 (40.3%) |
| 35 to 44 Years | 78 (40.0%) | 8 (10.3%) |
| 45 to 54 Years | 71 (43.0%) | 5 (7.0%) |
| 55 to 59 Years | 40 (34.8%) | 0 (0.0%) |
| 60 to 64 Years | 47 (41.2%) | 3 (6.4%) |
| 65 to 74 Years | 30 (16.1%) | 0 (0.0%) |
| 75 Years and over | 0 (0.0%) | 0 (0.0%) |
| Total | 582 (42.2%) | 48 (8.3%) |
Employment Status by Educational Attainment in Montgomery
According to labor force statistics for Montgomery, 45.5% of individuals (336) out of the total population between 25 and 64 years of age (739) are in the labor force, with 14.3% or 48 of them being unemployed. The group with the highest labor force participation rate are those with the educational attainment of college / associate degree, with 58.4% or 125 individuals in the labor force. Within the labor force, individuals with high school diploma education have the highest percentage of unemployment, with 17.7% or 20 of them being unemployed.
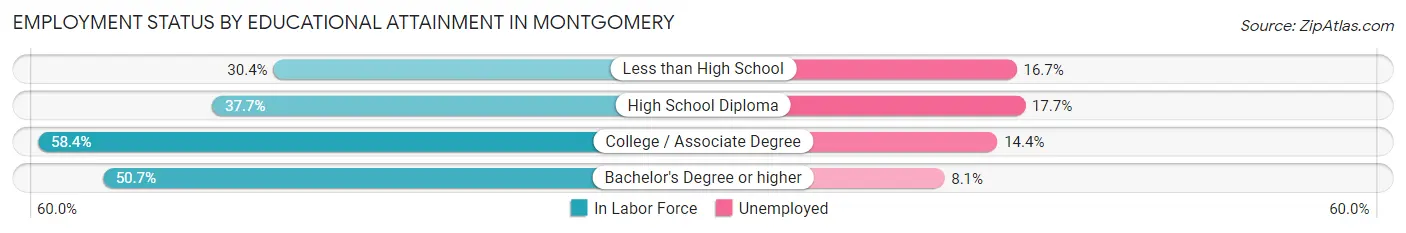
| Educational Attainment | In Labor Force | Unemployed |
| Less than High School | 24 (30.4%) | 13 (16.7%) |
| High School Diploma | 113 (37.7%) | 53 (17.7%) |
| College / Associate Degree | 125 (58.4%) | 31 (14.4%) |
| Bachelor's Degree or higher | 74 (50.7%) | 12 (8.1%) |
| Total | 336 (45.5%) | 106 (14.3%) |
Employment Occupations by Sex in Montgomery
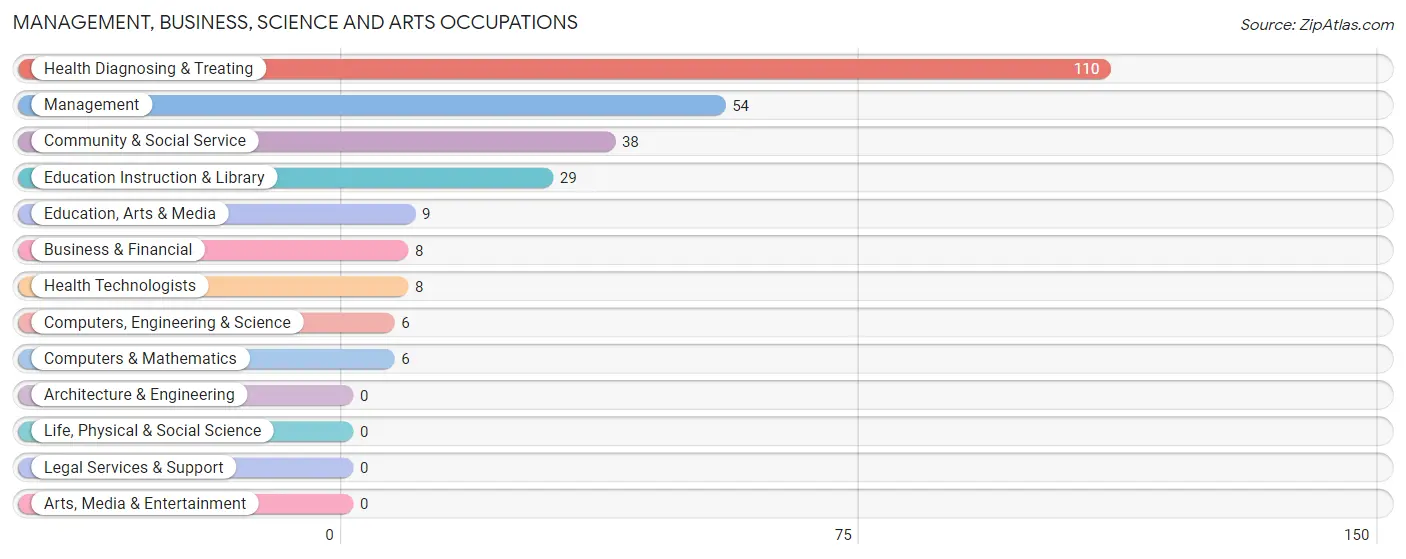
Management, Business, Science and Arts Occupations
The most common Management, Business, Science and Arts occupations in Montgomery are Health Diagnosing & Treating (110 | 20.6%), Management (54 | 10.1%), Community & Social Service (38 | 7.1%), Education Instruction & Library (29 | 5.4%), and Education, Arts & Media (9 | 1.7%).
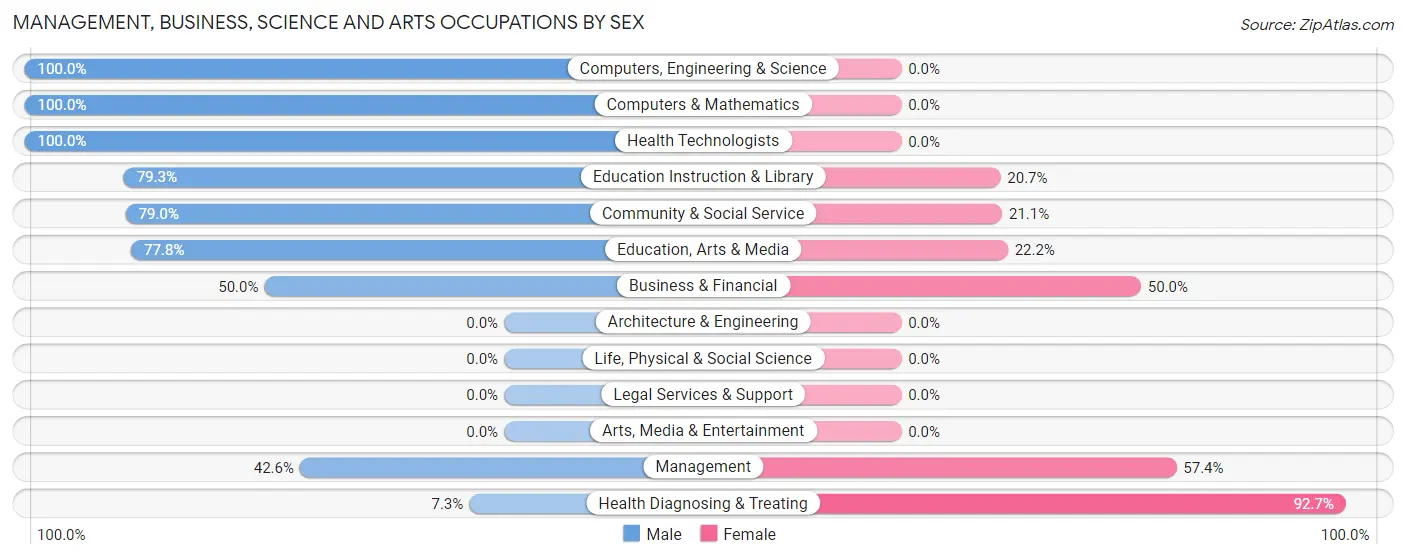
Management, Business, Science and Arts Occupations by Sex
Within the Management, Business, Science and Arts occupations in Montgomery, the most male-oriented occupations are Computers, Engineering & Science (100.0%), Computers & Mathematics (100.0%), and Health Technologists (100.0%), while the most female-oriented occupations are Health Diagnosing & Treating (92.7%), Management (57.4%), and Business & Financial (50.0%).
| Occupation | Male | Female |
| Management | 23 (42.6%) | 31 (57.4%) |
| Business & Financial | 4 (50.0%) | 4 (50.0%) |
| Computers, Engineering & Science | 6 (100.0%) | 0 (0.0%) |
| Computers & Mathematics | 6 (100.0%) | 0 (0.0%) |
| Architecture & Engineering | 0 (0.0%) | 0 (0.0%) |
| Life, Physical & Social Science | 0 (0.0%) | 0 (0.0%) |
| Community & Social Service | 30 (78.9%) | 8 (21.0%) |
| Education, Arts & Media | 7 (77.8%) | 2 (22.2%) |
| Legal Services & Support | 0 (0.0%) | 0 (0.0%) |
| Education Instruction & Library | 23 (79.3%) | 6 (20.7%) |
| Arts, Media & Entertainment | 0 (0.0%) | 0 (0.0%) |
| Health Diagnosing & Treating | 8 (7.3%) | 102 (92.7%) |
| Health Technologists | 8 (100.0%) | 0 (0.0%) |
| Total (Category) | 71 (32.9%) | 145 (67.1%) |
| Total (Overall) | 219 (41.1%) | 314 (58.9%) |
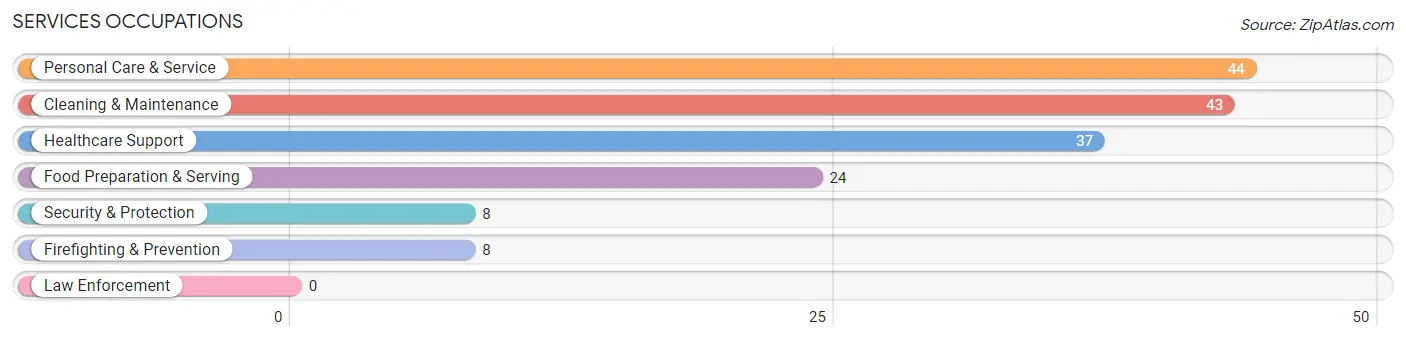
Services Occupations
The most common Services occupations in Montgomery are Personal Care & Service (44 | 8.3%), Cleaning & Maintenance (43 | 8.1%), Healthcare Support (37 | 6.9%), Food Preparation & Serving (24 | 4.5%), and Security & Protection (8 | 1.5%).
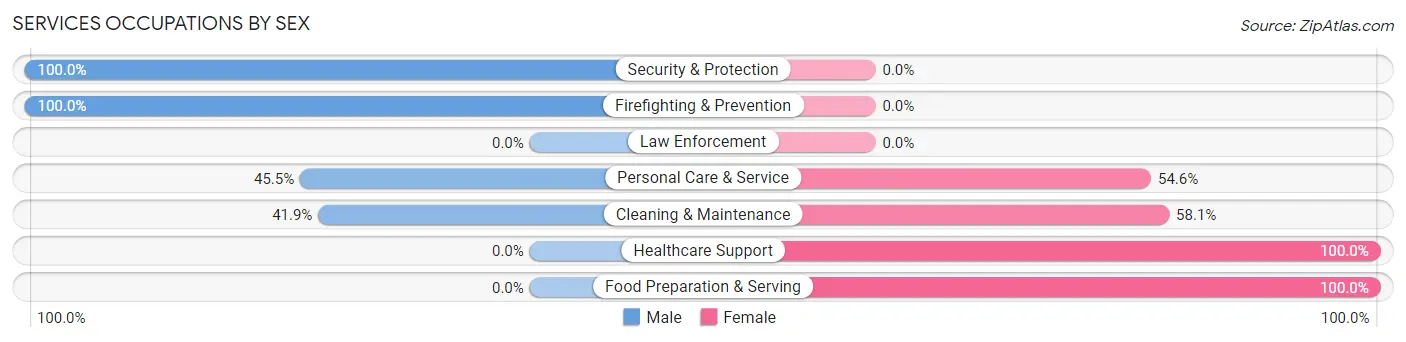
Services Occupations by Sex
Within the Services occupations in Montgomery, the most male-oriented occupations are Security & Protection (100.0%), Firefighting & Prevention (100.0%), and Personal Care & Service (45.5%), while the most female-oriented occupations are Healthcare Support (100.0%), Food Preparation & Serving (100.0%), and Cleaning & Maintenance (58.1%).
| Occupation | Male | Female |
| Healthcare Support | 0 (0.0%) | 37 (100.0%) |
| Security & Protection | 8 (100.0%) | 0 (0.0%) |
| Firefighting & Prevention | 8 (100.0%) | 0 (0.0%) |
| Law Enforcement | 0 (0.0%) | 0 (0.0%) |
| Food Preparation & Serving | 0 (0.0%) | 24 (100.0%) |
| Cleaning & Maintenance | 18 (41.9%) | 25 (58.1%) |
| Personal Care & Service | 20 (45.5%) | 24 (54.5%) |
| Total (Category) | 46 (29.5%) | 110 (70.5%) |
| Total (Overall) | 219 (41.1%) | 314 (58.9%) |
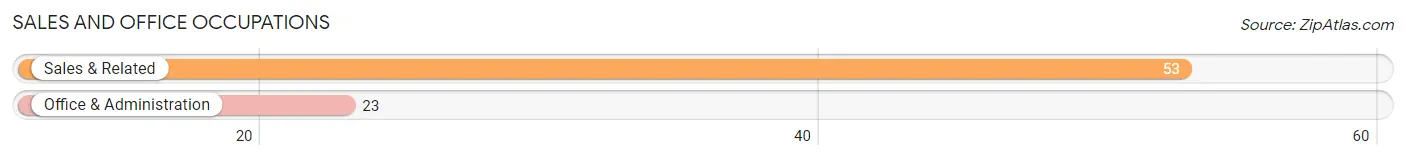
Sales and Office Occupations
The most common Sales and Office occupations in Montgomery are Sales & Related (53 | 9.9%), and Office & Administration (23 | 4.3%).
Sales and Office Occupations by Sex
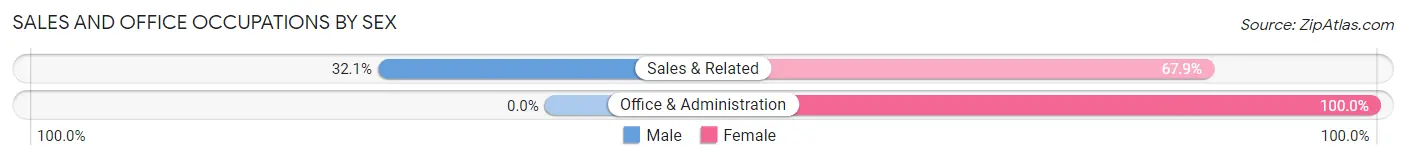
| Occupation | Male | Female |
| Sales & Related | 17 (32.1%) | 36 (67.9%) |
| Office & Administration | 0 (0.0%) | 23 (100.0%) |
| Total (Category) | 17 (22.4%) | 59 (77.6%) |
| Total (Overall) | 219 (41.1%) | 314 (58.9%) |
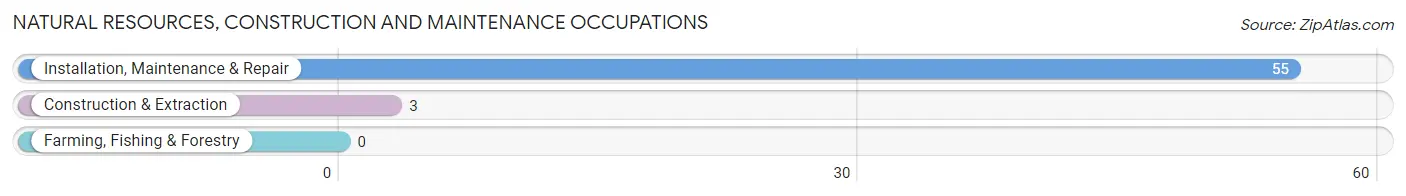
Natural Resources, Construction and Maintenance Occupations
The most common Natural Resources, Construction and Maintenance occupations in Montgomery are Installation, Maintenance & Repair (55 | 10.3%), and Construction & Extraction (3 | 0.6%).
Natural Resources, Construction and Maintenance Occupations by Sex
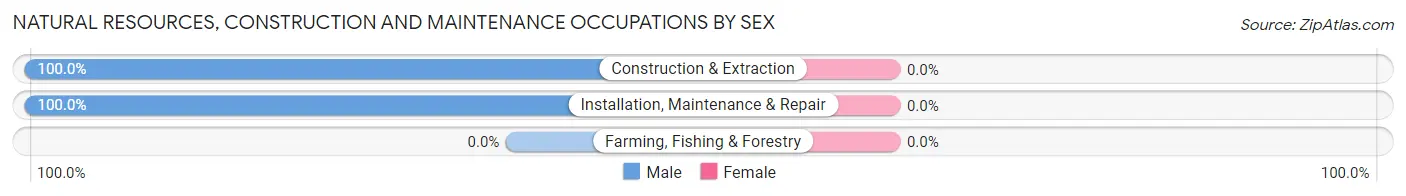
| Occupation | Male | Female |
| Farming, Fishing & Forestry | 0 (0.0%) | 0 (0.0%) |
| Construction & Extraction | 3 (100.0%) | 0 (0.0%) |
| Installation, Maintenance & Repair | 55 (100.0%) | 0 (0.0%) |
| Total (Category) | 58 (100.0%) | 0 (0.0%) |
| Total (Overall) | 219 (41.1%) | 314 (58.9%) |
Production, Transportation and Moving Occupations
The most common Production, Transportation and Moving occupations in Montgomery are Production (15 | 2.8%), and Transportation (12 | 2.2%).
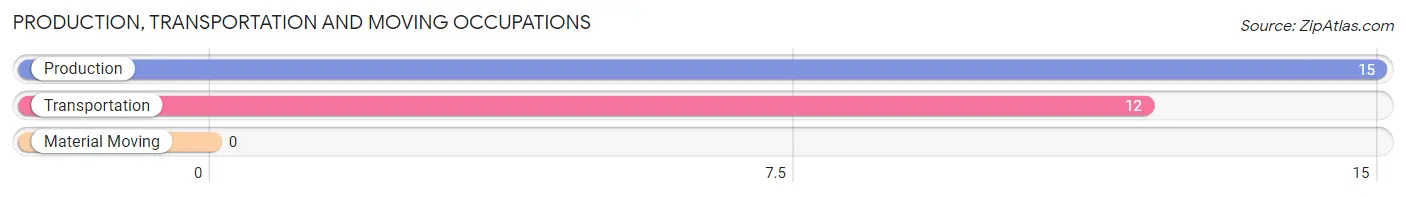
Production, Transportation and Moving Occupations by Sex
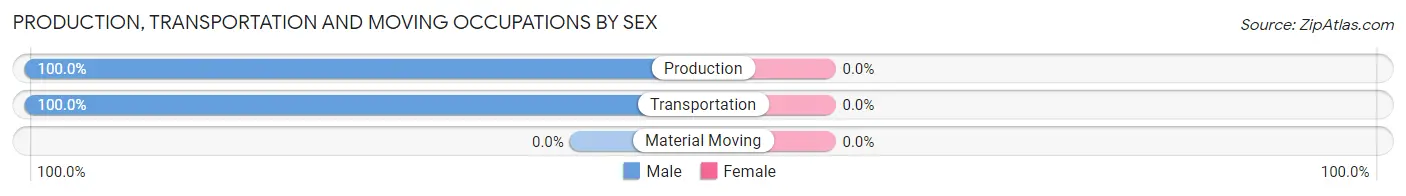
| Occupation | Male | Female |
| Production | 15 (100.0%) | 0 (0.0%) |
| Transportation | 12 (100.0%) | 0 (0.0%) |
| Material Moving | 0 (0.0%) | 0 (0.0%) |
| Total (Category) | 27 (100.0%) | 0 (0.0%) |
| Total (Overall) | 219 (41.1%) | 314 (58.9%) |
Employment Industries by Sex in Montgomery
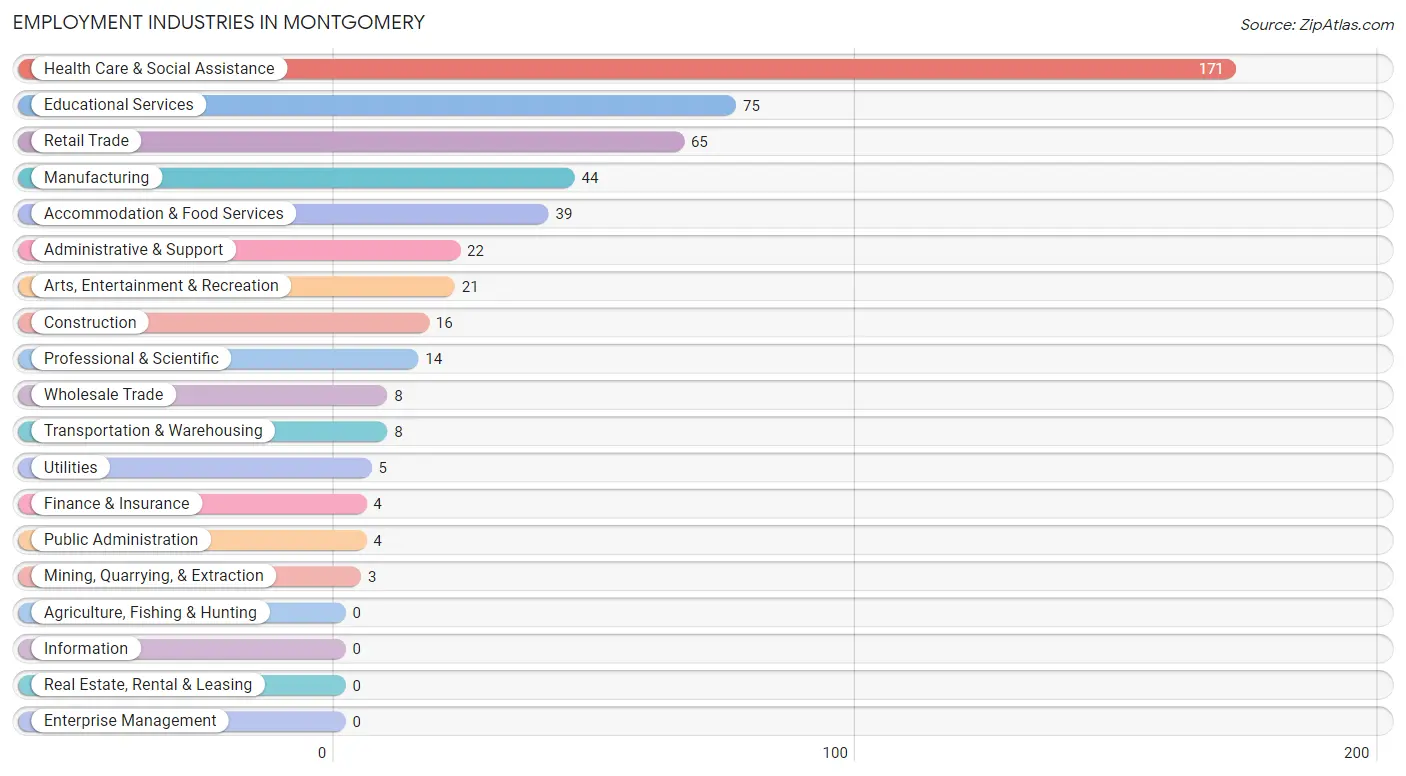
Employment Industries in Montgomery
The major employment industries in Montgomery include Health Care & Social Assistance (171 | 32.1%), Educational Services (75 | 14.1%), Retail Trade (65 | 12.2%), Manufacturing (44 | 8.3%), and Accommodation & Food Services (39 | 7.3%).
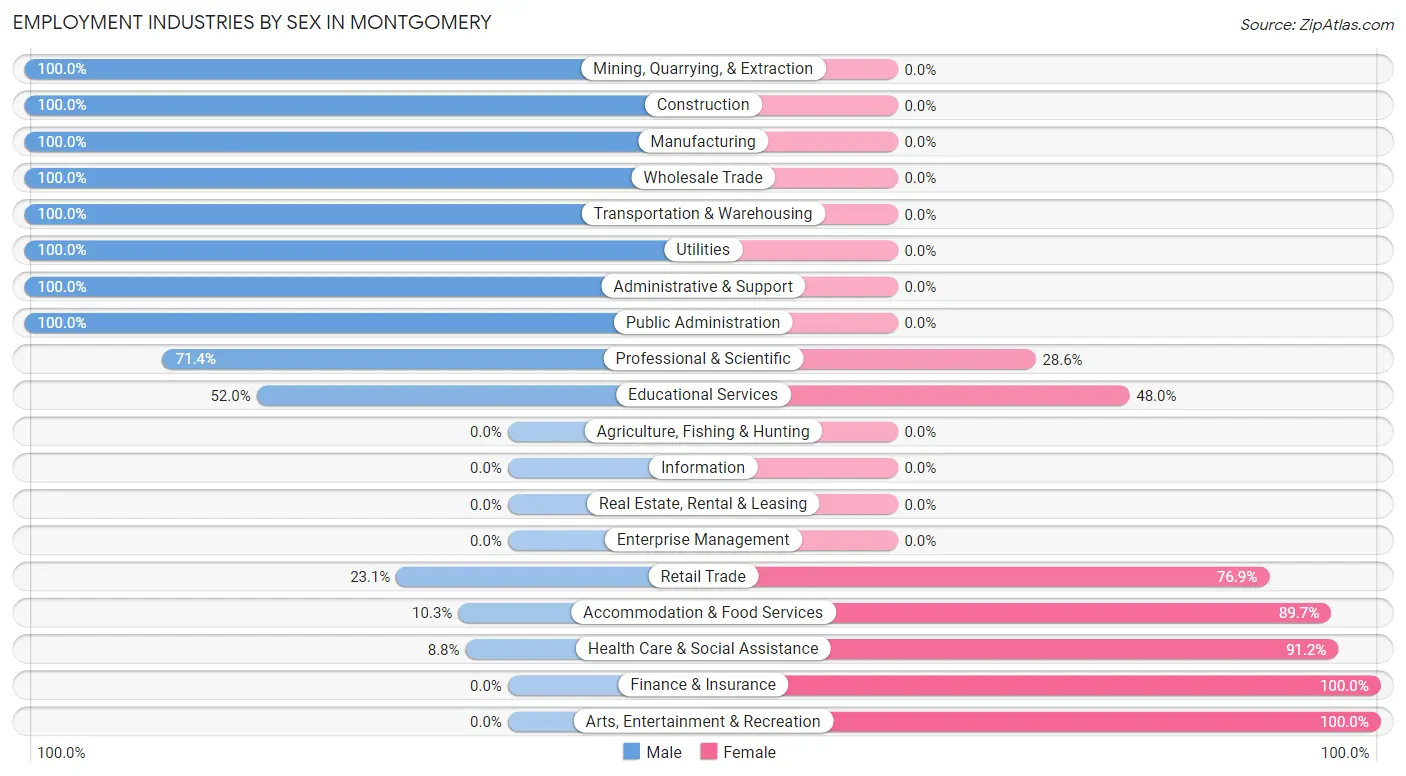
Employment Industries by Sex in Montgomery
The Montgomery industries that see more men than women are Mining, Quarrying, & Extraction (100.0%), Construction (100.0%), and Manufacturing (100.0%), whereas the industries that tend to have a higher number of women are Finance & Insurance (100.0%), Arts, Entertainment & Recreation (100.0%), and Health Care & Social Assistance (91.2%).
| Industry | Male | Female |
| Agriculture, Fishing & Hunting | 0 (0.0%) | 0 (0.0%) |
| Mining, Quarrying, & Extraction | 3 (100.0%) | 0 (0.0%) |
| Construction | 16 (100.0%) | 0 (0.0%) |
| Manufacturing | 44 (100.0%) | 0 (0.0%) |
| Wholesale Trade | 8 (100.0%) | 0 (0.0%) |
| Retail Trade | 15 (23.1%) | 50 (76.9%) |
| Transportation & Warehousing | 8 (100.0%) | 0 (0.0%) |
| Utilities | 5 (100.0%) | 0 (0.0%) |
| Information | 0 (0.0%) | 0 (0.0%) |
| Finance & Insurance | 0 (0.0%) | 4 (100.0%) |
| Real Estate, Rental & Leasing | 0 (0.0%) | 0 (0.0%) |
| Professional & Scientific | 10 (71.4%) | 4 (28.6%) |
| Enterprise Management | 0 (0.0%) | 0 (0.0%) |
| Administrative & Support | 22 (100.0%) | 0 (0.0%) |
| Educational Services | 39 (52.0%) | 36 (48.0%) |
| Health Care & Social Assistance | 15 (8.8%) | 156 (91.2%) |
| Arts, Entertainment & Recreation | 0 (0.0%) | 21 (100.0%) |
| Accommodation & Food Services | 4 (10.3%) | 35 (89.7%) |
| Public Administration | 4 (100.0%) | 0 (0.0%) |
| Total | 219 (41.1%) | 314 (58.9%) |
Education in Montgomery
School Enrollment in Montgomery
The most common levels of schooling among the 479 students in Montgomery are college / undergraduate (274 | 57.2%), elementary school (93 | 19.4%), and high school (44 | 9.2%).
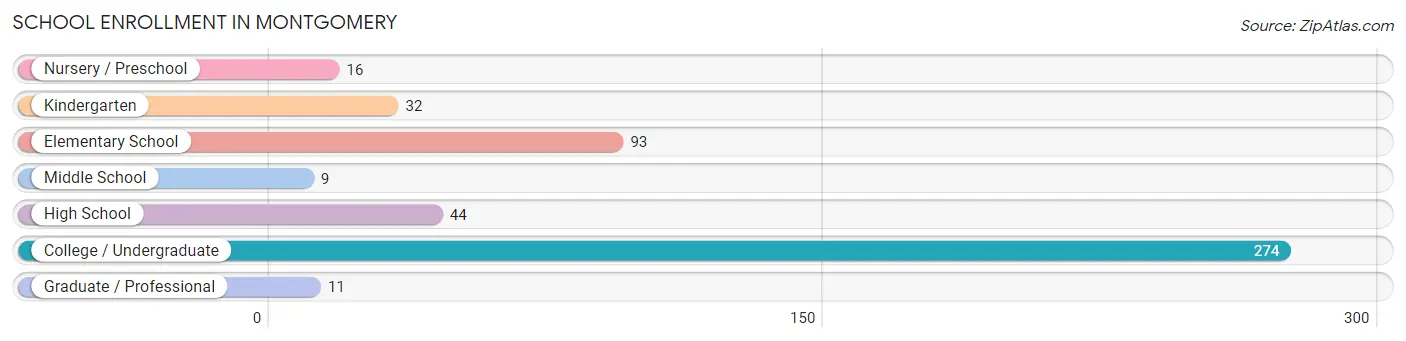
| School Level | # Students | % Students |
| Nursery / Preschool | 16 | 3.3% |
| Kindergarten | 32 | 6.7% |
| Elementary School | 93 | 19.4% |
| Middle School | 9 | 1.9% |
| High School | 44 | 9.2% |
| College / Undergraduate | 274 | 57.2% |
| Graduate / Professional | 11 | 2.3% |
| Total | 479 | 100.0% |
School Enrollment by Age by Funding Source in Montgomery
Out of a total of 479 students who are enrolled in schools in Montgomery, 87 (18.2%) attend a private institution, while the remaining 392 (81.8%) are enrolled in public schools. The age group of 20 to 24 year olds has the highest likelihood of being enrolled in private schools, with 79 (46.8% in the age bracket) enrolled. Conversely, the age group of 5 to 9 year old has the lowest likelihood of being enrolled in a private school, with 125 (100.0% in the age bracket) attending a public institution.
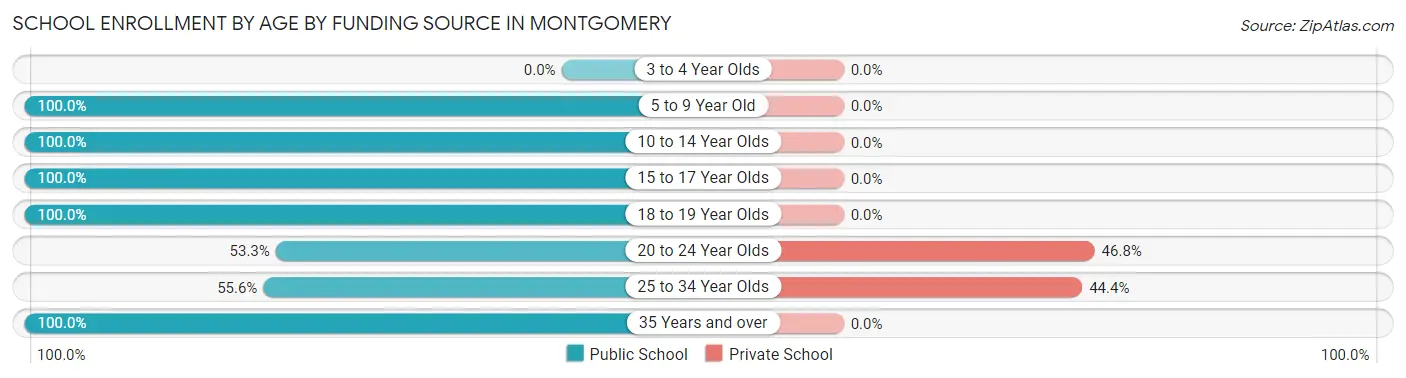
| Age Bracket | Public School | Private School |
| 3 to 4 Year Olds | 0 (0.0%) | 0 (0.0%) |
| 5 to 9 Year Old | 125 (100.0%) | 0 (0.0%) |
| 10 to 14 Year Olds | 25 (100.0%) | 0 (0.0%) |
| 15 to 17 Year Olds | 33 (100.0%) | 0 (0.0%) |
| 18 to 19 Year Olds | 102 (100.0%) | 0 (0.0%) |
| 20 to 24 Year Olds | 90 (53.2%) | 79 (46.8%) |
| 25 to 34 Year Olds | 10 (55.6%) | 8 (44.4%) |
| 35 Years and over | 7 (100.0%) | 0 (0.0%) |
| Total | 392 (81.8%) | 87 (18.2%) |
Educational Attainment by Field of Study in Montgomery
Business (67 | 34.0%), education (31 | 15.7%), computers & mathematics (18 | 9.1%), physical & health sciences (16 | 8.1%), and communications (13 | 6.6%) are the most common fields of study among 197 individuals in Montgomery who have obtained a bachelor's degree or higher.
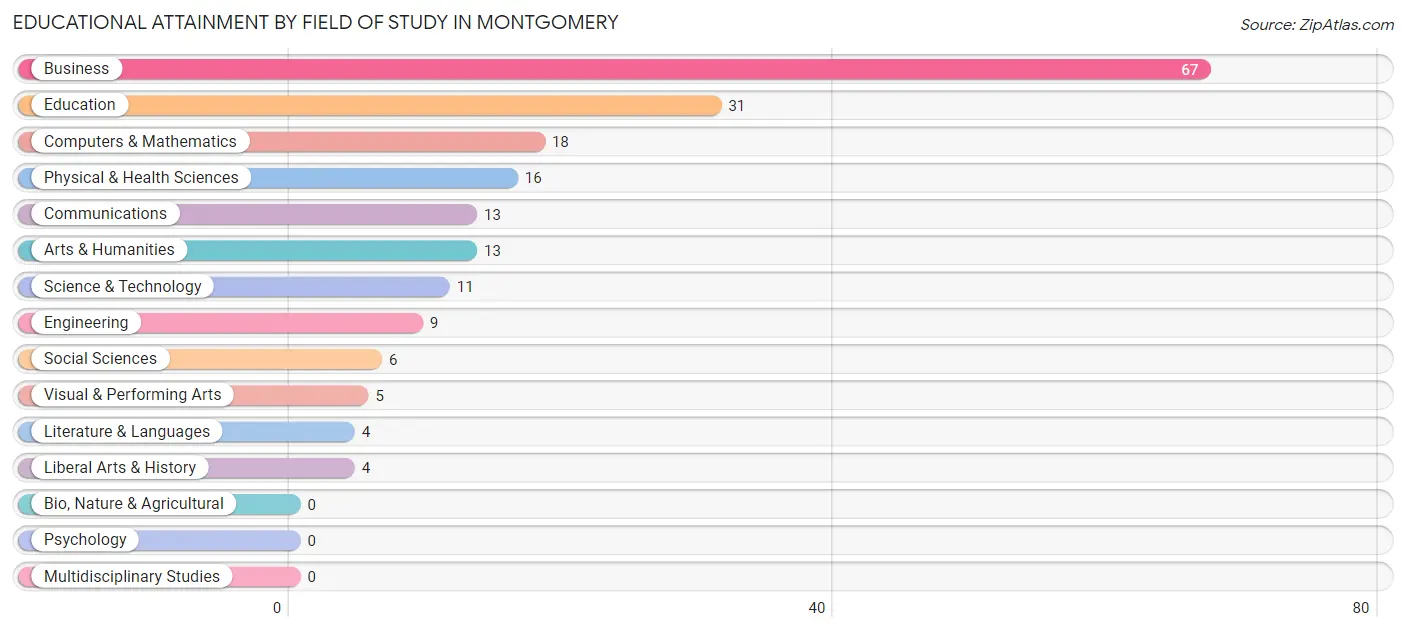
| Field of Study | # Graduates | % Graduates |
| Computers & Mathematics | 18 | 9.1% |
| Bio, Nature & Agricultural | 0 | 0.0% |
| Physical & Health Sciences | 16 | 8.1% |
| Psychology | 0 | 0.0% |
| Social Sciences | 6 | 3.0% |
| Engineering | 9 | 4.6% |
| Multidisciplinary Studies | 0 | 0.0% |
| Science & Technology | 11 | 5.6% |
| Business | 67 | 34.0% |
| Education | 31 | 15.7% |
| Literature & Languages | 4 | 2.0% |
| Liberal Arts & History | 4 | 2.0% |
| Visual & Performing Arts | 5 | 2.5% |
| Communications | 13 | 6.6% |
| Arts & Humanities | 13 | 6.6% |
| Total | 197 | 100.0% |
Transportation & Commute in Montgomery
Vehicle Availability by Sex in Montgomery
The most prevalent vehicle ownership categories in Montgomery are males with 1 vehicle (68, accounting for 39.5%) and females with 1 vehicle (67, making up 26.5%).
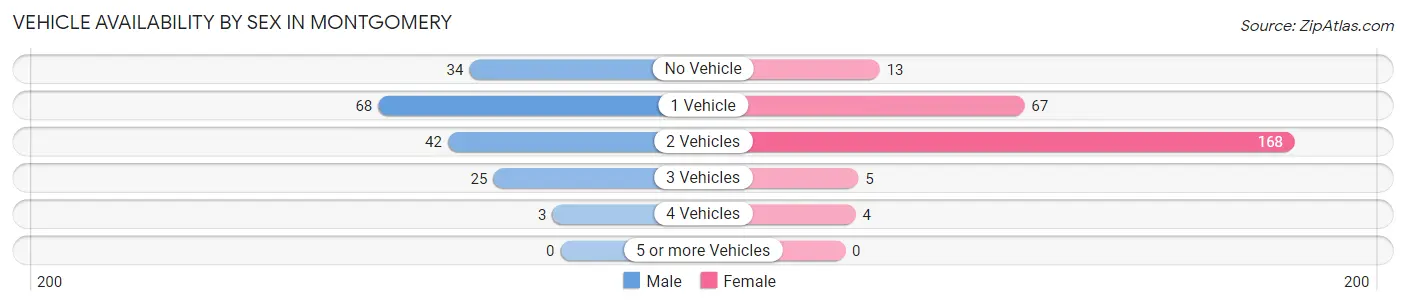
| Vehicles Available | Male | Female |
| No Vehicle | 34 (19.8%) | 13 (5.1%) |
| 1 Vehicle | 68 (39.5%) | 67 (26.1%) |
| 2 Vehicles | 42 (24.4%) | 168 (65.4%) |
| 3 Vehicles | 25 (14.5%) | 5 (1.9%) |
| 4 Vehicles | 3 (1.7%) | 4 (1.6%) |
| 5 or more Vehicles | 0 (0.0%) | 0 (0.0%) |
| Total | 172 (100.0%) | 257 (100.0%) |
Commute Time in Montgomery
The most frequently occuring commute durations in Montgomery are 45 to 59 minutes (134 commuters, 28.4%), 5 to 9 minutes (117 commuters, 24.8%), and 15 to 19 minutes (51 commuters, 10.8%).
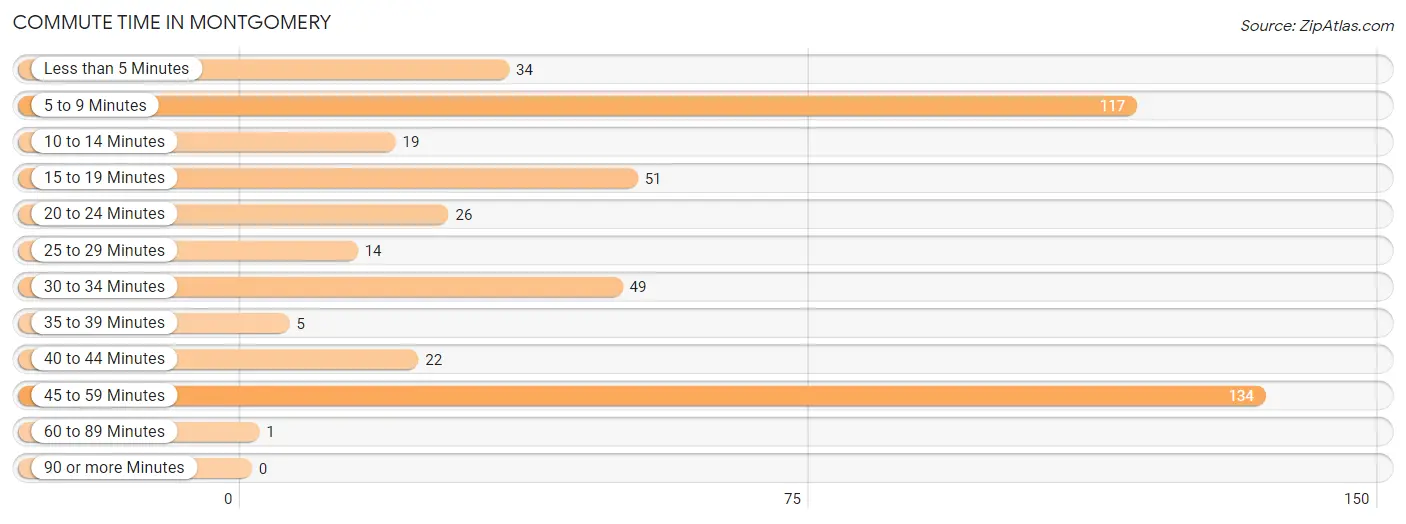
| Commute Time | # Commuters | % Commuters |
| Less than 5 Minutes | 34 | 7.2% |
| 5 to 9 Minutes | 117 | 24.8% |
| 10 to 14 Minutes | 19 | 4.0% |
| 15 to 19 Minutes | 51 | 10.8% |
| 20 to 24 Minutes | 26 | 5.5% |
| 25 to 29 Minutes | 14 | 3.0% |
| 30 to 34 Minutes | 49 | 10.4% |
| 35 to 39 Minutes | 5 | 1.1% |
| 40 to 44 Minutes | 22 | 4.7% |
| 45 to 59 Minutes | 134 | 28.4% |
| 60 to 89 Minutes | 1 | 0.2% |
| 90 or more Minutes | 0 | 0.0% |
Commute Time by Sex in Montgomery
The most common commute times in Montgomery are 30 to 34 minutes (36 commuters, 19.5%) for males and 45 to 59 minutes (98 commuters, 34.2%) for females.
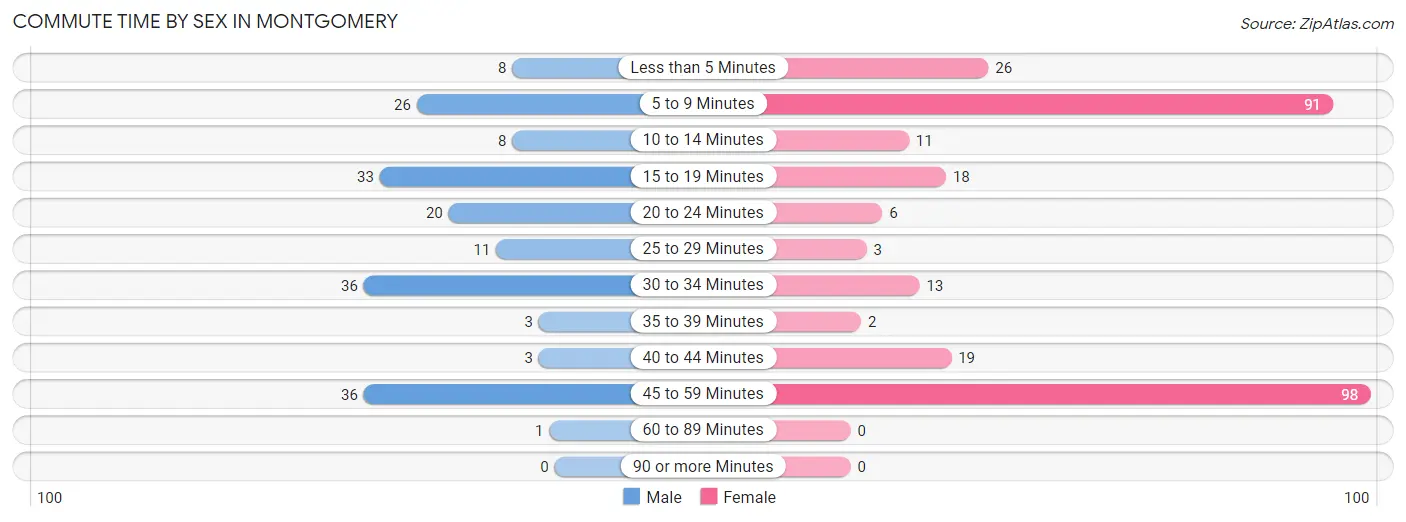
| Commute Time | Male | Female |
| Less than 5 Minutes | 8 (4.3%) | 26 (9.1%) |
| 5 to 9 Minutes | 26 (14.1%) | 91 (31.7%) |
| 10 to 14 Minutes | 8 (4.3%) | 11 (3.8%) |
| 15 to 19 Minutes | 33 (17.8%) | 18 (6.3%) |
| 20 to 24 Minutes | 20 (10.8%) | 6 (2.1%) |
| 25 to 29 Minutes | 11 (5.9%) | 3 (1.1%) |
| 30 to 34 Minutes | 36 (19.5%) | 13 (4.5%) |
| 35 to 39 Minutes | 3 (1.6%) | 2 (0.7%) |
| 40 to 44 Minutes | 3 (1.6%) | 19 (6.6%) |
| 45 to 59 Minutes | 36 (19.5%) | 98 (34.2%) |
| 60 to 89 Minutes | 1 (0.5%) | 0 (0.0%) |
| 90 or more Minutes | 0 (0.0%) | 0 (0.0%) |
Time of Departure to Work by Sex in Montgomery
The most frequent times of departure to work in Montgomery are 4:00 PM to 11:59 PM (48, 26.0%) for males and 4:00 PM to 11:59 PM (106, 36.9%) for females.
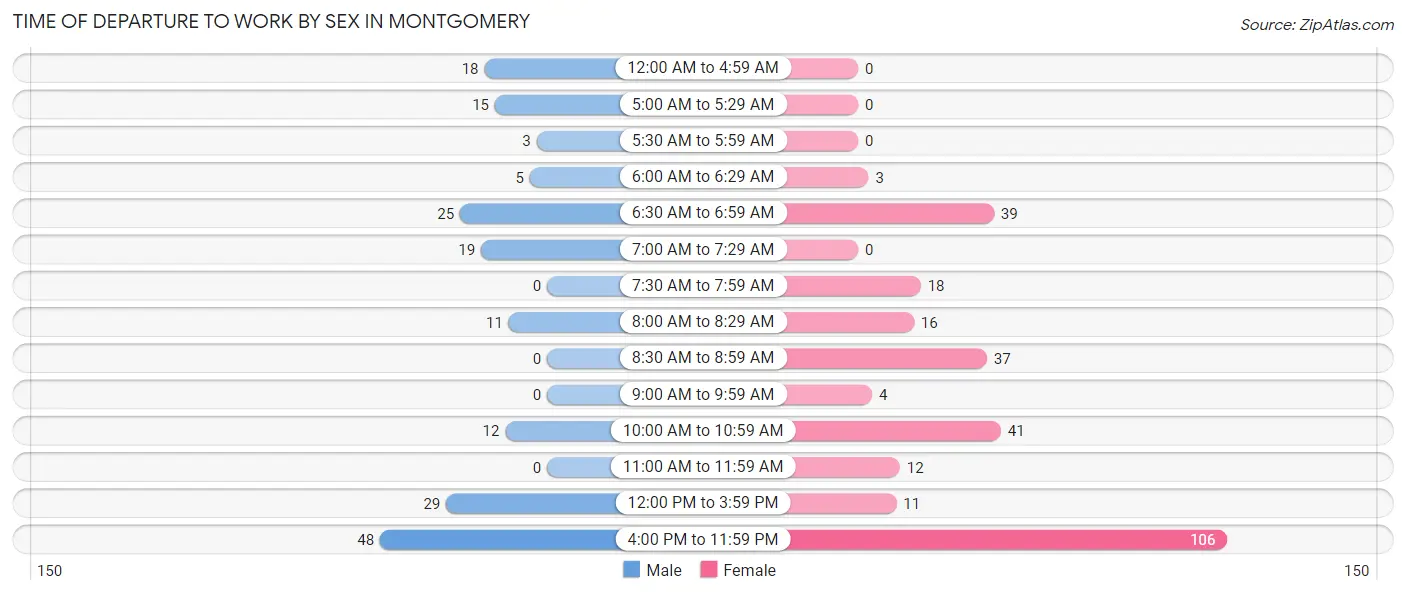
| Time of Departure | Male | Female |
| 12:00 AM to 4:59 AM | 18 (9.7%) | 0 (0.0%) |
| 5:00 AM to 5:29 AM | 15 (8.1%) | 0 (0.0%) |
| 5:30 AM to 5:59 AM | 3 (1.6%) | 0 (0.0%) |
| 6:00 AM to 6:29 AM | 5 (2.7%) | 3 (1.1%) |
| 6:30 AM to 6:59 AM | 25 (13.5%) | 39 (13.6%) |
| 7:00 AM to 7:29 AM | 19 (10.3%) | 0 (0.0%) |
| 7:30 AM to 7:59 AM | 0 (0.0%) | 18 (6.3%) |
| 8:00 AM to 8:29 AM | 11 (5.9%) | 16 (5.6%) |
| 8:30 AM to 8:59 AM | 0 (0.0%) | 37 (12.9%) |
| 9:00 AM to 9:59 AM | 0 (0.0%) | 4 (1.4%) |
| 10:00 AM to 10:59 AM | 12 (6.5%) | 41 (14.3%) |
| 11:00 AM to 11:59 AM | 0 (0.0%) | 12 (4.2%) |
| 12:00 PM to 3:59 PM | 29 (15.7%) | 11 (3.8%) |
| 4:00 PM to 11:59 PM | 48 (26.0%) | 106 (36.9%) |
| Total | 185 (100.0%) | 287 (100.0%) |
Housing Occupancy in Montgomery
Occupancy by Ownership in Montgomery
Of the total 650 dwellings in Montgomery, owner-occupied units account for 200 (30.8%), while renter-occupied units make up 450 (69.2%).
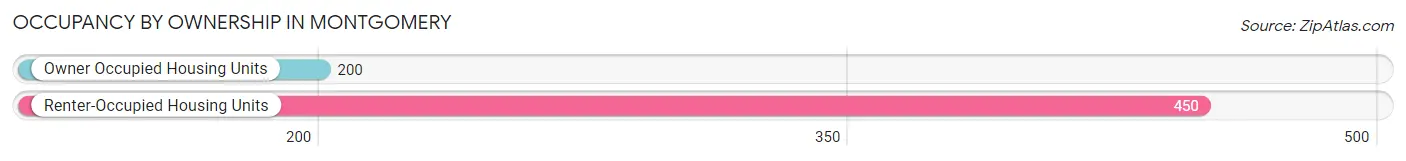
| Occupancy | # Housing Units | % Housing Units |
| Owner Occupied Housing Units | 200 | 30.8% |
| Renter-Occupied Housing Units | 450 | 69.2% |
| Total Occupied Housing Units | 650 | 100.0% |
Occupancy by Household Size in Montgomery
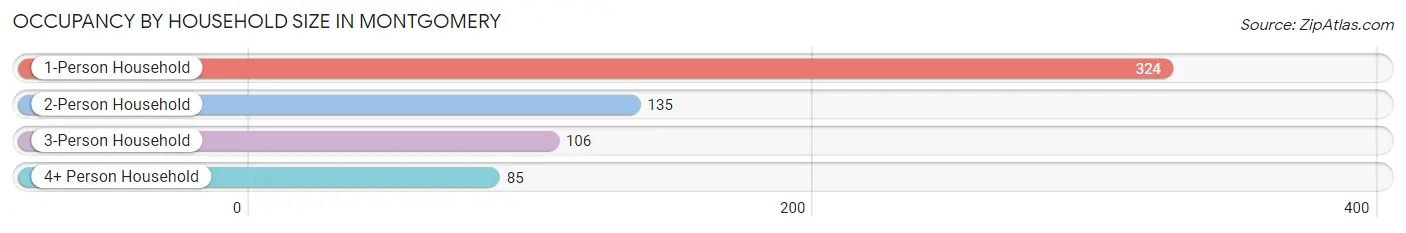
| Household Size | # Housing Units | % Housing Units |
| 1-Person Household | 324 | 49.8% |
| 2-Person Household | 135 | 20.8% |
| 3-Person Household | 106 | 16.3% |
| 4+ Person Household | 85 | 13.1% |
| Total Housing Units | 650 | 100.0% |
Occupancy by Ownership by Household Size in Montgomery
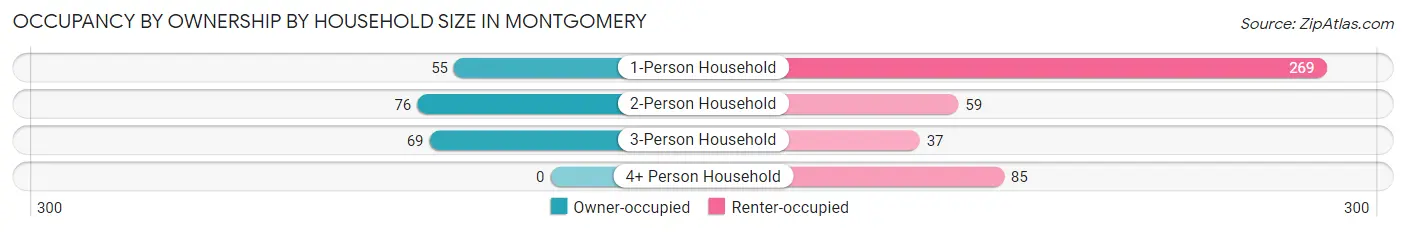
| Household Size | Owner-occupied | Renter-occupied |
| 1-Person Household | 55 (17.0%) | 269 (83.0%) |
| 2-Person Household | 76 (56.3%) | 59 (43.7%) |
| 3-Person Household | 69 (65.1%) | 37 (34.9%) |
| 4+ Person Household | 0 (0.0%) | 85 (100.0%) |
| Total Housing Units | 200 (30.8%) | 450 (69.2%) |
Occupancy by Educational Attainment in Montgomery
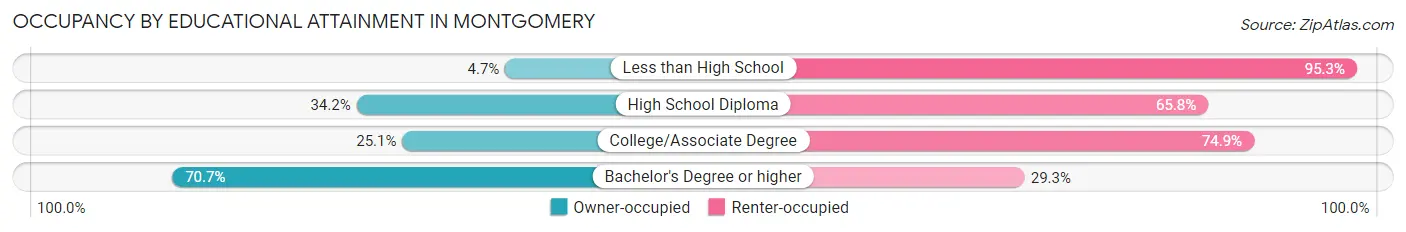
| Household Size | Owner-occupied | Renter-occupied |
| Less than High School | 5 (4.7%) | 101 (95.3%) |
| High School Diploma | 79 (34.2%) | 152 (65.8%) |
| College/Associate Degree | 58 (25.1%) | 173 (74.9%) |
| Bachelor's Degree or higher | 58 (70.7%) | 24 (29.3%) |
Occupancy by Age of Householder in Montgomery
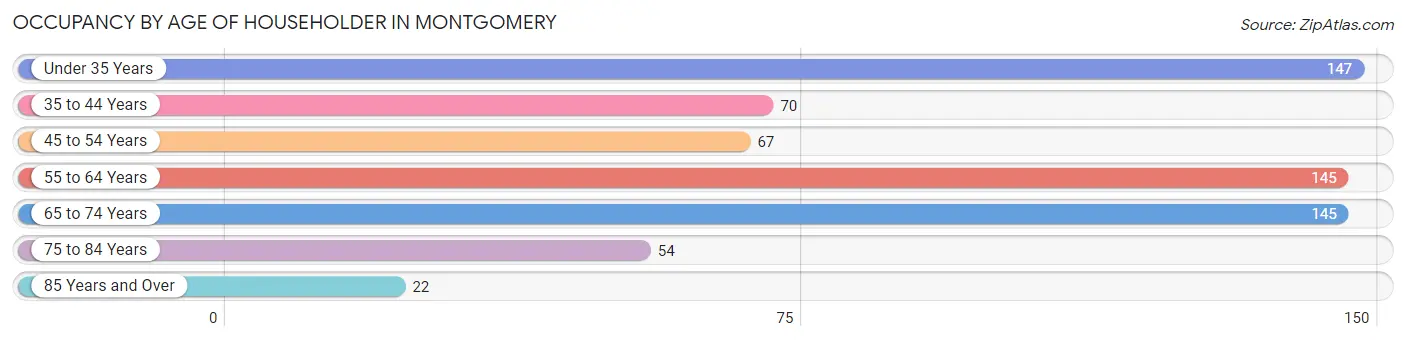
| Age Bracket | # Households | % Households |
| Under 35 Years | 147 | 22.6% |
| 35 to 44 Years | 70 | 10.8% |
| 45 to 54 Years | 67 | 10.3% |
| 55 to 64 Years | 145 | 22.3% |
| 65 to 74 Years | 145 | 22.3% |
| 75 to 84 Years | 54 | 8.3% |
| 85 Years and Over | 22 | 3.4% |
| Total | 650 | 100.0% |
Housing Finances in Montgomery
Median Income by Occupancy in Montgomery
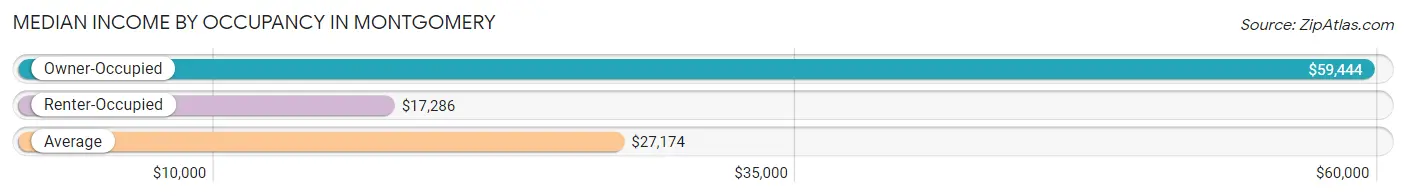
| Occupancy Type | # Households | Median Income |
| Owner-Occupied | 200 (30.8%) | $59,444 |
| Renter-Occupied | 450 (69.2%) | $17,286 |
| Average | 650 (100.0%) | $27,174 |
Occupancy by Householder Income Bracket in Montgomery
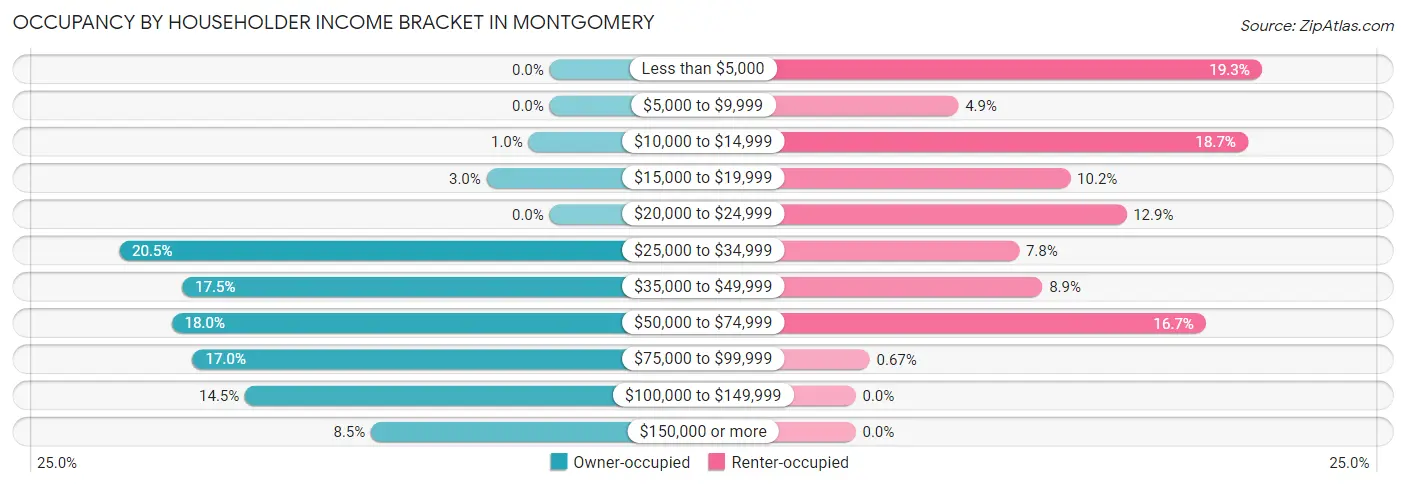
| Income Bracket | Owner-occupied | Renter-occupied |
| Less than $5,000 | 0 (0.0%) | 87 (19.3%) |
| $5,000 to $9,999 | 0 (0.0%) | 22 (4.9%) |
| $10,000 to $14,999 | 2 (1.0%) | 84 (18.7%) |
| $15,000 to $19,999 | 6 (3.0%) | 46 (10.2%) |
| $20,000 to $24,999 | 0 (0.0%) | 58 (12.9%) |
| $25,000 to $34,999 | 41 (20.5%) | 35 (7.8%) |
| $35,000 to $49,999 | 35 (17.5%) | 40 (8.9%) |
| $50,000 to $74,999 | 36 (18.0%) | 75 (16.7%) |
| $75,000 to $99,999 | 34 (17.0%) | 3 (0.7%) |
| $100,000 to $149,999 | 29 (14.5%) | 0 (0.0%) |
| $150,000 or more | 17 (8.5%) | 0 (0.0%) |
| Total | 200 (100.0%) | 450 (100.0%) |
Monthly Housing Cost Tiers in Montgomery
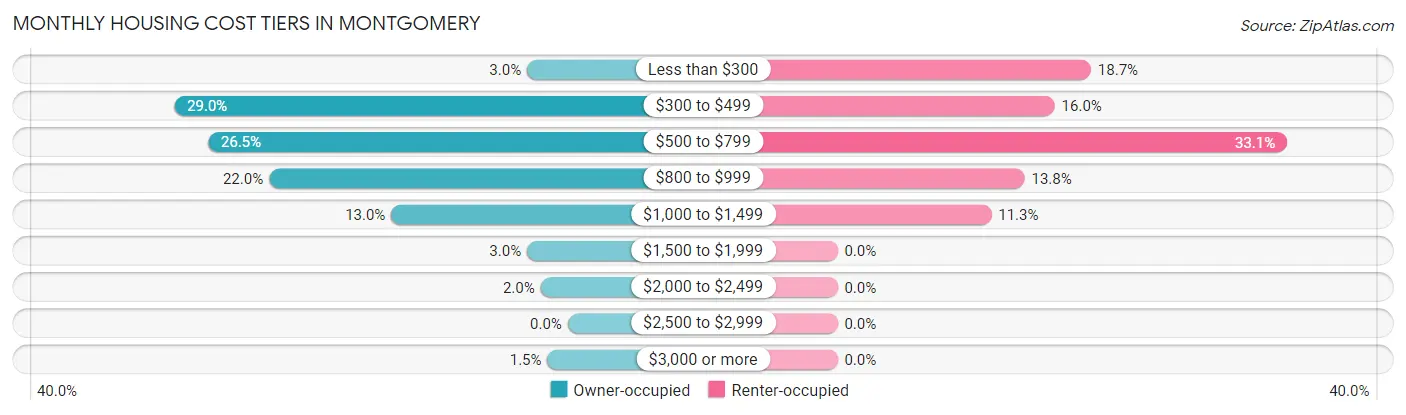
| Monthly Cost | Owner-occupied | Renter-occupied |
| Less than $300 | 6 (3.0%) | 84 (18.7%) |
| $300 to $499 | 58 (29.0%) | 72 (16.0%) |
| $500 to $799 | 53 (26.5%) | 149 (33.1%) |
| $800 to $999 | 44 (22.0%) | 62 (13.8%) |
| $1,000 to $1,499 | 26 (13.0%) | 51 (11.3%) |
| $1,500 to $1,999 | 6 (3.0%) | 0 (0.0%) |
| $2,000 to $2,499 | 4 (2.0%) | 0 (0.0%) |
| $2,500 to $2,999 | 0 (0.0%) | 0 (0.0%) |
| $3,000 or more | 3 (1.5%) | 0 (0.0%) |
| Total | 200 (100.0%) | 450 (100.0%) |
Physical Housing Characteristics in Montgomery
Housing Structures in Montgomery
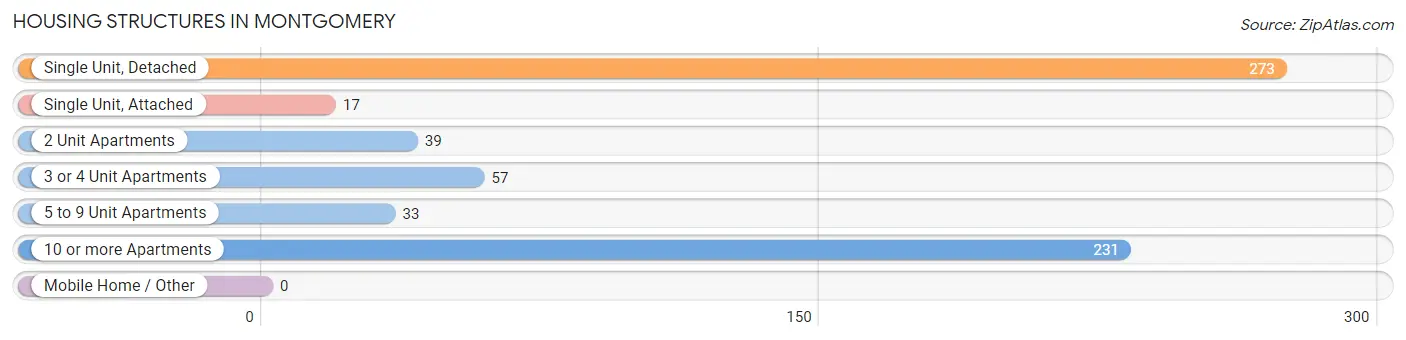
| Structure Type | # Housing Units | % Housing Units |
| Single Unit, Detached | 273 | 42.0% |
| Single Unit, Attached | 17 | 2.6% |
| 2 Unit Apartments | 39 | 6.0% |
| 3 or 4 Unit Apartments | 57 | 8.8% |
| 5 to 9 Unit Apartments | 33 | 5.1% |
| 10 or more Apartments | 231 | 35.5% |
| Mobile Home / Other | 0 | 0.0% |
| Total | 650 | 100.0% |
Housing Structures by Occupancy in Montgomery
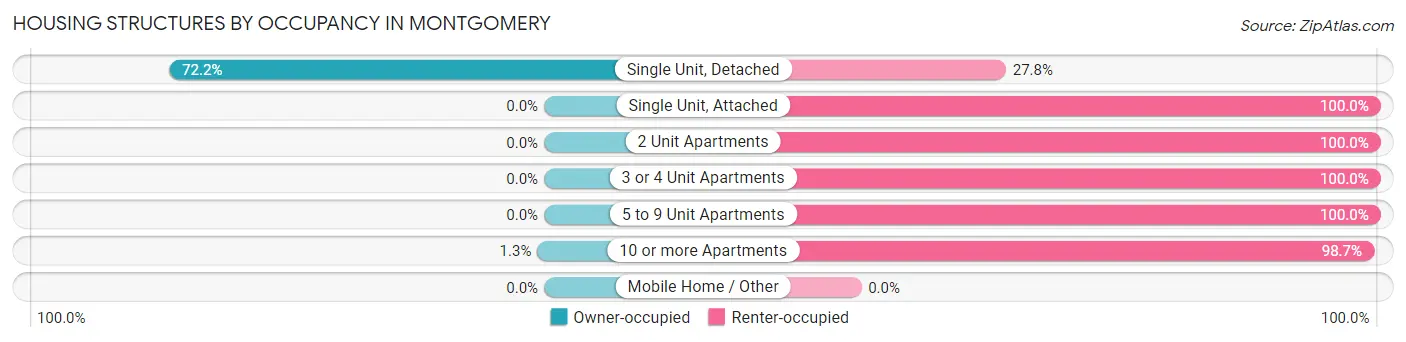
| Structure Type | Owner-occupied | Renter-occupied |
| Single Unit, Detached | 197 (72.2%) | 76 (27.8%) |
| Single Unit, Attached | 0 (0.0%) | 17 (100.0%) |
| 2 Unit Apartments | 0 (0.0%) | 39 (100.0%) |
| 3 or 4 Unit Apartments | 0 (0.0%) | 57 (100.0%) |
| 5 to 9 Unit Apartments | 0 (0.0%) | 33 (100.0%) |
| 10 or more Apartments | 3 (1.3%) | 228 (98.7%) |
| Mobile Home / Other | 0 (0.0%) | 0 (0.0%) |
| Total | 200 (30.8%) | 450 (69.2%) |
Housing Structures by Number of Rooms in Montgomery
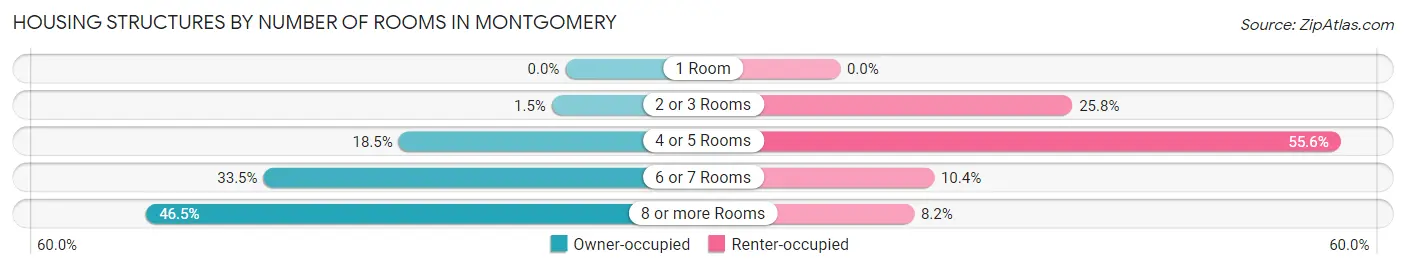
| Number of Rooms | Owner-occupied | Renter-occupied |
| 1 Room | 0 (0.0%) | 0 (0.0%) |
| 2 or 3 Rooms | 3 (1.5%) | 116 (25.8%) |
| 4 or 5 Rooms | 37 (18.5%) | 250 (55.6%) |
| 6 or 7 Rooms | 67 (33.5%) | 47 (10.4%) |
| 8 or more Rooms | 93 (46.5%) | 37 (8.2%) |
| Total | 200 (100.0%) | 450 (100.0%) |
Housing Structure by Heating Type in Montgomery
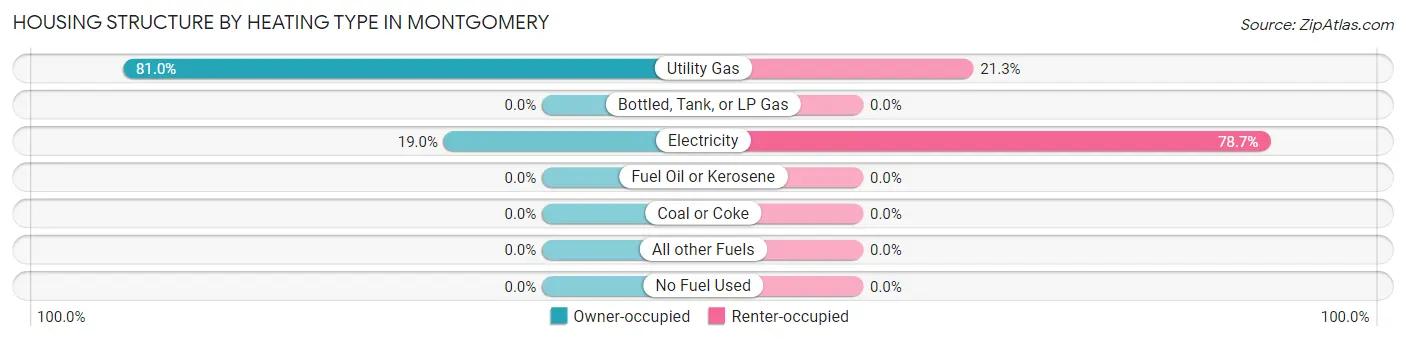
| Heating Type | Owner-occupied | Renter-occupied |
| Utility Gas | 162 (81.0%) | 96 (21.3%) |
| Bottled, Tank, or LP Gas | 0 (0.0%) | 0 (0.0%) |
| Electricity | 38 (19.0%) | 354 (78.7%) |
| Fuel Oil or Kerosene | 0 (0.0%) | 0 (0.0%) |
| Coal or Coke | 0 (0.0%) | 0 (0.0%) |
| All other Fuels | 0 (0.0%) | 0 (0.0%) |
| No Fuel Used | 0 (0.0%) | 0 (0.0%) |
| Total | 200 (100.0%) | 450 (100.0%) |
Household Vehicle Usage in Montgomery
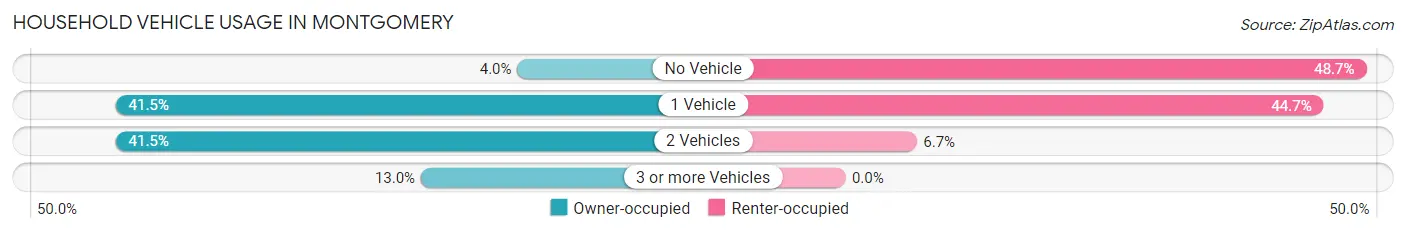
| Vehicles per Household | Owner-occupied | Renter-occupied |
| No Vehicle | 8 (4.0%) | 219 (48.7%) |
| 1 Vehicle | 83 (41.5%) | 201 (44.7%) |
| 2 Vehicles | 83 (41.5%) | 30 (6.7%) |
| 3 or more Vehicles | 26 (13.0%) | 0 (0.0%) |
| Total | 200 (100.0%) | 450 (100.0%) |
Real Estate & Mortgages in Montgomery
Real Estate and Mortgage Overview in Montgomery
| Characteristic | Without Mortgage | With Mortgage |
| Housing Units | 104 | 96 |
| Median Property Value | $139,700 | $87,500 |
| Median Household Income | $36,111 | $11 |
| Monthly Housing Costs | $470 | $3 |
| Real Estate Taxes | $553 | $16 |
Property Value by Mortgage Status in Montgomery
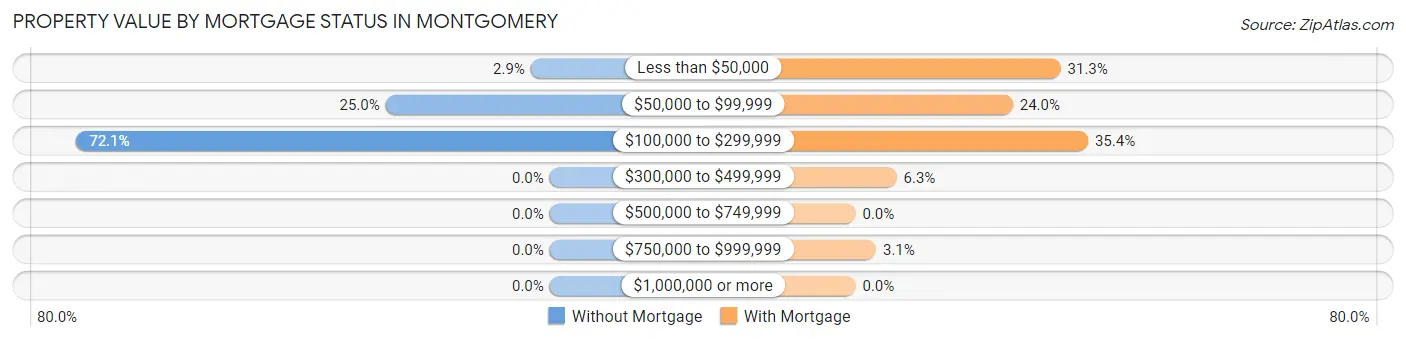
| Property Value | Without Mortgage | With Mortgage |
| Less than $50,000 | 3 (2.9%) | 30 (31.2%) |
| $50,000 to $99,999 | 26 (25.0%) | 23 (24.0%) |
| $100,000 to $299,999 | 75 (72.1%) | 34 (35.4%) |
| $300,000 to $499,999 | 0 (0.0%) | 6 (6.2%) |
| $500,000 to $749,999 | 0 (0.0%) | 0 (0.0%) |
| $750,000 to $999,999 | 0 (0.0%) | 3 (3.1%) |
| $1,000,000 or more | 0 (0.0%) | 0 (0.0%) |
| Total | 104 (100.0%) | 96 (100.0%) |
Household Income by Mortgage Status in Montgomery
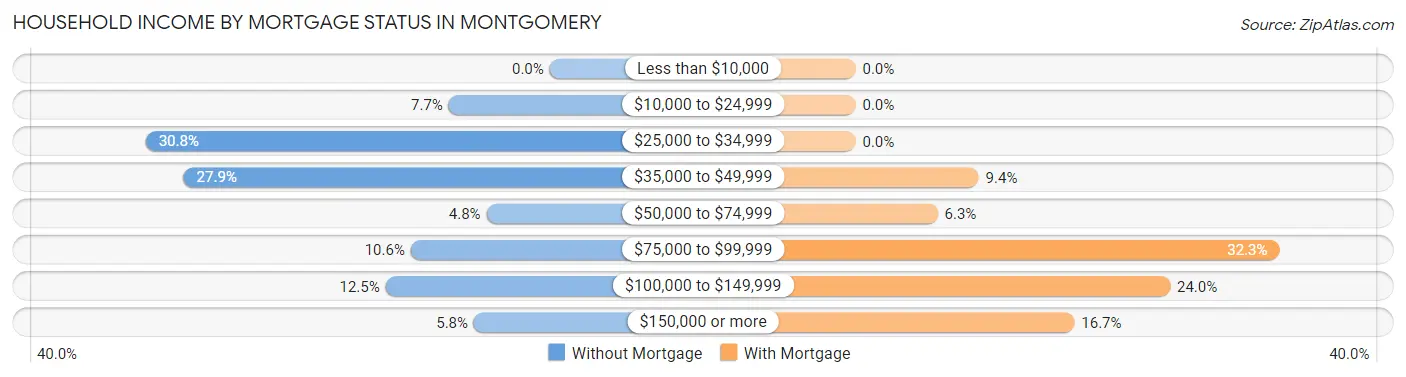
| Household Income | Without Mortgage | With Mortgage |
| Less than $10,000 | 0 (0.0%) | 0 (0.0%) |
| $10,000 to $24,999 | 8 (7.7%) | 0 (0.0%) |
| $25,000 to $34,999 | 32 (30.8%) | 0 (0.0%) |
| $35,000 to $49,999 | 29 (27.9%) | 9 (9.4%) |
| $50,000 to $74,999 | 5 (4.8%) | 6 (6.2%) |
| $75,000 to $99,999 | 11 (10.6%) | 31 (32.3%) |
| $100,000 to $149,999 | 13 (12.5%) | 23 (24.0%) |
| $150,000 or more | 6 (5.8%) | 16 (16.7%) |
| Total | 104 (100.0%) | 96 (100.0%) |
Property Value to Household Income Ratio in Montgomery
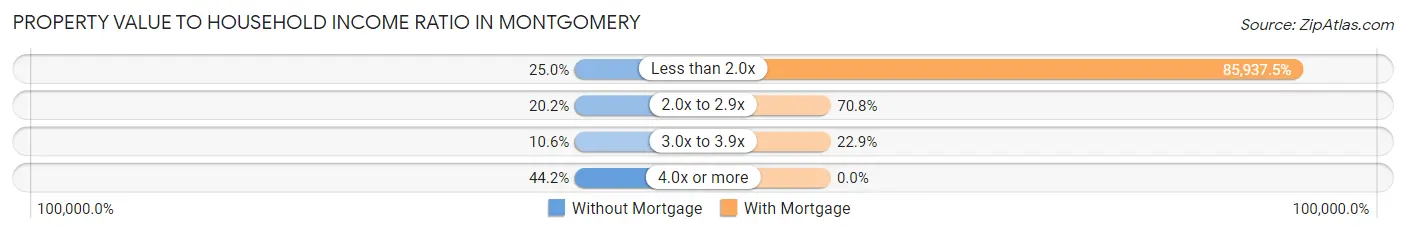
| Value-to-Income Ratio | Without Mortgage | With Mortgage |
| Less than 2.0x | 26 (25.0%) | 82,500 (85,937.5%) |
| 2.0x to 2.9x | 21 (20.2%) | 68 (70.8%) |
| 3.0x to 3.9x | 11 (10.6%) | 22 (22.9%) |
| 4.0x or more | 46 (44.2%) | 0 (0.0%) |
| Total | 104 (100.0%) | 96 (100.0%) |
Real Estate Taxes by Mortgage Status in Montgomery
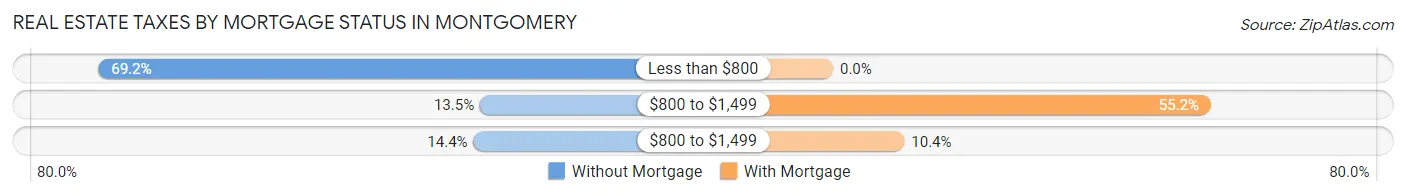
| Property Taxes | Without Mortgage | With Mortgage |
| Less than $800 | 72 (69.2%) | 0 (0.0%) |
| $800 to $1,499 | 14 (13.5%) | 53 (55.2%) |
| $800 to $1,499 | 15 (14.4%) | 10 (10.4%) |
| Total | 104 (100.0%) | 96 (100.0%) |
Health & Disability in Montgomery
Health Insurance Coverage by Age in Montgomery
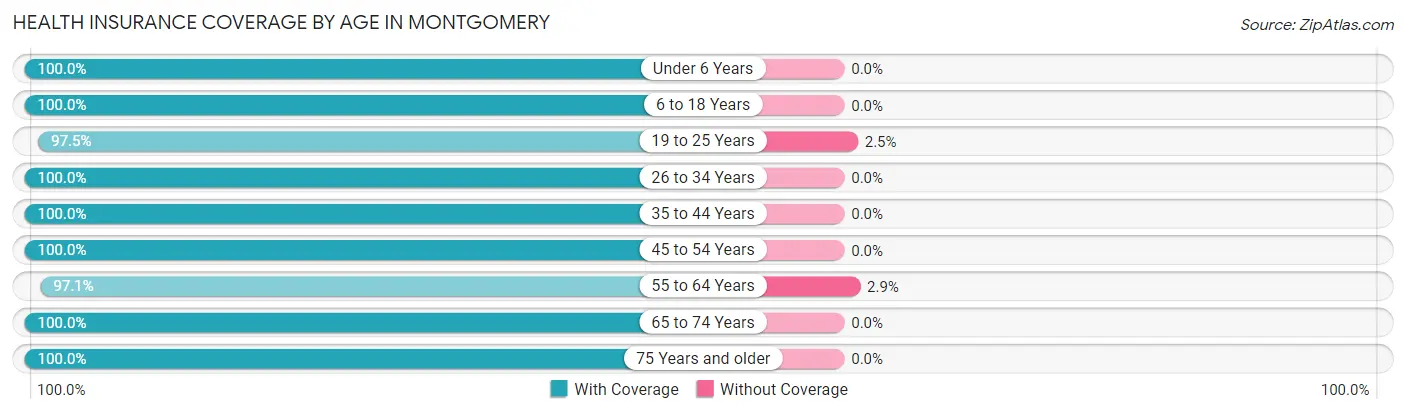
| Age Bracket | With Coverage | Without Coverage |
| Under 6 Years | 156 (100.0%) | 0 (0.0%) |
| 6 to 18 Years | 208 (100.0%) | 0 (0.0%) |
| 19 to 25 Years | 311 (97.5%) | 8 (2.5%) |
| 26 to 34 Years | 147 (100.0%) | 0 (0.0%) |
| 35 to 44 Years | 195 (100.0%) | 0 (0.0%) |
| 45 to 54 Years | 165 (100.0%) | 0 (0.0%) |
| 55 to 64 Years | 198 (97.1%) | 6 (2.9%) |
| 65 to 74 Years | 182 (100.0%) | 0 (0.0%) |
| 75 Years and older | 86 (100.0%) | 0 (0.0%) |
| Total | 1,648 (99.2%) | 14 (0.8%) |
Health Insurance Coverage by Citizenship Status in Montgomery
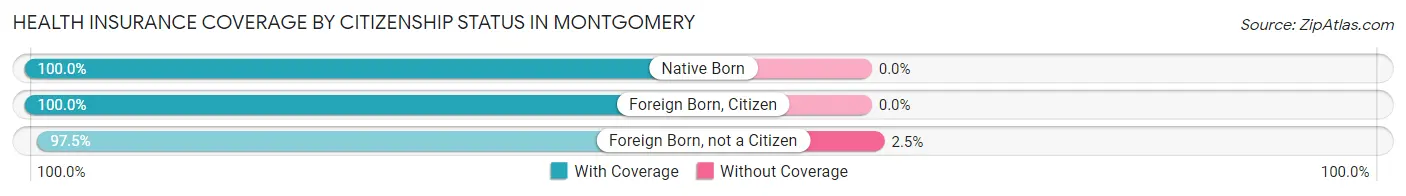
| Citizenship Status | With Coverage | Without Coverage |
| Native Born | 156 (100.0%) | 0 (0.0%) |
| Foreign Born, Citizen | 208 (100.0%) | 0 (0.0%) |
| Foreign Born, not a Citizen | 311 (97.5%) | 8 (2.5%) |
Health Insurance Coverage by Household Income in Montgomery
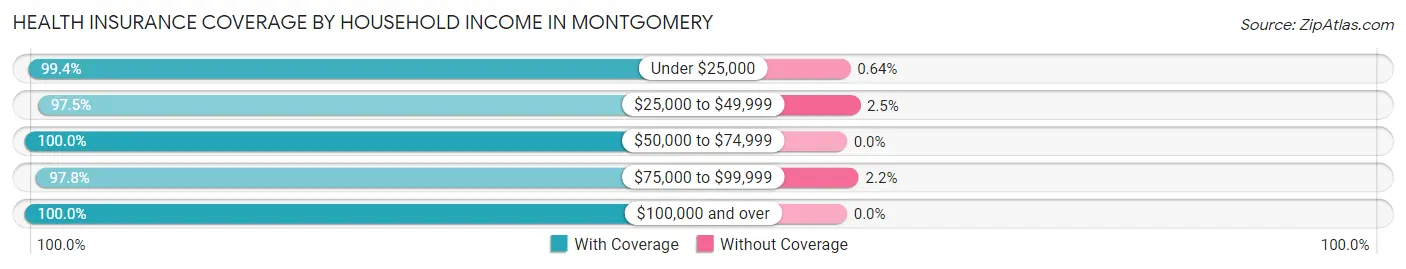
| Household Income | With Coverage | Without Coverage |
| Under $25,000 | 618 (99.4%) | 4 (0.6%) |
| $25,000 to $49,999 | 315 (97.5%) | 8 (2.5%) |
| $50,000 to $74,999 | 347 (100.0%) | 0 (0.0%) |
| $75,000 to $99,999 | 88 (97.8%) | 2 (2.2%) |
| $100,000 and over | 96 (100.0%) | 0 (0.0%) |
Public vs Private Health Insurance Coverage by Age in Montgomery
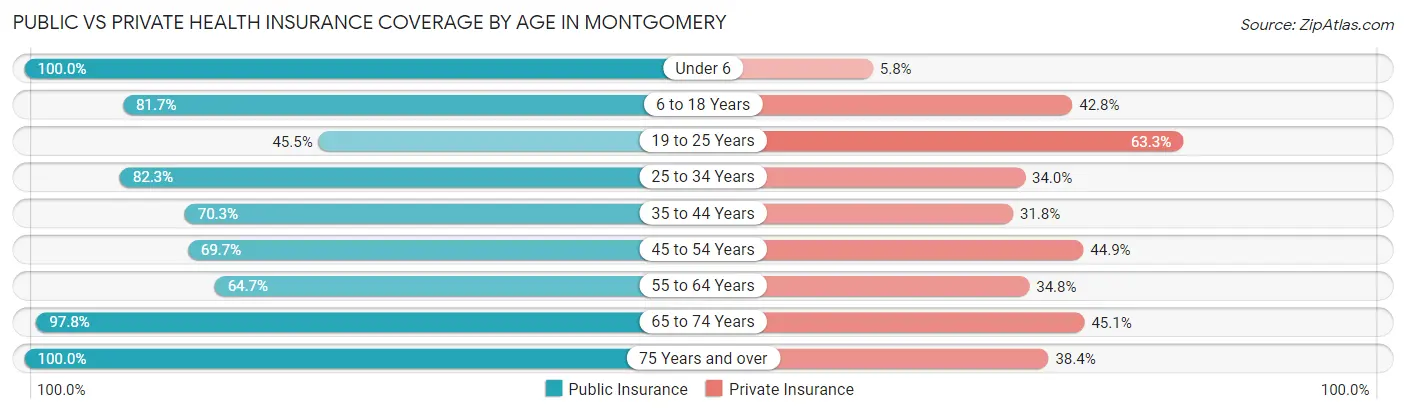
| Age Bracket | Public Insurance | Private Insurance |
| Under 6 | 156 (100.0%) | 9 (5.8%) |
| 6 to 18 Years | 170 (81.7%) | 89 (42.8%) |
| 19 to 25 Years | 145 (45.5%) | 202 (63.3%) |
| 25 to 34 Years | 121 (82.3%) | 50 (34.0%) |
| 35 to 44 Years | 137 (70.3%) | 62 (31.8%) |
| 45 to 54 Years | 115 (69.7%) | 74 (44.9%) |
| 55 to 64 Years | 132 (64.7%) | 71 (34.8%) |
| 65 to 74 Years | 178 (97.8%) | 82 (45.1%) |
| 75 Years and over | 86 (100.0%) | 33 (38.4%) |
| Total | 1,240 (74.6%) | 672 (40.4%) |
Disability Status by Sex by Age in Montgomery
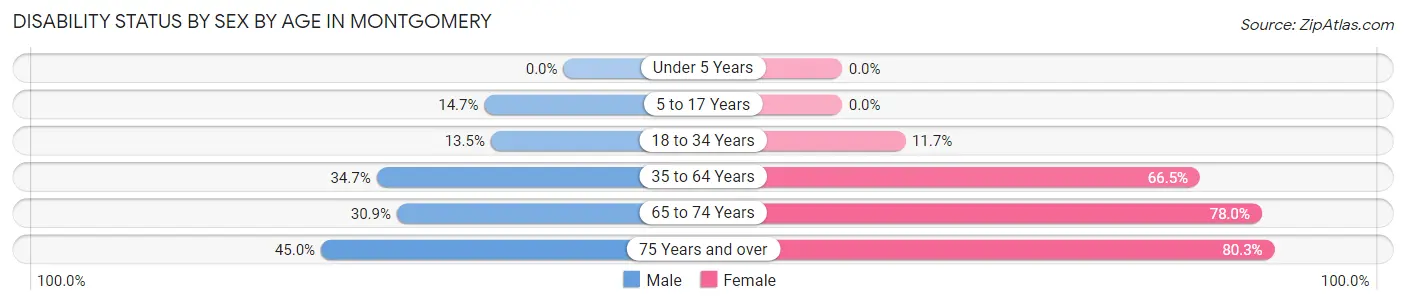
| Age Bracket | Male | Female |
| Under 5 Years | 0 (0.0%) | 0 (0.0%) |
| 5 to 17 Years | 11 (14.7%) | 0 (0.0%) |
| 18 to 34 Years | 24 (13.5%) | 38 (11.7%) |
| 35 to 64 Years | 85 (34.7%) | 212 (66.5%) |
| 65 to 74 Years | 17 (30.9%) | 99 (77.9%) |
| 75 Years and over | 9 (45.0%) | 53 (80.3%) |
Disability Class by Sex by Age in Montgomery
Disability Class: Hearing Difficulty
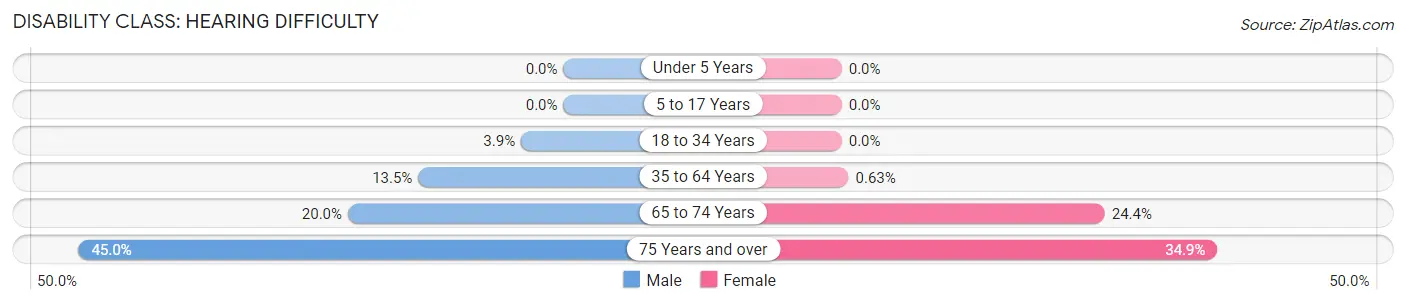
| Age Bracket | Male | Female |
| Under 5 Years | 0 (0.0%) | 0 (0.0%) |
| 5 to 17 Years | 0 (0.0%) | 0 (0.0%) |
| 18 to 34 Years | 7 (3.9%) | 0 (0.0%) |
| 35 to 64 Years | 33 (13.5%) | 2 (0.6%) |
| 65 to 74 Years | 11 (20.0%) | 31 (24.4%) |
| 75 Years and over | 9 (45.0%) | 23 (34.8%) |
Disability Class: Vision Difficulty
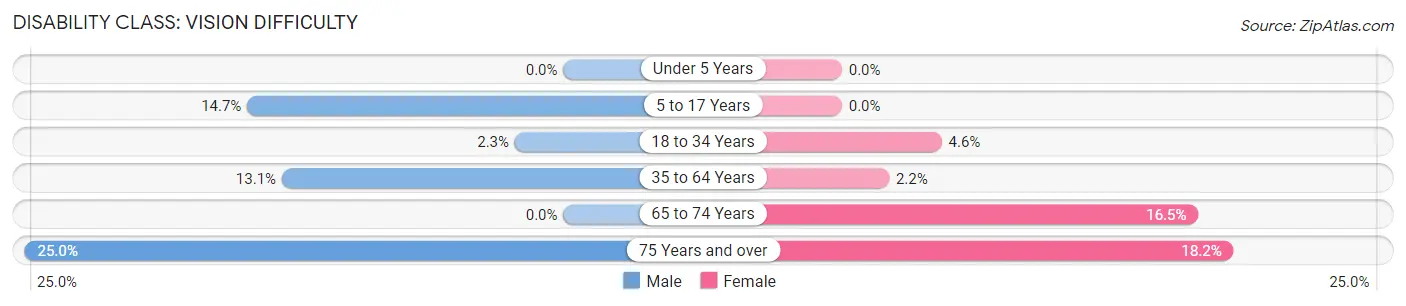
| Age Bracket | Male | Female |
| Under 5 Years | 0 (0.0%) | 0 (0.0%) |
| 5 to 17 Years | 11 (14.7%) | 0 (0.0%) |
| 18 to 34 Years | 4 (2.2%) | 15 (4.6%) |
| 35 to 64 Years | 32 (13.1%) | 7 (2.2%) |
| 65 to 74 Years | 0 (0.0%) | 21 (16.5%) |
| 75 Years and over | 5 (25.0%) | 12 (18.2%) |
Disability Class: Cognitive Difficulty
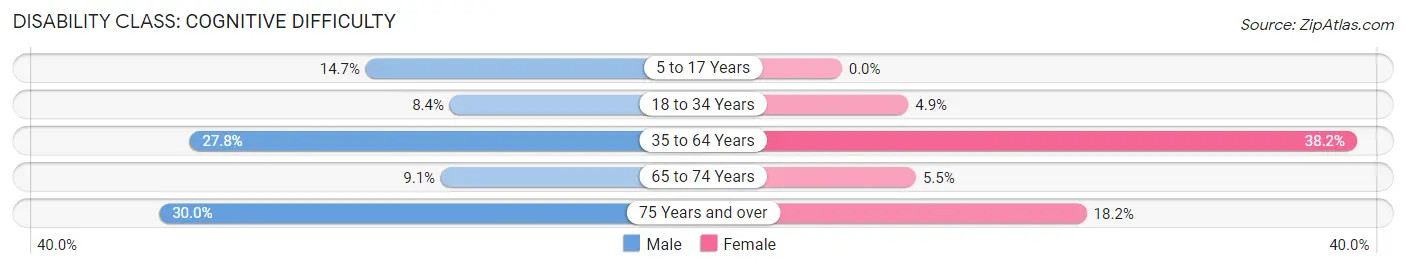
| Age Bracket | Male | Female |
| 5 to 17 Years | 11 (14.7%) | 0 (0.0%) |
| 18 to 34 Years | 15 (8.4%) | 16 (4.9%) |
| 35 to 64 Years | 68 (27.8%) | 122 (38.2%) |
| 65 to 74 Years | 5 (9.1%) | 7 (5.5%) |
| 75 Years and over | 6 (30.0%) | 12 (18.2%) |
Disability Class: Ambulatory Difficulty
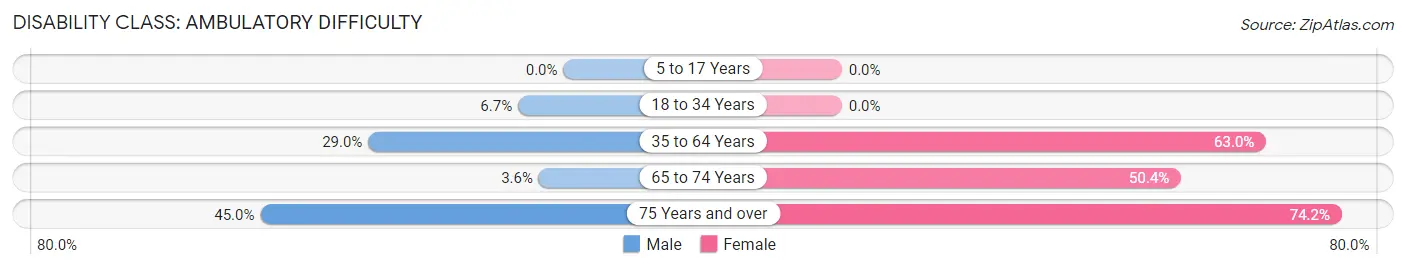
| Age Bracket | Male | Female |
| 5 to 17 Years | 0 (0.0%) | 0 (0.0%) |
| 18 to 34 Years | 12 (6.7%) | 0 (0.0%) |
| 35 to 64 Years | 71 (29.0%) | 201 (63.0%) |
| 65 to 74 Years | 2 (3.6%) | 64 (50.4%) |
| 75 Years and over | 9 (45.0%) | 49 (74.2%) |
Disability Class: Self-Care Difficulty
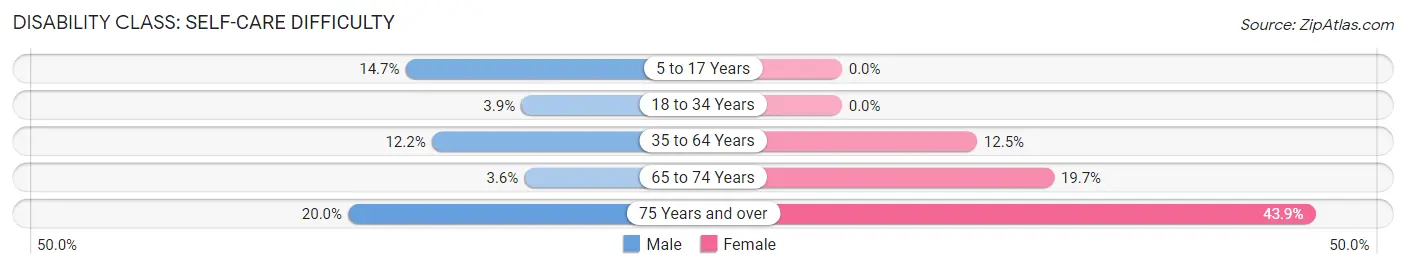
| Age Bracket | Male | Female |
| 5 to 17 Years | 11 (14.7%) | 0 (0.0%) |
| 18 to 34 Years | 7 (3.9%) | 0 (0.0%) |
| 35 to 64 Years | 30 (12.2%) | 40 (12.5%) |
| 65 to 74 Years | 2 (3.6%) | 25 (19.7%) |
| 75 Years and over | 4 (20.0%) | 29 (43.9%) |
Technology Access in Montgomery
Computing Device Access in Montgomery
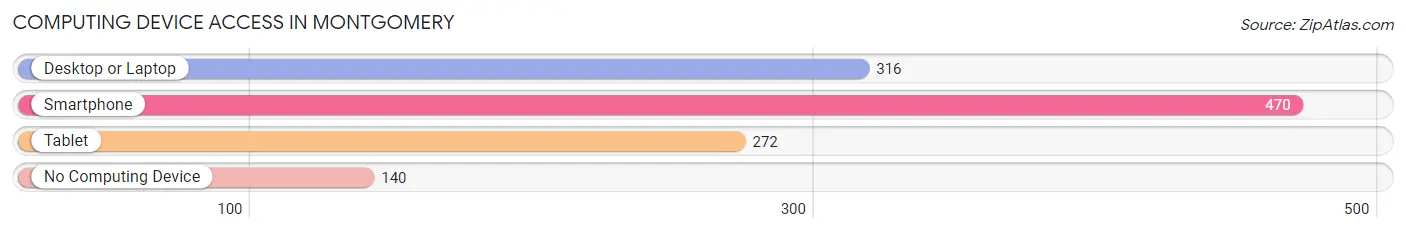
| Device Type | # Households | % Households |
| Desktop or Laptop | 316 | 48.6% |
| Smartphone | 470 | 72.3% |
| Tablet | 272 | 41.8% |
| No Computing Device | 140 | 21.5% |
| Total | 650 | 100.0% |
Internet Access in Montgomery
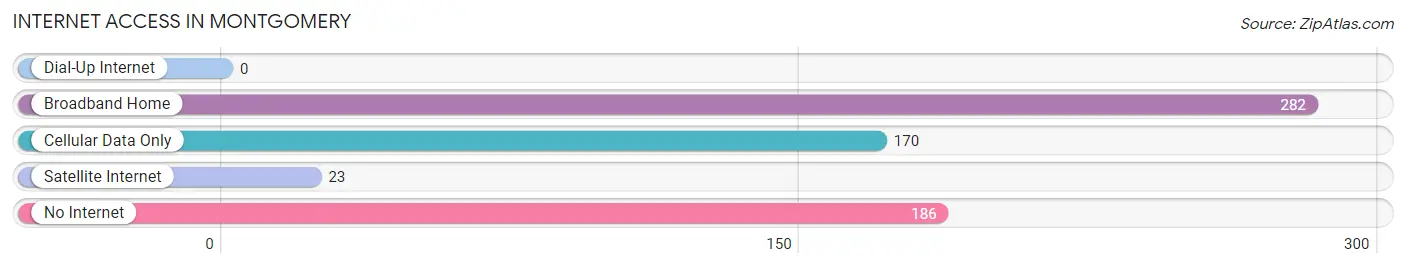
| Internet Type | # Households | % Households |
| Dial-Up Internet | 0 | 0.0% |
| Broadband Home | 282 | 43.4% |
| Cellular Data Only | 170 | 26.2% |
| Satellite Internet | 23 | 3.5% |
| No Internet | 186 | 28.6% |
| Total | 650 | 100.0% |
Montgomery Summary
Montgomery is a small town located in Fayette County, West Virginia. It is situated on the banks of the New River, and is part of the Beckley-Raleigh County Metropolitan Statistical Area. The town has a population of approximately 1,000 people, and is known for its rich history and culture.
Geography
Montgomery is located in the Appalachian Mountains of West Virginia, and is situated on the banks of the New River. The town is surrounded by the New River Gorge National Park, which is a popular destination for outdoor recreation. The town is also located near the cities of Beckley and Oak Hill, which are both located within a short drive of Montgomery.
The town is located at an elevation of 1,400 feet, and has a total area of 0.7 square miles. The town is located in a humid subtropical climate zone, and experiences hot summers and cold winters. The average annual temperature is around 54 degrees Fahrenheit, and the average annual precipitation is around 40 inches.
Economy
The economy of Montgomery is largely based on tourism and outdoor recreation. The town is home to several popular attractions, including the New River Gorge National Park, which is a popular destination for hiking, camping, and other outdoor activities. The town is also home to several restaurants, shops, and other businesses.
The town is also home to several coal mines, which provide employment for many of the town's residents. The coal industry has been a major part of the town's economy for many years, and is still an important part of the local economy.
Demographics
As of the 2010 census, the population of Montgomery was 1,000 people. The racial makeup of the town was 97.2% White, 0.7% African American, 0.3% Native American, 0.2% Asian, 0.1% Pacific Islander, and 1.5% from other races. The median household income was $30,000, and the median family income was $35,000.
The town is home to several churches, including the First Baptist Church of Montgomery, which is the oldest church in the town. The town is also home to several schools, including Montgomery High School, which is the only public high school in the town.
Conclusion
Montgomery is a small town located in Fayette County, West Virginia. The town has a population of approximately 1,000 people, and is known for its rich history and culture. The town is surrounded by the New River Gorge National Park, which is a popular destination for outdoor recreation. The economy of Montgomery is largely based on tourism and outdoor recreation, and the town is also home to several coal mines. The racial makeup of the town is 97.2% White, 0.7% African American, 0.3% Native American, 0.2% Asian, 0.1% Pacific Islander, and 1.5% from other races. The town is home to several churches and schools, and is an important part of the local economy.
Common Questions
What is Per Capita Income in Montgomery?
Per Capita income in Montgomery is $17,841.
What is the Median Family Income in Montgomery?
Median Family Income in Montgomery is $38,393.
What is the Median Household income in Montgomery?
Median Household Income in Montgomery is $27,174.
What is Income or Wage Gap in Montgomery?
Income or Wage Gap in Montgomery is 37.3%.
Women in Montgomery earn 62.7 cents for every dollar earned by a man.
What is Family Income Deficit in Montgomery?
Family Income Deficit in Montgomery is $17,364.
Families that are below poverty line in Montgomery earn $17,364 less on average than the poverty threshold level.
What is Inequality or Gini Index in Montgomery?
Inequality or Gini Index in Montgomery is 0.52.
What is the Total Population of Montgomery?
Total Population of Montgomery is 1,706.
What is the Total Male Population of Montgomery?
Total Male Population of Montgomery is 656.
What is the Total Female Population of Montgomery?
Total Female Population of Montgomery is 1,050.
What is the Ratio of Males per 100 Females in Montgomery?
There are 62.48 Males per 100 Females in Montgomery.
What is the Ratio of Females per 100 Males in Montgomery?
There are 160.06 Females per 100 Males in Montgomery.
What is the Median Population Age in Montgomery?
Median Population Age in Montgomery is 38.9 Years.
What is the Average Family Size in Montgomery
Average Family Size in Montgomery is 3.6 People.
What is the Average Household Size in Montgomery
Average Household Size in Montgomery is 2.3 People.
How Large is the Labor Force in Montgomery?
There are 582 People in the Labor Forcein in Montgomery.
What is the Percentage of People in the Labor Force in Montgomery?
42.2% of People are in the Labor Force in Montgomery.
What is the Unemployment Rate in Montgomery?
Unemployment Rate in Montgomery is 8.3%.